Article

Carboniferous Shale Gas Accumulation Characteristics and Exploration Directions in South China

1
School of Energy Resources, China University of Geosciences (Beijing), Beijing 100083, China
2
Oil and Gas Resources Survey, China Geological Survey, Beijing 100083, China
3
The Key Laboratory of Unconventional Oil and Gas Geology, China Geological Survey, Beijing 100083, China
4
Guizhou Shale Gas Exploration and Development Co., Ltd., Zunyi 563499, China
5
Institute of Geomechanics, Chinese Academy of Geological Sciences, Beijing 100081, China
*
Authors to whom correspondence should be addressed.
Processes 2023, 11(7), 1896; https://doi.org/10.3390/pr11071896
Submission received: 6 May 2023 / Revised: 7 June 2023 / Accepted: 13 June 2023 / Published: 24 June 2023

Abstract

:
China has focused on the exploration and development of shale gas resources to reduce its reliance on coal and shift to cleaner energy sources. While significant progress has been made in the Sichuan Basin, unlocking the shale gas potential in other regions of South China has proven challenging due to the complex geology and mountainous terrain. In 2021, Well QSD-1 was deployed in southwestern Guizhou and achieved a daily shale gas flow of 11,011 m3 in the Dawuba Formation, marking the first time an industrial gas flow had been obtained from shale gas drilling in the marine strata of the Upper Paleozoic in China. This breakthrough has deepened the understanding of the southern China Carboniferous marine strata and highlighted key aspects of the formation: (1) Sedimentation occurred in alternating platforms and basins, with most organic-rich shale developed in sloping and basin areas; (2) the formation exhibits favorable static indicators, with a relatively thick section (over 200 m), and an organic carbon content of approximately 1%; (3) the intercalation of argillaceous limestone and shale intervals is conducive to the preservation of shale gas within the formation. These results demonstrate the potential for the Upper Paleozoic in South China to become a significant shale gas producer, which could contribute significantly to China’s energy security. Furthermore, exploring shale gas in the region may have positive economic and environmental impacts, including reducing China’s dependence on coal and decreasing greenhouse gas emissions.

1. Introduction

Carboniferous shale gas has become one of the most promising unconventional natural gas resources in the world, particularly in North America where huge reserves have been discovered [1,2,3]. The abundant resources and the advancement of exploration and production technology have resulted in a significant increase in shale gas production. The strata in North America are primarily composed of interbedded shale, sandstone, and limestone, with shale thickness usually ranging from 30 to 150 m. The high organic content and thermal maturity of the shale make it a suitable host rock for natural gas, especially in the Marcellus and Utica formations in the Appalachian Basin.
In recent years, China has placed a significant emphasis on exploring and developing shale gas resources, with notable progress made in the Sichuan Basin. However, unlocking the potential of shale gas in other regions, particularly the Carboniferous in South China, has been challenging [4,5,6]. One of the primary challenges is the complex geological conditions, which can make it difficult to locate and extract shale gas accurately. Additionally, the formation is situated in a mountainous region, which adds to the logistical challenges of exploring and developing shale gas resources.
Since 2014, the Oil and Gas Resources Survey Center of the China Geological Survey has been working in South China to advance geological knowledge and engineering technologies, with an emphasis on discovering Paleozoic shale gas [7,8,9].
The Yadu-Ziyun-Luodian aulacogen (YZLA) was identified as a priority location for investigation through a thorough analysis of prior data [10,11,12,13,14,15]. Field surveys, seismic exploration, and electromagnetic prospecting were conducted in the YZLA, which resulted in the discovery of the Liupanshui area as a promising shale gas area [11,12,13]. The Carboniferous Dawuba Formation shale’s gas content was investigated by drilling the QSD-1 well, which turned up approximately a thousand meters of high-quality shale with 53 interpreted as gas-bearing strata [14,15]. At various depths throughout the drilling process, shale gas was discovered, and all can be ignited. With an average daily production of 11,011 m3 of shale gas in 2021, a vertical well formation gas content test made a notable discovery in South China’s Carboniferous shale gas [16].
Although shale gas in South China’s Carboniferous Dawuba Formation has recently been discovered, total Paleozoic oil and gas exploration in the area is still at a low level [17,18,19,20,21]. Analyzing the importance of the QSD-1 breakthrough and comprehending the shale gas accumulation circumstances in the YZLA are imperative if we are to expedite the exploration of Carboniferous shale gas. In order to gain important insights into the geological study of shale gas in South China, this research investigates the characteristics of shale reservoirs and the conditions of well QSD-1’s shale gas accumulation.

2. Geological Setting

In the southeastern region of the Upper Yangtze Plate in South China, there exists a slim and highly deformed structural belt that extends along the Yadu, Ziyun, and Luodian line in Guizhou Province, following a northwest–southeast orientation [22,23,24,25]. This belt is a large-scale, intracontinental reverse fault and strike-slip structural belt that evolved gradually and eventually took shape during the Yanshanian Orogeny. It differs significantly from the deformation zones on either side in terms of deformation direction, style, and intensity (Figure 1). In the Late Paleozoic, this structural belt developed into a NW-trending aulacogen, known as the Yadu-Ziyun-Luodian aulacogen [26,27]. The aulacogen spans the Sinian to Silurian, Devonian to Middle Triassic, Upper Triassic to Cretaceous, and Tertiary to Quaternary periods in its extensive stratigraphic succession.
During its formation and evolution, the Yadu-Ziyun-Luodian fault zone has undergone complex tectonic changes. Seawater from the Yuebei Uplift invaded during the late Early Devonian period from the southeast, resulting in the formation of an early platform-basin separation [28]. An NW-trending sub-deepwater basin formed on the foundation of the shallow water continental shelf, where the uneven subsidence of fault blocks led to the deposition of shallow water carbonate on high fault blocks and deep-water carbon mud and siliceous on low fault blocks (Figure 1c). In the slope zone along the platform edge, deposits slumped and gravity flowed. In the early Late Devonian, regional transgression reached its maximum extent, and the aulacogen extended to its largest range, reaching from Zhaotong in Yunnan Province to Weining and Ziyun in Guizhou Province, and then fanning southeastward to Liucheng and Luzhai in Guangxi Province, forming an NW-trending, approximately 400-km-long trough-platform pattern with shallow water carbonate platforms isolated within deep waters [29].
During the Early Carboniferous, the NW boundary of the rift trough gradually filled and shallowed, causing the aulacogen to move southeastward towards the Weining and Liupanshui areas in Guizhou Province. In the Late Carboniferous, extensive deposition caused significant changes in the basin landscape [30], with the aulacogen being filled by extensive deposition and the aulacogen continuing to shrink southeastward. The sub-deepwater basins filled up, reducing the difference between them and the surrounding water bodies, and shallow water areas expanded. Under the continuous influence of faulting, a NE-trending sub-basin developed in Qinglong and Ziyun, approximately 120 km long and 50 km wide.
After the Dongwu Movement, the shallow and deep-water areas in the basin once again became mutually enveloping as the Qinfang Seaway, which had long been in a deep-water environment, folded into mountains. The range of the platform-basin facies changed significantly, and the aulacogen shrank south of the Guanling-Zhenxiong line. By the Triassic, the Yuebei and Yangtze blocks collided, and the stress direction within the aulacogen began to change. The Paleo-Tethys subducted to the north and east, causing intense subsidence within the aulacogen, and by the end of the Late Triassic, seawater completely withdrew, the basin closed, and the aulacogen was uplifted to form a landmass [31,32,33,34,35]. An NW-trending fold-fault belt formed along the structural line. During the Yanshanian to Himalayan period, strong intracontinental compression from south to north resulted in intense folding and uplift in the aulacogen, ultimately forming the present-day topographic features.

3. Samples and Experimental Methods

3.1. Samples

The well QSD-1 encountered a total of 1009 m of the Lower Carboniferous Dawuba Formation (Figure 1d). This formation is composed of different types of sedimentary rocks including shale, mudstone, and limestone [36,37]. This set of strata is sandwiched by the limestone strata of the Nandan Formation and the Muhua Formation. Based on the lithology, electrical properties, and outcrop conditions in the Liupanshui area, the Dawuba Formation can be divided into four members [38,39].
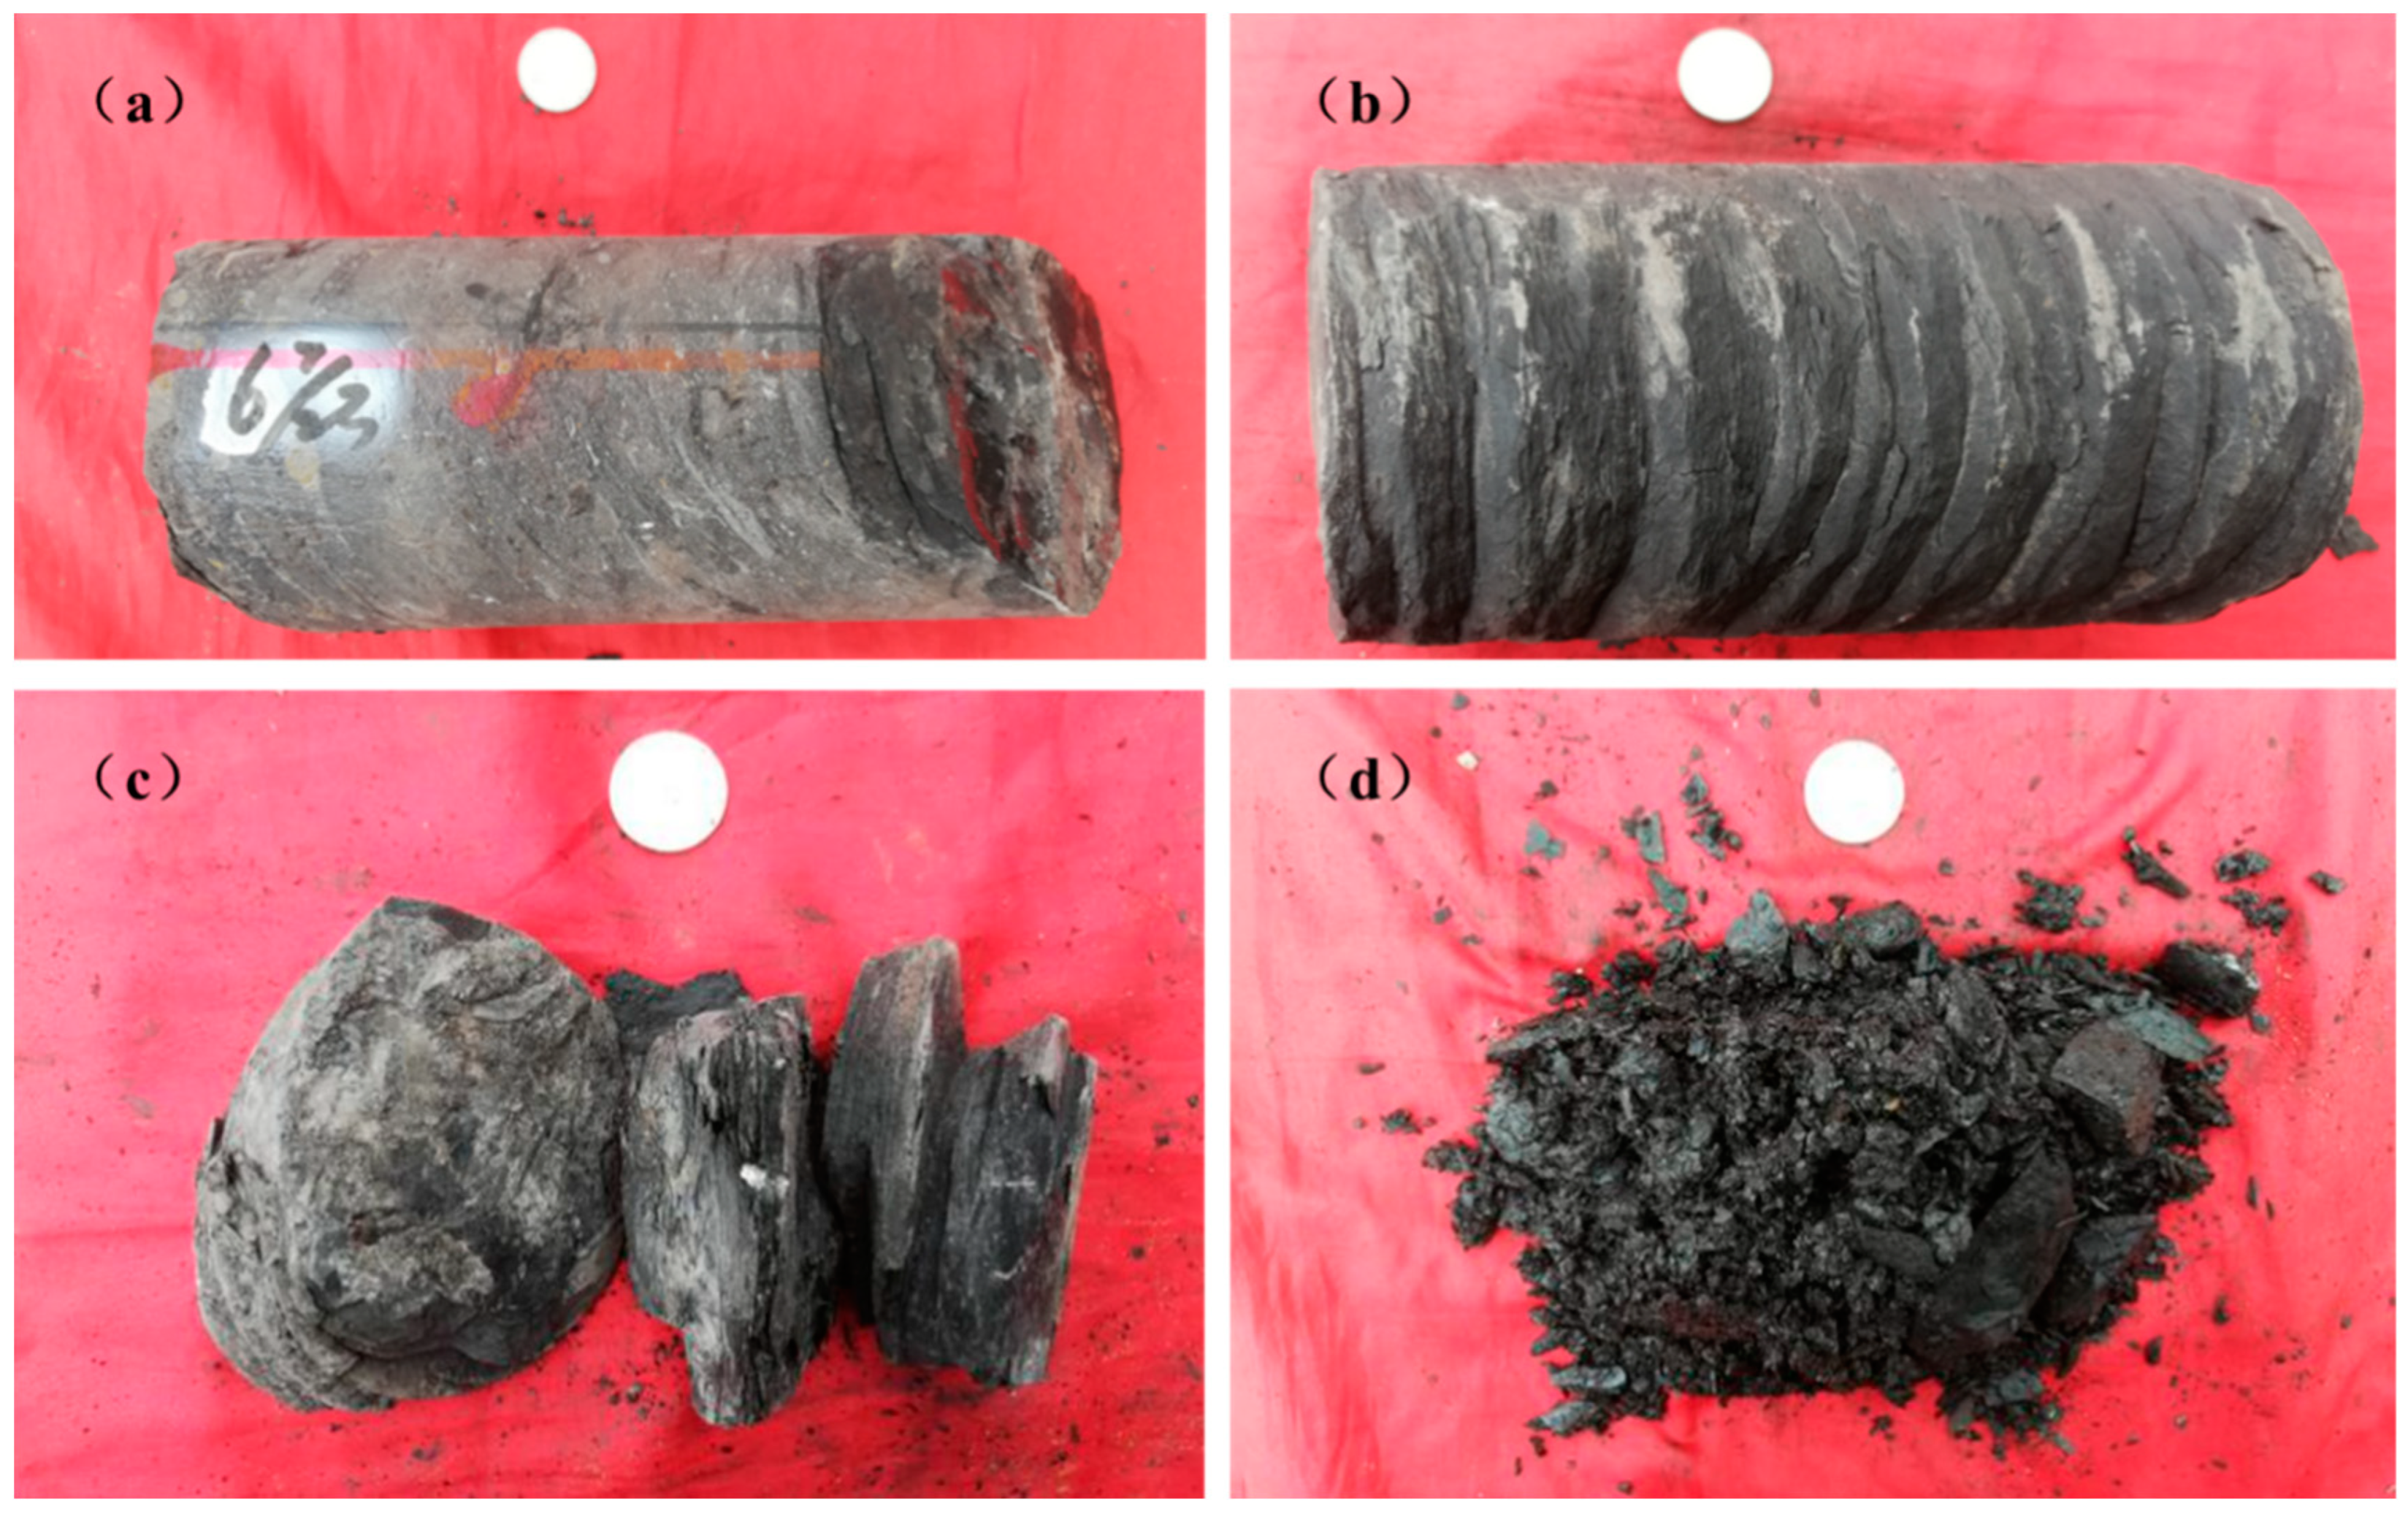
The fourth member of Dawuba Formation measures 66 m in thickness in well QSD-1 and is composed of mudstone interbedded with carbonaceous shale and argillaceous mudstone (Figure 2a). The third member, on the other hand, has a thickness of 288 m and is characterized by argillaceous shale, mudstone, and mudstone interbedded with carbonaceous mudstone (Figure 2b). The second member, measuring 122 m in thickness, features thin interbedded mudstone and shale within the mudstone (Figure 2c). The first member has a thickness of 533 m, dominated by thick layers of mudstone (Figure 2d).

3.2. Mineral Composition Analysis

X-ray diffraction analysis is currently a simple and efficient experimental method for identifying, analyzing, and quantifying the mineral composition characteristics of shale. To ensure the objectivity and reliability of the data analysis for the Dawuba Formation, 16 shale samples were selected from different members for the analysis, including 3 samples from the fourth member, 6 samples from the third member, 4 samples from the second member, and 3 samples from the first member. During the experiment, the shale samples were ground to a 200-mesh size and then dried under 110 °C conditions. The glass slides were cleaned with alcohol to remove any impurities that could potentially interfere with the test results. X-ray diffraction measurements were conducted using the BTX-II portable X-ray diffractometer from Olympus (Tokyo, Japan), which is equipped with a Co target and operated at a voltage of 31 kV and a current of 0.4 mA. The diffraction angle (2θ) measurement range was 3–55°, with a scanning interval of 0.02° (2θ). The data were analyzed using the MDI JADE software 6.5.

3.3. Geochemical Characteristics Analysis

To determine the total organic carbon content (TOC), 50–80 mg of prepared powder samples were weighed and placed in a permeable crucible. An excess volume ratio of 15% HCL was slowly added and left to stand for over 24 h to remove carbonate minerals. The crucible was washed repeatedly with distilled water until the sample’s PH became neutral, then dried in a constant temperature drying oven at 80 °C for future use. Total organic carbon analysis was performed using a Leco TOC (CS-230 HC) analyzer (Leco Corporation, St. Joseph, MI, USA) and the TOC value of the sample was calculated based on the CO2 peak area generated during combustion.
Before measuring the reflectance (Ro) of vitrinite, equipment calibration was conducted using two standard samples with known reflectance values. Separated and purified macerals were ground into slides and observed via a microscope equipped with an oil immersion lens and a fully automated microphotometer (Leica MPV Compact II reflection light microscope- Leica Microsystems GmbH, Wetzlar, Germany). Ro values reflected the thermal maturity of Dawuba Formation shale samples, with each Ro value representing the average of 20–30 measurement points.

3.4. Pore Microstructure Observation

The pores present within the Dawuba Formation shale were visualized using an electronic scanning microscope. Prior to observation, each sample underwent a 48-h polishing process with an acceleration voltage of 3 kV, resulting in a flatter surface. To enhance conductivity, as well as improve image clarity and accuracy, a thin layer of gold was applied to the surface of the sample following argon ion polishing. The microscopic structure of the samples was examined using the ZEISS Sigma300 (Oberkochen, Germany) scanning electron microscope and Bruker Quantax 200G (Berlin, Germany) energy spectrometer. During observation, the instrument operated at a voltage of 1.5 kV, a working distance of 2.5–8 mm, and a maximum resolution of 5 nm for images.

3.5. Full Pore Size Characterization

In accordance with the pore size classification standards established by the International Union of Pure and Applied Chemistry (IUPAC) in 1994, micropores have diameters less than 2 nm, mesopores range from 2–50 nm, and macropores larger than 50 nm [40]. To provide a full characterization of shale pore sizes, this study employed multiple testing methods, including CO2 adsorption, N2 adsorption, and high-pressure mercury injection experiments, taking into account the advantages of each method for different pore size ranges.
CO2 adsorption experiments were conducted using a NOVA4200e surface area and pore size distribution analyzer manufactured by Quantachrome Instruments (Boynton Beach, FL, USA). Samples were ground to 60–80 mesh and then subjected to CO2 blowing under heating conditions for 4–6 h. Once the sample mass remained constant, indicating the removal of gas adsorbed on the sample surface, the degassing process was considered complete. CO2 was then used as the adsorbate to measure the adsorption and desorption at different relative pressures at 273.15 K, and micropore distribution was calculated through the DFT theoretical model [41].
N2 adsorption experiments were executed using an ASAP2460 automatic surface area and pore size analyzer produced by Micromeritics Instrument Corporation (Norcross, GA, USA), possessing a relative pressure range of 0.00–0.995 and capable of measuring pore sizes ranging from 0.35–400 nm with a minimum measurable specific surface area of 0.0005 m2/g. Samples were ground to 20–50 mesh before undergoing nitrogen blowing under heating conditions for 4–6 h using nitrogen with a purity greater than 99.999%. Once the sample mass became stable, nitrogen was utilized as the adsorbate to measure the adsorption and desorption at various relative pressures at 77.35 K [42]. The specific surface area was calculated via the Brunauer–Emmett–Teller (BET) equation, while the pore volume was determined using the Barrett–Joyner–Halenda (BJH) equation.
High-pressure mercury injection experiments were carried out utilizing an AutoPore-S9500 automated mercury porosimeter (Micromeritics Instrument Corporation, Georgia, USA) with a maximum working pressure of 400 MPa, capable of measuring pore sizes ranging from 0.003–1000 μm and a volumetric accuracy of 0.1 mL for mercury intrusion. Prior to testing, cylindrical samples were dried in a 150 °C oven for 1 h to eliminate moisture within the sample. Then, under vacuum conditions, mercury was injected into the sample to determine the amount of mercury intrusion and extrusion in low- and high-pressure conditions [43]. The Young–Dupre equation was utilized to calculate specific surface area, while the Washburn equation was used to determine pore volume.

3.6. Gas Content Analysis

Gas content is composed of three parts: Lost gas, desorbed gas, and residual gas. To accurately determine the desorbed gas content of a rock sample, gas content analysis experiments are performed. After extracting the core from underground, it is immediately placed in a sealed steel cylinder filled with saturated saltwater to remove as much air as possible and avoid interfering with the results. The steel cylinder is then placed in an adjustable temperature heating box, and as the temperature gradually increases, the gas in the core is released and collected through the water vapor displacement method. The resulting gas content is the desorbed gas content, which is accurately recorded. After no more gas is produced, the sample is weighed and mechanically crushed in closed equipment to obtain the residual gas content. The lost gas content can be calculated via regression analysis using the analytical gas content, residual gas content, and the time used for drilling and exposing the core to the surface.

4. Results

4.1. Mineral Composition Characteristics

XRD analysis showed that the Dawuba Formation predominantly consists of high levels of carbonate and clay minerals, with minimal pyrite content. The carbonate mineral content ranged from 4–93%, averaging 53%, while the clay mineral content ranged from 5–82%, averaging 33% (Figure 3a). Quartz mineral content was present within the range of 4–27%, with an average of 11%. The main clay minerals found in the formation were an illite and illite/smectite mixed layer, while chlorite and kaolinite were present in small amounts. Illite content ranged from 5–70% with an average of 43.56%, while illite/smectite mixed layer ranged from 13–82%, with an average of 26.43%. Chlorite content ranged from 5–47% with an average of 17.71%, while kaolinite content ranged from 0.5–23%, averaging 11.78% (Figure 3b).
In terms of the four members, there is a gradual decrease in average carbonate mineral content from 86% to 4%, while clay mineral content increases from 6% to 69% from the fourth member to the first member. The fourth and third members have similar features, with an average carbonate rock content of 86% and 73%, and an average clay mineral content of 6% and 15%. Conversely, the second and first members exhibit strong similarities, with a low carbonate mineral content and high clay mineral content.

4.2. Organic Geochemical Characteristics

The results of testing 51 shale samples from the Dawuba Formation showed a variation range of 0.25–1.42% in total organic carbon (Figure 4a). Among these, 34 samples had TOC values distributed between 0.5 and 1.5%, accounting for 67% of the total samples. The remaining 17 samples had TOC values ranging from 0–0.5%, making up 33% of the total samples. None of the samples had a TOC value greater than 1.5%. The fourth member had the lowest TOC, averaging 0.39%. From the third member to the first member, the average TOC value gradually increases, reaching an average TOC value of 1.14% in the Dawuba Formation.
The Ro distribution range of the Dawuba Formation is between 1.92 and 2.57% (17 samples). The reflectance values increased from the fourth member to the first member, with the average Ro values being 1.92% for the fourth member, 2.18% for the third member, 2.29% for the second member, and 2.57% for the first member (Figure 4b). These results suggest that shale samples from the Dawuba Formation are in the stage of gas generation.
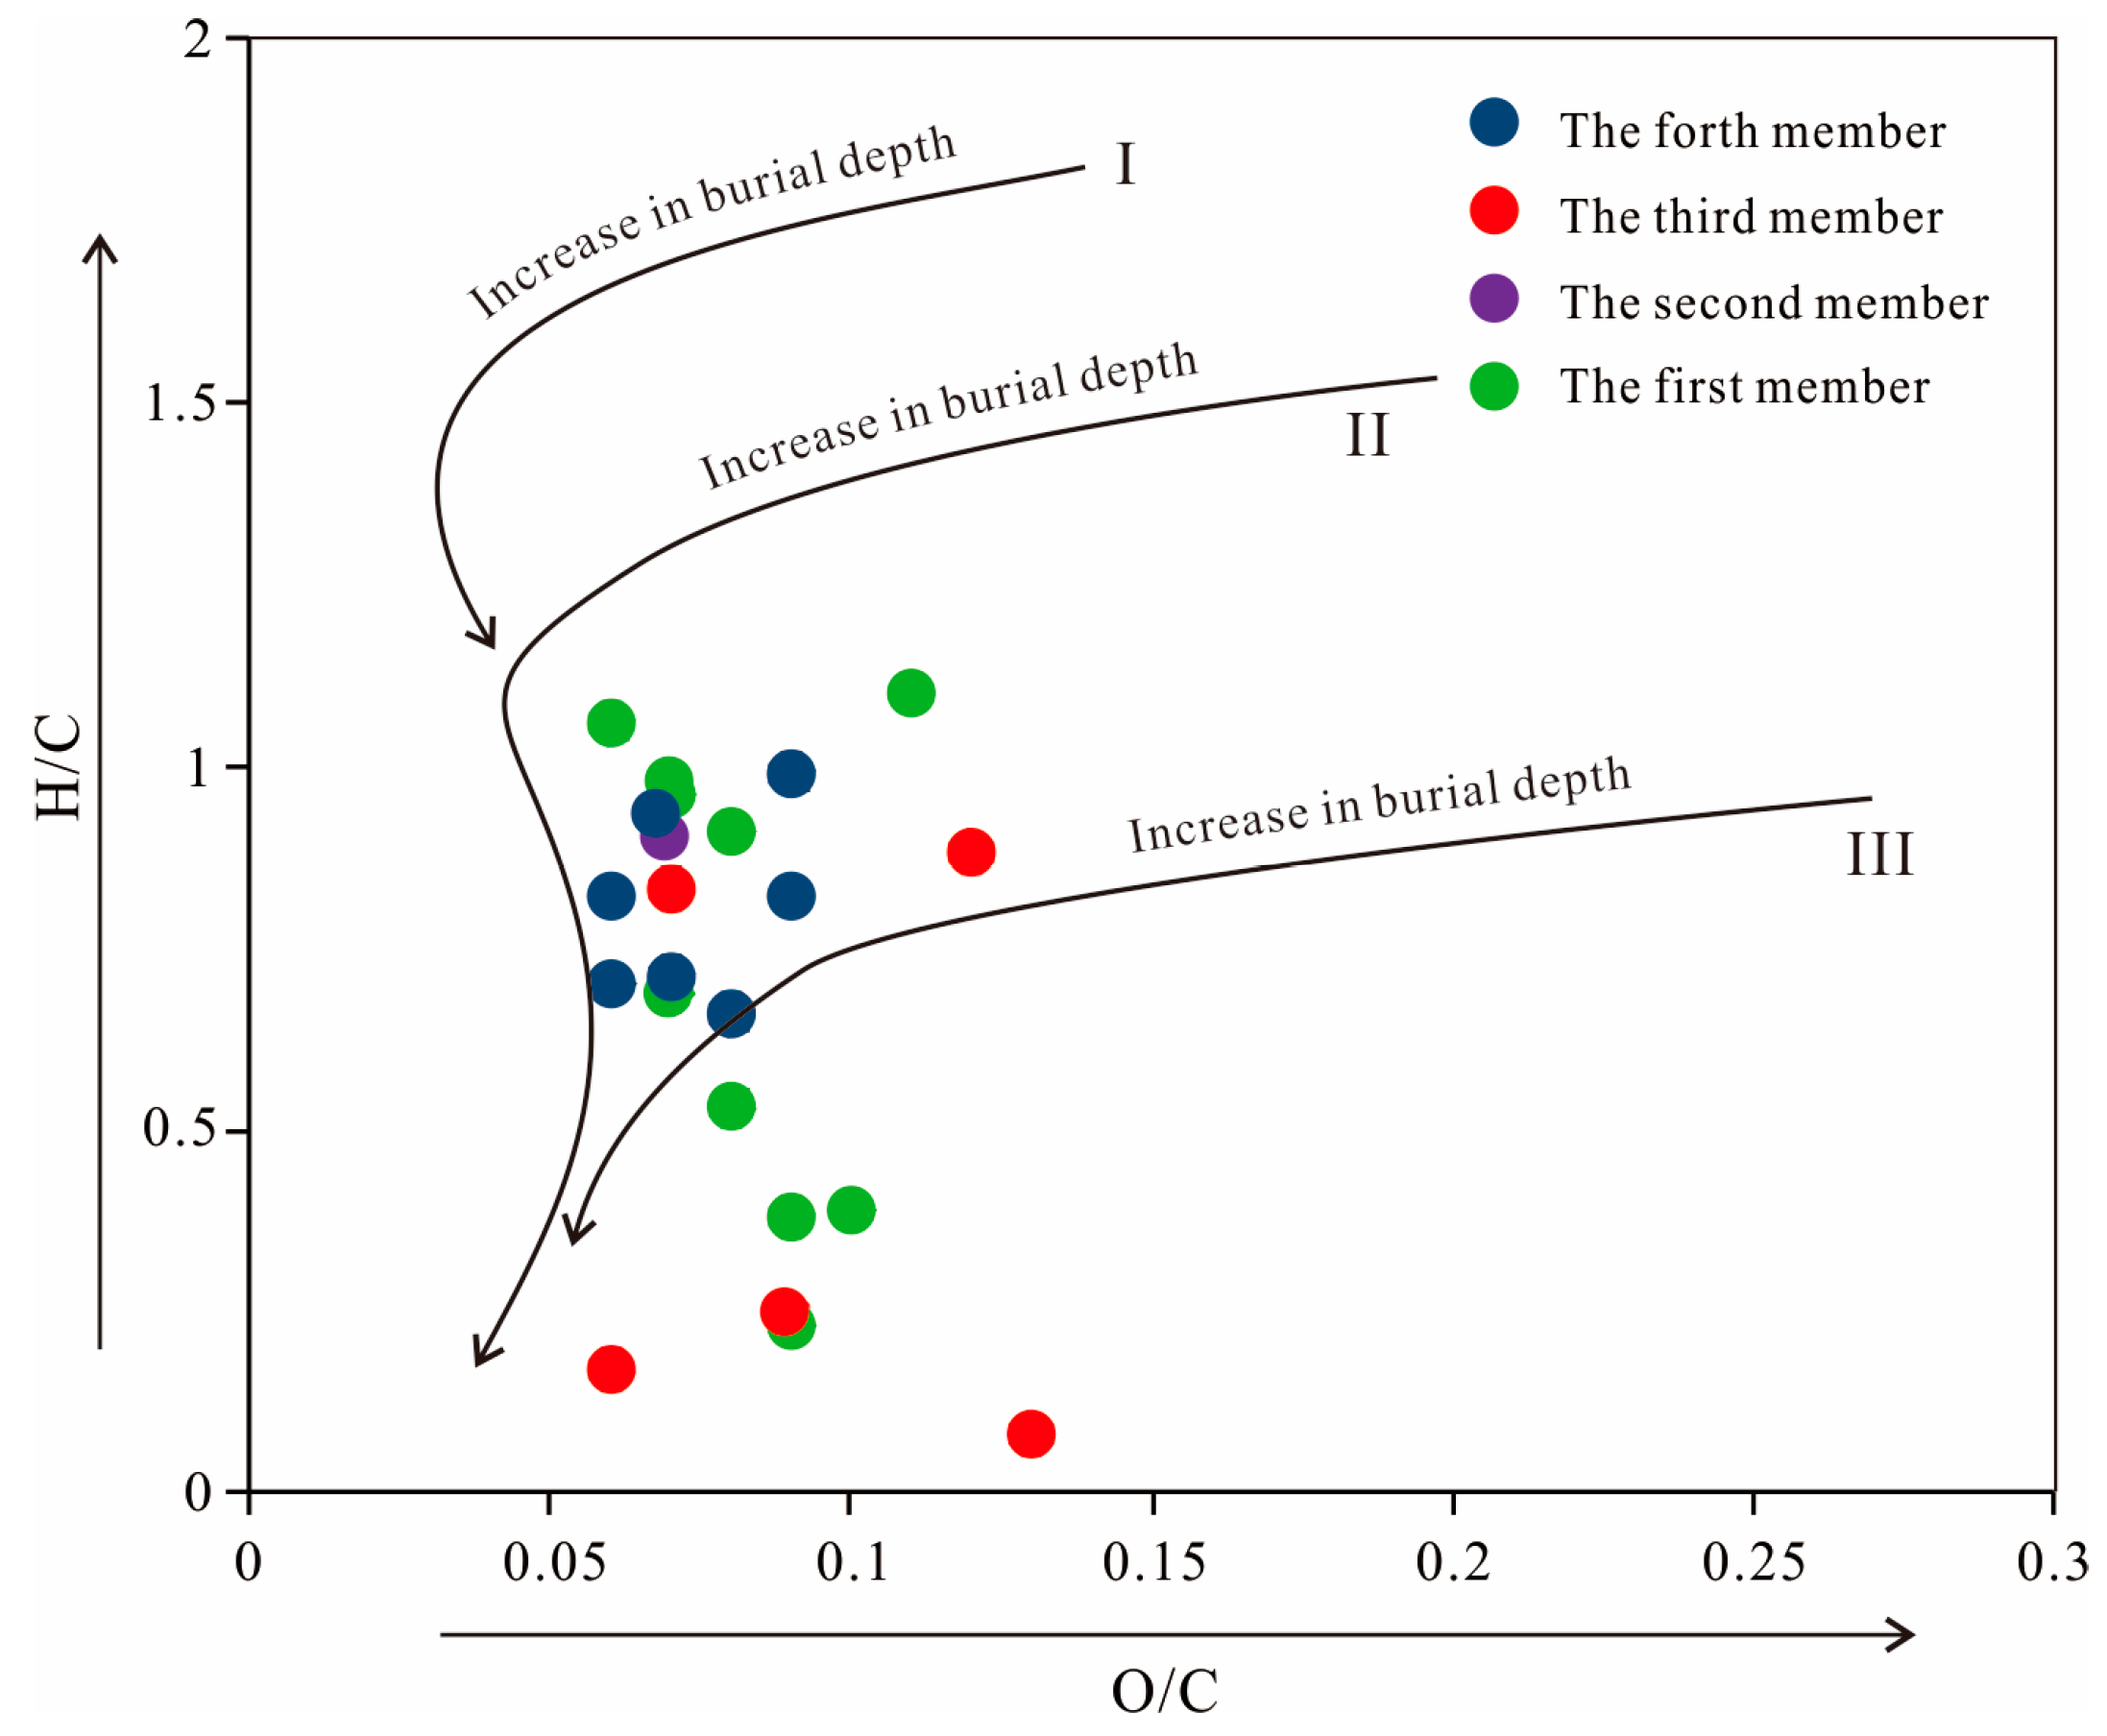
Shale samples were also used for organic matter maceral composition analysis, with most samples containing type II-III organic matter. Sapropelinite and vitrinite were the main macerals identified [44], while the inertinite accounted for a certain proportion of unidentifiable debris or fragments, showing a moderate hydrocarbon generation potential (Table 1). The same conclusion can be drawn from the analysis of H/C and O/C ratios (Figure 5), which shows that the kerogen types in the Dawuba Formation shale are more inclined towards the II and III types that originated from biogenic processes [45].

4.3. Characterization of Pores

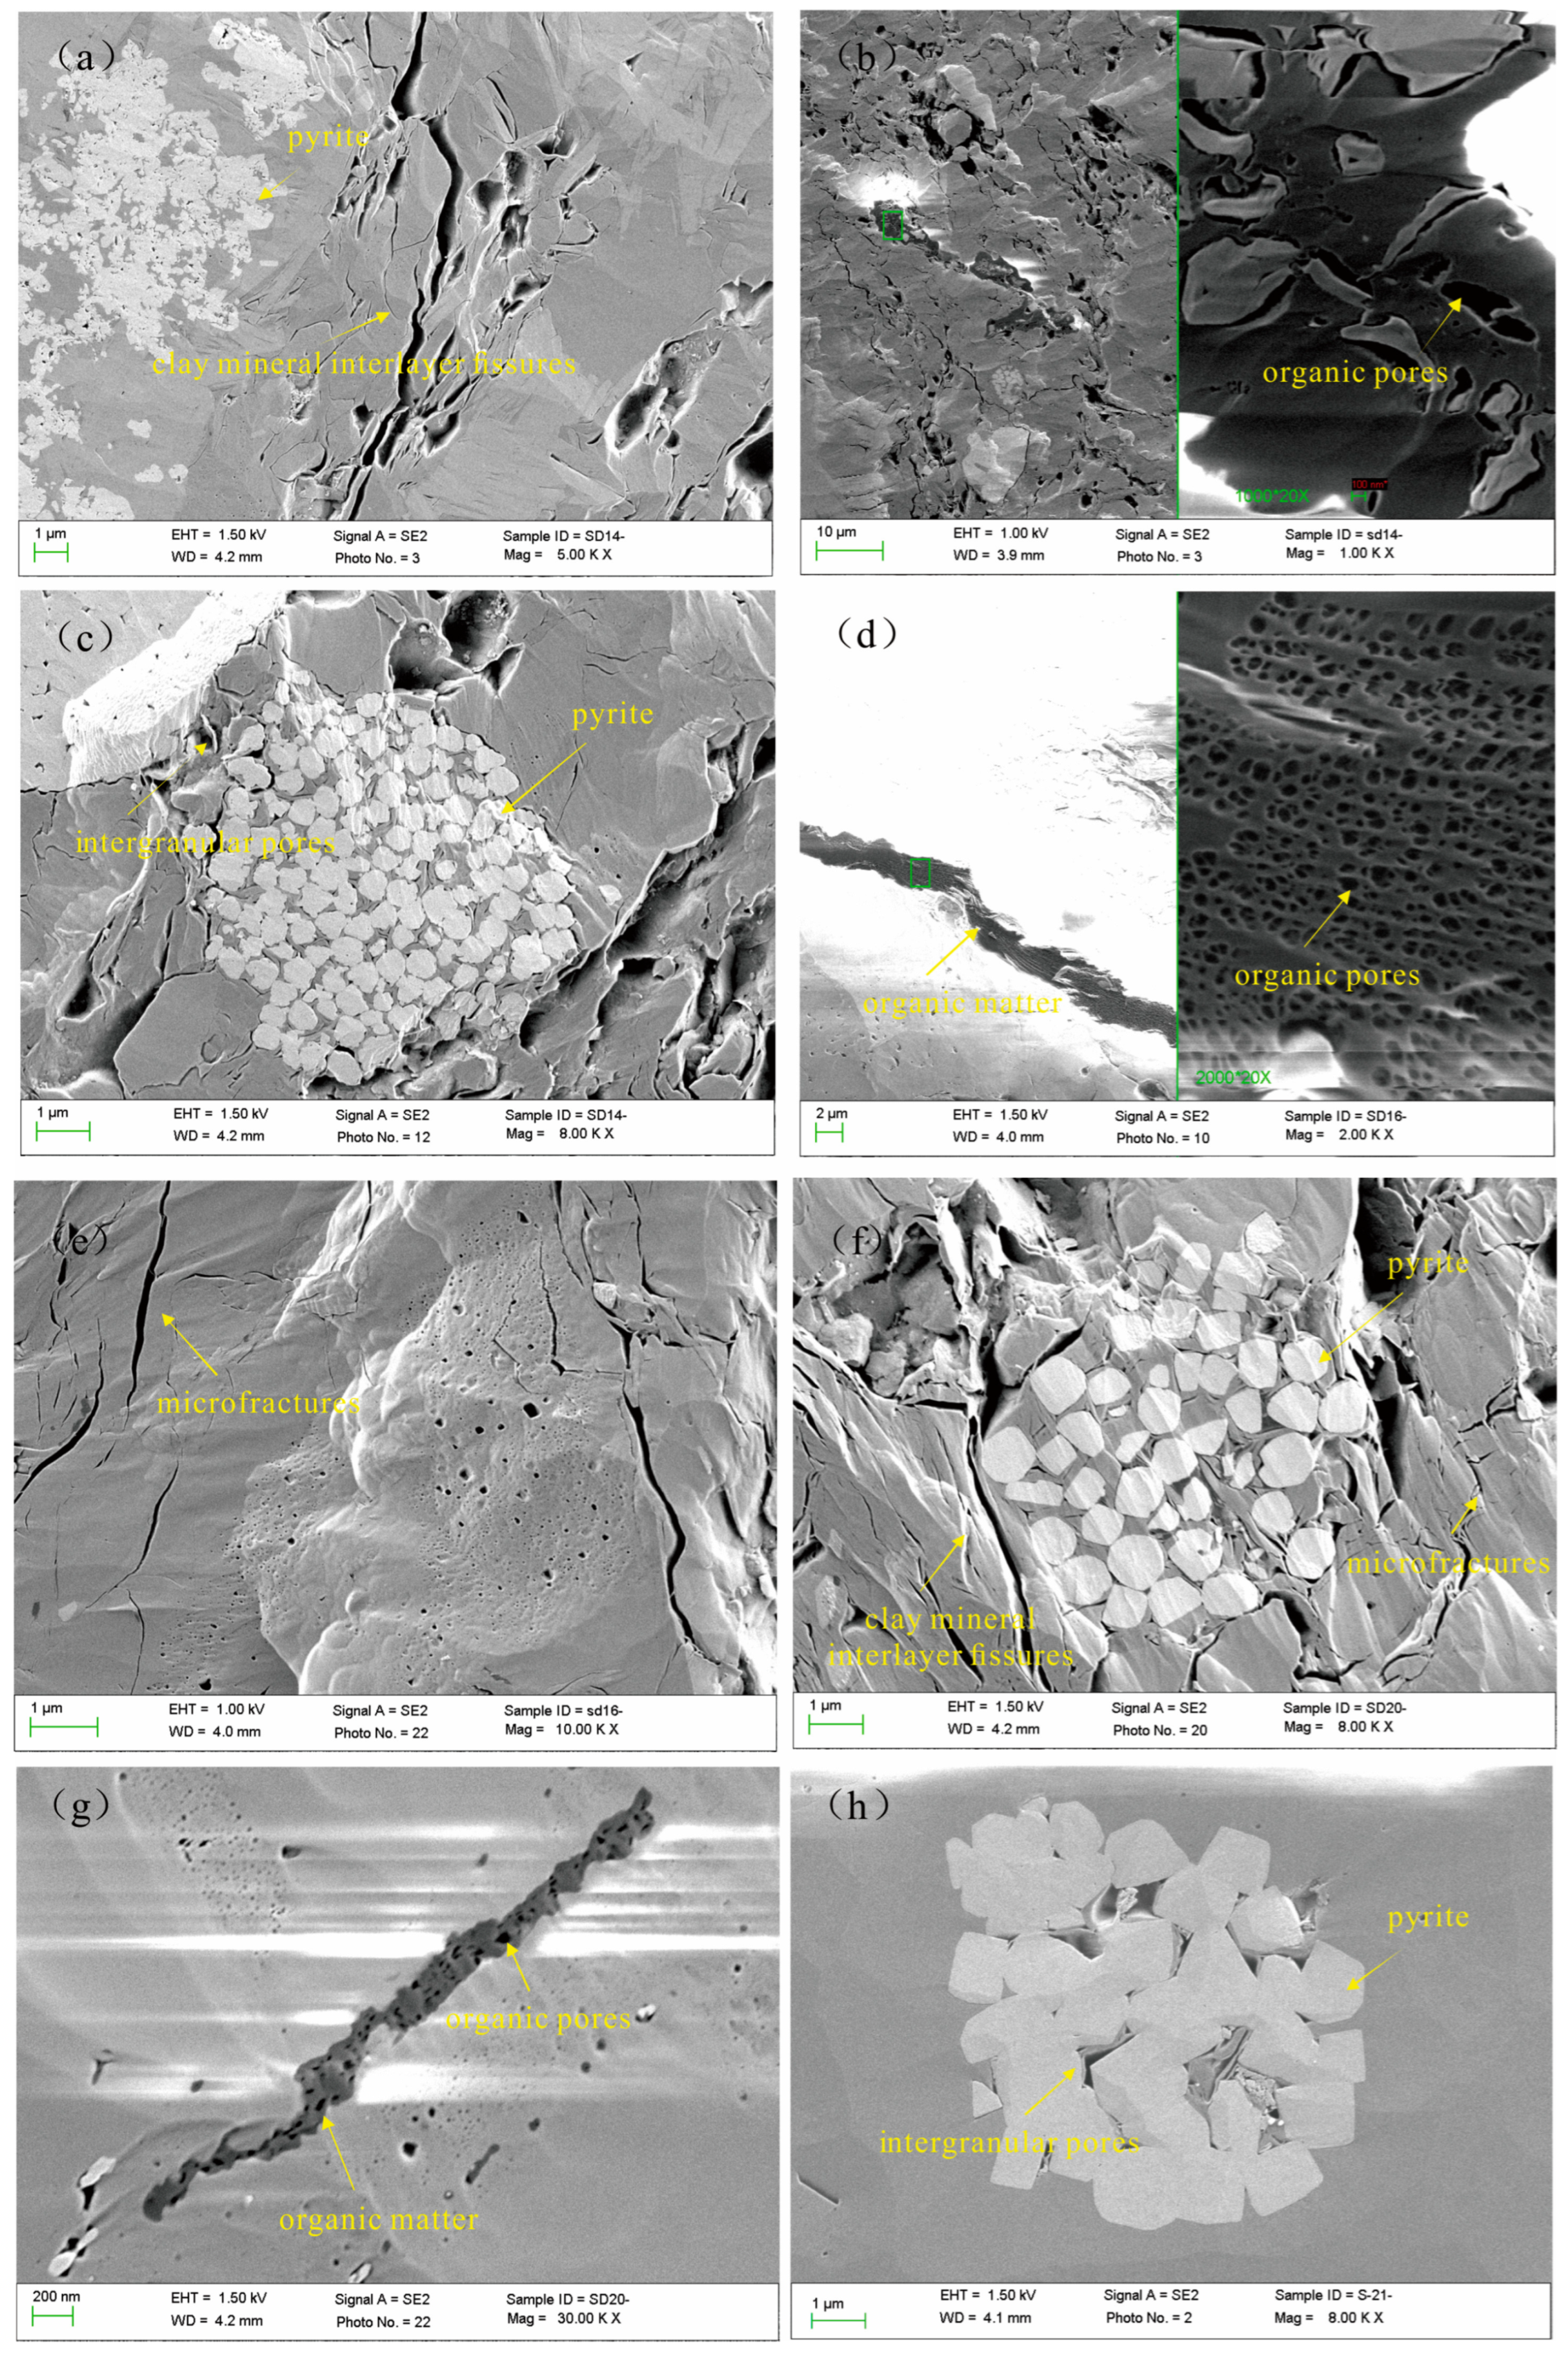
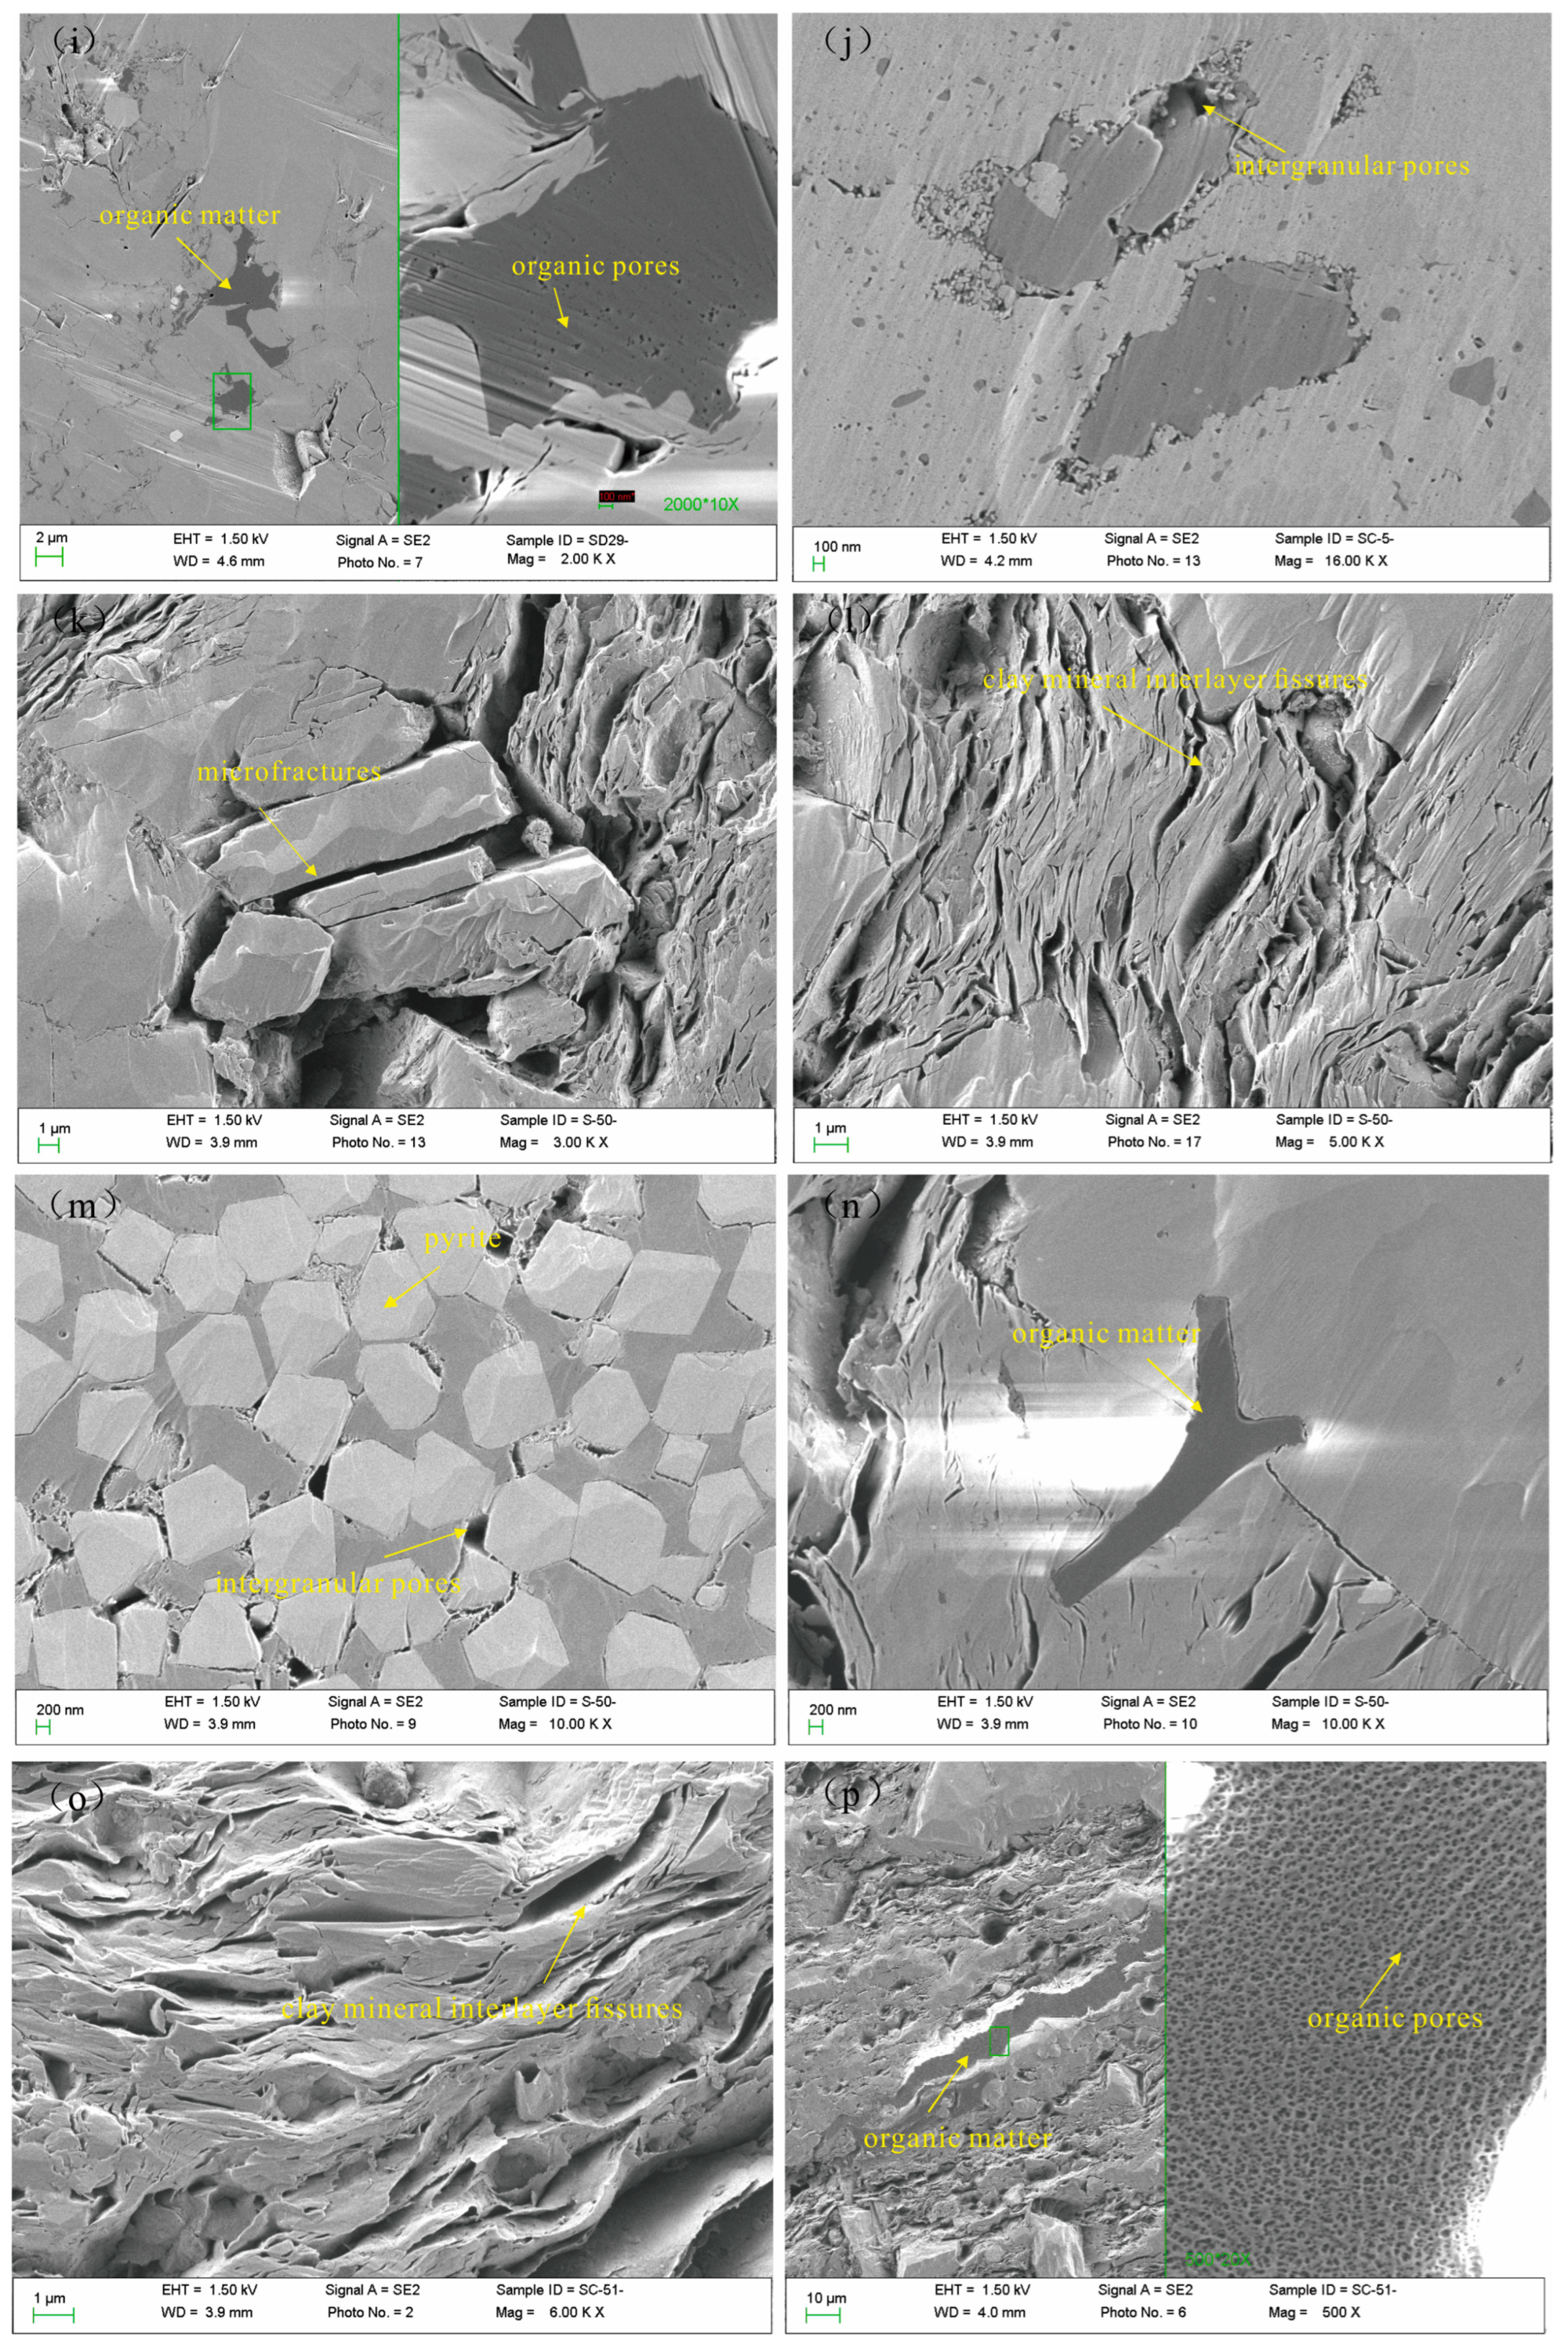
In contrast to shale in deepwater shelf environments, the Carboniferous shale in South China exhibits less-developed organic matter and organic pores (Figure 6b,i,j,n). Some pores within organic matter appear as pinholes or elongated elliptical shapes (Figure 6d,g,p), while others have irregular shapes (Figure 6i). This is in contrast with the marine shale, which has elliptical and circular pores. Pore throats between mineral and organic particles can be seen at high magnification, and pores are frequently present in minerals that coexist with organic matter (Figure 6f,j,k). Intergranular pores typically occur along the edges of quartz and feldspar and also appear within pyrite crystals (Figure 6c,h,m).
In this set of strata, clay mineral interlayer fissures and microfractures are the most prominent types of pores (Figure 6a,e). Clay minerals have numerous intergranular pores and fractures (Figure 6l,o), and compaction makes the clay minerals take on a flaky structure, leading to voids between them. For samples polished with argon ions, the pore types of clay minerals cannot be further identified or classified. Nevertheless, the microfractures and interlayer fissures in the Dawuba Formation shale offer excellent storage space for hydrocarbon gases when compared to organic pores.
Numerous variables, including the type of organic material, TOC, Ro, formation pressure, and burial depth, affect the development of organic pores. Since there is no siliceous hard framework support in the Dawuba Formation, the high clay mineral content and significant plasticity make it difficult to effectively preserve pores. Additionally, the organic matter types II and III produce only a few organic pores since they are difficult to break down. However, when examined using a scanning electron microscope, numerous interlayer clay fissures and microcracks, as well as a great deal of pyrite, were found. These findings imply an anoxic sedimentary environmen, and repeated tectonic events have helped shale reservoirs rebuild.

4.4. Porosity

Utilizing high-pressure mercury, CO2, and N2 adsorption techniques, the pore volume and specific surface area of shale samples were characterized. By combining results from these methodologies, we were able to describe the characteristics of variance in the total pore volume and specific surface area of the shale samples.
Except for the fourth member of the Dawuba Formation, the majority of the samples had well-developed macropores larger than 50 nm. The second and third members exhibited better connectivity compared to the first member. The hysteresis loop of the first member was the widest, which had a small difference in mercury injection and withdrawal volume (Figure 7a). This indicated that the pore throats of the shale in the first member were the narrowest and had poor connectivity. The second and third members’ hysteresis loops were wider, with a significant difference in mercury injection and withdrawal volume, and the efficiency of mercury extrusion was approximately 25%. This indicated that the shale pores of the second and third members had better connectivity. In the fourth member, the pores were relatively undeveloped, and the mercury intrusion curve remained unchanged as the intrusion pressure increased. The mercury saturation was still less than 10% at a pressure of 400 Mpa.
Although the N2 adsorption curves of each shale sample differed slightly in shape, they all exhibited an inverse “S” feature. The N2 adsorption rate increased rapidly in the first half of the curve, then slowly rose and approached a slight upward convexity until the relative pressure was close to 1.0 without reaching saturation adsorption (Figure 7b), indicating the existence of a certain amount of macropores in the shale. The N2 adsorption curve of each sample began to deviate from the desorption curve around a relative pressure of 0.43, forming a hysteresis loop, indicating that capillary condensation occurred during N2 adsorption, reflecting the existence of a certain amount of mesopores in the shale. According to the IUPAC classification of hysteresis loops [46], the pore types of samples from the third and fourth sections were primarily narrow slit-like pores with four open faces (H3 type), while the pore types of samples from the first and second sections were primarily cylindrical pores with openings on both ends or ink bottle-shaped pores with narrow necks and broad bodies (H1, H2 types).
The relationship between the pore size distribution and pore volume change rate of the Dawuba formation shale samples was ascertained using the BJH model. Results revealed that as the pore size increases beyond an average size of 10 nm, the decrease in pore volume change rate slows down considerably. In contrast, when the pore size is less than 10 nm, the pore volume change rate decreases rapidly with increasing pore size (Figure 7c). Furthermore, the study observed that the pores in the second member had the highest pore volume (with an average of 0.024 cm3/g) and specific surface area (with a BET specific surface area of 14.2 m2/g) among the four members studied, and these values decreased progressively from the first member to the fourth member (Figure 7d). These findings underscore the importance of small and medium-sized pores with sizes less than 10 nm in determining the pore volume and specific surface area, while the impact of pores larger than 10 nm was relatively minor.
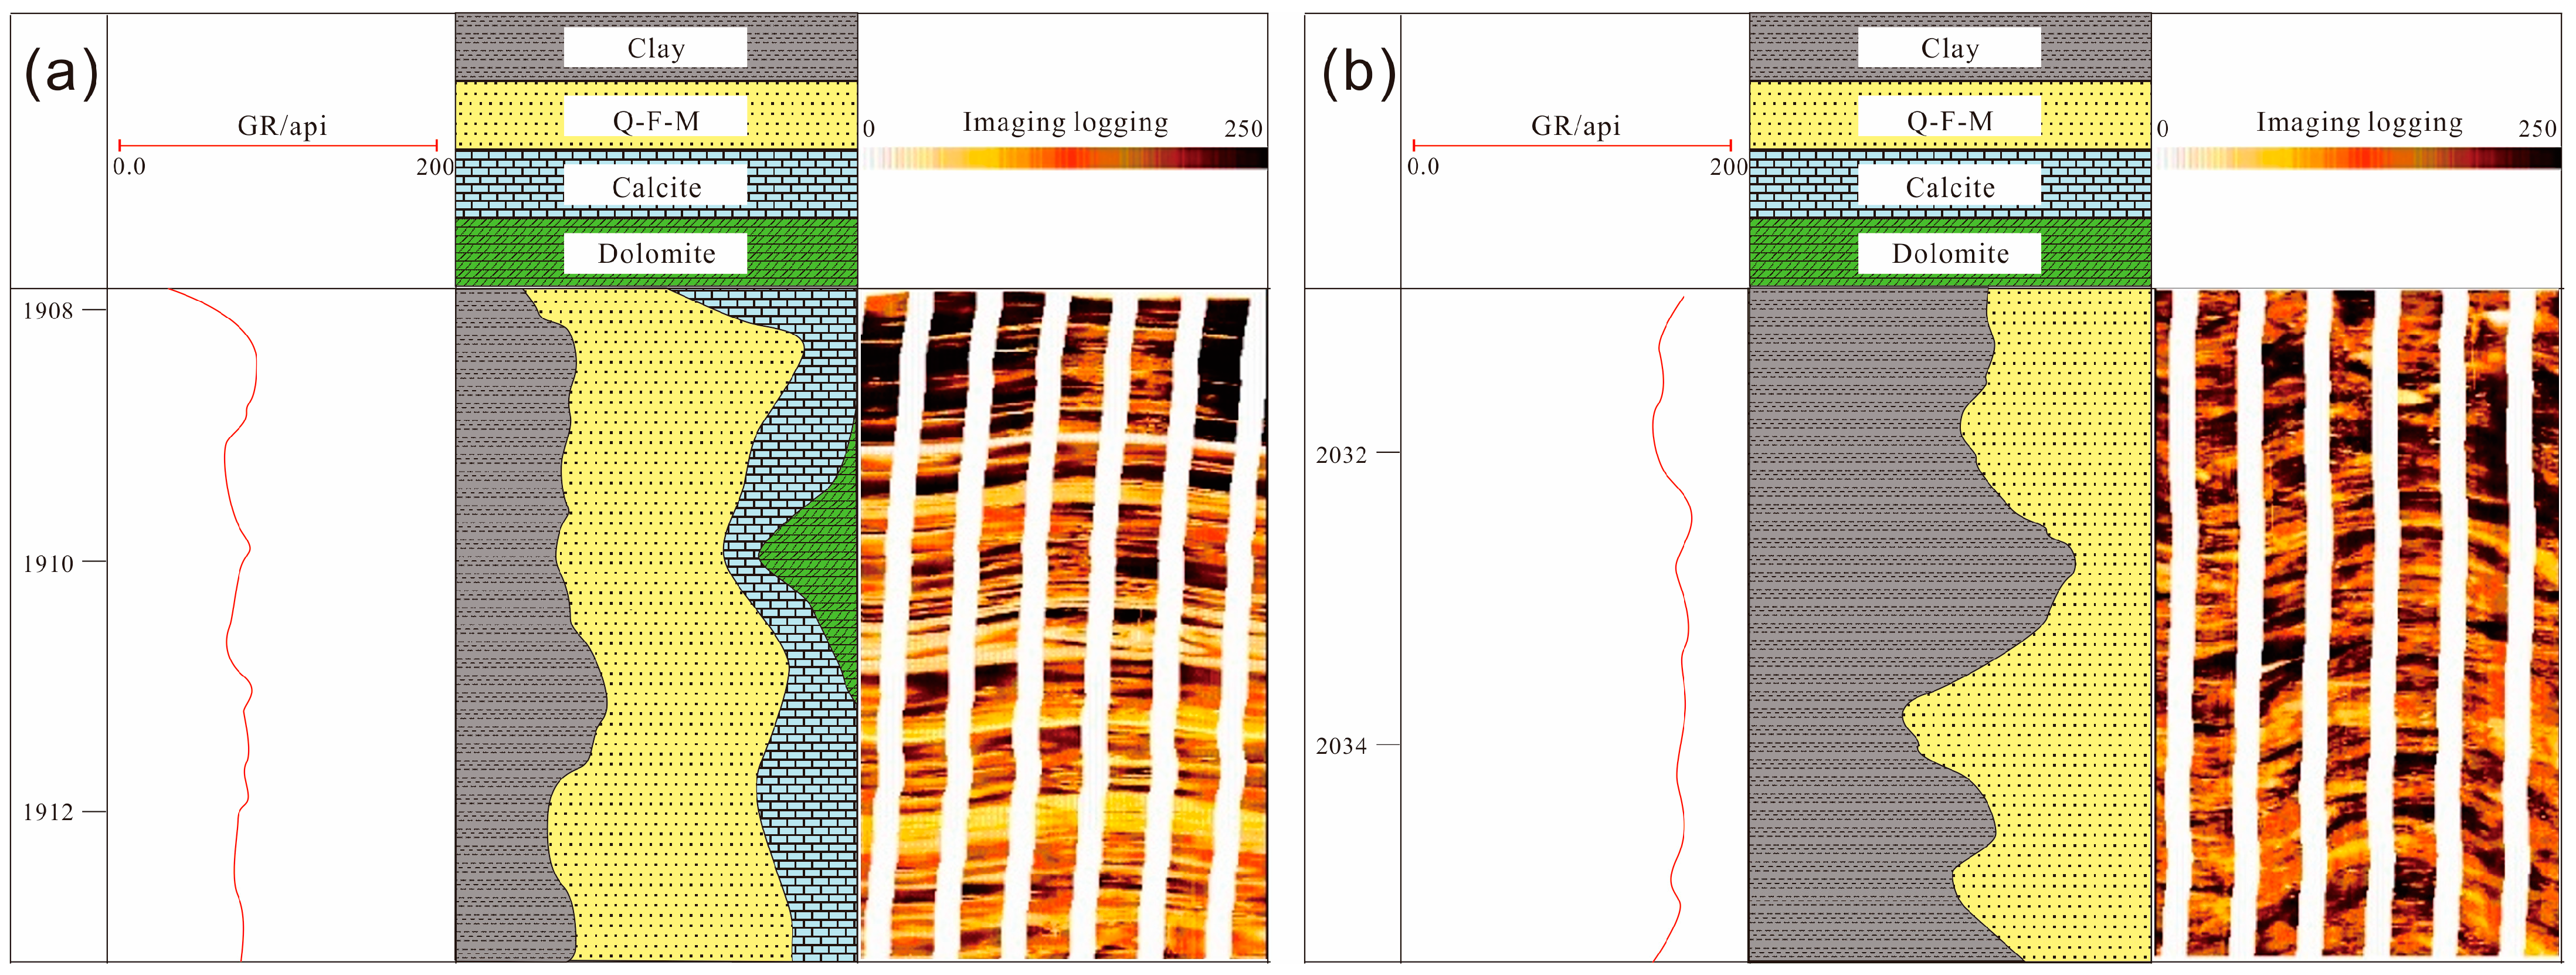
Additionally, a considerable prevalence of bedding cracks can be noticed in the electrical imaging logging results (Figure 8). In particular, the mudstone and mudstone-limestone layers in the second, third, and fourth members of the Dawuba Formation have distinct layering characteristics and clearly defined bedding planes, which make them more prone to developing micro-cracks. The first member, on the other hand, has fewer fissures because it is primarily made of pure mudstone and has a high clay content.

4.5. Gas-Bearing Characteristics

Twenty-nine samples of shale from the Dawuba Formation were tested for gas concentration; results ranged from 0.08 m3/t to 2.89 m3/t (Figure 9). The first and fourth members had a gas content range from 0.08 m3/t to 1.24 m3/t, averaging at 0.38 m3/t and 0.54 m3/t, respectively. In contrast, the second member showed a gas content range from 0.14 m3/t to 2.9 m3/t, with an average of 1.63 m3/t. Similarly, the third member had an average gas content of 1.21 m3/t. The study suggested that the shale trapped by mudstone and limestone presented a better match between gas content and organic matter abundance due to its unique lithological rhythmic structure, facilitating efficient gas preservation. The primary component of shale gas in the four member samples was methane (98.187%), which indicates a strong economic production value (Table 2).
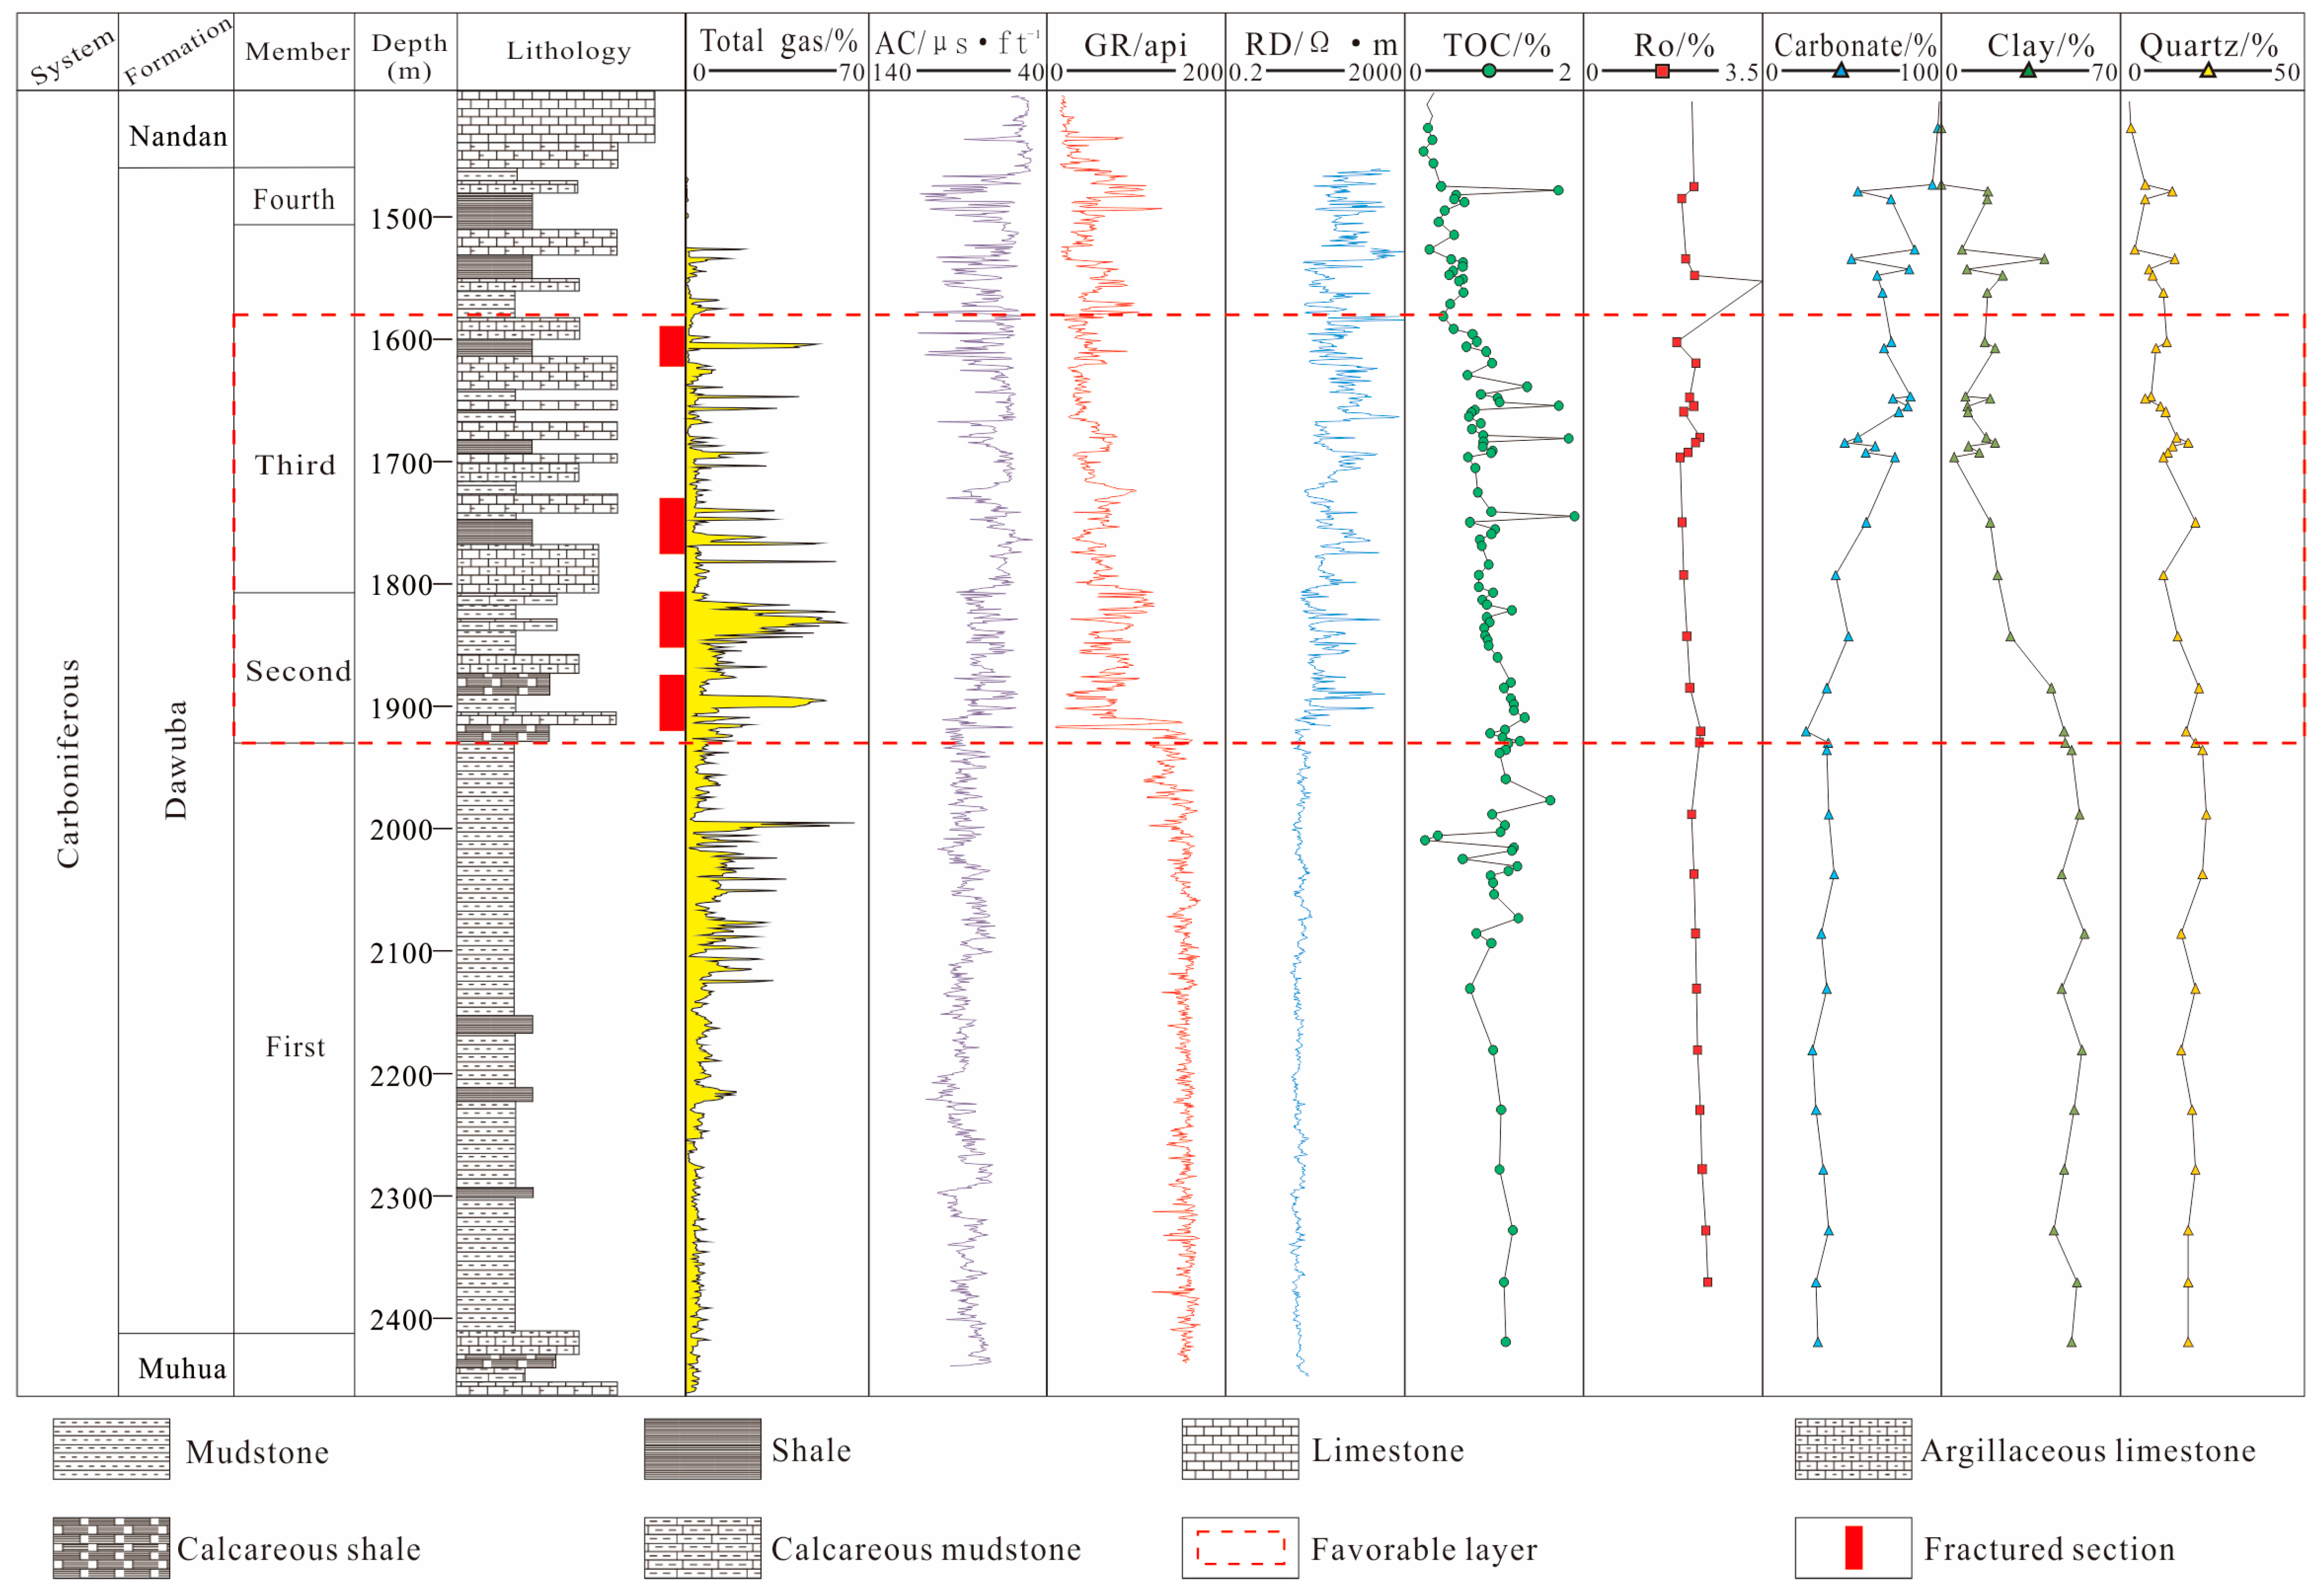
In addition, during drilling, the well QSD-1’s gas logging records revealed active gas layers, including 17 high gas content layers with thicknesses ranging from 1–8 m, and a total of 53 interpreted gas layers (Figure 10). In terms of total hydrocarbon content, the highest value was 63.4% (drilling fluid density: 1.15 g/cm3). The vertical well fracturing of well QSD-1 was finished in December 2020, and a consistent daily gas production of 11,011 m3 was attained.

5. Discussion

5.1. Comprehensive Evaluation of Shale in Dawuba Formation of Lower Carboniferous

Shale gas exploration in South China has shown that the area’s marine strata are geologically conducive to the accumulation of oil and gas [47]. Despite historic regional oil and gas accumulations, multiple tectonic movements since the Indosinian period have caused the geological structure to become more complex. This has disrupted reservoir-forming conditions and led to the dispersal of oil and gas in some areas while redistributing and accumulating it in others. As a result, the preservation process has become more complex and diverse, with highly complex oil and gas reservoirs characterized by multiple periods of reconstruction, hydrocarbon generation, migration, loss, and accumulation [48,49].
Since the Early Devonian, South China has undergone a marine transgression that advanced from south to north, with a slight retreat during the Early Carboniferous. The platform-basin system plays an essential role in the evolution of South China. As the rift trough where the Carboniferous marine shale is concentrated, the region is characterized by frequent vertical and horizontal facies changes, which have posed significant challenges to oil and gas exploration in the area.
The shale deposited in the YZLA has favorable material and physical properties for the formation of large gas fields. It is thick and has a moderate level of organic carbon and evolution degree. The mudstone porosity ranges from 5% to 8%, and the presence of bedding fractures and intergranular fractures provides sufficient storage space. The anticlinal area may have even better preservation conditions and exploration potential for oil and gas because the underground pressure coefficient is weak overpressure, up to 1.2.
The mudstone and mudstone-limestone that were unevenly interbedded in the Dawuba Formation were found to have the highest concentration of gas, according to the drilling results. The formation’s complex rhythmic deposition and reservoir-forming characteristics are unique and significantly differ from those of the Wufeng-Longmaxi Formation shale gas reservoirs currently being developed in the Sichuan Basin.
Significant differences were found in the development and shale gas enrichment characteristics of the Lower Carboniferous Dawuba Formation in the YZLA and the Upper Paleozoic Wufeng-Longmaxi Formation. (1) The Dawuba Formation primarily consists of unevenly rhythmically interbedded mudstone-limestone and mudstone, shale, mudstone-limestone, mudstone, and limestone, which is considerably thicker than the siliceous shale, carbonaceous mudstone, silty mudstone, and calcareous siltstone of the Wufeng-Longmaxi Formation [50,51,52,53]. (2) The Wufeng-Longmaxi Formation shale is influenced by paleo-uplifts and passive continental margin rifting, while the Dawuba Formation is located in a rift-type basin formed on the southern passive continental margin of the Yangtze Craton, with asymmetric features having steep northern and gentle southern slopes [54]. (3) The mineral composition of the Dawuba Formation shale is dominated by carbonate minerals with lower quartz content, whereas the Wufeng-Longmaxi Formation organic-rich shale has relatively high quartz content and low carbonate mineral content (Table 3). (4) Although the organic richness of the Wufeng-Longmaxi Formation organic-rich shale is generally higher than that of the Dawuba Formation, the thermal evolution degree of the shale is lower than that of the Dawuba Formation. (5) The Dawuba Formation organic-rich shale has a larger burial depth span than the Wufeng-Longmaxi Formation, with a shale burial depth in the rift trough generally less than 3 km, while the depth of the Wufeng-Longmaxi Formation in the Sichuan Basin is generally greater than 2.5 km. (6) The gas content of the Dawuba Formation shale ranges from 0.08 m3/t to 2.89 m3/t, slightly lower than that of the Wufeng-Longmaxi Formation, which ranges from 0.96 m3/t to 3.5 m3/t, with an average of 2.1 m3/t [55,56].
The differences between the Lower Carboniferous Dawuba Formation shale and the Wufeng-Longmaxi Formation shale are not only reflected in the significant differences in stratum thickness, lithologic combination characteristics, and various static indicators but also in the completely different shale gas accumulation mechanisms and formation conditions. The significant shale gas discovery made by well QSD-1 has significant ramifications for determining the peculiar shale gas accumulation rules in the South China Yunnan-Guizhou-Guangxi region and indicates a novel direction for China’s shale gas exploration and development.

5.2. Investigation Direction of Upper Paleozoic Marine Shale Gas in South China

The Lower Carboniferous Dawuba Formation is an essential hydrocarbon source rock layer in South China, primarily located in the YZLA, providing favorable storage conditions. After evaluating the shale gas resources in southern China, a prospective shale gas area in some regions of Guizhou province has been identified, covering an impressive 15,300 km2, with a staggering resource volume of up to 6.37 trillion cubic meters, which displays a high potential for exploration activities. By analyzing the sedimentary environment, organic carbon content, thickness, and maturity, and considering the geological conditions, regional research level, and practicality of shale gas exploration, three promising exploration directions for the Lower Carboniferous Dawuba Formation are proposed.
Weining-Liupanshui favorable area: The drilling of well QSD-1 confirmed that the Weining backfold and surrounding synclinal areas have favorable conditions for high-yield shale gas accumulation, making it a realistic exploration area within the YZLA in the short term (the well QSD-1 is currently in a temporary shut-in state, awaiting future operations for commercial purposes). Currently, the Lower Carboniferous Dawuba Formation gas-bearing shale in this area is well preserved, with a stable distribution, gentle formation dips, and burial depths of 2000–3000 m. The burial depth gradually increases from southwest to northeast, primarily distributed in high and medium hills and hilly areas. The organic carbon content of the Lower Carboniferous Dawuba Formation mudstone ranges from 0.9% to 2.1%, indicating a high hydrocarbon generation potential. The single-layer thickness of gas-bearing shale ranges from 20 m to 70 m, with a moderate maturity (Ro 1.92–2.57%), presenting a good prospect for shale gas exploration. However, the challenge in this area is the low signal-to-noise ratio of the 2D seismic data due to surface conditions, topography, and large-scale carbonate rock coverage, resulting in a low degree of structural interpretation. It is necessary to strengthen the 3D seismic technology to accurately identify regional structures and the development of underground strata.
The Ziyun-Changshun favorable area is located in the eastern part of YZLA, with well-preserved gas-bearing shale. The area is covered by Permian-Triassic strata, with burial depths ranging from 1000 m to 4000 m, and the topography is relatively complex, with a distribution of medium and low hills. The organic carbon content in this area ranges from 1.13% to 2.19%, indicating a good hydrocarbon generation potential. The average single-layer thickness of gas-bearing shale is more than 170 m, and the maturity ranges from 1.72% to 3.05 %, indicating a high maturity stage of organic matter thermal evolution. In the northeastern part of the block, wells have a gas content of 0.24–4.97 m3/t, with an average value of 1.54 m3/t, suggesting good shale gas exploration prospects. The focus of the next investigation should be on clarifying the distribution range of downslope facies and platform facies, identifying the development patterns of organic-rich shale, and looking for areas with low thermal evolution and effective preservation. Furthermore, exploring the impact intensity of regional sliding and mineralization on hydrocarbon source rock thermal evolution is crucial to evaluating the preferred favorable targets.
Rongshui-Huanjiang favorable area: This area refers to the extension of the YZLA in Guangxi, which is located from Huanjiang County to Rongshui County in the northern part of Guizhong depression. The Dawuba Formation (also referred to as the Luzhai Formation in Guangxi) has a shale thickness that varies from 50 m to 300 m. It is characterized by deep-water sedimentation and primarily consists of gray-black argillaceous shale and black carbonaceous shale. The formation contains brittle minerals, which range from 59.2% to 89.10%. The first member of the Luzhai Formation is the most well-developed shale formation with a total organic carbon content ranging from 0.43% to 6.53% and an average of 1.63%. Impressively, this section also presents a cumulative thickness of organic carbon content larger than 50 m. The Ro of shale ranges between 2.1% and 2.8%. Drilling data confirms the area’s outstanding potential for shale gas exploration, with a shale desorption gas volume of up to 1.21 m3/t, making it an attractive location for shale gas exploration in China’s southern Paleozoic Era.

6. Conclusions

(1)
The Lower Carboniferous Dawuba Formation in QSD-1 well has yielded a significant amount of shale gas, with a daily production of 11,011 m3. This breakthrough confirms the hydrocarbon generation potential of the Lower Carboniferous shale and identifies a new set of high-quality shale gas reservoirs that are different from the Wufeng-Longmaxi Formation. This discovery suggests that the YZLA may become a substantial area for shale gas industrialization and commercialization in the Yunnan-Guizhou-Guangxi region of South China.
(2)
The Lower Carboniferous Dawuba Formation has favorable conditions for the formation of large-scale shale gas reservoirs due to the following reasons: Firstly, the Dawuba Formation has a stable development and a large thickness. Secondly, the kerogen type of Dawuba Formation shale is primarily Type II-III, with an organic carbon content ranging from 0.25% to 1.42% and thermal evolution degree ranging from 1.92% to 2.57%. Thirdly, the study area’s thrust and reverse thrust structures in the compressional environment, affected by the Yanshan and Himalayan movements, are favorable for the formation of near-source gas reservoirs, which are advantageous for shale gas preservation. Fourthly, the static index elements of the Dawuba Formation match well, and the dynamic evolution in some areas is conducive to the large-scale aggregation of hydrocarbons. Finally, the development of synclines and anticlines with favorable overlying strata sealing conditions provides a good preservation environment for the formation of large gas fields.
(3)
The YZLA in South China offers three promising directions for the exploration of Carboniferous shale: ① The Weining-Liupanshui area in the northwestern part is a realistic field for increasing reserves; ② the Ziyun-Changshun area in the eastern part of the YZLA is a favorable location for exploring shale gas in the Lower Carboniferous formation; ③ the Rongshui-Huanjiang area in Guangxi Province presents favorable prospects for shale gas exploration. The Lower Carboniferous Luzhai Formation displayed tremendous potential for exploring new shale gas resources, promoting it as an ideal location for the exploration and development of China’s shale gas resources. Although Lower Carboniferous shale presents an encouraging exploration potential, a deeper comprehension and appraisal of the shale gas potential in this geological formation are necessary with more expertise.
(4)
The shale from the Carboniferous differs significantly from the shale from the Wufeng-Longmaxi Formation. The Carboniferous shale contains interbedded limestone and marl layers, which have a good match with organic matter, resulting in high methane content and indicating the combined control of limestone interbedded preservation conditions and organic matter on the adsorbed gas volume. This new type of shale gas in South China shows promising potential and warrants further exploration and research.

Author Contributions

Conceptualization, K.Y. and W.H.; methodology, X.Y.; software, Q.X.; validation, R.C., X.F. and X.C.; formal analysis, K.Y.; investigation, K.Y.; resources, S.L.; data curation, B.F. and L.L.; writing—original draft preparation, K.Y.; writing—review and editing, X.F.; visualization, X.Y.; supervision, K.Y.; project administration, S.L.; funding acquisition, K.Y., S.L., B.F. and L.L. All authors have read and agreed to the published version of the manuscript.

Funding

This research was funded by the China Geological Survey Projects “Investigation and evaluation of Paleozoic shale gas in Yunnan-Guizhou-Guangxi region” (grant no. DD20230264) and “Investigation and Evaluation of Strategic Mineral Resources of Shale Gas in Western Hubei, Eastern Chongqing and Central Guangxi” (grant no. DD20230321), and the Oil and Gas Resources Survey Projects “Investigation and Evaluation of Carboniferous Shale Gas in Southern Guizhou-Central Guangxi” (grant no. ZDDYR2023018) and “Reservoir Characteristics and Gas Accumulation of Trough-platform Shale: A Case Study of Early Carboniferous Shale in Yaziluo Rift Trough” (grant no. YKC2023-YC08).

Data Availability Statement

The data has been included in the manuscript.

Acknowledgments

We would like to express our gratitude to Guoheng Liu from China University of Petroleum (East China) for his assistance in conducting the experiments, and to Tuo Lin, Shunshuang Jin, Chao Wang, and Peng Gao from Oil and Gas Resources Survey, China Geological Survey for their valuable support and inspiration provided throughout the writing process.

Conflicts of Interest

The authors declare no conflict of interest.

References

  1. Curtis, J.B. Fractured shale-gas systems. AAPG Bull. 2002, 86, 1921–1938. [Google Scholar]
  2. Nie, H.K.; Tang, X.; Bian, R.K. Controlling factors for shale gas accumulation and prediction of potential development area in shale gas reservoir of South China. Acta Pet. Sin. 2009, 30, 484–491. [Google Scholar]
  3. Dong, D.Z.; Zou, C.N.; Li, J.Z.; Wang, S.J.; Li, X.J.; Wang, Y.M.; Huang, J.L. Resource potential, exploration and development prospect of shale gas in the whole world. Geol. Bull. China 2011, 30, 324–336. [Google Scholar]
  4. Srinivasan, S.; O’Malley, D.; Mudunuru, M.K.; Sweeney, M.R.; Hyman, J.D.; Karra, S.; Viswanathan, H.S. A machine learning framework for rapid forecasting and history matching in unconventional reservoirs. Sci. Rep. 2021, 11, 21730. [Google Scholar] [CrossRef] [PubMed]
  5. Bernard, S.; Horsfield, B.; Schulz, H.M. Geochemical evolution of organic-rich shales with increasing maturity:a STXM and TEM study of the Posidonia shale (Lower Toarcian, northern Germany). Mar. Pet. Geol. 2012, 31, 70–89. [Google Scholar] [CrossRef]
  6. Scott, L.M.; Daniel, M.J.; Kent, A.B. Mississippian Barnett shale, Fort Worth Basin, north-central Texas: Gas-shale play with multitrillion cubic foot potential. AAPG Bull. 2005, 89, 155–175. [Google Scholar]
  7. Mastalerz, M.; Schimmelmann, A.; Drobniak, A. Porosity of Devonian and Mississippian New Albany shale across a maturation g gradient: Insights from organic petrology, gas adsorption, and mercury intrusion. AAPG Bull. 2013, 97, 1621–1643. [Google Scholar] [CrossRef]
  8. Yuan, K.; Huang, W.H.; Chen, X.L.; Cao, Q.; Fang, X.X.; Lin, T.; Jin, C.S.; Li, S.Z.; Wang, C.; Wang, T. The whole-aperture pore structure characteristics and their controlling factors of the Dawuba Formation shale in Western Guizhou. Processes 2022, 10, 622. [Google Scholar] [CrossRef]
  9. Li, X.F.; Yuan, K.; Fang, X.X.; Wang, T. Carbon and oxygen isotope composition of carbonate minerals in carbonaceous shale and its geological significance—A case study from the Carboniferous Dawuba Formation shale, southern Guizhou area China. Fresenius Environ. Bull. 2022, 31, 990–997. [Google Scholar]
  10. Mei, M.X.; Ma, Y.S.; Deng, J.; Chu, H.M.; Liu, Z.R. Carboniferous to Permian sequence stratigraphic framework of the Yunnan-Guizhou-Guangxi basin and its adjacent areas and global correlation of third-order sea-level change. Geol. China 2005, 32, 13–24. [Google Scholar]
  11. Xia, B.D.; Liu, H.L.; Wu, Y.G.; Yang, H.M. The Yunnan-Guizhou-Guangxi rist system. Pet. Geol. Exp. 1992, 14, 20–30. [Google Scholar]
  12. Yuan, K.; Chen, R.; Lin, T.; Fang, X.; Qin, Y.; Wang, C.; Center, G.S. Petrological characteristics and sedimentary environment in the southern Guizhou during the Late Carboniferous. Pet. Geol. Exp. 2019, 41, 38–44. [Google Scholar]
  13. Yuan, K.; Wang, C.; Qin, Y.; Yu, S.; Chen, R.; Shi, D.; Zhou, Z. The discovery of Carboniferous shale gas in Qianziye-1 well of Qianan (southern Guizhou) depression. Geol. China 2017, 44, 1253–1254. [Google Scholar]
  14. Wang, Y.F.; Zhai, G.Y.; Liu, G.H.; Shi, W.Z.; Lu, Y.C.; Li, J.; Zhang, Y.X. Geological characteristics of shale gas in different strata of marine facies in South China. J. Earth Sci. 2021, 32, 725–741. [Google Scholar] [CrossRef]
  15. Xia, W.C.; Zhou, J.; Lei, J.X.; Zhang, N.M.; Peng, Y. The evolution of the rifted oceanic basin due to lithosperic stretching in Yunnan-Guizhou and Guangxi provinces during the late Hercynian to middle Indosinian stage. Acta Geol. Sin. 1995, 69, 97–112. [Google Scholar]
  16. Loucks, R.G.; Reed, R.M.; Ruppel, S.C. Spectrum of pore types and networks in mudrocks and a descriptive classification for matrix-related mudrock pores. AAPG Bull. 2012, 96, 1071–1098. [Google Scholar] [CrossRef] [Green Version]
  17. Lin, T.; Yuan, K.; Chen, X.L.; Wang, S.J.; Jin, C.S.; Wang, C. Industrial gas flow of Carboniferous shales in southern China was obtained in Well Qianshuidi 1 in Guizhou Province. Geol. China 2022, 49, 995–997. [Google Scholar]
  18. Jia, C.Z.; Pang, X.Q.; Song, Y. The mechanism of unconventional hydrocarbon formation: Hydrocarbon self-containment and intermolecular forces. Pet. Explor. Dev. 2021, 48, 437–452. [Google Scholar] [CrossRef]
  19. Liu, G.; Zhai, G.; Zou, C.; Huang, Z.; Liu, B.; Guo, X.; Wang, H. Amorphous silica and its effects on shale reservoir: A case study about Yanchang formation lacustrine shale, Ordos Basin. Energy Sources Part A Recovery Util. Environ. Eff. 2018, 41, 975–989. [Google Scholar] [CrossRef]
  20. Yang, H.Y.; Chen, S.Y.; Hao, X.L.; Guo, H.; Li, C.; Yang, Y. Sedimentary characteristics and evolutionary stages of Late Paleozoic Longlin isolated platform in Nanpanjiang depression. Geol. China 2010, 37, 1638–1646. [Google Scholar]
  21. Yuan, K.; Huang, W.H.; Fang, X.X.; Wang, T.; Lin, T.; Chen, R. Evaluation of favorable shale gas intervals in Dawuba Formation of Ziyun Area, South Qian Depression. Geofluids 2021, 2021, 6688141. [Google Scholar] [CrossRef]
  22. Liu, J.P.; Ma, J.; Wang, X.W. Characteristics of the segments of the Ziyun deformation belt in the Nanpanjiang area, Guizhou, China. J. Chengdu Univ. Technol. (Sci. Technol. Ed.) 2006, 33, 15–18. [Google Scholar]
  23. Yang, Q.; Mao, Z.; Shao, M.R. Research methods and prospects of nanopore structure in shale gas reservoirs. Energy Chem. Ind. 2021, 42, 7–13. [Google Scholar]
  24. Milliken, K.L.; Rudnicki, M.; Awwiller, D.N. Organic matter-hosted pore system, Marcellus Formation (Devonian), PennsylvaniaJ. AAPG Bull. 2013, 97, 177–200. [Google Scholar] [CrossRef]
  25. Zou, C.N.; Zhao, Q.; Cong, L.Z.; Wang, H.Y.; Shi, Z.S.; Wu, J.; Pan, S. Development progress, potential and prospect of shale gas in China. Nat. Gas Ind. 2021, 41, 1–14. [Google Scholar]
  26. Liu, G.H.; Zhai, G.; Yang, R.; He, T.; Wei, B. Quartz crystallinity index: New quantitative evidence for biogenic silica of the Late Ordovician to Early Silurian organic-rich shale in the Sichuan Basin and adjacent areas, China. Sci. China Earth Sci. 2021, 64, 773–787. [Google Scholar] [CrossRef]
  27. Li, H.; Liu, A.; Luo, S.; Chen, X.; Chen, L. Characteristics of the Cambrian Shuijingtuo shale reservoir on Yichang slope, western Hubei Province: A case study of well EYY-1. Pet. Geol. Exp. 2019, 41, 76–82. [Google Scholar] [CrossRef]
  28. Cheng, G.F.; Xu, A.Q. An insight into the northwestern-trending tectonical deformation of the Weining-Ziyun belt, western Guizhou. Guizhou Geol. 1998, 15, 311–320. [Google Scholar]
  29. Yang, Y.R.; Liu, X.C.; Zhang, H.; Zhai, G.Y.; Zhang, J.D.; Hu, Z.F.; Bao, S.J.; Zhang, C.; Wang, X.H.; Yang, X.; et al. A review and research on comprehensive characterization of microscopic shale gas reservoir space. China Geol. 2019, 2, 541–556. [Google Scholar] [CrossRef]
  30. Ma, K.; Pang, H.; Zhang, L.; Huang, S.; Huo, X.; Chen, J. Hydrocarbon dynamic field division and its relevance to oil and gas exploration for Paleogene reservoir in Lufeng depression. Adv. Geo-Energy Res. 2022, 6, 415–425. [Google Scholar] [CrossRef]
  31. Wang, X.W.; Guo, T.L.; Wo, Y.J.; Zhou, Y.; Wu, L.Z.; Zhang, R.Q.; Li, S.J. Characteristics of deep structural segmentation and transformation of the Yaziluo fault zone. Oil Gas Geol. 2013, 34, 220–228. [Google Scholar]
  32. Wang, S.Y.; Zhang, H.; Wang, T.H.; Wang, C.H.; Peng, C.L.; Hu, R.F.; Chen, M.H.; Shi, L. Filling and evolution of the Late Paleozoic Shuicheng-Ziyun aulacogen in western Guizhou, China. Geol. Bull. China 2006, 25, 402–407. [Google Scholar]
  33. Wang, S.Y. Faults and earthquakes in Guizhou. J. Geomech. 2016, 22, 430–438. [Google Scholar]
  34. Yuan, K.; Fang, X.X.; Lin, T.; Bao, S.J.; Shi, D.S.; Zhang, C. Geochemical features and sedimentary conditions of Middle-Devonian shale in the northwestern central Guangxi depression. Geol. Explor. 2017, 53, 179–186. [Google Scholar]
  35. Peng, J.; Chen, H.D.; Tian, J.C.; Qin, J.X.; Hou, Z.J.; Yang, X.N.; Shou, J.F.; Shen, A.J.; Chen, Z.K. Sequence stratigraphy study on the Cabroniferous strata in Sichuan, Yunnan, Guizhou and Guangxi. Acta Sedimentol. Sin. 2000, 18, 190–197. [Google Scholar]
  36. Xu, Z.Y.; Yao, G.S.; Guo, Q.X. Genetic interpretation about geotectonics and structural transfiguration of the southern Guizhou depression. Geotecton. Et Metallog. 2010, 34, 20–31. [Google Scholar]
  37. Bernard, S.; Wirth, R.; Schreiber, A. Formation of nanoporous pyrobitumen residues during maturation of the Barnett shale (Fort Worth Basin). Int. J. Coal Geol. 2012, 103, 3–11. [Google Scholar] [CrossRef]
  38. Xie, X.Y.; Tang, H.M.; Wang, C.H.; Bai, R.; Wang, Z.L. Contrast of nitrogen adsorption method and mercury porosimetry method in analysis of shale’s pore size distribution. Nat. Gas Ind. 2006, 26, 100–102. [Google Scholar] [CrossRef]
  39. Tian, H.; Zhang, S.C.; Liu, S.B.; Zhang, H. Determination of organic-rich shale pore features by mercury injection and gas adsorption methods. Acta Pet. Sin. 2012, 33, 419–427. [Google Scholar]
  40. Dong, T.; Harris, N.B.; Ayranci, K.; Yang, S. The impact of rock composition on geomechanical properties of a shale formation: Middle and Upper Devonian Horn River Group shale, Northeast British Columbia, Canada. AAPG Bull. 2017, 101, 177–204. [Google Scholar] [CrossRef]
  41. Yang, X.; Jiang, Z.X.; Song, Y.; Huang, H.X.; Tang, X.L.; Ji, W.M. A Comparative Study on Whole-aperture Pore Structure Characteristics between Niutitang and Longmaxi Formation of High-matruity Marine Shales in Southeastern Chongqingelt. Geol. J. China Univ. 2016, 22, 368–377. [Google Scholar]
  42. Xie, Z.T.; Hu, H.Y.; Yuan, H.P.; Liu, J.P.; Wang, T.; Liu, L.H. Influence of shale components on the pore development differences between wufeng-longmaxi formation and Niutitang formation: A Case Study of JY-1 Well in Southeast Chongqing and CY-1 Well in Northwest Hunan. Geol. Resour. 2021, 30, 143–152. [Google Scholar]
  43. Li, F.J.; Zheng, R.C.; Zhou, X.J.; Zhao, J.X.; Jiang, B. Late Palaeozoic tectonic evolution and basin prototype in southern China. Sediment. Geol. Tethyan Geol. 2009, 29, 93–99. [Google Scholar]
  44. Loucks, R.G.; Reed, R.M.; Ruppel, S.C. Morphology, genesis, and distribution of nanometer-scale pores in siliceous mudstones of the Mississippian Barnett shale. J. Sediment. Res. 2009, 79, 848–861. [Google Scholar] [CrossRef] [Green Version]
  45. Modica, C.J.; Lapierre, S.G. Estimation of kerogen porosity in source rocks as a function of thermal transformation: Example from the Mowry shale in the Powder River Basin of Wyoming. AAPG Bull. 2012, 96, 87–108. [Google Scholar] [CrossRef]
  46. Liu, G.; Huang, Z.; Jiang, Z.; Chen, J.; Chen, F.; Xing, J. Gas adsorption capacity calculation limitation due to methane adsorption in low thermal maturity shale: A case study from the Yanchang Formation, Ordos Basin. J. Nat. Gas Sci. Eng. 2016, 30, 106–118. [Google Scholar] [CrossRef]
  47. Zhao, M.J.; Zhang, Y.C.; Zhao, L.; Liu, P.C. Oil and gas accumulation and gas exploration potential in the Nanpanjiang basin, China. Geol. Rev. 2006, 52, 642–649. [Google Scholar]
  48. Mastalerz, M.; Drobniak, A.; Stankiewicz, A.B. Origin, properties, and implications of solid bitumen in source-rock reservoirs:a review. Int. J. Coal Geol. 2018, 195, 14–36. [Google Scholar] [CrossRef]
  49. Yuan, K.; Wang, K.Y.; Gong, S.H.; Qin, Y.L.; Lu, S.F.; Chen, R.; Fang, X.X. Shale Gas Enrichment Features and Impacting Factors in Carboniferous Dawuba Formation, Southern Guizhou Area. Coal Geol. China 2018, 30, 28–34. [Google Scholar]
  50. Li, S.W. The effect analyses and aspects of petroleum exploration in Yunnan-Guizhou-Guangxi region. Oil Gas Geol. 1985, 6, 221–225. [Google Scholar]
  51. Landis, C.R.; Castano, J.R. Maturation and bulk chemical properties of a suite of solid hydrocarbons. Org. Geochem. 1995, 22, 137–149. [Google Scholar] [CrossRef]
  52. Ji, L.; Qiu, J.; Xia, Y.; Zhang, T. Micro-pore characteristics and methane adsorption properties of common clay minerals by electron microscope scanning. Acta Pet. Sin. 2012, 33, 249–256. [Google Scholar]
  53. Zeng, Y.F.; Liu, W.J.; Chen, H.D.; Zheng, R.C.; Zhang, J.Q.; Li, X.Q.; Jiang, T.C. The sedimentary characteristics and structural evolution of the Youjiang composite basin. Guangxi Geol. 1992, 5, 1–14. [Google Scholar]
  54. Chen, H.D.; Zhang, J.Q.; Liu, W.J. Structure of Youjiang basin in Devonian-Carboniferousperiod and its evolution of lithofaciesand palaeogeography. Guangxi Geol. 1994, 7, 15–23. [Google Scholar]
  55. Zheng, F.Z.; Tang, X.; Yuan, K.; Lin, T.; You, M.X.; Niu, J.L.; Zi, Y.Z.; Liang, Y.T. Sedimentation Models and Development Mechanisms of Organic-Rich Shales of the Lower Carboniferous Dawuba Formation: A Case Study in the Yaziluo Rift Trough, South of Guizhou Province, Southern China. ACS Omega 2022, 7, 29054–29071. [Google Scholar] [CrossRef]
  56. Ma, Y.S. Marine Oil and Gas Exploration in China; Springer Science and Business Media LLC: Berlin/Heidelberg, Germany, 2020. [Google Scholar]
Figure 1. Study area location map (a), regional tectonic outline map (b), Early Carboniferous sedimentary facies map (c), Lithological columnar characteristics of mudstone and argillaceous limestone in the basin-slope facies of the Upper Carboniferous Dawuba Formation (d).
Processes 11 01896 g001
Figure 2. The core images of the Lower Carboniferous Dawuba Formation encountered by well QSD-1. (a) Dark gray mudstone in the fourth member; (b) gray-black shale and mudstone interbedded in the third member; (c) black shale and mudstone in the second member; (d) black fragile mudstone in the first member.
Processes 11 01896 g002
Figure 3. Mineral composition characteristics of Dawuba Formation in well QSD-1. (a) Relative content distribution of bulk-rock minerals; (b) relative content distribution of clay minerals.
Processes 11 01896 g003
Figure 4. Distribution of total organic carbon frequency (a) and vitrinite reflectance (b) of the Dawuba Formation in well QSD-1.
Processes 11 01896 g004
Figure 5. The main types and evolutionary pathways of the kerogen in the Dawuba Formation.
Processes 11 01896 g005
Figure 6. Microstructure of shale samples from Dawuba Formation in well DSD-1. (a) Black shale, the fourth member, 1468 m, micro-fractures and pyrite developed. (b) Black shale, the fourth member, 1468 m, small amount of filling-like organic matter and rare organic pores. (c) Black shale, the fourth member, 1468 m, large amount of nodular pyrite and mineral interstitial pores. (d) Black shale, the fourth member, 1480 m, organic matter in fractures, organic pore developed. (e) Black shale, the fourth member, 1480 m, micro-fractures developed. (f) Black shale, the third member, 1540 m, intergranular pores and micro-cracks around the pyrite mineralization. (g) Black shale, the third member, 1540 m, organic matter developed in elongated fissures, with abundant pores. (h) Black shale, the third member, 1690 m, inter-crystalline pores in strawberry-shaped pyrite mineralization. (i) Black shale, the third member, 1660 m, irregular blocky organic matter with few visible organic pores. (j) Black shale, the second member, 1930 m, pores between mineral particles. (k) Black shale, the second member, 1930 m, development of intergranular and interlayer pores of clay minerals. (l) Black shale, the second member, 1930 m, clay mineral interlayer fissures and microfractures. (m) Black shale, the first member, 1940 m, pores between pyrite particles. (n) Black shale, the first member, 1940 m, organic matter suspected to be continental margin debris, with poorly developed organic pores. (o) Black shale, the first member, 1940 m, clay mineral interlayer fissures and microfractures. (p) Black shale, the first member, 1940 m, organic matter filling the cracks, pores developed.
Processes 11 01896 g006aProcesses 11 01896 g006b
Figure 7. Characteristics of shale pore development in Dawuba Formation in Well QSD-1. (a) The mercury injection–withdrawal curve of different members; (b) nitrogen adsorption–desorption curve of different members; (c) the distribution of pore volume change rate by N2 adsorption; (d) specific surface area distribution of different members based on N2 adsorption.
Processes 11 01896 g007
Figure 8. Electrical imaging logging results of the Dawuba Formation in well QSD-1. (a) Electrical imaging logging results of the second member, (b) electrical imaging logging results of the first member.
Processes 11 01896 g008
Figure 9. Desorbed gas content of Dawuba Formation shale in well QSD-1.
Processes 11 01896 g009
Figure 10. Comprehensive drilling column diagram of well QSD-1.
Processes 11 01896 g010
Table 1. The maceral composition of all the Dawuba Formation shale samples.
SampleDepth/mMemberLithologySapropelinite/%Vitrinite/%Inertinite/%Types Classification
Normal VitriniteFusiniteIndexType
S-11475.70FourthBlack shale84.00.016.068.00II1
S-21532.00FourthBlack shale72.70.027.345.45II1
S-31542.60FourthBlack shale52.030.018.011.50II2
S-41648.80ThirdBlack shale39.335.725.0−12.50III
S-51650.70ThirdBlack shale54.545.50.020.45II2
S-61658.00ThirdBlack shale75.00.025.050.00II1
S-71661.00ThirdBlack shale52.129.218.811.46II2
S-81686.20ThirdBlack shale50.033.316.78.33II2
S-91688.40ThirdBlack shale27.847.225.0−32.64III
S-101938.40SecondBlack shale36.436.427.3−18.18III
Table 2. Gas composition data for well QSD-1.
ComponentConcentration/%ComponentConcentration/%
Methane98.187Nitrogen0.560
Ethane0.402Helium0.045
Propane0.021Hydrogen0.001
Carbon dioxide0.784--
Table 3. Comparison of shale characteristics between the Dawuba Formation and Wufeng-Longmaxi Formation.
Wufeng-Longmaxi FormationDawuba Formation
Distribution area Most of the middle and upper Yangtze region except the central and western Sichuan basin Southern Guizhou Province, Guangxi Province, most of Hunan Province, and northeastern Yunnan Province
Shale thickness 50–900 m,
organic-rich shale 20–80 m
60–1200 m,
organic-rich shale 30–260 m
SystemUpper Ordovician-Lower Silurian Lower Carboniferous
Lithofacies characteristics (1) organic-rich, siliceous bioshales; (2) black, fine-grained, oil-bearing biolimestone; (3) Siliceous shale is more brittle than clay-rich shale, and fractures are easier to develop. (1) rhythmic interbedding of marl and shale with unequal thickness; (2) The first and third members of Dawuba Formation have developed foliation and high shale content; (3) The shale organic matter pores are not well developed.
Mineral composition quartz: 18–70%, calcite: 3–11%,
illite: 13–36%, chlorite: 3–28%,
dolomite: 4–38%, feldspar: 3–10%,
pyrite: 1–4%, gypsum: 1–2%
quartz: 4–27%, calcite:4–93%,
illite: 5–70%, chlorite: 5–47%,
feldspar: 1–3%
Sedimentary background influenced by paleo-uplifts and passive continental margin riftinga rift-type basin formed on the southern passive continental margin of the Yangtze Craton, with asymmetric features having steep northern and gentle southern slopes
Geological structure characteristics Central Guizhou uplift, central Sichuan uplift, Motianling ancient land and Hannan ancient land Yadu-Ziyun-Luodian aulacogen, Qiannan depression, Qianxinan depression, Nanpanjiang depression and Guizhong depression
Sedimentary environment Detained deep water basin with distinct water body stratification and anoxic bottom water; In some areas, there are also areas connected with the wide sea, which leads to the local prosperity of marine radiolarians; Water depth is 100–300 m The lithofacies palaeogeographic framework of the secondary deep-water basin and platform distributed alternately in NW direction and NE direction, and the sedimentary subfacies such as shore, platform, slope and basin are developed
Burial depth 3–6 km0–5 km
TOC1–10%, the kerogen type is mainly type I0.5–5.2%, the kerogen type is mainly type II
RoRo ≥ 1.6% (Up to 3.6%)2.0–3.0% (Up to 4.0%)
Disclaimer/Publisher’s Note: The statements, opinions and data contained in all publications are solely those of the individual author(s) and contributor(s) and not of MDPI and/or the editor(s). MDPI and/or the editor(s) disclaim responsibility for any injury to people or property resulting from any ideas, methods, instructions or products referred to in the content.