Article

Microscopic Distribution and Development Strategy of Residual Oil in Tight Sandstone

1
School of Earth Science, Northeast Petroleum University, Daqing 163318, China
2
Yushulin Oilfield Development Company, Daqing 163000, China
*
Author to whom correspondence should be addressed.
Processes 2023, 11(7), 1907; https://doi.org/10.3390/pr11071907
Submission received: 23 May 2023 / Revised: 12 June 2023 / Accepted: 17 June 2023 / Published: 25 June 2023
(This article belongs to the Section Energy Systems)

Abstract

:
Pore and permeability are distributed discontinuously and unevenly in the dominant sedimentary model of the lateral accretion body inside the meandering river point bar of the Fuyang reservoir of the Yushulin oilfield. Based on the water flooding experiments of field core samples, the influence of pore permeability conditions on residual oil distribution type and water cutting rate was studied by using the microscopic visualization technology enabled through a photolithographically fabricated glass model. It is found that the residual oil in samples shows five discontinuous types, which are cluster, columnar, oil droplet, membrane, and blind end. In the stages with low, medium, and high water cutting rates, the proportion of clustered residual oil in the samples with different permeability is high, reflecting the situation that it is difficult for injected water to spread widely in tight oil reservoirs. With the decrease of permeability, the proportion of membrane and blind end residual oil gradually increases, which indicates that the thin pore throat can produce large restrictions on residual oil, resulting in residual oil enrichment. At the same time, the water flooding experiment was carried out by changing the displacement direction and periodic water injection. It was found that changing the displacement direction was beneficial to the recovery of residual oil in the thin pore throat and avoided the dominant seepage of injected water in the big pore throat, and the recovery rate was increased by more than 2.14%. Periodic water injection, which was conducive to adjusting the displacement pressure difference, reduced the constraining force of the throat on residual oil and increased the recovery rate by more than 3.98%. The actual well area with closed coring wells and dynamic production data is preferred for the application of experimental research results. Changing displacement direction and periodic water injection increased the residual oil recovery by more than 3%.

1. Introduction

According to world energy statistics, due to the acceleration of economic activity, global energy consumption grew by 5.8% in 2021, which requires maintaining or increasing oil and gas production (Gokhan et al., 2016; Li X. et al., 2021) [1,2]. In the process of oil exploitation, the residual oil distribution and the evaluation of the degree of recovery have always been important tasks for oilfield development. From the early stage of oilfield development to the middle and late stages with high water production, the recovery rate of tight sandstone reservoirs has decreased day by day. It has become a key task to make a strategy to enhance oil recovery by studying the controlling effect of pore permeability on residual oil (Li C. et al., 2022; Liu X. et al., 2022) [3,4].
Research on the distribution of residual oil from a micro perspective based on experiments is more conducive to revealing the oil and gas production mechanism of complex oil reservoirs. Experiments on core samples are the main way to intuitively reflect the complex microscopic pore structure of rock formations. The core experiment research of Zhong X. et al. (2021) shows that under the same viscosity conditions, the greater the porosity and the greater the permeability, the lower the residual oil saturation [5]. Li T. et al. (2022) conducted displacement experiments on artificial samples with different pore sizes and found that retention occurred when the oil passed through small pores [6]. Georgiadis A. et al. (2013) conducted water flooding experiments in glass bead porous media and found non-wetting phase oil clusters in the experimental media under two-phase flow conditions [7]. Li P. et al. (2017) conducted a high-pressure mercury intrusion (HPMI) experiment on tight sandstone samples in the Ordos Basin and pointed out that the pore structure of tight oil sandstones is complex and has strong heterogeneity, which has an important impact on mercury displacement [8]. An S. et al. (2016) found that the porosity and permeability distribution of core samples affect the sweep rate of oil–water seepage through micro computerized tomography (µ-CT) experiments [9]. Lai J. (2017) studied the pore throat structure of tight sandstone by various experimental methods and pointed out that the levels of permeability can reflect the micro-pore throat characteristics of tight sandstone in a macro sense [10]. AL-Khafaji (2019) pointed out that the optical radiation method can realize the visual monitoring and effective analysis of the fluid flow and displacement process [11]. Lithography glass model technology (Zhang Xiaoli et al., 2017) [12] is a visual microscopic model scanning technology that can achieve fine imaging of the internal microscopic state of natural core casting slices.
Most reservoir engineers have been trying to figure out how to apply the microscopic residual oil research results based on core experiments to the macroscopic actual production and depict the residual oil distribution law in the area. The internal structure and oil status of core samples from the coring wells, logging data, and dynamic development data have been used to macroscopically depict the residual oil distribution in the oilfield. Ren Qiang et al. (2022) pointed out that the residual oil saturation of the formation can be inferred using logging data and the oil content overflowing from the core samples [13]. Zhu W. et al. (2022) combined the geological architecture of sand bodies with dynamic development data to deduce the residual oil distribution position and pointed out that the narrow part is often the enrichment area of residual oil in micro-pores [14]. Yang J. (2019) used the core samples, logging, and dynamic development data of the Weicheng oilfield to study the matching rules between sand body sedimentary units and residual oil distribution [15]. Zhang M. et al. (2020) used the dynamic water cutting rate of the production wells, the relative permeability of oil and water of the formation, and the early logging data to predict residual oil in the region in real time and effectively save the cost of new drilling wells [16]. The residual oil of the core samples from the closed core well was used to deduce that the internal structure of the sand body controls the residual oil distribution in the water injection development process (Feng Congjun et al. (2013) [17], Pengfei X. et al. (2018) [18]). Murugesu T. S. et al. (2017) [19] pointed out that the residual oil saturation varies depending on lithology, pore size distribution, permeability, and fluid characteristics, and that the integration of various data sources will have a good effect on on-site production.
The complicated pore structure is the main factor that controls reservoir seepage capacity (Wang J. et al., 2020) [20], liquid production properties, and reservoir oil recovery rate. The geometry of the pore throat restricts the recovery of oil and gas. A small throat slows down the seepage velocity and reduces the recovery degree of oil and gas (Chauhan A. et al. (2021) [21]). Shi Jingping (2003) believes that the narrow throat channels in the Fuyang reservoir in this study area and the small average pore radius cause problems such as high water injection pressure and la ow oil recovery rate during the development process [22]. Perrin C. L, et al. (2006) analyzed the pore-scale network model of Carreau fluid non-Newtonian fluid mechanics and observed shear thickening (an increase of apparent viscosity at high shear rates) in the micromodel experiments as a result of elastic effects becoming important, and this remains to be incorporated in the network model [23]. Pal M. (2021) presented a pragmatic and time-efficient approach for simulating flow experiments at the microscale, providing valuable insights into the impact of petrographic components on flow characteristics [24]. Therefore, based on the study of residual oil distribution from both macro and micro perspectives, the microscopically visualized displacement experiment enabled through a photolithographically fabricated glass model can directly observe the dynamic seepage characteristics of the fluid in microscopic pores, monitor the characteristics of channels where the residual oil is located after water flooding in different water-bearing stages, and determine the type and distribution of residual oil. The residual oil displacement experiments with different strategies can provide a theoretical basis for further tapping residual oil in tight reservoirs.

2. Oilfield Overview

Yushulin oilfield is located on the Shangjia nose structure in the east of Sanzhao Sag in the northern secondary structural belt of the Songliao Basin. The oil layers are sandstone bodies that formed under the sedimentary environment of the meandering river delta in the Fuyang reservoir. The main channel sand bodies are mainly distributed in large- and medium-sized flakes and bands. The channel sand bodies are extensively distributed in the way of point bars. The overflowing sand bodies are confined in small and narrow areas along both sides of the river channel. Through the analysis of the data of the core wells in the study area, the results show that the reservoir rock types are mainly fine sandstone and siltstone, and the sandstone is mainly detrital feldspar sandstone and feldspathic detritus sandstone. According to the difference in the content of argillaceous and calcareous interstitial materials, the rock lithology types can also be divided into fine sandstone, siltstone, calcium-bearing siltstone, mud-bearing siltstone, and argillaceous siltstone. Therefore, the size sorting and rounding of the rock particles are poor, and the content of suspended matter such as mud is high. The Fuyang sand bodies are buried deeply between 1800 m and 2200 m. Its rock type and mineral composition make the sediments have low compaction resistance and high compaction strength during the diagenesis process so that the porosity is greatly reduced and the properties of the layers become poor and dense. According to the analysis of formation water data, the pH value is 8.1 in the Fuyang reservoir. In the study area, Figure 1 shows that the porosity is mainly distributed in the range of 10–15%, and the average porosity is 11.8%; Figure 2 shows that the permeability is mainly distributed in the range of 0.1 × 10⁻³ m2–5 × 10⁻³ μm2, the average permeability is 2.00 × 10⁻³ μm2, the average throat radius is only 1.3 μm, and the permeability variation coefficient reaches 0.78 (Jingping Shi, 2003) [22]. According to the properties of tight oil, the Fuyang reservoir in the Yushulin oilfield belongs to the typical tight oil sandstone category (Nelson P. H., 2009) [25]. According to the statistics of core data and test data in the study area, the formation pressure is 19.4 MPa, the formation temperature is 89.88 °C, and the original gas–oil ratio is 16.7 m3/m3 (21.1 m3/t). Crude oil density is 0.8602 t/m3, and crude oil viscosity is 31.1 mPa·s. The study area is an independent reservoir; development well spacing is 300 m, and well spacing is 212 m. The above parameters are fixed. The physical properties are affected by the heterogeneity of the reservoir, and the porosity and permeability change obviously. The porosity is distributed in the range of 2.5–15.9%, and the permeability is distributed in the range of 0.01 × 10⁻³ μm2–13.4 × 10⁻³ μm2. Therefore, the main factor affecting the residual oil is the physical properties of the reservoir. The type and quantitative distribution of residual oil are given from both micro and macro aspects, and the type and distribution of residual oil are characterized by a micro-visualization experiment enabled through a photolithographically fabricated glass model. Finally, the next development strategy is given in combination with production data.

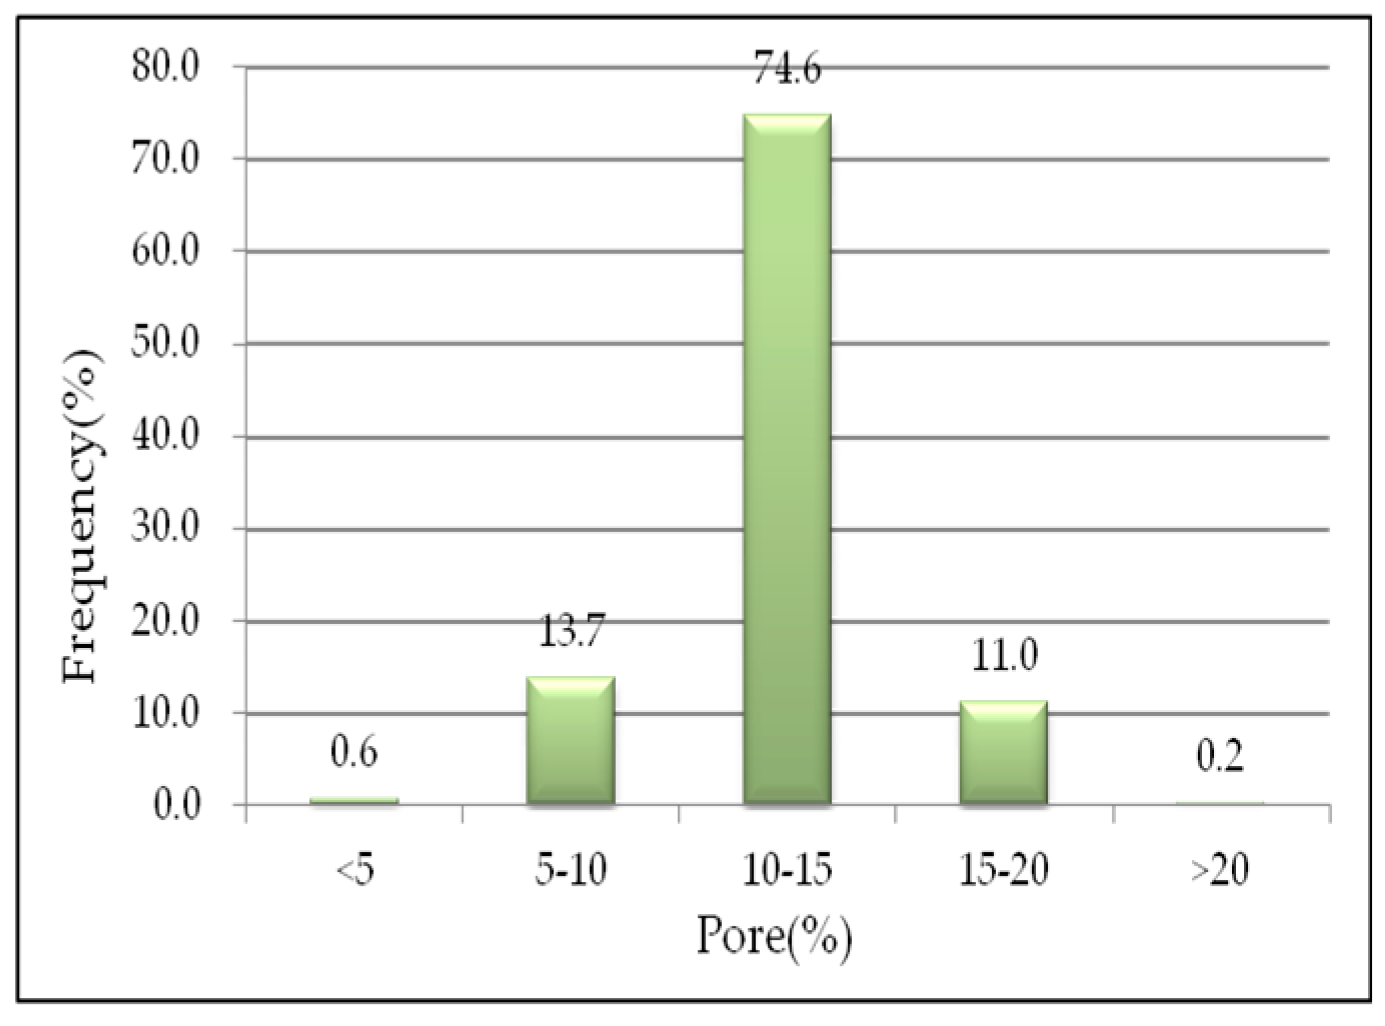
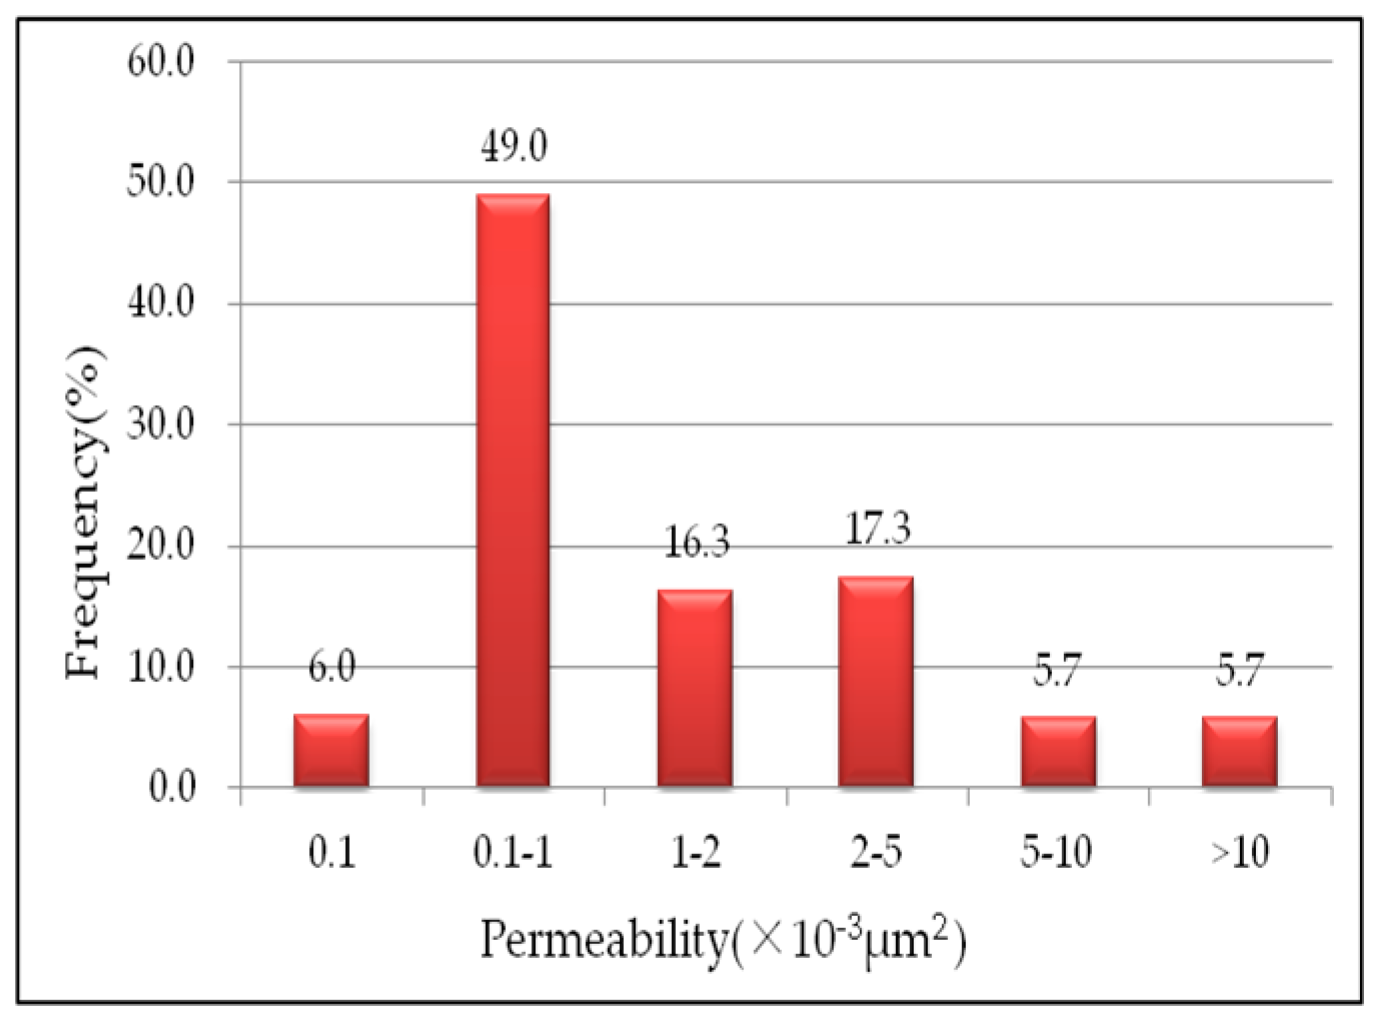
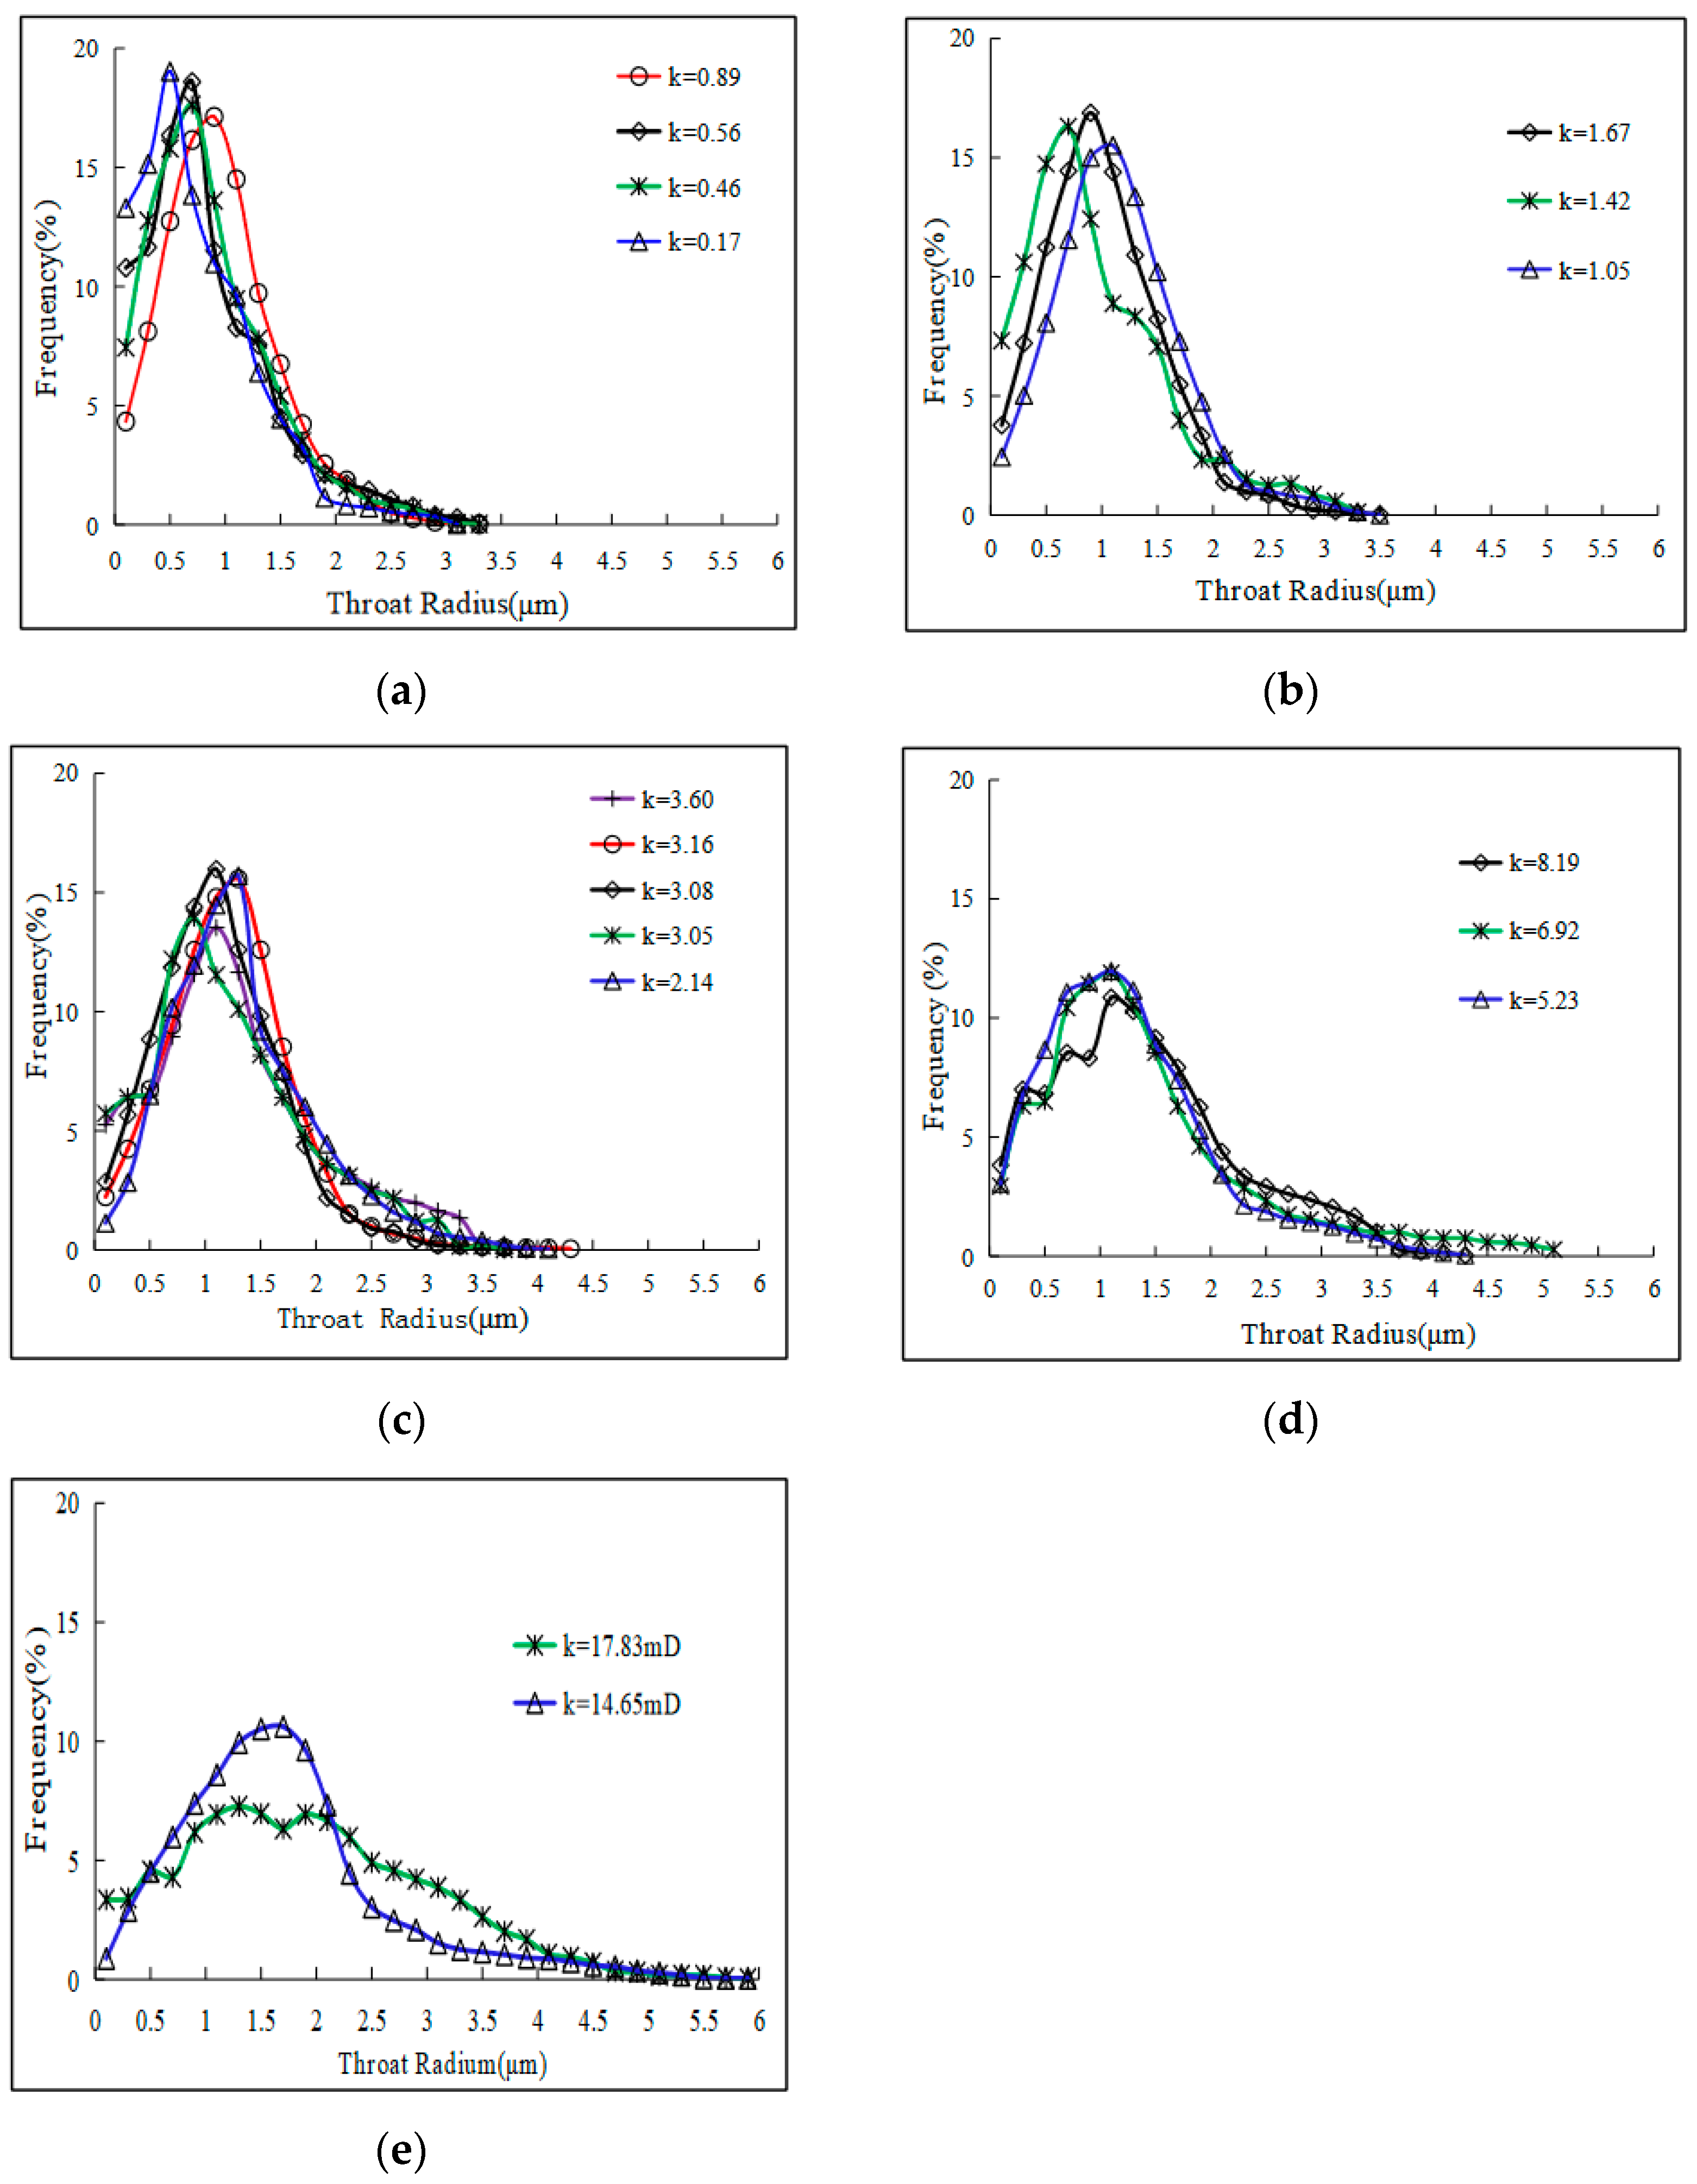
3. Microscopic Pore Structure

Based on the rock properties, cast flakes, ordinary flakes, SEM images, and other data of all the core samples in the study area, it is shown that the compositions of layers’ clastics are mainly quartz, feldspar, and rock cuttings. The particle size is between 0.088 mm and 0.3 mm, and the particle grains are mixed and have poor rounding. The pore types are classified according to the origin of the pores, and there are four types of pores: primary intragranular pores, reduced intergranular pores, intragranular pores, and sintercrystalline pores of clay minerals, among which primary intergranular pores account for 77.5% of the total pore types and are the main pore type. The formation of primary intergranular pores is controlled by the depositional environment, and the pores are formed by the contact of primary clastic particles with each other during the deposition process. For the throat connecting two pores, its size and shape depend on the particle contact relationship, the type of cementation, and the shape and size of the particles themselves, which indirectly indicates that the formation of the throat is closely related to the depositional environment. The pore size, type, structure, and throat size affect the location of residual oil distribution (Zhong X. et al. 2021; Liang X. et al. 2020) [5,26].
According to the analysis of cast flakes and SEM images, sandstone particles mainly have three contact relationships, namely, point–line contact, line–line contact, and suture contact, thus forming five types of throats, namely, sheet throat, curved sheet throat, tube bundle throat, pore-reducing throat, and necking throat. In the layers dominated by intergranular pores, pore-reducing and necking throats are mostly developed, which easily cause jamming and bypass during oil–water displacement, resulting in local accumulation of residual oil.
Figure 3 shows the distribution of the throat radius of 12 rock samples with different permeability in the closed coring well Well#1. The permeability range of the sample used for the experiment is in the range of 0.1–20 mD, which is representative and in line with the ultra-low-permeability characteristics of the study area. It is found that the throat radius is positively correlated with permeability. In Figure 3a, the throat radius of ultra-low-permeability samples (the sample’s permeability is at the level of less than 1 mD) is small (the average value is about 0.5 μm) and concentrated in a relatively narrow range (0.2~1 μm). In Figure 3b, the samples’ permeability is at the level of 1~2 mD, the average throat radius is about 1.0 μm, and the throat radius distribution range is 0.5~1.5 μm. In Figure 3c, the samples’ permeability is at the level of 2~5 mD, the average throat radius is 1.2 μm, and the throat radius distribution range is 0.5–2.0 μm. In Figure 3d, the samples’ permeability is at the level of 5~10 mD, the average throat radius is 1.4 μm, and the throat radius distribution range is 0.3–3.2 μm. In Figure 3e, the samples’ permeability is at the level of 10~20 mD, the average throat radius is 1.9 μm, and the throat radius distribution range is 0.3–4.0 μm. As the permeability increases, the average throat radius increases, and the throat radius distribution range is large, indicating that even for the layers with better permeability, the internal throat radius difference is large and the heterogeneity is still significant.
Figure 4 shows the pore–throat ratio of the samples with different permeability. It can be seen that the pore–throat ratio is relatively large. As the permeability increases, the pore–throat radius increases and the pore–throat ratio gradually decreases (Li P. et al. (2017)) [8]. The average values of the peak values of the pore–throat ratio curves of several samples are 150, 120, 90, 70, and 50 in 5 permeability levels, respectively. If the distribution curve of each pore–throat ratio is regarded as a normal distribution, the width of its confidence interval reflects the number of pores and throat types in the rock sample. The larger the width, the more types there are and the greater the difference between them. It can be seen from Figure 4c,d that when the sample’s permeability is in the range of 2–10 mD, which is the main distribution range of the oil layer’s permeability in the study area, the pore–throat ratio is distributed within a relatively wide range of 50–150. It further illustrates that the types of pores and throats within the oil layer in the study area are many types and broadly different.
Figure 3 and Figure 4 illustrate that the narrow throat radius and wide scope of the pore–throat ratio, as well as a variety of pores and throat types, further increase the complexity of the pore structure of the layers, which in turn seriously affects the fluid seepage ability and reduces the development effect of the oil reservoir.
The results of constant-rate mercury intrusion experiments on these cores also confirm these points. The experiment shows that the average throat radius of the rock sample is 0.648 μm, the average pore–throat ratio is about 244, the average capillary radius is 0.636 μm, the average mainstream throat radius is 0.550 μm, and the average maximum connected throat radius is 0.915 μm. The high displacement pressure in the experiment, with an average value of about 1.114 MPa, indicates that this type of tight oil reservoir has poor natural productivity and a low oil recovery rate in its original state or before treatments have been implemented.

4. Microscopically Visualized Water Flooding Experiment

The photolithography glass model technology can make an image of the residual oil distribution during the water displacement experiment (Xiaoli Zhang et al., 2017) [12]. Using this technology, a microscopically visualized water flooding experiment was carried out on the samples of Well#1 in Figure 3 to observe the microscopic distribution and patterns of the residual oil of the samples with different permeability at different water cutting stages (Decheng Zhang et al., 2017) [27] so as to deduce the residual oil distribution characteristics inside the layers of the study area.
The experiment was conducted as follows: Firstly, a sample was placed on the holder of a photolithographically fabricated glass model, and the space where the sample was located was filled with crude oil to saturate the sample. Secondly, the space where the crude oil-saturated sample was located was evacuated, and the crude oil was displaced with water at a rate of 0.2 mL/h and at a constant temperature of 45 °C to simulate on-site water injection. The microscopic seepage process was observed in the water flooding process. The dynamic images of residual oil in each rock sample at different water-bearing stages during the flooding process were collected.

5. Experimental Results and Analysis

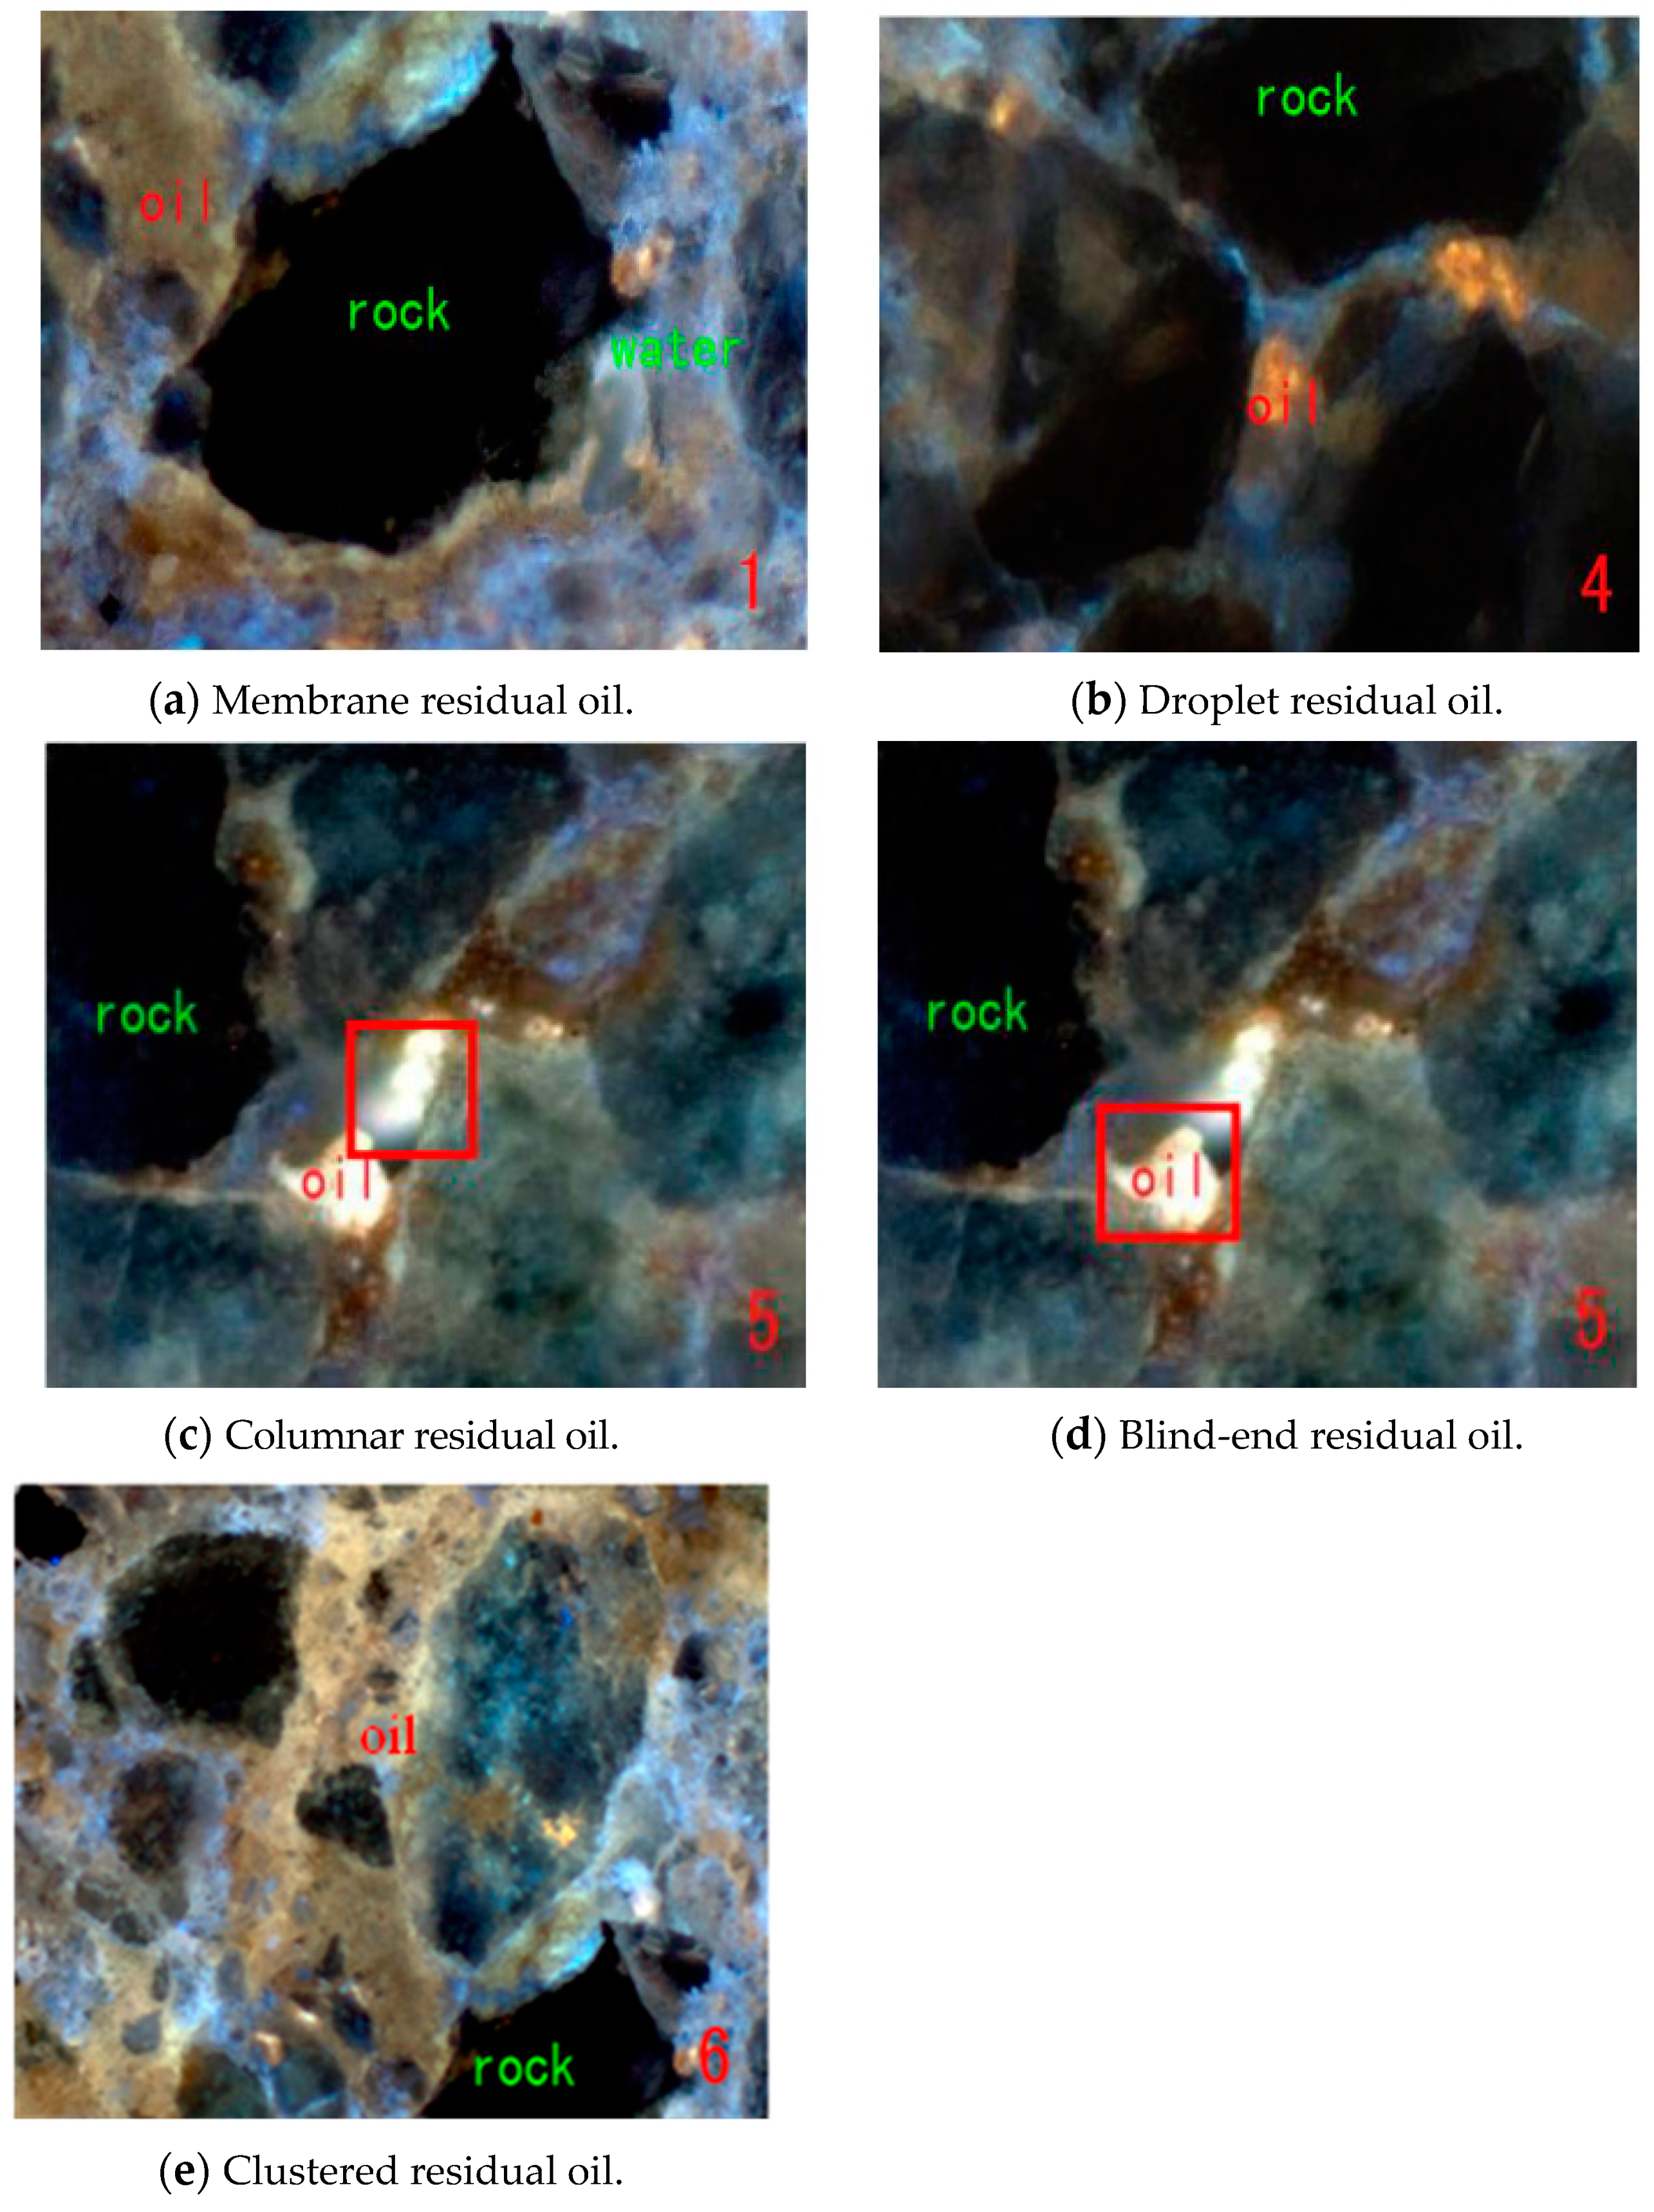
5.1. Microscopic Residual Oil Types

During the displacement process, the residual oil in the sample shows five typical microscopic states, namely, membrane residual oil, droplet residual oil, clustered residual oil, blind-end residual oil, and columnar residual oil (see Figure 5). These images further illustrate that the throat radius is relatively small in the layers of the study area, the pore–throat ratio is relatively large, the throat radius is widely ranged, the number of pores connected to the throat is small, and the throat is tortuous. The results of the visualization experiment show that the residual oil in the layers has diverse types, scattered distribution, and a small scale and is mostly enriched in ultra-low-permeability parts. These results are consistent with the characteristics of a complex pore structure and an uneven distribution of residual oil in ultra-low-permeability reservoirs (Bultreys T. et al., 2015) [28].
A.
Membrane residual oil (Figure 5a): This refers to the crude oil adsorbed on the pore wall surface. When the adsorption force of the pore surface is greater than the viscous force of water, it is a type of residual oil that is attached to the rock surface in the form of a film. This type of remaining oil is positively correlated with the water flooding degree of the reservoir and occurs in a large amount in the lipophilic pores, which are channels connecting two independent oil bodies.
B.
Droplet residual oil (Figure 5b): During the water flooding process, the crude oil separates from the pore wall to form free oil droplets, which are carried and transported by water. However, due to the large size of oil droplets, when it passes the radius of a throat which is smaller than that of oil droplets, the high oil–water interfacial tension and the capillary resistance prevent the oil droplets to deform. Therefore, the residual oil is formed by stagnation at the mouth of the throat.
C.
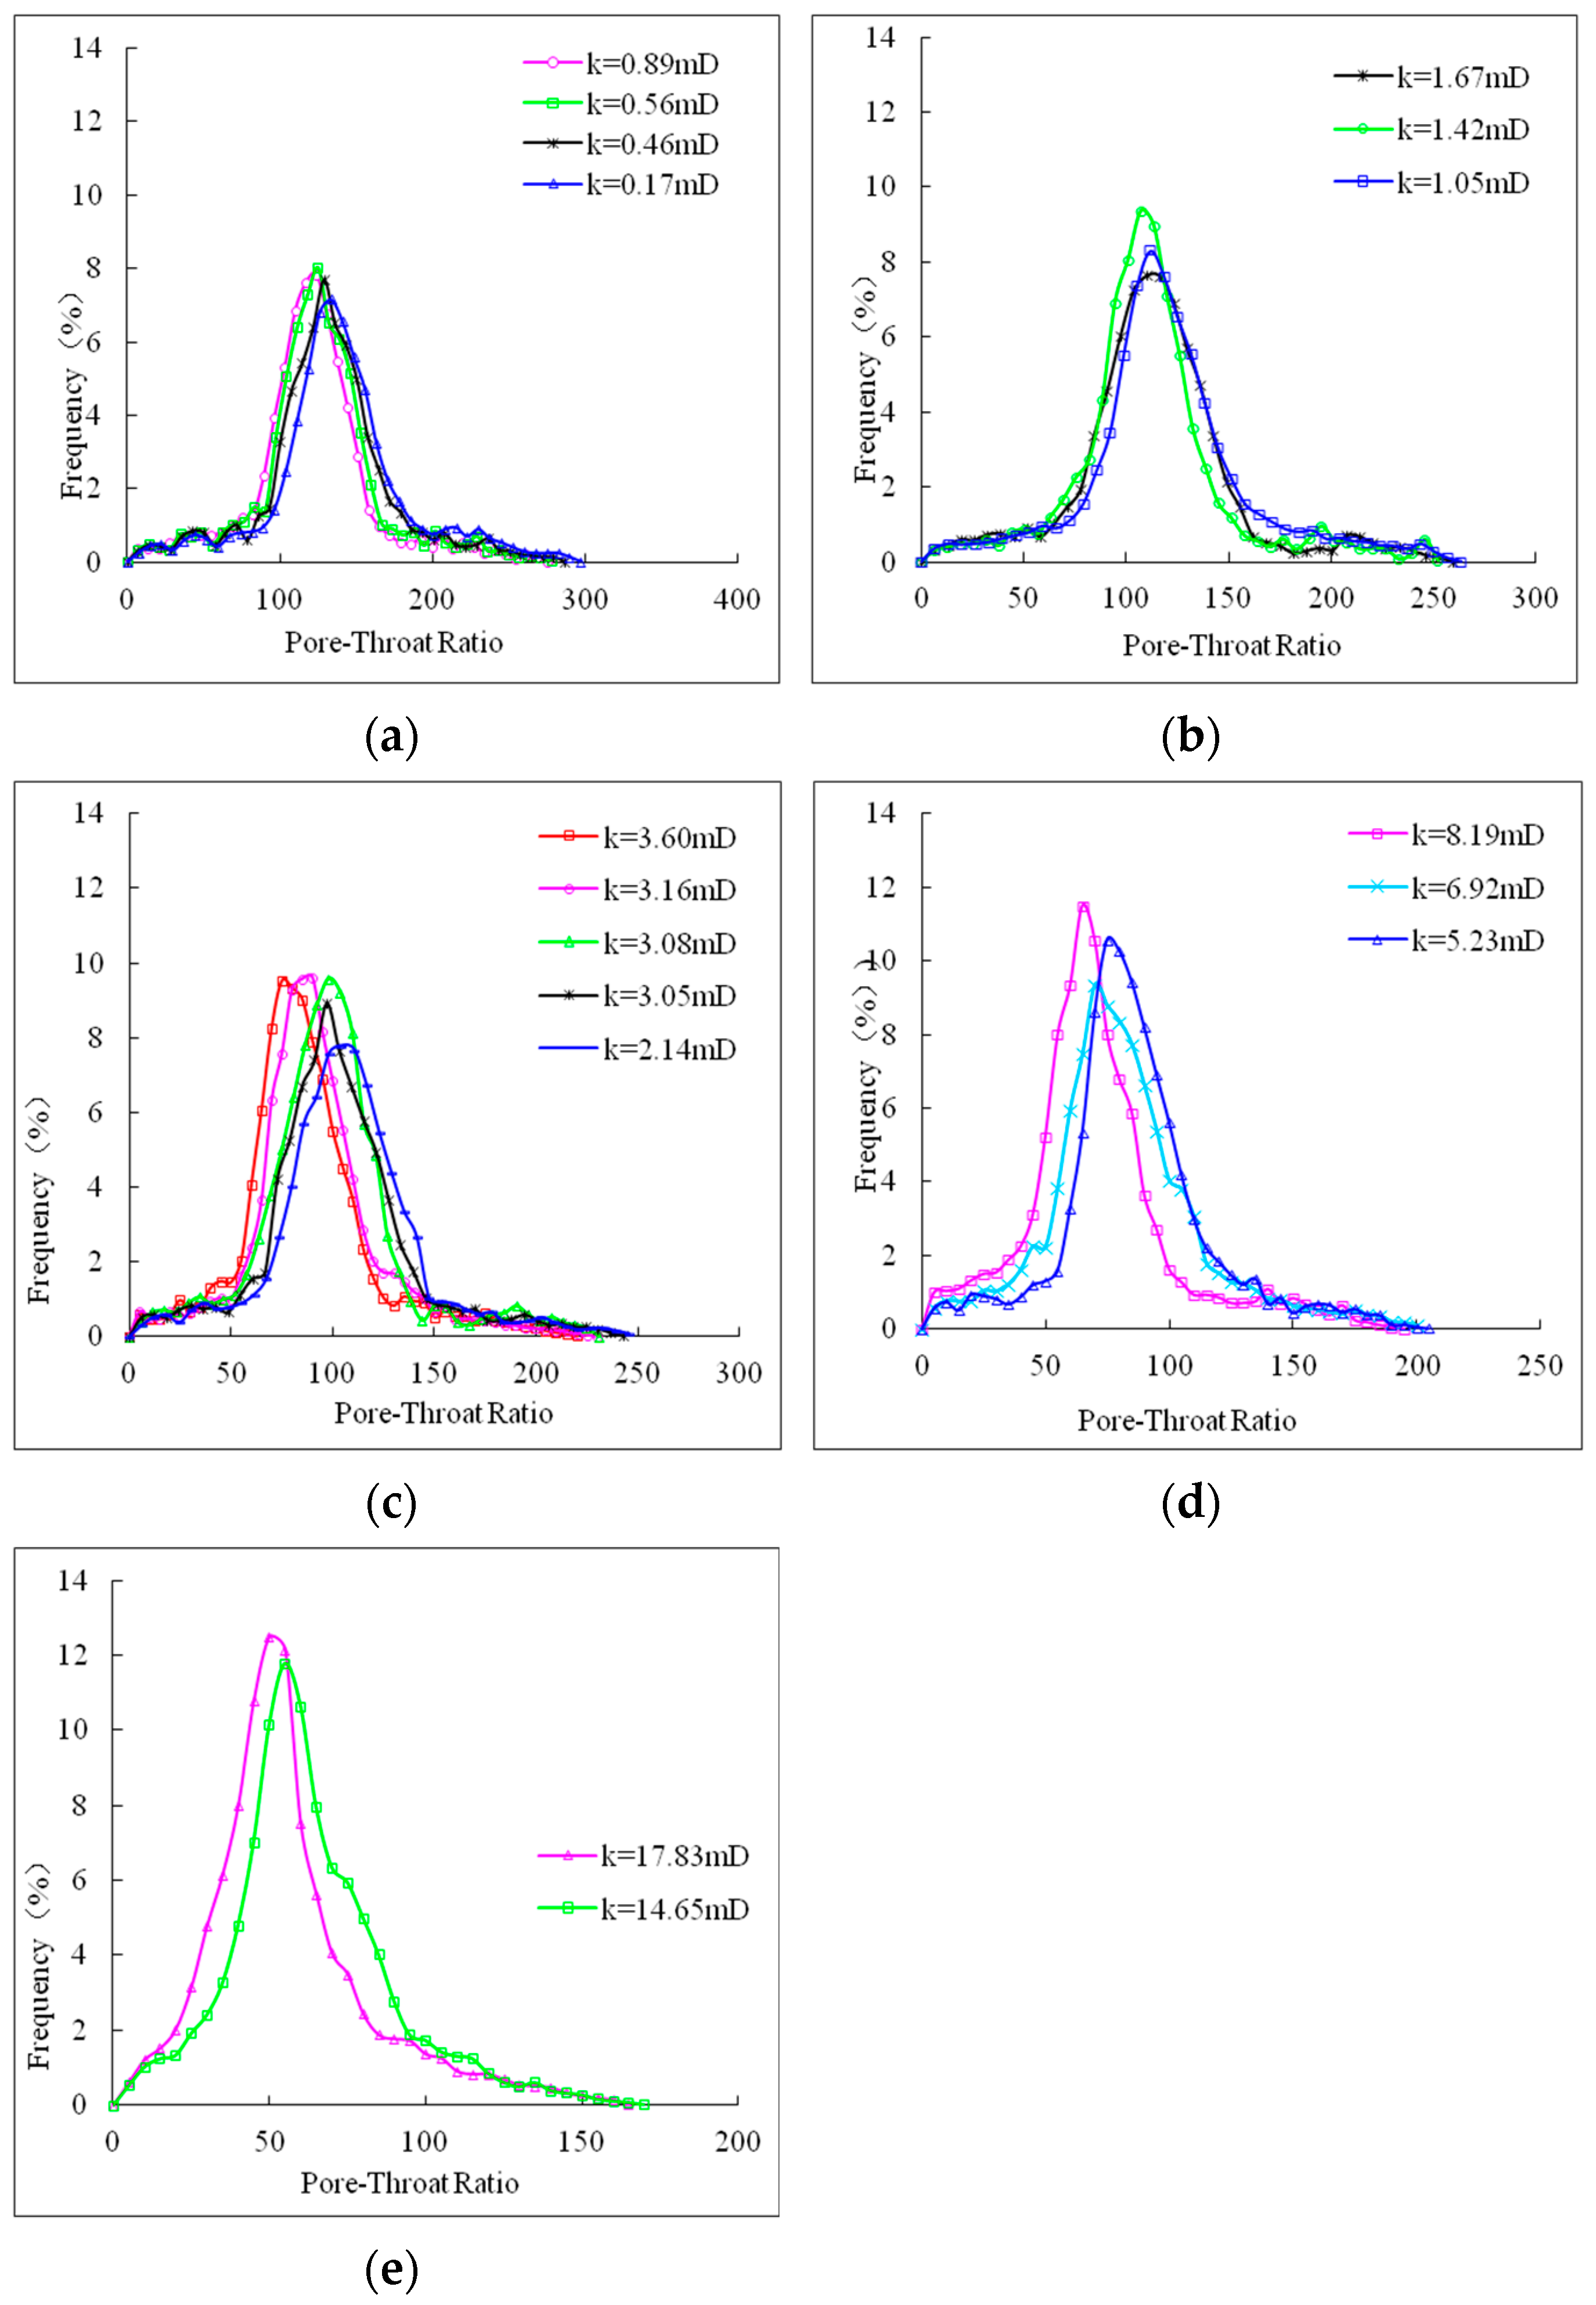
Columnar residual oil (Figure 5c): For low-permeability and ultra-low-permeability reservoirs, the pore–throat ratio is large and the difference in the distribution of pores and throats is relatively large. In small throats, the resistance formed by capillary force is relatively large (Cao Rongliang, 2019) [29]. The speed of the displacement fluid entering the large pores is much greater than that entering the small throats. When the displacement fluid breaks through the large pores, it will return to quickly surround the small throat, thereby forming a residual oil trap at the small throat. Consequently, a part of the oil in the small pore can be extracted or not be extracted. In this way, a columnar residual oil is formed.
D.
Blind-end residual oil (Figure 5d): In the process of water flooding, fluids tend to migrate in the direction of low potential energy; therefore, the pores in the water sweeping surface are interconnected, that is, there is an inlet and an outlet, but there is only one inlet in the blind end pore. If the injected water does not reach and causes the oil to stay in these pores, a blind-end-like residual oil will be formed. The formation of this kind of residual oil mainly depends on the shape of the pores.
E.
Clustered residual oil (Figure 5e): This kind of residual oil is ubiquitous. It often occurs in patches, but it will decrease in the late stage of water flooding. The difference in the radius of the pore and throat of the ultra-low-permeability reservoir causes the finger-like sweeping of injection water, and the clustered residual oil is left behind (Zahid M. A. et al., 2020) [30]. The oil often exists in smaller pores and throats or in large pores surrounded by small throats. In addition, the start-up pressure gradient is relatively large during the water flooding process in low-permeability reservoirs; when the displacement pressure difference is smaller than the start-up pressure gradient, clusters of residual oil will also be formed.

5.2. Microscopic Residual Oil Distribution at Different Water Cutting Stages

In the experiment, the residual oil is characterized by microscopical scanning in the model in different water cutting stages of cores with different permeability; the data are contained in Table 1. Table 1 shows the proportion of various residual oil distribution types in the samples with different permeability levels at different water cutting stages in the water flooding experiment mentioned in the previous section. The water cutting stage is divided into three parts: low, medium, and high according to the flooding water content, which is consistent with the layers’ flooding levels in actual production (Zhang Meiling et al., 2016) [31]. For samples in the same permeability level, when the water cutting increases, the proportion of clustered residual oil gradually decreases, and the residual oil of other discontinuous types increases; the oil displacement efficiency increases, and the oil saturation decreases. For example, for the samples with a permeability level of less than 1 mD, when the water cutting is low, the clustered residual oil accounts for 67.74% (=36.38/54.15), while the columnar, droplet, membrane, and blind-end residual oil are 8.77% (=4.75/54.15), 8.51% (=4.61/54.15), 7.33% (=3.97/54.15), and 7.65% (=4.14/54.15), respectively. Additionally, when the water cutting is high, the clustered residual oil accounts for 44.71% (=20.90/46.75), while columnar, droplet, membrane, and blind-end residual oil types account for 17.93% (=8.38/46.75), 18.33% (=8.57/46.75), 9.35% (=4.37/46.75), and 9.69% (=4.53/46.75), respectively; the oil displacement efficiency has changed from 8.83% to 21.23%, and the total residual oil saturation has changed from 54.15% to 46.75%. In the same water cutting stage, as the permeability level of the samples increases, the proportion of clustered residual oil gradually increases, the oil displacement efficiency gradually increases, and the residual oil saturation gradually decreases. For example, in the high water cutting stage, when the permeability of the sample is less than 1 mD, in the range of 2~5 mD, and higher than 10 mD, the proportion of clustered residual oil accounts for 44.71% (=20.90/46.75), 51.94% (=22.39/43.11), and 69.74% (=24.39/34.97), respectively; the oil displacement efficiency is 21.23%, 29.83%, and 47.25%, respectively; and total residual oil saturation is 46.75%, 43.10%, and 34.97%, respectively. Comprehensive analysis results show that the permeability value and water cutting inside the reservoir are positively correlated with oil displacement efficiency. Therefore, it can be inferred that the permeability value and water cutting inside the layers are positively related to the oil displacement efficiency but are inversely related to the residual oil saturation (Sajjad Rabbani H., 2019) [32].
Analyzing the data in Table 1, it can be seen that the clustered residual oil accounts for the largest proportion in the low-permeability samples. Additionally, as the water cut increases, the proportion of clustered residual oil decreases, and the proportion of other types of residual oil tends to increase. Among them, the proportion of columnar residual oil is relatively large, but the clustered residual oil still accounts for the main proportion. The existence of this situation is due to the large seepage resistance in the low-permeability samples, resulting in a slow fluid flow rate; therefore, it is easy to form clusters of residual oil. When the displacement fluid continues to be injected, the fluid migrates to a certain throat, and the crude oil is displaced and migrated under the action of the displacement pressure difference, the clustered residual oil tends to be broken down into columnar residual oil; therefore, the proportion of columnar residual oil increased. The effective stress that is exerted by rocks with different porosity and permeability on their internal fluids is also different, and they are negatively correlated (SA Moosavi et al., 2014) [33]. It can be seen from Figure 3 and Figure 4 that the porosity and permeability of reservoir rock samples are low in the study area and that the pore throat radius is different; it will lead to uneven resistance when water is injected to replace the oil in the pores. The clustered residual oil cannot be completely displaced in the reservoir and becomes more scattered columnar, oil droplets, membrane, and blind end residual oil.
Therefore, in view of the strong heterogeneity of the Fuyang reservoir, the internal pore structure of the layers determines the location of different types of residual oil distribution. Residual oil in the form of membranes and droplets is often distributed in the position of a layer where the permeability is large and homogeneous and the water flooding effect is better. In locations with low-permeability and strong heterogeneity of a layer, three types of residual oil, columnar, blind-end, and clustered, are likely to be formed due to the small water flooding area or the lack of displacement.

6. Strategies to Improve Residual Oil Recovery

In the process of water injection development, the residual oil stays in the updip part of the lateral accretion body of the meandering river point bar with fine rock particles, low-permeability, and strong heterogeneity. Therefore, the residual oil is locally distributed on the plane, resulting in a low oil displacement efficiency of production wells. In the water displacement experiment on the actual samples, it was found that the microscopic residual oil types are diverse, especially in the high water cutting stage, the residual oil in columnar, droplet, and blind-end shapes has a large proportion and shows a serious discontinuous state. In view of the distribution characteristics of the residual oil in Fuyang reservoirs, it is found that strategies such as changing the displacement direction and periodically injecting the displacement fluid can improve oil recovery. In view of the effectiveness of the experiment, the permeability of the representative samples in three levels of permeability was selected during the experiment. The permeability of the samples was 3.05 mD, 8.19 mD, and 14.65 mD.

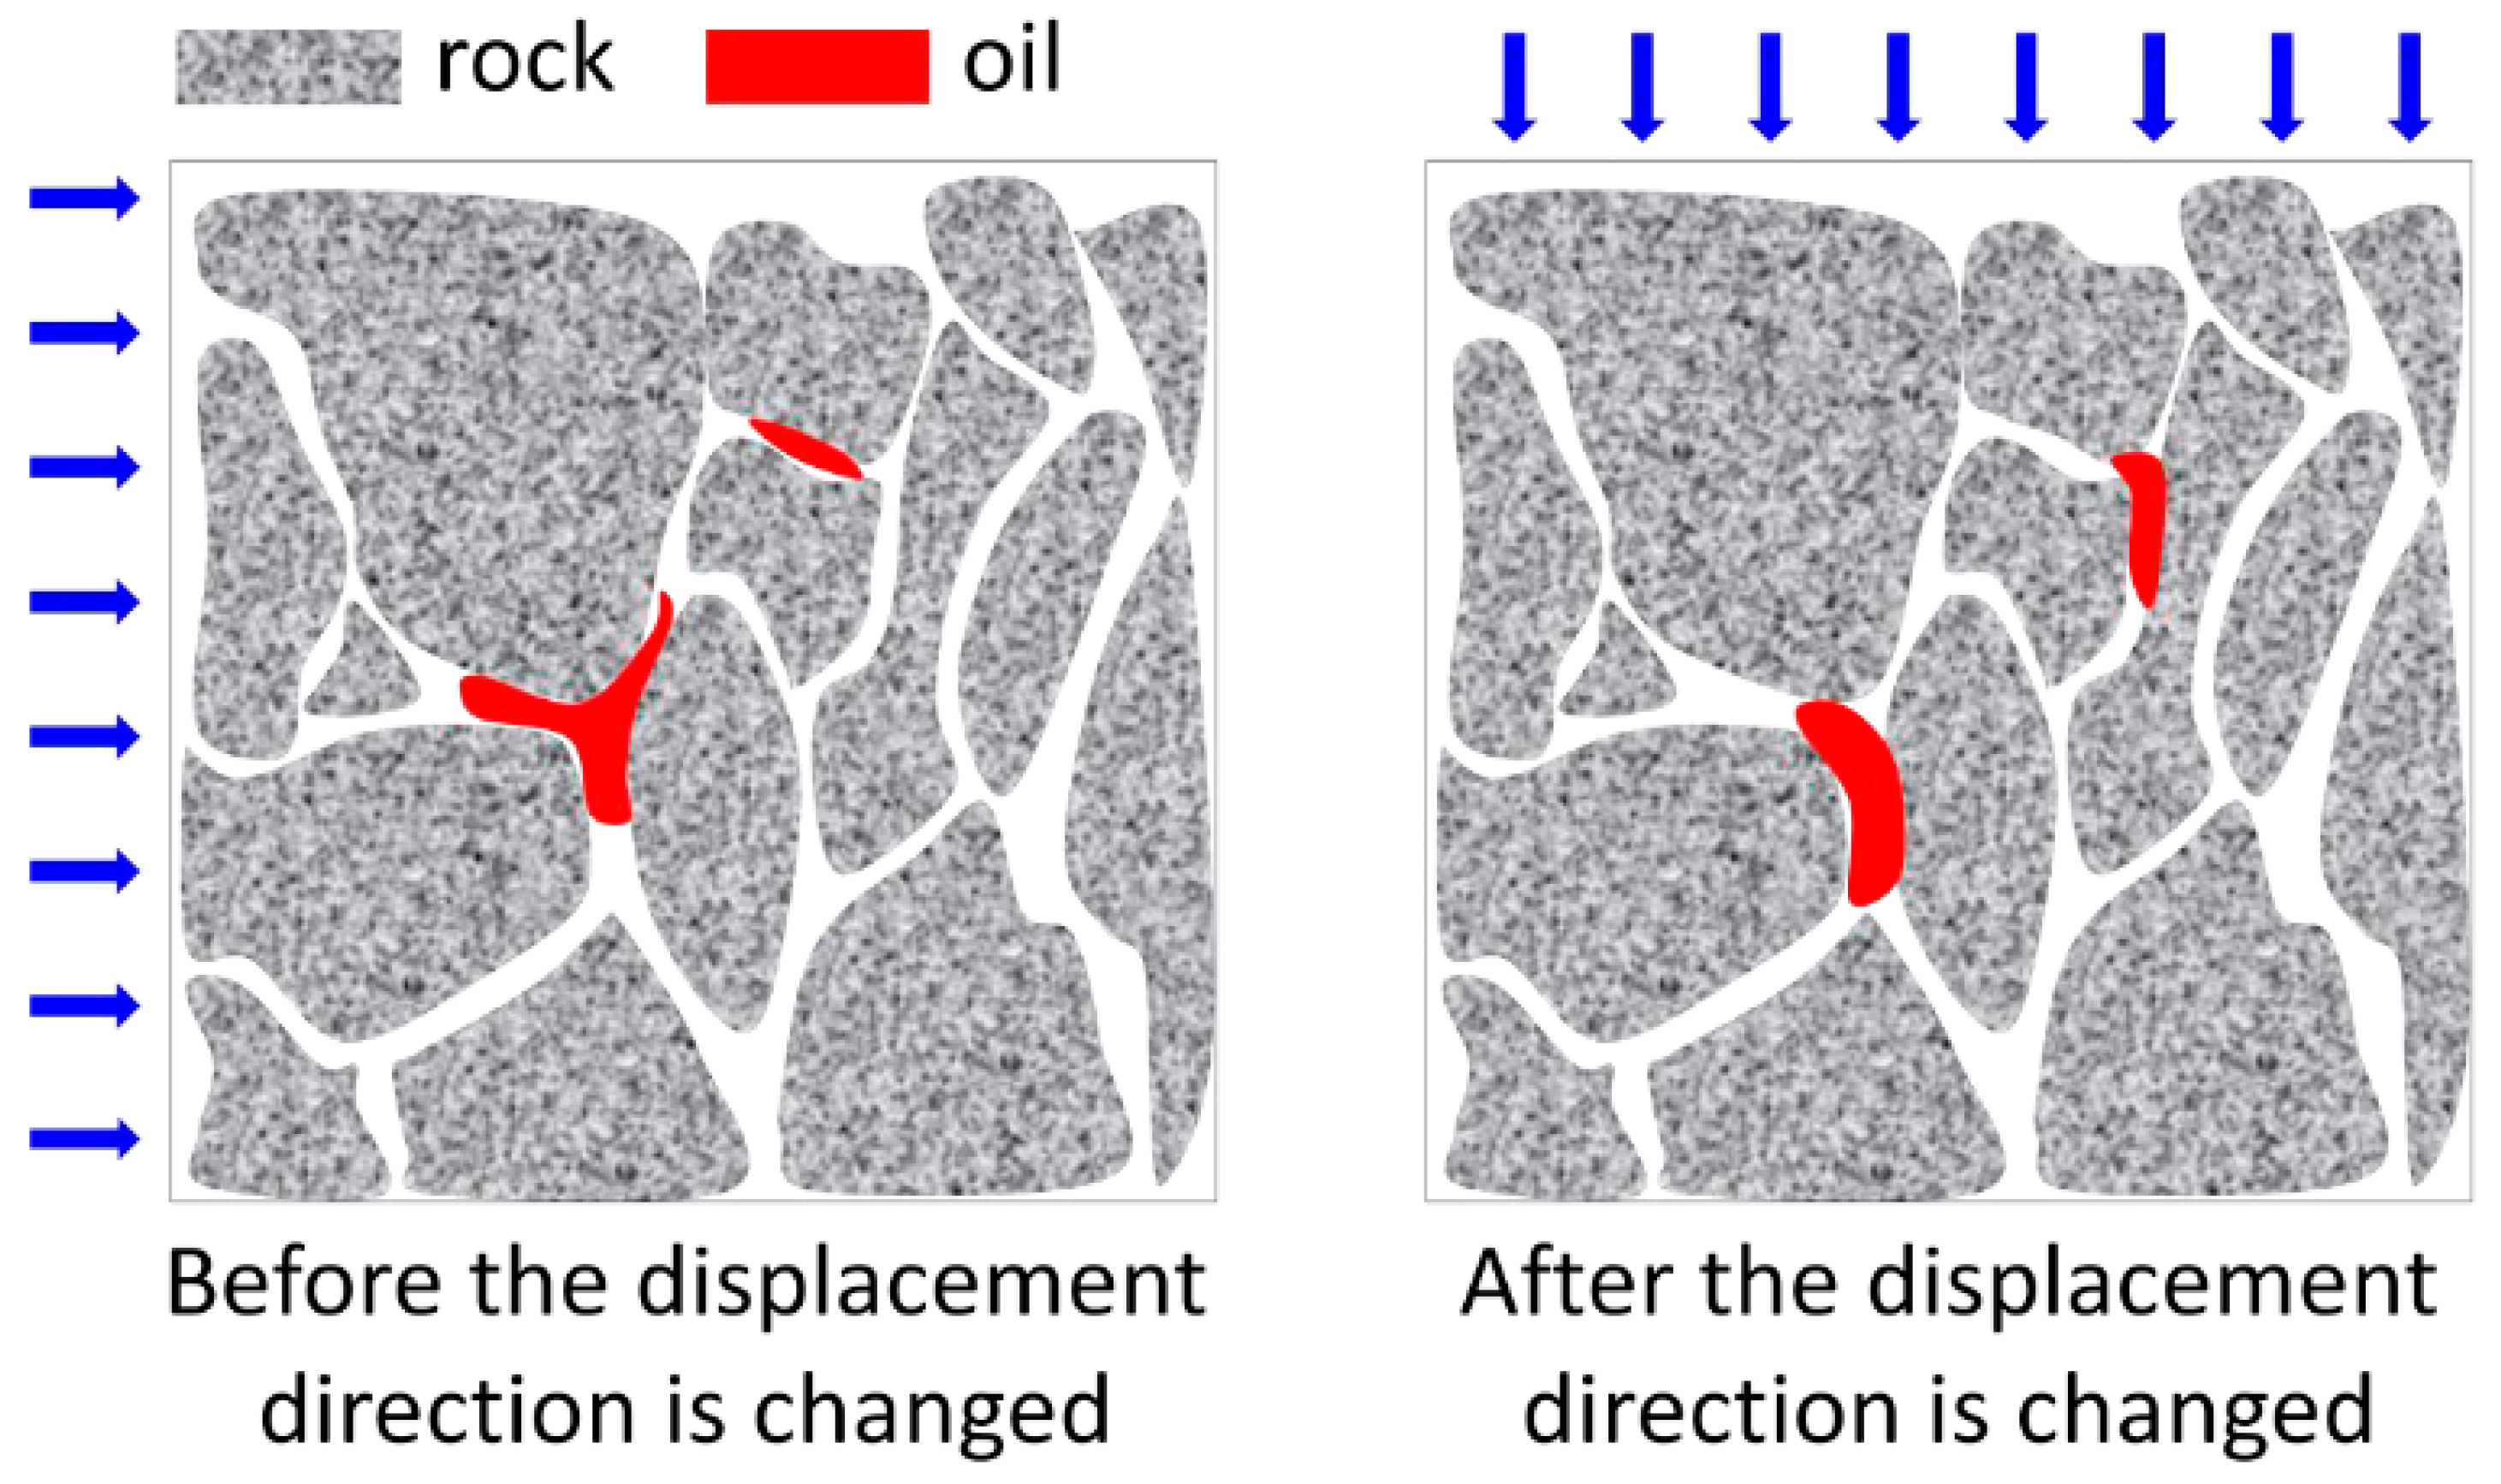
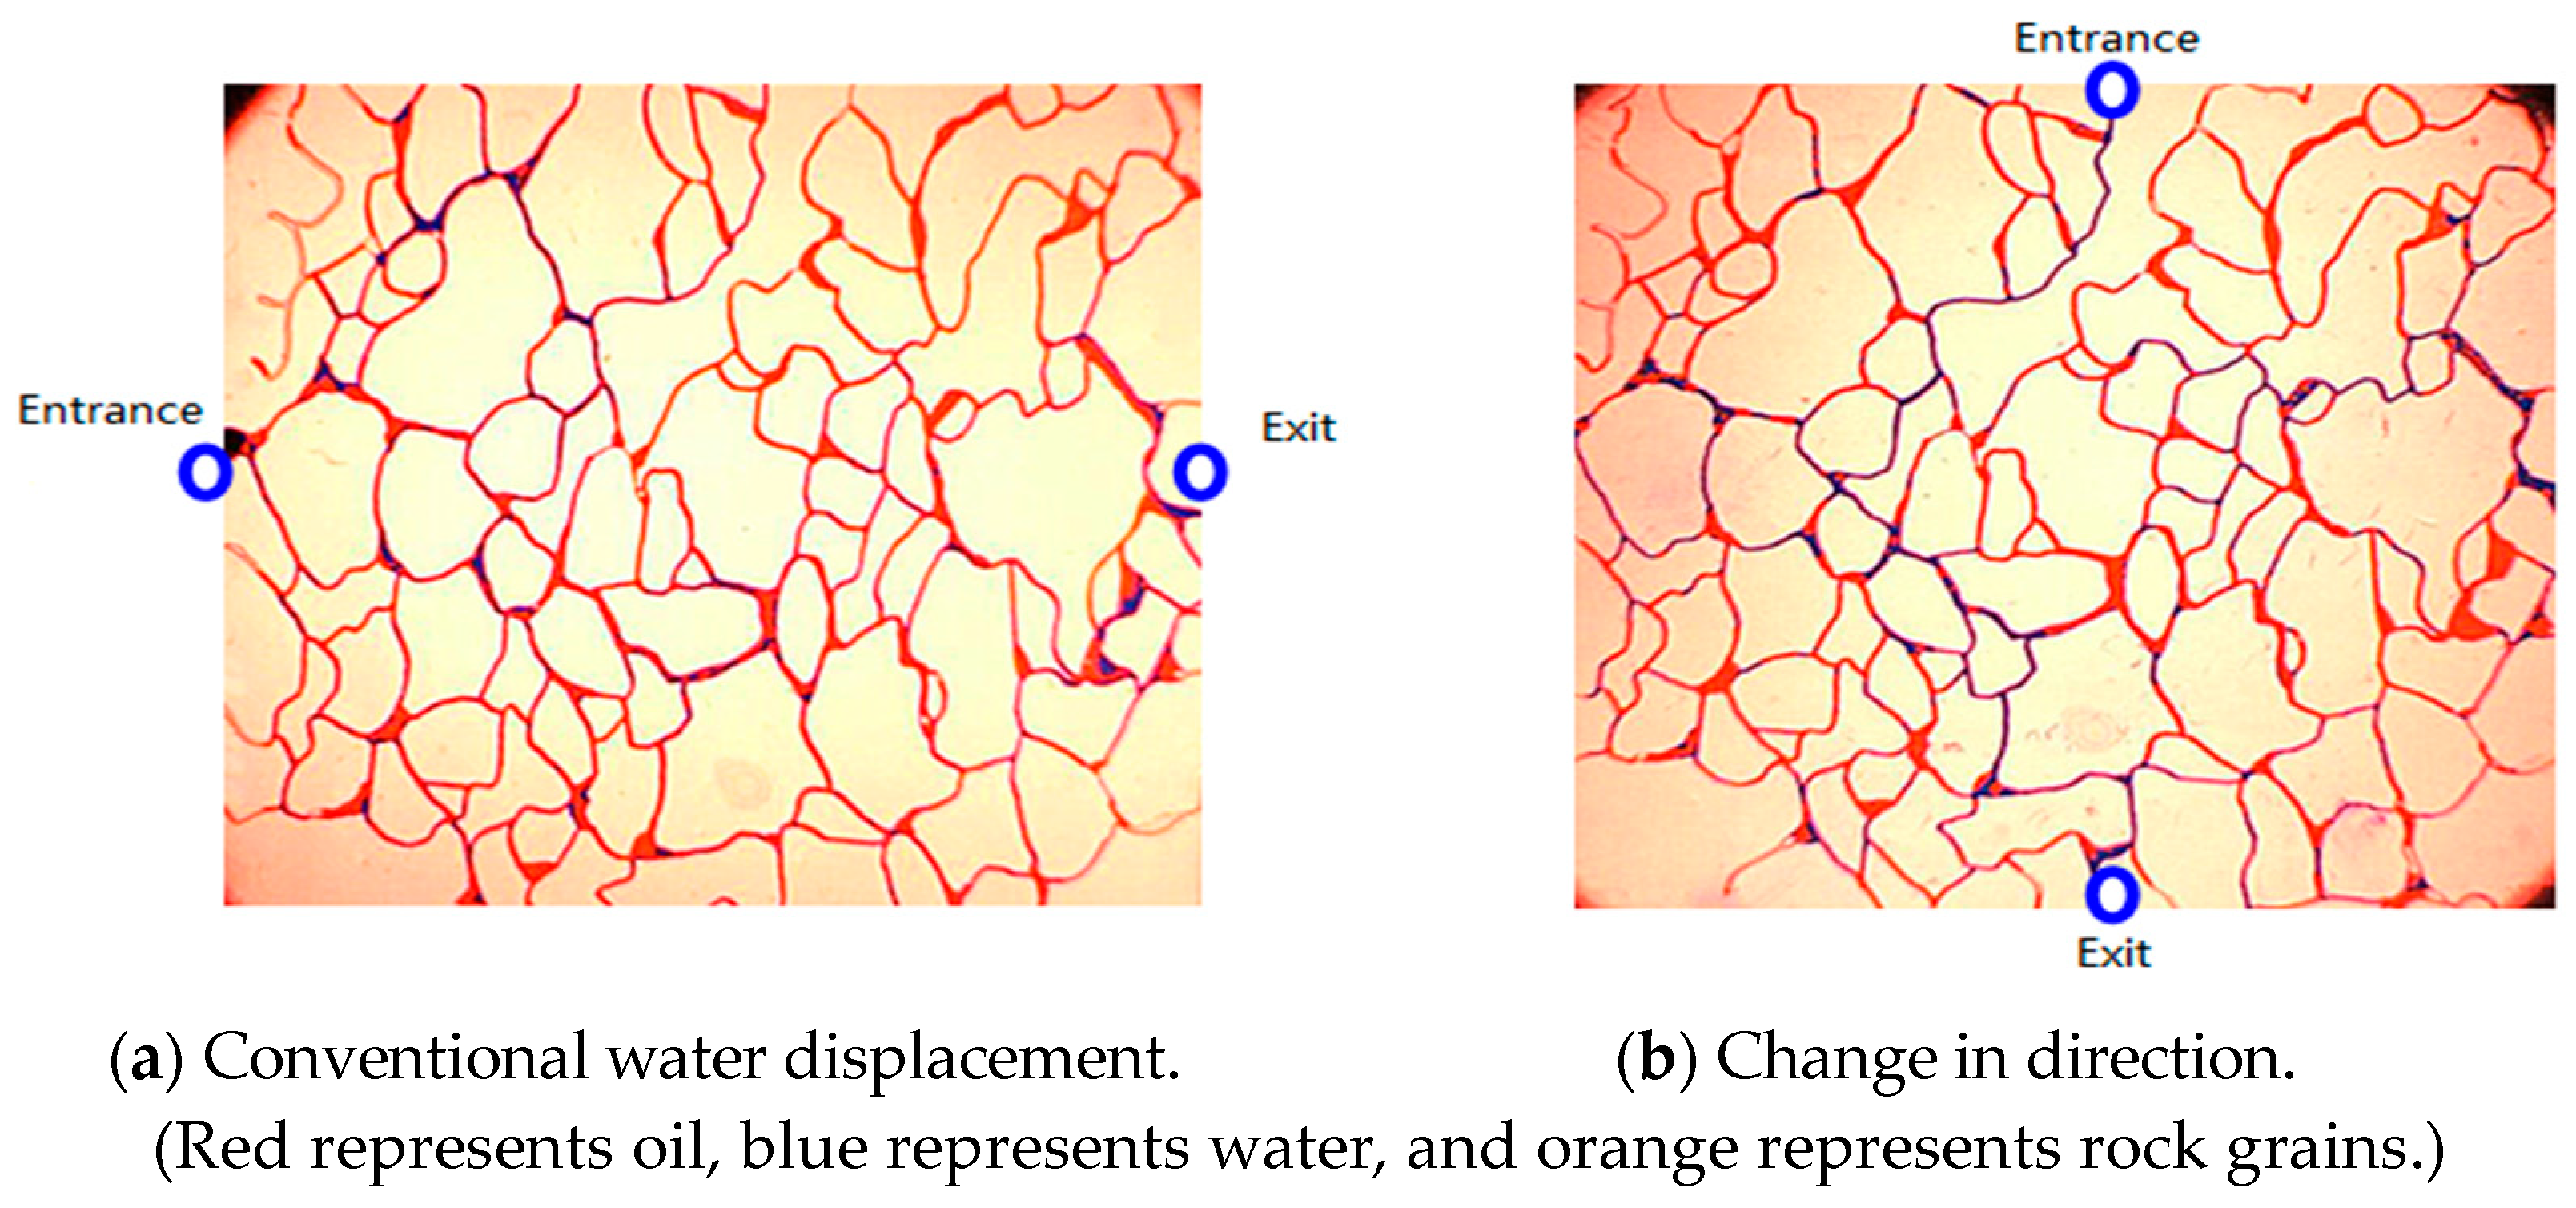
6.1. Change of the Direction of Displacement

The experiment of changing the displacement direction was carried out using the photolithographically fabricated glass model. The volume of the photolithography model in the device was 40 mm × 40 mm, through which the water displacing direction could be observed.
The experimental process and conditions were the same. Firstly, an oil-saturated sample was flooded with water in the conventional direction. When the water content of the produced fluid reached 100%, the displacement was stopped, and the shape and distribution of the residual oil in the model were photographed. Then, the displacement direction was changed to a direction perpendicular to the original displacement direction, and displacement of the crude oil in the model was continued at the same injection rate of 0.2 mL/h. When the water content of the produced fluid reached 100% again, the displacement was stopped, and the shape and distribution of the residual oil in the model were photographed. Finally, the quantity and proportion of various types of residual oil after two displacement stages were counted and calculated.
Figure 6 shows the basic principle of changing the displacement direction to improve the oil displacement efficiency. In conventional water flooding, with the increase of displacement fluid, fingering occurs during the injection process and some of the fingertips with high porosity and permeability form dominant seepage channels with lower seepage resistance. The water with less viscosity flows along the dominant seepage channel. Even with continuous water injection, all types of residual oil will not change significantly, and there is still more residual oil in other pores and throats not swept by the injected water. Therefore, the oil displacement efficiency is low when the displacement is completed. When the displacement direction is changed to vertical, the pressure field around the model and the displacement pressure difference increases simultaneously during the displacement process. The displacement direction avoids the original direction of the water flow, which can displace a large area of residual oil that is not affected by the original direction. Additionally, the clustered residual oil gradually decomposes into columnar residual oil, and finally, the static residual oil flows activates and becomes movable residual oil.
Figure 7 shows the final residual oil images of a sample with a permeability of 3.05 mD after two displacement stages. It can be seen that the residual oil content in the image on the right is significantly reduced. Table 2 shows the proportion of residual oil types: residual oil saturation and oil displacement efficiency in the two displacement stages. It can be seen that after changing the displacement direction, various types of residual oil saturation are significantly changed, and the oil displacement efficiency is greatly improved. The recovery ratios of the three samples were increased by 3.21%, 2.67%, and 2.14%, respectively. The saturation values of clustered residual oil and columnar residual oil were reduced by (1.29%, 0.69%), (1.12%, 0.72%), and (0.86%, 0.75%). Additionally, the residual oil saturation is reduced by 1.99%, 1.74%, and 1.46%, respectively. Therefore, the residual oil can be effectively displaced.

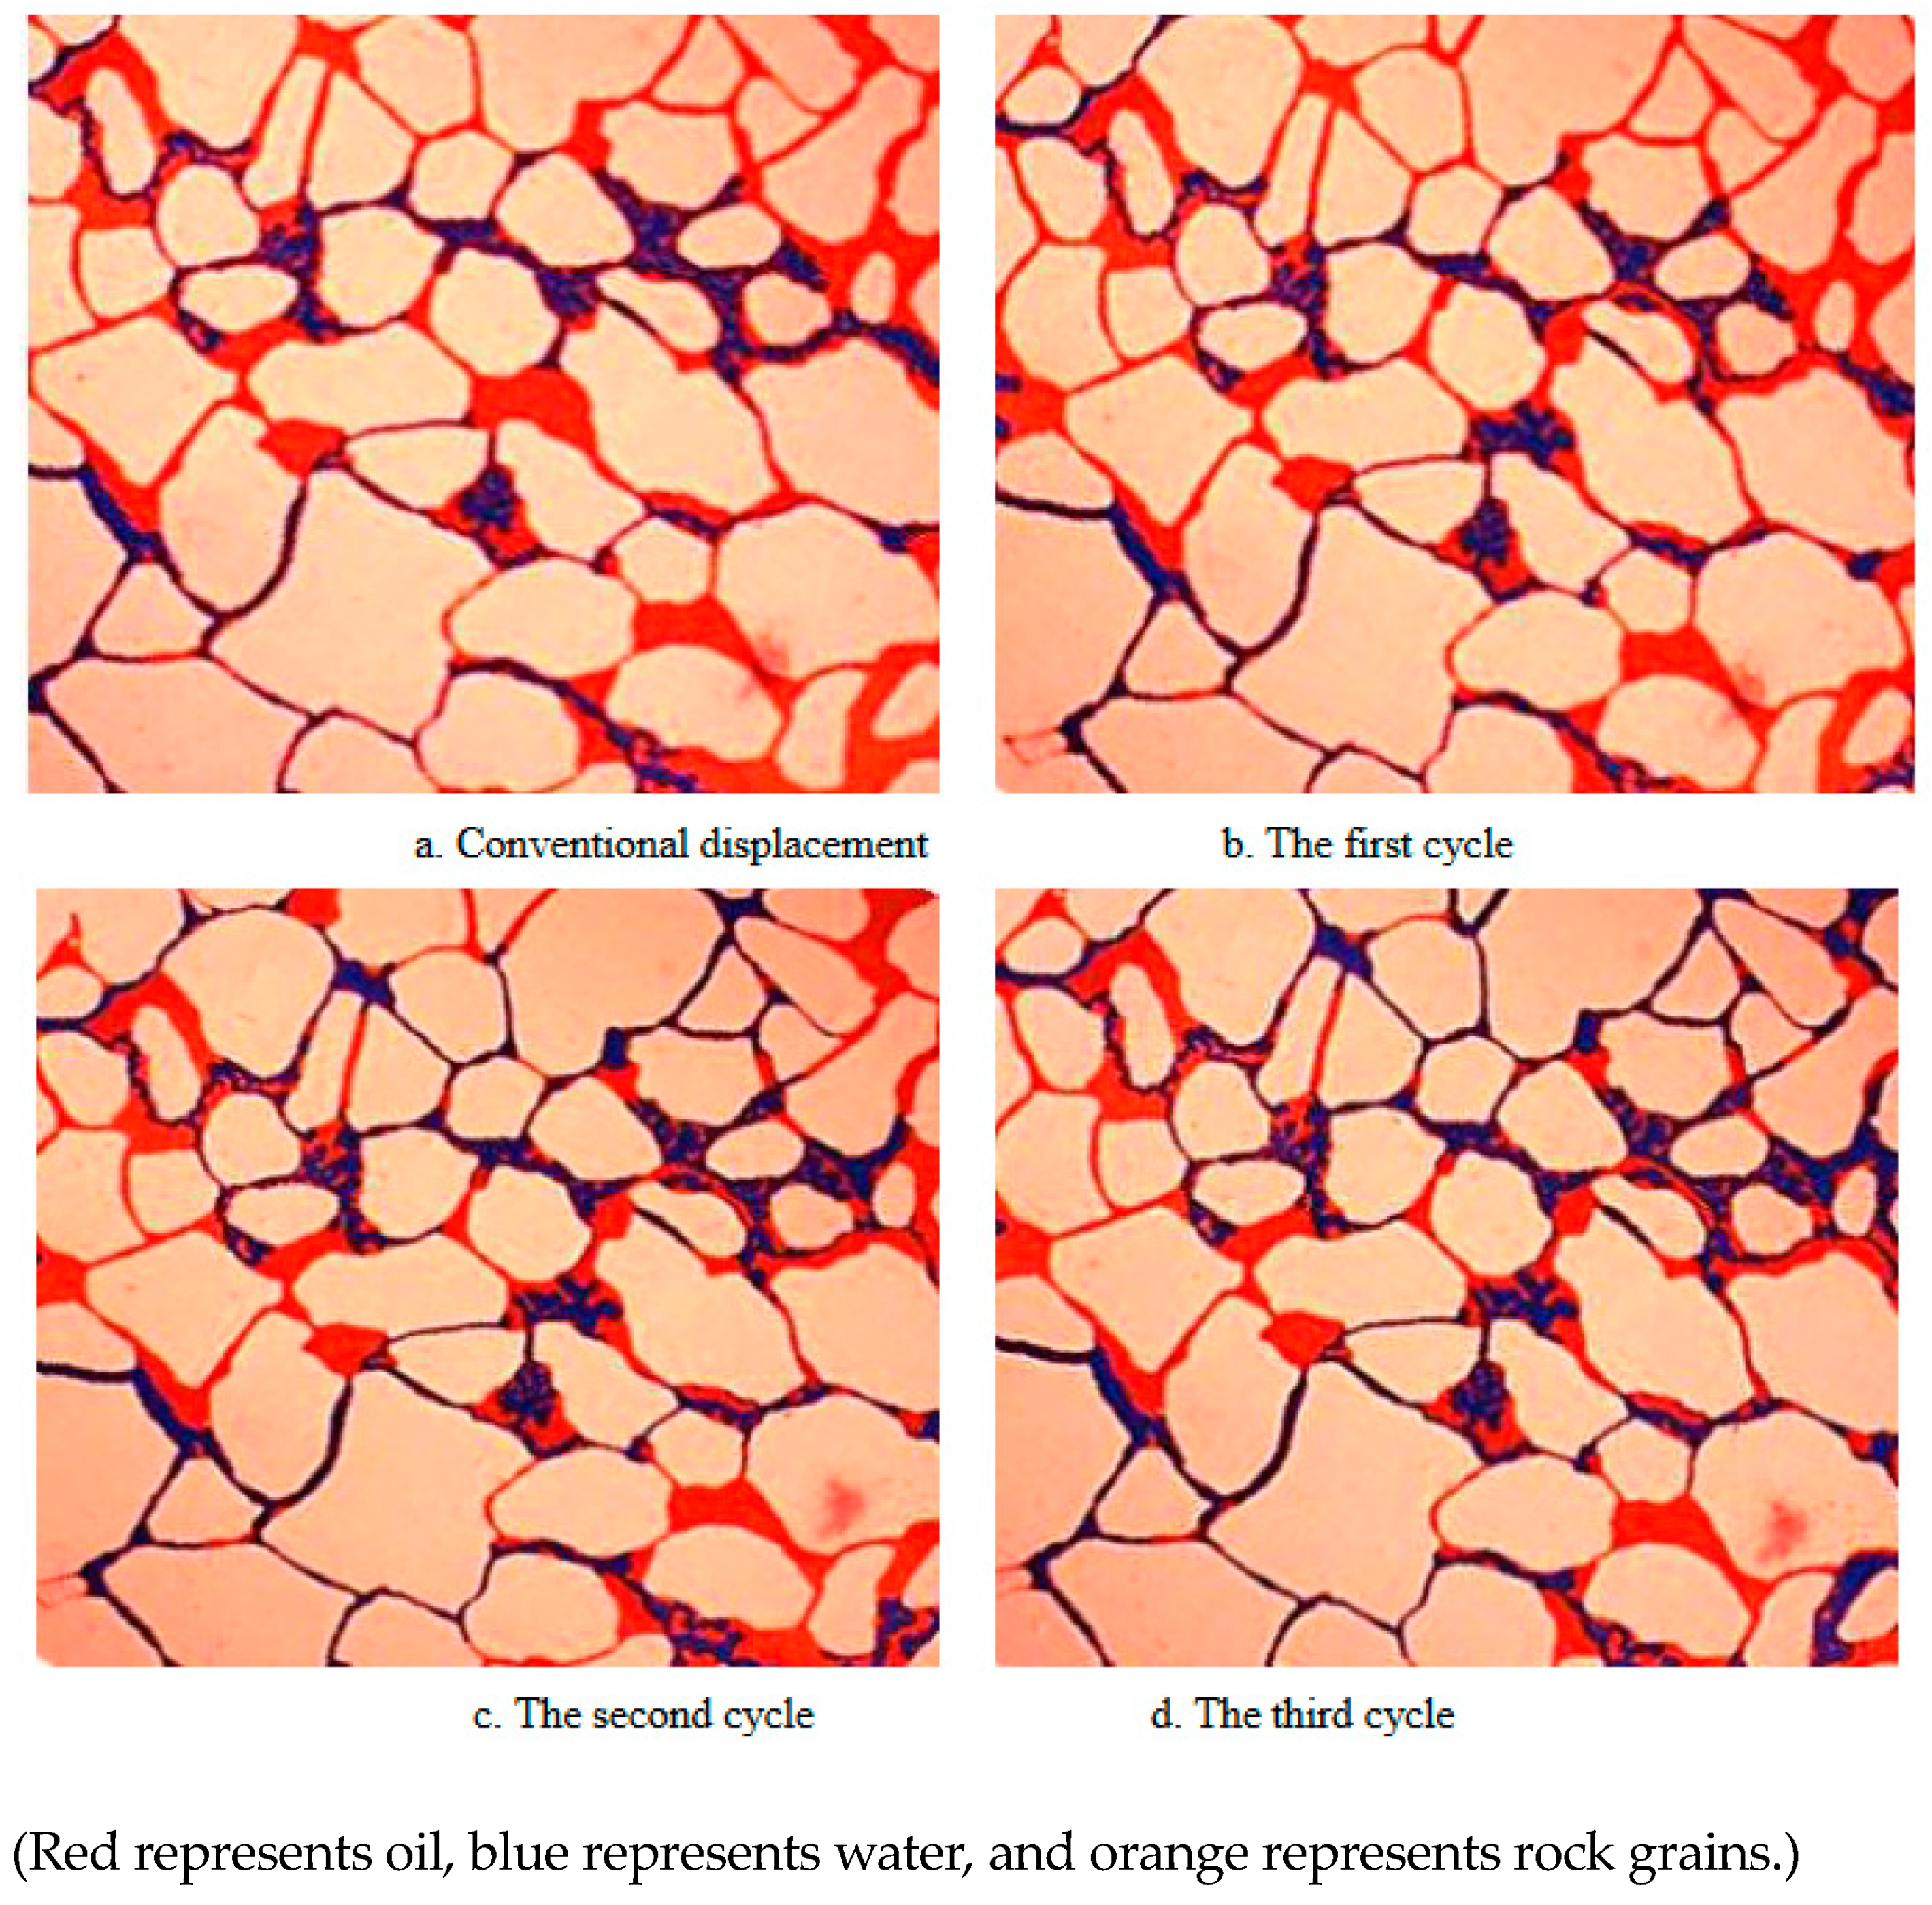
6.2. Periodic Injection

The Fuyang reservoir has a heterogeneous pore structure with a small throat radius and a large pore-to-throat ratio with a wide distribution range (see Figure 3 and Figure 4). The surface tension of the inner wall of the small throat is large, and it exhibits large capillary pressure and elastic resistance to the injected fluid (Zhao L. et al., 2022; Pål Ø. Andersen et al., 2017) [34,35]; therefore, in the actual development process of the oil reservoir with low-permeability, the situation of “difficult injection, difficult production, and local distribution of residual oil” appeared (for example, the area where Well#1 is located).
Figure 8 shows the basic principle of periodic water injection for enhancing oil recovery. Periodic water injection mainly refers to the use of a periodic increase and decrease of water injection to produce an unstable pressure drop inside the reservoir and an unstable flow of liquid between different permeability layers. During the water injection process of samples, the water injection pressure is low at the low-permeability part and spreads slowly, and a positive pressure difference is generated between the high-permeability part and the low-permeability part. The positive pressure difference causes the water to move from the high-permeability part to the low-permeability part. When the injection is stopped, because the pressure of the high-permeability part spreads faster, the pressure will drop rapidly and become lower. Additionally, the pressure of the low-permeability part will decrease slowly, so the pressure will become relatively higher than that of the high-permeability part. At this time, oil and water will flow back from the low-permeability part to the high-permeability part, and then some crude oil will enter the high-permeability part. When water is injected again, due to the low pressure of the high-permeability part, the residual oil is driven out along the direction of the water flow.
Periodic water injection and oil displacement experiments were performed on the photolithographically fabricated glass model. For comparison purposes, three rock samples with permeability equal to 3.05 mD, 8.19 mD, and 14.65 mD are still used. The preliminary settings and conditions of the experiment are the same as those in Section 4. The specific implementation processes are explained as follows.
Firstly, the sample saturated with crude oil was displaced with water. When the water content of the produced fluid reached 100%, the displacement was stopped, and the shape and distribution of the residual oil of the sample were photographed. Secondly, it entered the periodic water injection stages. In the first cycle, the sample was kept in the state when the injection was stopped for 3 h. At this time, the large capillary elastic resistance difference between the pore and the throat caused the oil in the sample to redistribute. Then, water displacement was performed on the sample until the water content of the produced fluid reached 100%, and the shape and distribution of the residual oil of the sample were photographed. In the second cycle, the sample was kept in the same state as when the injection was stopped for 3 h. At this time, the residual oil in the sample was redistributed again, and then the sample was displaced by water again until the water content of the produced fluid reached 100% and displacement was stopped. Then the shape and distribution of the residual oil of the sample were photographed. In the third cycle, the rock sample was kept in the state when the injection was stopped for 3 h. After the residual oil in the rock sample was redistributed again, water displacement was performed on this sample again until the water content of the produced fluid reached 100%. The shape and distribution of the residual oil of the sample were photographed. Finally, the quantity and saturation of various types of residual oil in the sample at each displacement stage were counted and calculated.
Figure 9 shows the microscopic residual oil distribution at each stage of periodic water injection of a sample with a permeability of 8.19 mD. It can be seen from the figure that as the number of injection cycles increases, the oil displacement efficiency gradually increases, and the columnar residual oil that is exchanged with water flows to the pores with a high water content under the action of capillary force. When the injection is stopped, the columnar residual oil flows out of the throat under the action of capillary force and enters the main channel. The position of the oil and water changes and the movable oil ratio increases. Table 3 shows the saturation of various residual oil types, total residual oil saturation, and oil displacement efficiency at each stage after the water injection of three samples. The remarkable effect of periodic water injection can be seen. For the three samples after the three cycles of injection, the oil displacement efficiency is 38.75%, 44.65%, and 49.34%, respectively. Compared with conventional water flooding, the oil displacement efficiency is increased by +7.5%, +5.83%, and +5.67%. The total residual oil saturation is 4.65%, 3.79%, and 3.86% lower than that of conventional water flooding. The saturation of the clustered residual oil and the columnar residual oil were reduced by (2.44%,1.08%), (2.22%,0.91%), and (2.84%,0.45%), respectively. Therefore, the residual oil could be effectively produced.

7. Implementation and Application of Strategy

7.1. Residual Oil Characteristics in the Study Area

Observation of the core columns from coring wells can intuitively deduce where the residual oil is distributed in the underground sandstone. The authors selected the coring wells located at different positions of the point bar of the meandering river on the plane to analyze the distribution characteristics of the residual oil in the Fuyang reservoir. According to the principle of dividing the internal building structure of the sand body, the point bar is constructed in the form of a lateral accretion body (Zhao J. et al., 2018) [36]. The sedimentary sequence of the point bar sand body of the meandering river conforms to the positive rhythm distribution on the whole, but due to the existence of drop siltation during its formation, several argillaceous interlayers, namely, lateral accretion mudstones, are formed. These thin lateral accretion mudstone layers are sandwiched in the lateral accretion sandstone bodies that present with different lithological combinations, such as sandstone–mudstone–sandstone, mudstone–sandstone–mudstone, etc. In addition, the point bar with different lateral accretion body combinations shows different heterogeneity and permeability. Meanwhile, due to the poor permeability of the lateral mudstone, it has a blocking effect on the flow of the displacement fluid entering the lateral accretion body, thereby severely controlling the distribution of residual oil.
When the point bar contains multiple mudstone–sandstone–mudstone lateral deposit bodies, due to the dual structure of sandstone and mudstone in the meandering river, its updip direction is floodplain deposits. Additionally, its single lateral accretion sand body is equivalent to updip-annihilate lithologic oil reservoirs. When a water injection well is located in a point bar, the displacement fluid migrates downward under the action of gravity. Since there is no oil drainage channel in the upward direction, the residual oil is concentrated in the lateral accretion sand body in the upward direction. This type of residual oil is called the “with injection but no recovery type”.
When there are production wells but no injection wells in a lateral accretion sand body, due to insufficient internal energy in the body, residual oil will be enriched in both the updip direction and the downdip direction of the sand body. This kind of residual oil is called “recovery without injection type”. Meanwhile, under the action of the downward cutting of the river, the lateral mudstone at the lower part of the point bar is washed away, and a permeable and interconnected lateral sandstone combination is formed at the bottom of the point bar. Under the action of water driving force, the oil at the bottom of the point bar will be migrated to both sides and the updip of the sandstone body. This residual oil is also named the “with injection but no recovery type”. In this way, when the distance between the oil production well and the water injection well in the point bar is greater than the thickness of the lateral mudstone body, the point bar with multiple lateral mudstone and sandstone combinations is considered as a whole. Due to the obstruction of the lateral mudstone body, two types of residual oil are formed in the upward dip part of the point bar: “with injection but no recovery type” and “recovery without injection type”. At the same time, due to the gravity effect of the fluid and its positive rhythm characteristics at the bottom of the point dam, it is often easy to cause a dominant flooded channel (Liu X. et al., 2020; Omran M. et al., 2020) [37,38].

7.2. Analysis of Residual Oil in Coring Wells

Figure 10 shows an internal 3D geological model of the meandering river point bar in the Fuyang reservoir. This figure shows a detailed architectural structure with four lateral accretion sand bodies (No. 1, No. 2, No. 3, and No. 4). At the initial developing stage without water injection, four production wells were drilled, evaluated, and fractured in this area. The average output of a single well was 4.5 t/d in the early three months, but the output declined rapidly. One year later, the average single well production dropped to less than 0.1 t/d. Then, the subsequent 27 wells were drilled to improve productivity. However, the water was driven difficultly and little fluid was produced in the production wells. Therefore, in order to find where the residual oil was, two coring wells (Well#1 and Well#2) were drilled. By analyzing the data of coring wells at different development stages in the study area, it is proven that the three-dimensional architectural structure of meandering point bars affects the formation and distribution of residual oil. In Figure 10, Well#1 lies in an independent lateral accretion sand body (No. 2) without any injection wells, and Well#2 penetrates two lateral accretion bodies (No. 2 and No. 3). These two wells lie in the updip direction of different lateral accretion bodies. Water injection Well#3 lies in the down direction and penetrates a lateral accretion body (No. 3). The analysis of Well#1 and Well#2 can interpret the residual oil distribution of the Fuyang reservoir.
Well#1: This well is a closed coring well. The results of core observation and description indicate that the Fuyang reservoir in this well area is basically undeveloped and has obvious oil-bearing indicators. In the lithology track of Figure 11, the layer’s lithology (the well section 1574.8 m~1577.2 m) is brown oil-leached siltstone, which is impermeable to dripping water. The shale content and calcium content in the siltstone are relatively high, which are up to 6.4% and 2.63%. Due to the sedimentary environment and stratigraphic compaction, the sandstone is dense and has poor properties, its average permeability is 0.27 mD. The logging results show that the layer has high resistivity (LLD is 36.2Ωm and ILD is 31.8Ωm) and a low acoustic time difference (AC is 237 μs/m), which means it has high oil saturation and good porosity (Zhang M. et al., 2020) [15]. The gamma-ray is low (GR is 55.9 API) and the shift of the natural potential is large (SP = 25.5 mv). These values and the flat shape of logs mean that the sand body is in the point bar.
On the plane, production Well#1 falls on the independent No. 2 lateral sand body (shown in Figure 10), and injection Well#3 is located in the independent No. 3 lateral body. Well#1 and Well#3 are separated by the lateral mudstone body, which leads to oil production without energy supplement in the No. 2 lateral sand body; therefore, the No. 2 lateral accumulating sand body is not injected. Due to insufficient internal energy in the reservoir, the residual oil is enriched in both the updip direction and the downdip direction of the sandstone (Well#1). The results of coring from Well#1 indicate that the residual oil is enriched between wells in this area. The well was tested for network fracturing, the sandstone thickness was 6.8 m, and the average daily oil production was 8.6 tons, and industrial oil flow was obtained.
When comparing Well#2 with Well#1, we see that the reservoir and accumulation conditions of this well are similar. As shown in Figure 12, the layer is 1550 m deep, which is a fluvial channel sand body with an average porosity of 13.22% and an average permeability that is 1.42 mD. The reservoir is dense, heterogeneous, complex, and diverse in the pore throat structure. Scanning electron microscope observations show that the internal pores and connectivity of the rock are poorly developed, with mainly intergranular pores and intergranular secondary growth stones.
The core observation and description results show that the residual oil inside the reservoir is relatively rich, with oil-leached siltstone at the bottom and dripping water infiltrating it; the upper part is rich in oil siltstone, and dripping water is impermeable. The deep side of the logging results is 23.2 Ωm, and the induction resistance value is 27.6 Ωm; the micro-electrode micro-potential amplitude difference is 1.5 Ωm, the gamma value is 46 API, the spontaneous potential amplitude difference is 35.4 mv, and the acoustic time difference is 256 μs/m. Through comprehensive judgments such as logging interpretation, comprehensive core observation description, and oil test results, the bottom of this layer is a water-flooded layer. The reason is that the production Well#2 and the injection Well#3 are both located in the lateral body No. 3, and the No. 5 layer of the two wells are connected with each other (as shown in Figure 10). Well#2 is located in the updip direction of the lateral body, and Well#3 is located in the downdip direction; the area that is between the two wells can be effectively displaced. However, water flooding is not affected in the updip direction of the oil well, showing that there is production without injection and that the residual oil is enriched; however, there is injection without production in the downdip direction of the water well. The point bar forms stagnant deposits at the bottom during the deposition process, with large grain sizes and good physical properties. The dominant channel is first formed during the water injection process, and large pores are formed inside; therefore, a water-flooded layer is formed at the bottom (Well#2). After water plugging and hole repair, a single well currently produces two tons of oil per day.

7.3. Analysis of Development Effect in Well Site

It can be seen from Figure 10 that there are two main reasons for the poor development effect: one is the vertical obstruction of the mudstone lateral accumulation in the point bar so that the injected water cannot be affected, resulting in residual oil local accumulation; secondly, the coexistence of low-permeability bands and high-permeability bands within the sand body, the injected water flow in the fingers along the high-permeability bands, and the high-permeability bands that are called the dominant permeation channels for the injected water. In view of these two situations, the two strategies proposed in this paper, namely, changing the direction of water injection and periodic water injection, have achieved good results.
Figure 13a is the regional diagram of Well#1. The basic well network in this area adopts the ‘anti nine point’ mining method in this area; there are a total of six water injection wells, #439, #639, #442, #3, #644, and #444, respectively, and there are eighteen oil wells, #339, #340, #341, #342, #343, #344, #2, #441, #443, #539, #540, #541, #542, #543, #544, #1, #641, and #643, respectively. At this time, the source direction of injected water is single in some wells, and there is residual oil at the edge of the injected water. The water injection sources of #1, #2, #441, #443, and #643 are only east–west. The water injection sources of #339, #539, #344, #544, and #542 are only north–south. The water injection sources of #340, #341, #540, and #541 are only a corner well direction.
Table 4 shows the direction of the water injection of the oil well in Figure 13. In the table, ‘S’, ‘N’, ‘E’, and ‘W’ are used to represent the injection water from the south, north, east, and west, respectively. The ‘S-E’, ‘N-W’, ‘S-W’ and ‘E-N’ represent that the injected water comes from the southeast, northwest, southwest, and northeast, respectively. ‘+’ represents the coexistence of several directions. Taking Well#1 and Well#2 as an example, from the basic well pattern to the first, second, and third cycles, the direction change of water injection source of #1 is as follows: west (basic well pattern) → west + north (first cycle) → west (second cycle) → north (third cycle); the direction change of the water injection source of Well#2 is as follows: N (basic well pattern) → W + N + S (cycle 1) → W (cycle 2) → N + S (cycle 3).
First of all, some oil wells were transformed into water injection wells in the Well#1 area, which changed the direction of water injection and increased the affected area. Further, #340, #343, #540, and #543 were transformed into an injection well, as can be seen from Figure 13b; this well pattern is called the first cycle. In this cycle, #339, #342, #539, and #542 increased the injection water from the east; #341, #541, #344, and #544 increased the injection water from the west; #1 and #643 increased the injected water from the north source; and #2 and #443 increased the injected water in the south and north directions. After the above adjustment, the oil wells increased the source direction of the injected water with a rotation of 90° in the Well#1 area, and the spread range of the injected water increased by about 16%; the problem of the vertical obstruction of lateral accumulation of point bar mudstone is solved.
Secondly, the rotary cyclic water injection method was adopted, which is stopping injection for 3 months and reinjection for 3 months. The first cycle was implemented for 3 months; #340 and #540 were injected with water for 3 months, and #439 and #639 were stopped simultaneously for 3 months. At the same time, #343 and #543 were injected for 3 months, and #444 and #644 were injected for 3 months. In the second cycle, #439 and #639 were injected for 3 months, while #340 and #540 were stopped for 3 months. In the third cycle, #340 and #540 were injected for 3 months, and #439 and #639 were stopped for 3 months. Similarly, in the second cycle, #444 and #644 were injected for 3 months, and #343 and #543 were stopped for 3 months. In the third cycle, #343 and #543 were injected for 3 months, while #444 and #644 were stopped for 3 months. It is worth noting that during the cyclic waterflooding process, both #442 and #3 wells were waterflooding as wells.
At the same time, due to the periodic water injection method, the formation of the inertial finger channel of the injected water was suppressed in time, and the pressure of the residual oil in the small pores was alleviated. The average daily output of 14 oil wells increased from 1.23 tons to 1.59 tons, and the oil displacement efficiency increased by 44.28%.

8. Conclusions

(1)
The formation of internal pores and throats is affected by the depositional environment in the Fuyang oil reservoir. Primary intergranular pores and pore-reduced and necked throats are mainly developed. The ultra-low-permeability characteristics of the reservoir are remarkable, and the throat radius is positively correlated with permeability; therefore, the throat radius is small and concentrated. This type of pore throat is an important factor in the accumulation of local residual oil.
(2)
Research on the types and distribution of residual oil with the application of the laser confocal method and the microscopic visualization enabled through a photolithographically fabricated glass model shows that the micro-residual oil of the Fuyang reservoir can be divided into five types, which are clustered residual oil, columnar residual oil, droplet residual oil, membrane-like residual oil, and blind-end residual oil, according to the pore throat characteristics of low-permeability reservoirs. The study area is dominated by clustered residual oil, which accounts for 60% of the total. The clustered residual oil cannot be completely displaced with the continuous development of water injection and becomes more scattered columnar, oil droplet, membrane, and blind-end residual oil.
(3)
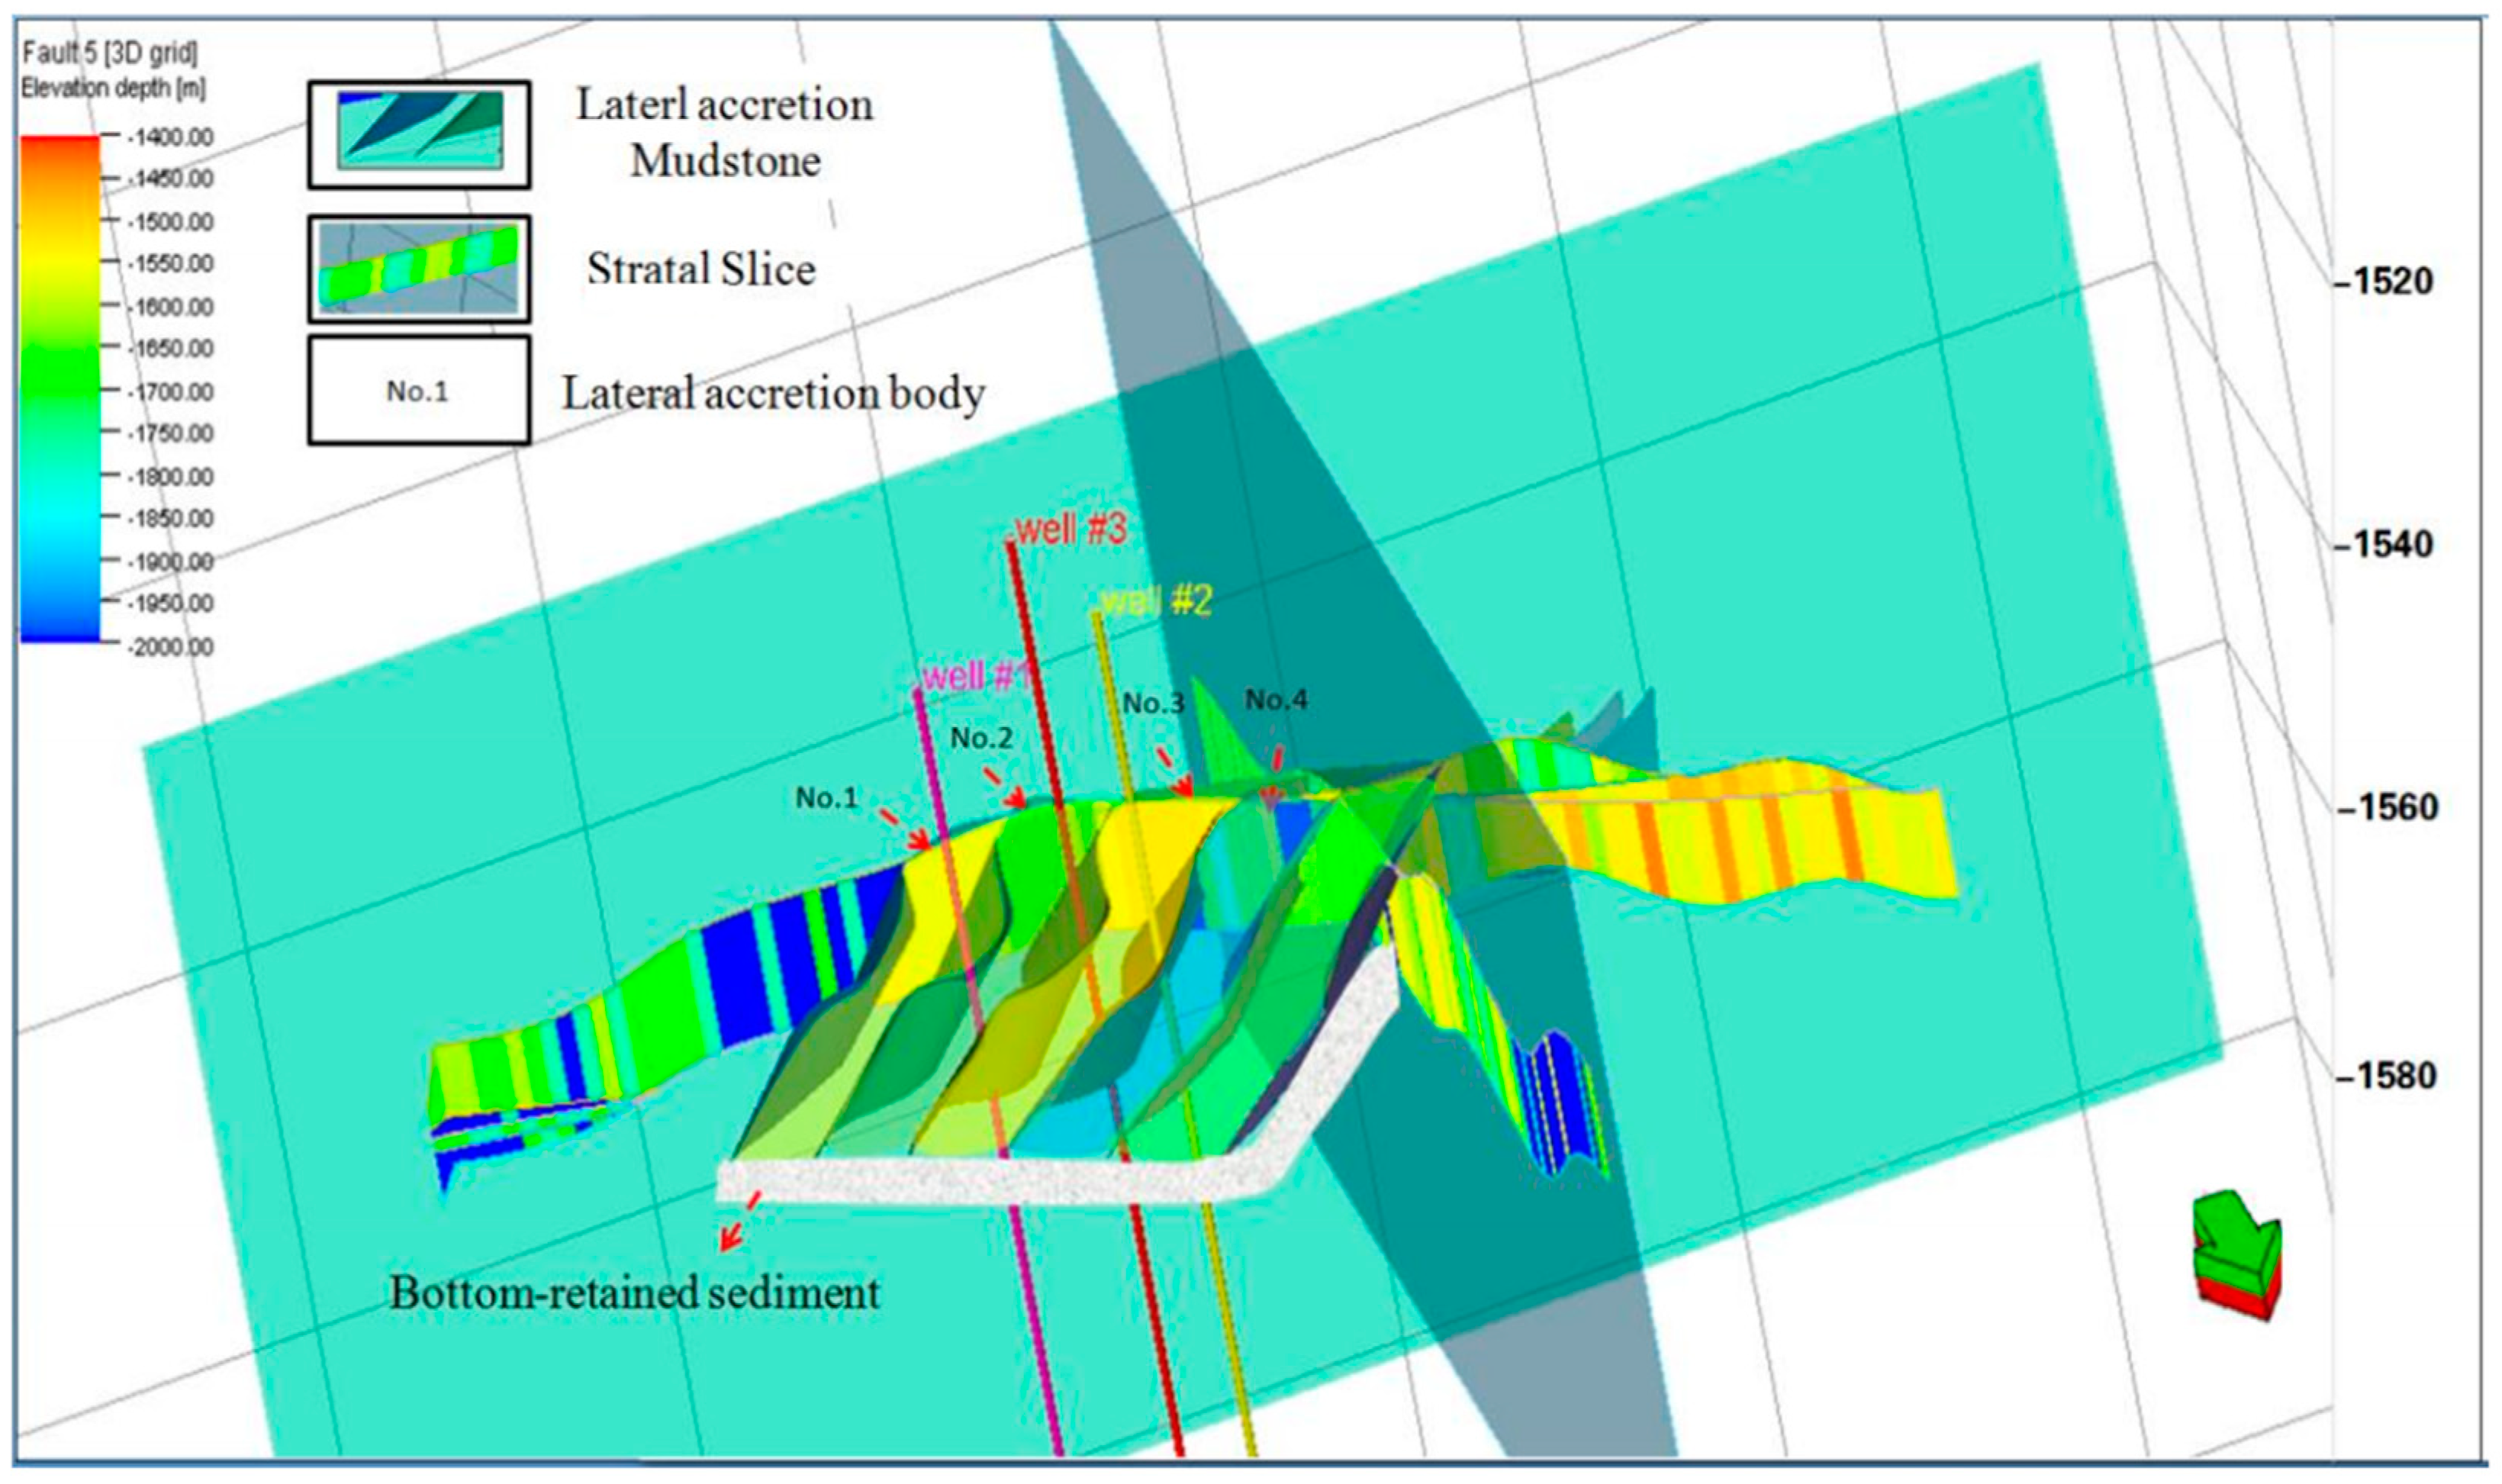
The blocking or permeability of the lateral accretion interlayer is the main factor affecting the distribution of residual oil inside the point bar of the meandering river of the Fuyang reservoir; the lower part of the point bar is eroded by the river during deposition to form an interconnected high-permeability reservoir, a high-permeability channel is formed during the water injection development process, resulting in flooding at the bottom of the point bar; the residual oil is distributed in the updip direction of a single lateral accretion body inside the point bar, forming a lithological updip and annihilation type residual oil.
(4)
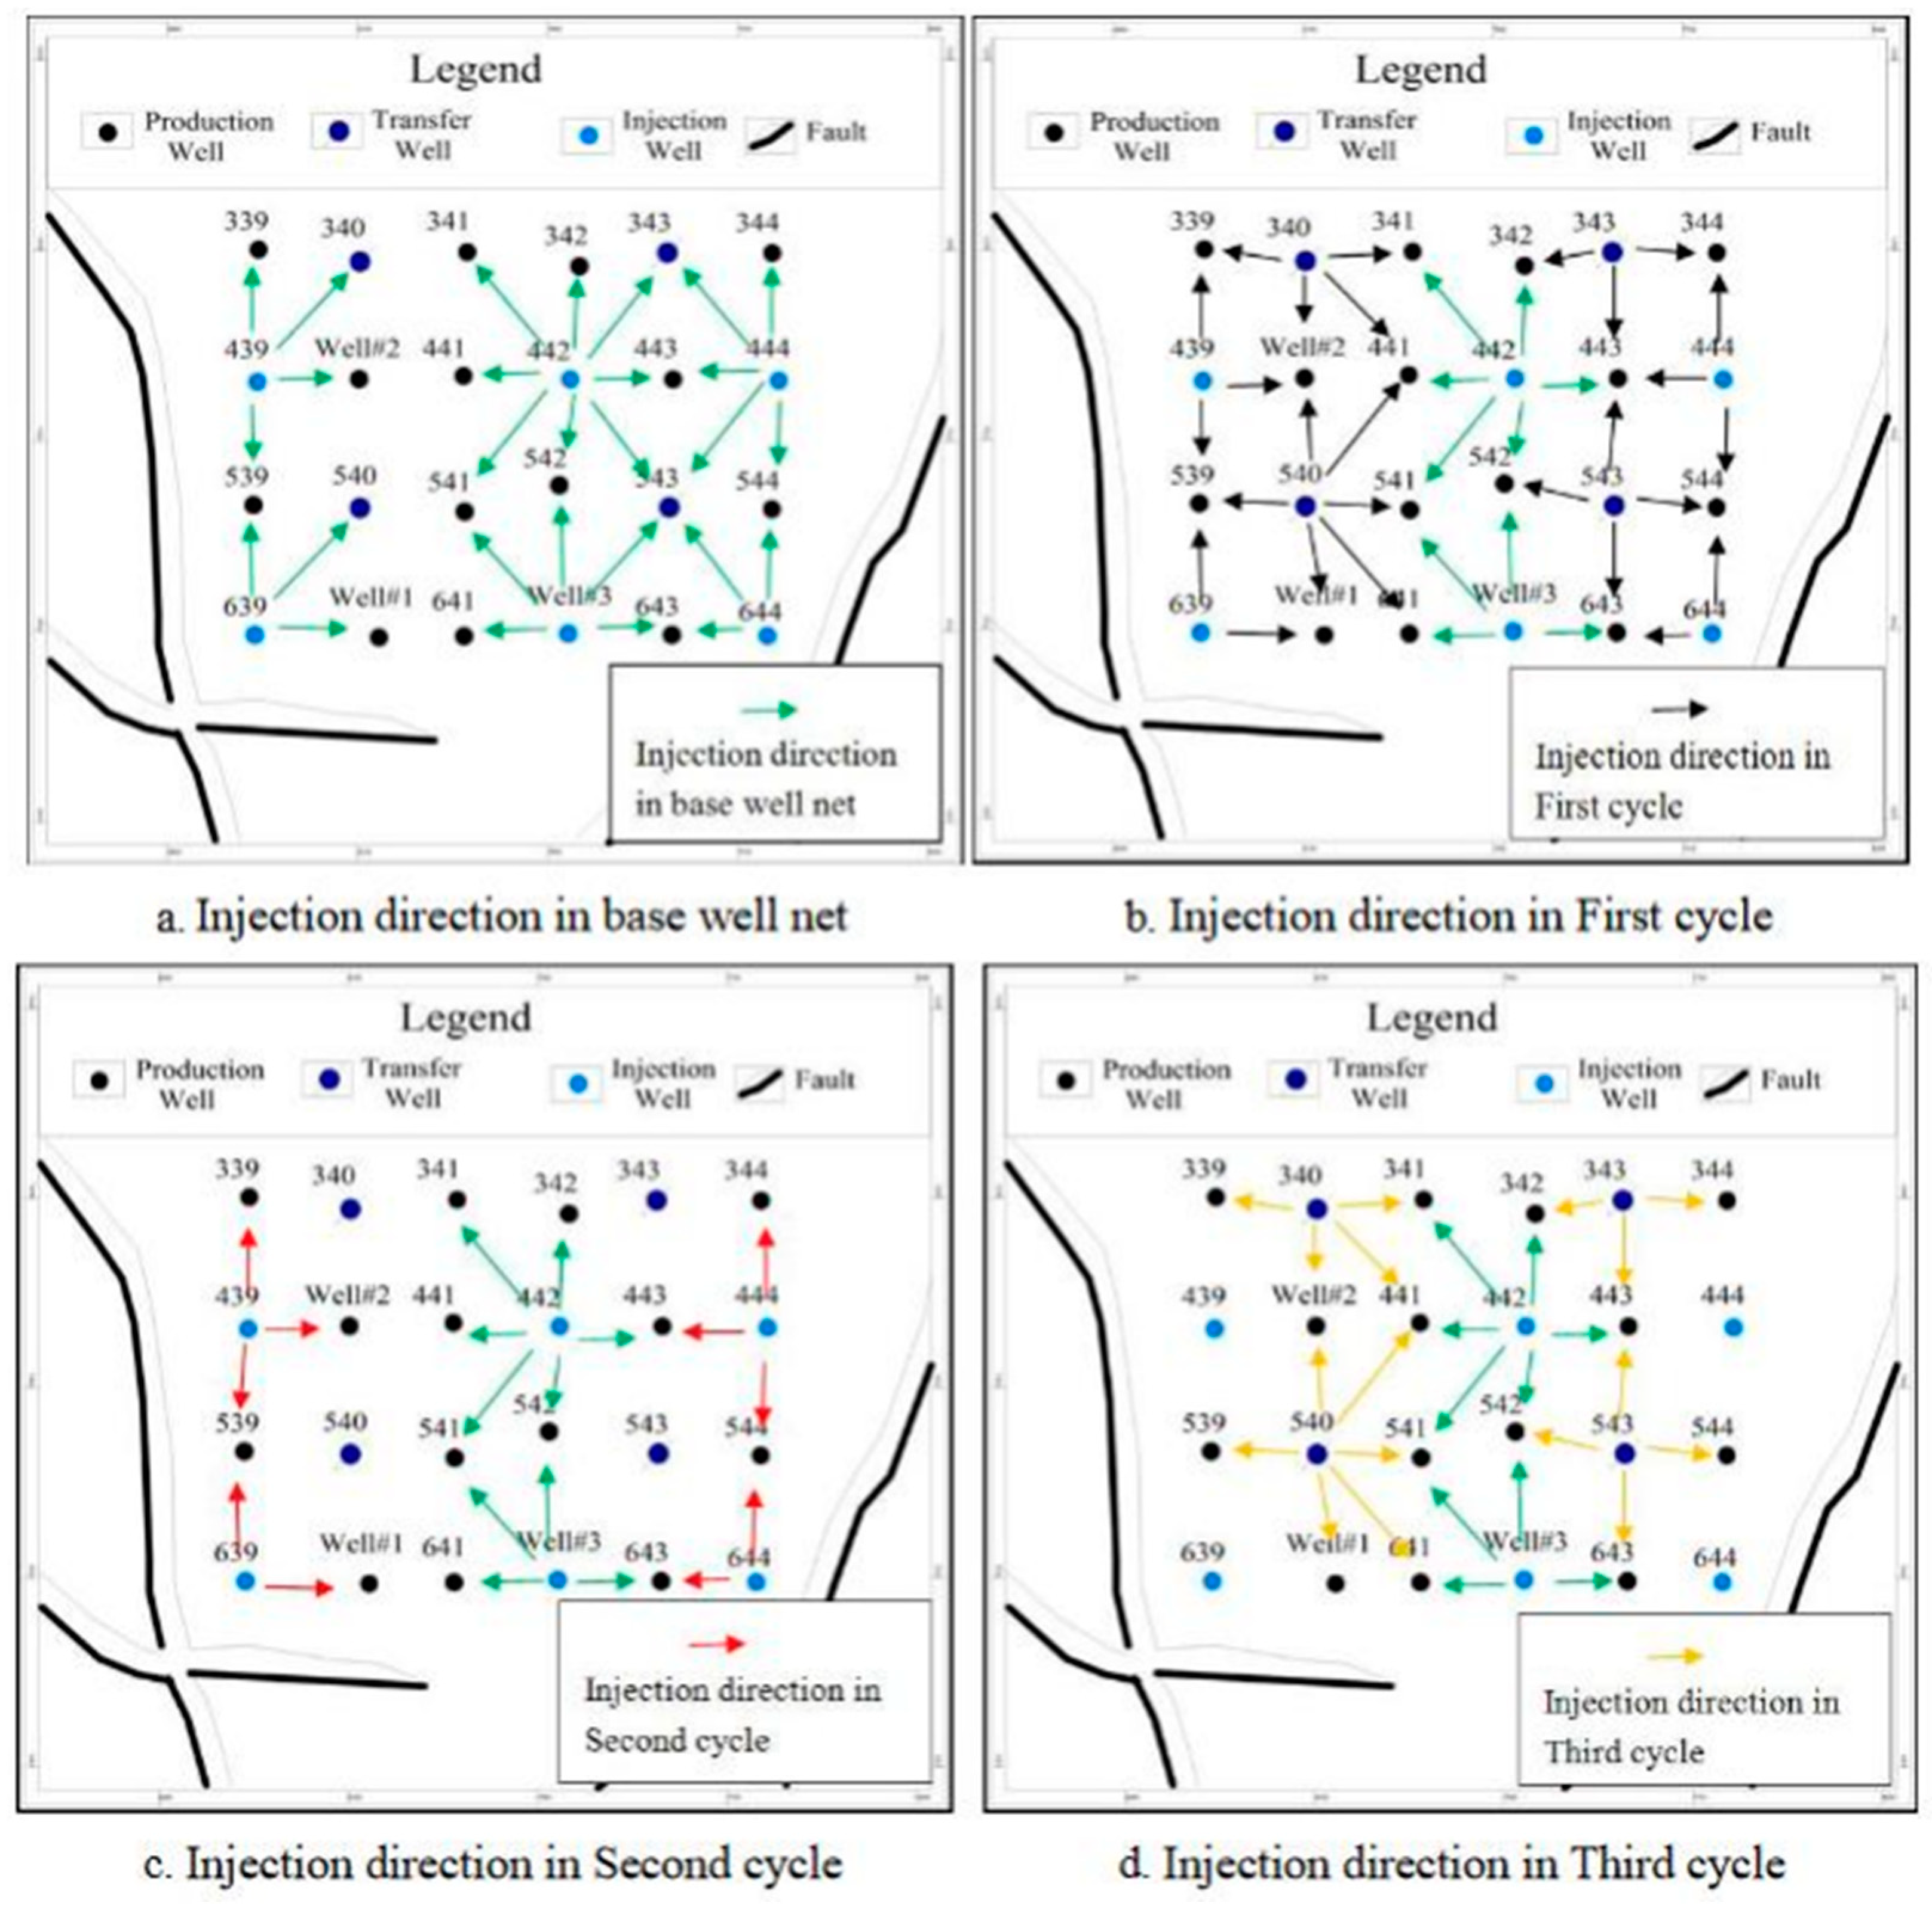
Changing the displacement direction and periodic water injection can increase the displacement pressure difference and overcome the capillary resistance effect. Oil and water were alternated so that the residual oil in the cluster, column, oil drop, film, and blind-end shape could finally be driven. Changing the displacement direction was beneficial to the recovery of residual oil in the fine throat and avoided the dominant seepage of injected water in the big pore throat, and the recovery rate was increased by more than 2.14%. Periodic water injection is conducive to adjusting the displacement pressure difference, thereby reducing the constraining force of the throat on residual oil and increasing the recovery rate by more than 3.98%. By applying these two strategies to production, the average daily oil increased by 0.26 tons per well, and the oil displacement efficiency increased by 44.28%.

9. Suggestion

This paper is aimed at the actual well core experiment, which is different from the artificial core. Due to the ultra-low porosity and permeability of the reservoir and the large, buried depth, the core acquisition rate is not high, and the actual core available for the experiment is very rare and precious. When selecting experimental core samples, the permeability level of underground rock strata has been represented as much as possible. In the future research, we will continue to study enough field core samples to form a systematic mathematical model of the influence of permeability on the remaining oil.

Author Contributions

Conceptualization, X.Y. and M.Z.; methodology, M.Z.; software, X.Y.; validation, X.Y., M.Z. and G.M.; formal analysis, M.Z.; investigation, G.M.; resources, M.Z.; data curation, G.M.; writing-original draft preparation, X.Y.; writing-review and editing, M.Z.; visualization, G.M.; supervision, G.M.; project administration, M.Z.; funding acquisition, M.Z. All authors have read and agreed to the published version of the manuscript.

Funding

This research work was jointly funded by the National Natural Science Foundation of China (41172135) and the Natural Science Foundation of Heilongjiang (2020D007).

Data Availability Statement

Data is unavailable due to privacy.

Conflicts of Interest

The authors declare no conflict of interest.

References

  1. Aydin, G.; Jang, H.; Topal, E. Energy consumption modeling using artificial neural networks: The case of world’s highest consumers. Energy Sources Part B Econ. Plan. Policy 2016, 11, 212–219. [Google Scholar] [CrossRef]
  2. Li, X.; Yang, Z.; Li, S.; Huang, W.; Zhan, J.; Lin, W. Reservoir characteristics and effective development technology in typical low-permeability to ultralow-permeability reservoirs of China National Petroleum Corporation. Energy Explor. Exploit. 2021, 39, 1713–1726. [Google Scholar] [CrossRef]
  3. Li, C.; Liu, X.; You, F.; Wang, P.; Feng, X.; Hu, Z. Pore Size Distribution Characterization by Joint Interpretation of MICP and NMR: A Case Study of Chang 7 Tight Sandstone in the Ordos Basin. Processes 2022, 10, 1941. [Google Scholar] [CrossRef]
  4. Liu, X.; Yan, L.; Gao, Q.; Liu, Y.; Huang, H.; Liu, S. Effect of Salinity on the Imbibition Recovery Process of Tight Sandstone Reservoirs. Processes 2022, 10, 228. [Google Scholar] [CrossRef]
  5. Zhong, X.; Zhu, Y.; Jiao, T.; Qi, Z.; Luo, J.; Xie, Y.; Liu, L. Microscopic pore throat structures and water flooding in heterogeneous low-permeability sandstone reservoirs: A case study of the Jurassic Yan’an Formation in the Huanjiang area, Ordos Basin, Northern China. J. Asian Earth Sci. 2021, 219, 104903. [Google Scholar] [CrossRef]
  6. Li, T.; Gao, H.; Wang, C.; Cheng, Z.; Xue, J.; Zhang, Z.; Luo, K.; Li, N.; Liu, X.; Cao, J. Oil utilization degree at various pore sizes via different displacement methods. J. Pet. Explor. Prod. Technol. 2022, 12, 2271–2287. [Google Scholar] [CrossRef]
  7. Georgiadis, A.; Berg, S.; Makurat, A.; Maitland, G.; Ott, H. Pore-scale micro-computed-tomography imaging: Nonwetting-phase cluster-size distribution during drainage and imbibition. Phys. Rev. E 2013, 88, 033002. [Google Scholar] [CrossRef] [Green Version]
  8. Li, P.; Zheng, M.; Bi, H.; Wu, S.; Wang, X. Pore throat structure and fractal characteristics of tight oil sandstone: A case study in the Ordos Basin, China. J. Pet. Sci. Eng. 2017, 149, 665–674. [Google Scholar] [CrossRef]
  9. An, S.; Yao, J.; Yang, Y.; Zhang, L.; Zhao, J.; Gao, Y. Influence of pore structure parameters on flow characteristics based on a digital rock and the pore network model. J. Nat. Gas Sci. Eng. 2016, 31, 156–163. [Google Scholar] [CrossRef]
  10. Lai, J.; Wang, G.; Wang, Z.; Chen, J.; Pang, X.; Wang, S.; Zhou, Z.; He, Z.; Qin, Z.; Fan, X. A review on pore structure characterization in tight sandstones. Earth-Sci. Rev. 2018, 177, 436–457. [Google Scholar] [CrossRef]
  11. Al-Khafaji, A.; Wilson, M.; Neville, A.; Wen, D. Pore-scale displacement efficiency during different salinity water flooding in hydrophilic and hydrophobic microstructures. Energy Fuels 2019, 33, 3859–3870. [Google Scholar] [CrossRef] [Green Version]
  12. Zhang, X.; Yuan, P. A Microscopic Experimental Device for Natural Gas Hydrate Photoetching Glass Model. CN107516462A, 26 December 2017. (In Chinese). [Google Scholar]
  13. Qiang, R.; Hu, W.; Guofa, L.; Weigang, Z.; Bingyu, G.; Junxiang, N. Effect of Microscopic Pore Throat Structure on Displacement Characteristics of Lacustrine Low Permeability Sandstone: A Case Study of Chang 6 Reservoir in Wuqi Oilfield, Ordos Basin. Geofluids 2022, 2022, 7438074. [Google Scholar] [CrossRef]
  14. Zhu, W.; Shen, M.; Dai, S.; Liu, K.; Qi, Y. Channel Evolution under the Control of Base-Level Cycle Change and the Influence on the Sustainable Development of the Remaining Oil—A Case in Jiang Ling Depression, Jiang Han Basin, China. Sustainability 2022, 14, 12518. [Google Scholar] [CrossRef]
  15. Yang, J.; Li, W.; Gao, S.; Zhang, J.; Zhang, Y.; Lu, J. Sedimentology, geological modeling and prediction of the remaining oil distribution in a complicated fault-block reservoir in the Weicheng Oilfield, Dongpu Depression, China. Geosci. J. 2019, 23, 791–804. [Google Scholar] [CrossRef]
  16. Zhang, M.; Fan, J.; Zhang, Y.; Liu, Y. Study on the relationship between the water cutting rate and the remaining oil saturation of the reservoir by using the index percolating saturation formula with variable coefficients. J. Pet. Explor. Prod. Technol. 2020, 10, 3649–3661. [Google Scholar] [CrossRef]
  17. Feng, C.; San, Q.; Shi, W.; Zhu, S. Reservoir heterogeneity and control of remaining oil distribution in the fourth member of Quanquan Formation in Fuyu Oilfield. J. China Univ. Pet. Ed. Nat. Sci. 2013, 37, 1–7. (In Chinese) [Google Scholar]
  18. Pengfei, X.; Yanshu, Y.; Weiqiang, L.; Feng, L.; Lei, Z. Distribution of remaining oil based on a single sand body analysis: A case study of Xingbei Oilfield. J. Pet. Explor. Prod. Technol. 2018, 8, 1159–1167. [Google Scholar] [CrossRef] [Green Version]
  19. Murugesu, T.S.; Masoudi, R.; Johare, D.B.; Jalan, S.; Marzuki, I.I. Integrated Approach in Determining Residual Oil Saturations to Water Sorw and its Impact on Potential Enhanced Oil Recovery EOR Volume Estimation. In Proceedings of the SPE/IATMI Asia Pacific Oil & Gas Conference and Exhibition, Jakarta, Indonesia, 17–19 October 2017. [Google Scholar]
  20. Wang, J.; Wu, S.; Li, Q.; Guo, Q. An investigation into pore structure fractal characteristics in tight oil reservoirs: A case study of the Triassic tight sandstone with ultra-low permeability in the Ordos Basin, China. Arab. J. Geosci. 2020, 13, 961. [Google Scholar] [CrossRef]
  21. Chauhan, A.; Salehi, F.; Jalalifar, S.; Clark, S.M. Two-phase modelling of the effects of pore-throat geometry on enhanced oil recovery. Appl. Nanosci. 2021, 13, 453–464. [Google Scholar] [CrossRef]
  22. Shi, J. Micro-pore structure and seepage characteristics of low-permeability reservoirs in Yushulin Oilfield. Sediment. Geol. Tethyan Geol. 2003, 23, 90–94. (In Chinese) [Google Scholar]
  23. Perrin, C.L.; Tardy, P.M.; Sorbie, K.S.; Crawshaw, J.C. Experimental and modeling study of Newtonian and non-Newtonian fluid flow in pore network micromodels. J. Colloid Interface Sci. 2006, 295, 542–550. [Google Scholar] [CrossRef] [PubMed]
  24. Pal, M. A microscale simulation methodology for subsurface heterogeneity quantification using petrographic image analysis with multiscale mixed finite element method. Pet. Sci. Technol. 2021, 39, 582–611. [Google Scholar] [CrossRef]
  25. Nelson, P.H. Pore-throat sizes in sandstones, tight sandstones, and shales. AAPG Bull. 2009, 93, 329–340. [Google Scholar] [CrossRef]
  26. Liang, X.; Zhou, F.; Liang, T.; Su, H.; Yuan, S.; Li, Y. Impacts of pore structure and wettability on distribution of residual fossil hydrogen energy after imbibition. Int. J. Hydrogen Energy 2020, 45, 14779–14789. [Google Scholar] [CrossRef]
  27. Zhang, D.; Gamage, R.P.; Perera, M.S.A.; Zhang, C.; Wanniarachchi, W.A.M. Influence of Water Saturation on the Mechanical Behaviour of Low-Permeability Reservoir Rocks. Energies 2017, 10, 236. [Google Scholar] [CrossRef] [Green Version]
  28. Bultreys, T.; Van Hoorebeke, L.; Cnudde, V. Multi-scale, micro-computed tomography-based pore network models to simulate drainage in heterogeneous rocks. Adv. Water Resour. 2015, 78, 36–49. [Google Scholar] [CrossRef]
  29. Cao, R. Oil-water mutual driving microscopic simulation research on low permeability reservoir. In IOP Conference Series: Earth and Environmental Science; IOP Publishing: Bristol, UK, 2019; Volume 300, p. 022081. [Google Scholar] [CrossRef]
  30. Zahid, M.A.; Chunmei, D.; Golab, A.N.; Lin, C.; Zhang, X.; Ge, X.; Songtao, W.; Munawar, M.J.; Ma, C.; Knuefing, L. Pore size distribution and reservoir characterization: Evaluation for the Eocene beach-bar sequence, Dongying Depression, China. Arab. J. Geosci. 2019, 12, 660. [Google Scholar] [CrossRef]
  31. Zhang, M.; Qi, M.; Lin, L. Comprehensive evaluation method of waterflooded layer in extra-low permeability reservoir of daqing peripheral oilfield. Lithol. Oil-Gas Reserv. 2016, 28, 93–101. (In Chinese) [Google Scholar]
  32. Rabbani, H.S.; Osman, Y.; Almaghrabi, I.; Rahman, M.A.; Seers, T. The control of apparent wettability on the efficiency of surfactant flooding in tight carbonate rocks. Processes 2019, 7, 684. [Google Scholar] [CrossRef] [Green Version]
  33. Moosavi, S.A.; Goshtasbi, K.; Kazemzadeh, E.; Bakhtiari, H.A.; Esfahani, M.R.; Vali, J. Relationship between porosity and permeability with stress using pore volume compressibility characteristic of reservoir rocks. Arab. J. Geosci. 2012, 7, 231–239. [Google Scholar] [CrossRef]
  34. Zhao, L.; Sun, X.; Liu, F.; Wang, P.; Chang, L. Study on Morphological Identification of Tight Oil Reservoir Residual Oil after Water Flooding in Secondary Oil Layers Based on Convolution Neural Network. Energies 2022, 15, 5367. [Google Scholar] [CrossRef]
  35. Andersen, P.Ø.; Standnes, D.C.; Skjæveland, S.M. Waterflooding Oil-Saturated Core Samples—Analytical Solutions for Steady-State Capillary End Effects and Correction of Residual Saturation. J. Pet. Sci. Eng. 2017, 157, 364–379. [Google Scholar] [CrossRef]
  36. Zhao, J.; Xu, H.; Chen, G.; He, C.; Yue, D.; Wu, S.; Wen, L. Research on meandering river reservoir deposition architecture and 3D modeling of the Gudao Oil field in the Bohai Bay Basin. J. Pet. Explor. Prod. Technol. 2017, 8, 73–83. [Google Scholar] [CrossRef] [Green Version]
  37. Liu, X.; Kang, Y.; Li, J.; Chen, Z.; Ji, A.; Xu, H. Percolation Characteristics and Fluid Movability Analysis in Tight Sandstone Oil Reservoirs. ACS Omega 2020, 5, 14316–14323. [Google Scholar] [CrossRef]
  38. Omran, M.; Akarri, S.; Torsaeter, O. The Effect of Wettability and Flow Rate on Oil Displacement Using Polymer-Coated Silica Nanoparticles: A Microfluidic Study. Processes 2020, 8, 991. [Google Scholar] [CrossRef]
Figure 1. Porosity distribution histogram.
Processes 11 01907 g001
Figure 2. Permeability distribution histogram.
Processes 11 01907 g002
Figure 3. Distribution frequency of throat radius of samples with different permeability. (a) The permeability of samples is 0.1~1 mD; (b) the permeability of samples is 1~2 mD; (c) the permeability of samples is 2~5 mD; (d) the permeability of samples is 5~10 mD; (e) the permeability of samples is 10~20 mD.
Processes 11 01907 g003
Figure 4. Distribution frequency of the pore–throat ratio of samples with different permeability. (a) The permeability of samples is 0.1~1 mD; (b) the permeability of samples is 1~2 mD; (c) the permeability of samples is 2~5 mD; (d) the permeability of samples is 5~10 mD; (e) the permeability of samples is 10~20 mD.
Processes 11 01907 g004
Figure 5. Microscopic residual oil types in Fuyang reservoir (yellow and grey represent oil; black represents rock grains).
Processes 11 01907 g005
Figure 6. The mechanism of residual oil production by changing the displacement direction (blue arrow is displacement direction).
Processes 11 01907 g006
Figure 7. Comparison of microscopic residual oil distribution between conventional and changing direction displacement (3.05 mD).
Processes 11 01907 g007
Figure 8. The mechanism of cyclical injection of residual oil.
Processes 11 01907 g008
Figure 9. Distribution of microscopic residual oil at different injected stages periodically (8.19 mD).
Processes 11 01907 g009
Figure 10. Schematic representation of the internal 3D geological model of the meandering river point bar in the Fuyang reservoir.
Processes 11 01907 g010
Figure 11. Comprehensive histogram of Well#1. From the left track to the right track: the first track is the well’s depth, in m; the second track is the layer’s NO; the third track is the deep lateral resistivity log, LLD, Ω m; the fourth track is the induction resistivity log, ILD, Ω m; the fifth is the acoustic log, AC, us/m; the sixth track is shale content Vsh, %, porosity PORE, %, and calcium content, Vca, %; the seventh track is permeability, k, mD; the eighth track is the lithology profile; and the last track is cast pictures.
Processes 11 01907 g011
Figure 12. Comprehensive histogram of Well#2 (the legend is the same as Figure 11).
Processes 11 01907 g012
Figure 13. Schematic diagram of Well#1 and its surrounding vertical wells.
Processes 11 01907 g013
Table 1. Distribution characteristics of various types of residual oil in different water-bearing stages.
Permeability Level (mD)Water Cutting
Stage
Saturation (%) of Residual Oil TypeOil
Saturation
Oil Displacement
Efficiency (%)
ClusteredColumnarDropletMembraneBlind-End
<1Low 36.684.754.613.974.1454.158.83
Medium 24.227.979.794.244.0850.3014.74
High 20.908.388.574.374.5346.7521.23
1~2 Low 37.035.385.433.352.9154.1012.04
Medium 25.117.469.413.474.0649.5119.75
High 22.277.737.933.954.1846.0624.76
2~5 Low 39.24.132.552.952.1150.9414.38
Medium 27.977.157.312.083.3247.8322.12
High 22.397.477.542.193.5243.1129.83
5~10Low 40.082.623.41.283.3150.6923.96
Medium 28.824.096.351.373.6744.3033.42
High 23.184.316.571.393.8639.3140.33
>10 Low 41.283.131.141.91.4348.8828.75
Medium 29.344.194.721.71.8741.8239.45
High 24.394.693.530.81.5734.9747.25
Table 2. The distribution characteristics of various types of residual oil through changing the displacement direction.
Permeability
(mD)
Displacement
Type
Saturation (%) of Residual Oil TypeOil
Saturation
Oil Displacement
Efficiency (%)
ClusteredColumnarDropletMembraneBlind-End
3.05Conventional 17.556.478.133.004.4639.6136.12
perpendicular 16.265.728.153.014.4837.6239.33
Change (%)−1.29−0.75+0.02+0.01+0.02−1.99+3.21
8.19Conventional 19.105.276.652.383.4336.8243.35
perpendicular17.984.556.682.413.4735.0946.02
Change (%)−1.12−0.72+0.03+0.03+0.04−1.74+2.67
14.65Conventional 20.814.434.951.923.0735.1848.26
perpendicular19.933.674.991.983.1533.7250.40
Change (%)−0.88−0.76+0.04+0.06+0.08−1.46+2.14
Note: “Conventional” means the result after the first stage of conventional water displacement; “perpendicular” means the result after the displacement direction is changed to the vertical direction. “Change (%)” means the amount of change of the various residual oil parameters after the two displacement stages; the negative sign means decrease; the positive sign means increase.
Table 3. Distribution characteristics of various types of residual oil after changing the period.
Permeability
(mD)
Displacement TypeSaturation (%) of Residual Oil TypeOil SaturationOil Displacement Efficiency (%)
ClusteredColumnarDropletMembraneBlind-End
3.05Conventional20.486.618.12.994.4442.6331.25
First Cycle18.635.867.532.774.1338.9137.24
First Change−1.85−0.75−0.58−0.22−0.31−3.71+5.99
Second Cycle18.265.697.522.774.1238.3638.13
Second Change−2.22−0.92−0.58−0.22−0.32−4.27+6.88
Third Cycle18.045.537.522.764.1237.9738.75
Third Change−2.44−1.08−0.58−0.23−0.32−4.65+7.5
8.19Conventional22.605.216.142.393.4439.7838.82
First Cycle21.084.785.792.243.2437.1342.86
First Change−1.52−0.43−0.35−0.15−0.20−2.65+4.04
Second Cycle20.924.685.802.243.2536.8943.24
Second Change−1.68−0.53−0.34−0.15−0.19−2.89+4.42
Third Cycle20.384.305.812.253.2535.9944.65
Third Change−2.22−0.91−0.33−0.14−0.19−3.79+5.83
14.65Conventional24.733.884.681.933.0838.3043.67
First Cycle22.843.544.461.852.9135.6047.65
First Change−1.89−0.34−0.22−0.08−0.17−2.70+3.98
Second Cycle22.693.504.401.812.9035.348.09
Second Change−2.04−0.38−0.28−0.12−0.18−3.00+4.42
Third Cycle21.893.434.401.812.9134.4449.34
Third Change−2.84−0.45−0.28−0.12−0.17−3.86+5.67
Note: “Conventional” means the result after the first stage of conventional water displacement; “first cycle” means the result after the first water displacement period; “first change” means the amount of change of the various residual oil parameters after the first displacement period against that of the conventional water displacement; negative sign means decrease; positive sign means increase. “Second cycle” and “third cycle” also mean the results after the second and third water displacement period; “second change” and “third change” also mean the amount of change of the various residual oil parameters after the second and third displacement period against that of the conventional water displacement.
Table 4. Direction change of water injection from the basic well pattern to the first, second, and third cycles.
WellThe Change of Water Injection Source Direction of Basic Well Pattern, First, Second and Third Circulation Oil Wells
#339S → S + E → S → E
#539N + S → N + S + E → N + S → E
#2N → W + N + S → W → N + S
#1W → W + N → W → N
#341S-E → S-E + W → S-E → S-E + W
#441E → E + N-W + S-W → S-E → S-E + W
#541E-N + S-E → W + E-N + S-E → E-N + S-E → W + E-N + S-E
#641E → E + E-N → E → E + E-N
#342S → S + E → S → S + E
#542S + N → S + N + E → S + N → S + N + E
#443E + W → E + W + S + N → E + W → W + S + N
#643E + W → E + W + N → E + W → W + N
#344S → S + W → S → W
#544N + S → N + S + W → N + S → W
Disclaimer/Publisher’s Note: The statements, opinions and data contained in all publications are solely those of the individual author(s) and contributor(s) and not of MDPI and/or the editor(s). MDPI and/or the editor(s) disclaim responsibility for any injury to people or property resulting from any ideas, methods, instructions or products referred to in the content.

