Article

Hydrocarbon Generation History of the Eocene Source Rocks in the Fushan Depression, South China Sea: Insights from a Basin Modeling Study

1
Southern Oil Exploration and Development Company, PetroChina, Haikou 570216, China
2
State Key Laboratory of Petroleum Resources and Prospecting, College of Geosciences, China University of Petroleum (Beijing), Beijing 102249, China
3
PetroChina Hangzhou Research Institute of Geology, Hangzhou 310023, China
4
State Key Laboratory of Petroleum Resources and Prospecting, Faculty of Petroleum, China University of Petroleum (Beijing) at Karamay, Karamay 834000, China
*
Author to whom correspondence should be addressed.
Processes 2023, 11(7), 2051; https://doi.org/10.3390/pr11072051
Submission received: 27 May 2023 / Revised: 2 July 2023 / Accepted: 5 July 2023 / Published: 10 July 2023

Abstract

:
Reconstruction of hydrocarbon generation history is essential to understanding the petroleum system. In this study, basin modeling was employed to investigate the primary source rocks in the Fushan Depression (FD), a significant oil-bearing basin situated in the South China Sea. The research findings indicate that different tectonic zones within the FD underwent distinct hydrocarbon generation stages. The step-fault zone and the central sag zone experienced one hydrocarbon generation stage at 10–0 Ma and 30–0 Ma, respectively. The slope zone, on the other hand, experienced two hydrocarbon generation stages, 40–23.5 Ma and 10–0 Ma, controlled by tectonic movements and heat flow variations. Furthermore, critical times for the process of the petroleum system have been determined based on this work and previous literature. The slope zone in the eastern FD is considered a favorable area for conventional hydrocarbon exploration due to the high maturity of source rocks promoted by volcanic heating and two significant oil charges. The central sag zone is identified as an excellent prospect for unconventional resources because of the substantial retention of hydrocarbons in in-source unconventional reservoirs long after hydrocarbon generation. These findings provide a valuable guide for further exploration.

1. Introduction

Understanding the process of hydrocarbon accumulation requires the reconstruction of burial, thermal, and hydrocarbon generation histories of source rocks [1,2,3,4]. Due to the complex tectonic and thermal evolution of rift basins, hydrocarbon generation occurs at various stages and times. The Fushan Depression is one of the petroliferous rift basins located in the northern continental shelf offshore, South China Sea, covering an area of approximately 2920 km2 (Figure 1a) [5]. Since the 1960s, seven major oilfields (Meitai, Hongguan, Chaoyang, Yong’an, Huachang, Bailian, and Jinfeng) in the Fushan Depression have yielded over 400,000 tons per year (Figure 1b) [6,7]. Extensive research has been conducted on petroleum geology [5,6,8,9,10,11,12,13,14]. The Eocene Liushagang Formation (Els), consisting of lacustrine organic-rich mudstones, has been confirmed to meet the criteria for high-quality source rocks and is the sole source of oil and gas for the Paleogene reservoirs [15]. However, previous studies on the Eocene source rocks have primarily focused on their distribution, quality, and biomarker compounds [15,16,17]. The hydrocarbon generation and expulsion history in different tectonic zones remains poorly understood and requires further investigation. Moreover, Li et al. (2007) and Wang et al. (2022) proposed that only one hydrocarbon charge occurred around 10–2 Ma in the western FD [7,18]. However, Gan et al. (2023) believed that two oil charges occurred in the upper and lower petroleum plays in the eastern FD, corresponding to 38–31.5 Ma and 13–0 Ma, respectively [14]. This discrepancy can be attributed to the variable burial and thermal evolution of source rocks in the eastern and western regions of the FD, resulting in different processes of hydrocarbon generation.
Basin and Petroleum System Modeling (BPSM) is a proven powerful methodology used to study the temporal and spatial evolution of sedimentary basins. It enables the analysis of hydrocarbon generation, expulsion, migration, accumulation, and preservation [2,3]. Thus, this paper utilizes six wells and three profiles for basin modeling and aims to reconstruct the burial, thermal, and hydrocarbon generation histories of the different oil-bearing tectonic units in the FD. The findings are crucial for comprehending the petroleum system and further exploration.

2. Geological Setting

The FD, located in the south of the Beibuwan Basin, is considered to be a subsiding sediment-filled trough that has been active since the Cenozoic. Its shape resembles a triangle controlled by the Lingao Fault to the west, the Changliu Fault to the east, and the Ding’an Fault to the south (Figure 1b). From the north to the south, the FD is divided into three tertiary structural units: the step-fault zone, the central structural zone, and the southern slope zone. The central structural zone can be further divided into the western Huangtong Sag and the eastern Bailian Sag. The FD vertically displays a double-layered structure with normal faults and antithetic normal faults, respectively [19].
The deposition of Paleogene sediments in the FD was controlled by three major tectonic movements, namely the Shenhu Movement, Zhuqiong Movement, and Nanhai Movement (Figure 2) [6]. It comprises the Changliu Formation (Ech), the Liushagang Formation (Els), and the Weizhou Formation (Ewz) from the bottom up, forming two complete petroleum systems corresponding to the upper and lower plays of the double-layered structure. The Paleocene Changliu Formation is characterized by predominantly fluvial sandstones of a red hue. The Eocene Liushagang Formation consists of lacustrine dark mudstones with deltaic sandstones and can be further divided into three members (Els1, Els2, and Els3) corresponding to three third-order sequences (SQls1, SQls2, and SQls3) [8]. Moreover, SQls3 is found to be absent to the north of the Meihua Fault and the Lianhua Fault (Figure 3). The Nanhai Movement and Nansha Movement resulted in large-scale erosion of the Eocene Liushagang Formation and Oligocene Weizhou Formation, forming angular and parallel unconformities (T4 and T2) [9]. The sediments in the area are primarily composed of variegated fluvial conglomerates and sandstones. In the eastern part of the FD, at around 31.4 Ma, volcanic rocks such as gabbro and diabase extensively intruded within the Eocene Liushagang Formation [20].

3. Data and Methods

3.1. Data Base

Geological data required for this study includes borehole information (e.g., locations, stratigraphic thicknesses, lithologies, well logs, and formation temperatures) from six wells. Geochemical data on source rocks, such as total organic carbon (TOC) content, hydrogen index (HI), vitrinite reflectance (Ro), and kinetics, were obtained from available previous works [6,16]. Erosion maps of the FD at critical timings were collected from the Southern Oil Exploration and Development Company, PetroChina.

3.2. Methods

Basin modeling is a powerful tool used to study the burial and thermal histories of sedimentary basins [21,22]. For 1D basin modeling, six representative wells were selected from different tectonic units within the FD including the northern step-fault zone (C12x), the central sag zone (Y11x), the slope zone in the western FD (M5-6x and HG5-2ax), and the slope zone in the eastern FD (H7-7x and L25x), respectively (Figure 1b). Table 1 illustrates the main geological data used in the modeling. All steps were taken using PetroMod 2016 software (Schlumberger).
During the construction phase, formations were categorized as deposition, erosion, and non-deposition. Their absolute ages, present thicknesses, and erosion thicknesses were obtained from the published works, borehole information, and erosion maps, respectively. Paleo water depths were assigned on the basis of sedimentary facies [23]. Sediment water interface temperatures were calculated in accordance with the global mean temperature at sea level [24]. Paleo-heat flows were estimated from the geological history [7,14,17,18] and then calibrated by Ro and temperature data. In addition, assigned source rock parameters, supported by geochemical evidence from Zeng et al. (2022a), were assigned and are illustrated in Table 2 [15]. The parameters for 2D basin modeling were assigned based on the results obtained from 1D simulations. Each sequence unit was divided into 10 to 20 sublayers based on thickness to improve the accuracy of the model. The migration model employs the Darcy flow and invasion percolation method.

4. Results

4.1. Burial History of 1D Basin Modeling

Accurate determination of tectonic subsidence and deposition rates is critical for reconstructing the burial history of source rocks [4]. In this study, the deposition rates of different tectonic units in the FD were defined using the 1D basin modeling results from representative wells. It was found that the Eocene and the Oligocene strata were affected by different tectonic activities, resulting in various sedimentation rates, while the Neogene and the Quaternary sediments were characterized by slow stacking due to the steady subsidence of the FD (Figure 4). SQls3 was only distributed in the slope zone and characterized by a moderate deposition rate (average 318.0 m/Ma). SQls2 widely occurred in the whole FD, with higher deposition rates in the slope and step-fault zones (average 408.8 m/Ma) than in the central sag zone (177.3 m/Ma). During the Late Eocene, large-scale subsidence of the FD occurred due to intense stretching, leading to higher deposition rates of SQls1 of 547.0 m/Ma, 489.6 m/Ma, and 458.2 m/Ma in the slope zone, step-fault zone, and central sag zone, respectively. It should be noted that the deposition rate of SQls1 in well M5-6x was anomalous, resulting from reduced stratigraphic thickness caused by normal faults. The subsidence rate of the FD decreased during the Early Oligocene as a result of the erosion event, which corresponded to the low deposition rate of SQwz3 (average 195.3 m/Ma). At this time, the primary deposition center was located in the central sag zone. The Nanhai Movement subsequently increased the deposition rates of SQwz2 (average 278.0 m/Ma) and SQwz1 (average 435.8 m/Ma). During the Neogene and Quaternary periods, the FD was in a post-rift phase, which was characterized by low deposition rates.

4.2. Thermal History of 1D Basin Modeling

The thermal history of a sedimentary basin is primarily controlled by heat flows originating from the mantle, radiogenic heat induced by the crust, and regional hydrodynamic flows [25]. Generally, heat flow increases during the rift phase because of lithospheric thinning, while it decreases during post-rift thermal subsidence [26]. Using measured temperature and Ro data, which are commonly used to calibrate and predict present-day heat flow and paleo-heat flow, respectively [27,28,29], we have quantitatively reconstructed the thermal history of the FD based on its burial history. Heat flow values were determined by best-matching between measured data and calculated data (Figure 5a–c,e–g).
The results indicate that heat flows in the FD range from 40 to 75 mW/m2. They maintained high values during the Paleogene, corresponding to the rift phase controlled by the Zhuqiong Movement and the Nanhai Movement. Heat flows gradually decreased during the Neogene and Quaternary, but increased again after 10 Ma (Figure 5d,h). Overall, heat flow values in the central sag zone (57–72 mW/m2) and the step-fault zone (47–70 mW/m2) are higher than those in the slope zone (45–65 mW/m2), resulting in relatively shallow depths of hydrocarbon generation threshold (Figure 5). Volcanic heating promoted the maturation of hydrocarbon source rocks. The threshold depth for hydrocarbon generation is approximately 2225 m within the area affected by volcanic intrusion (Figure 5g).
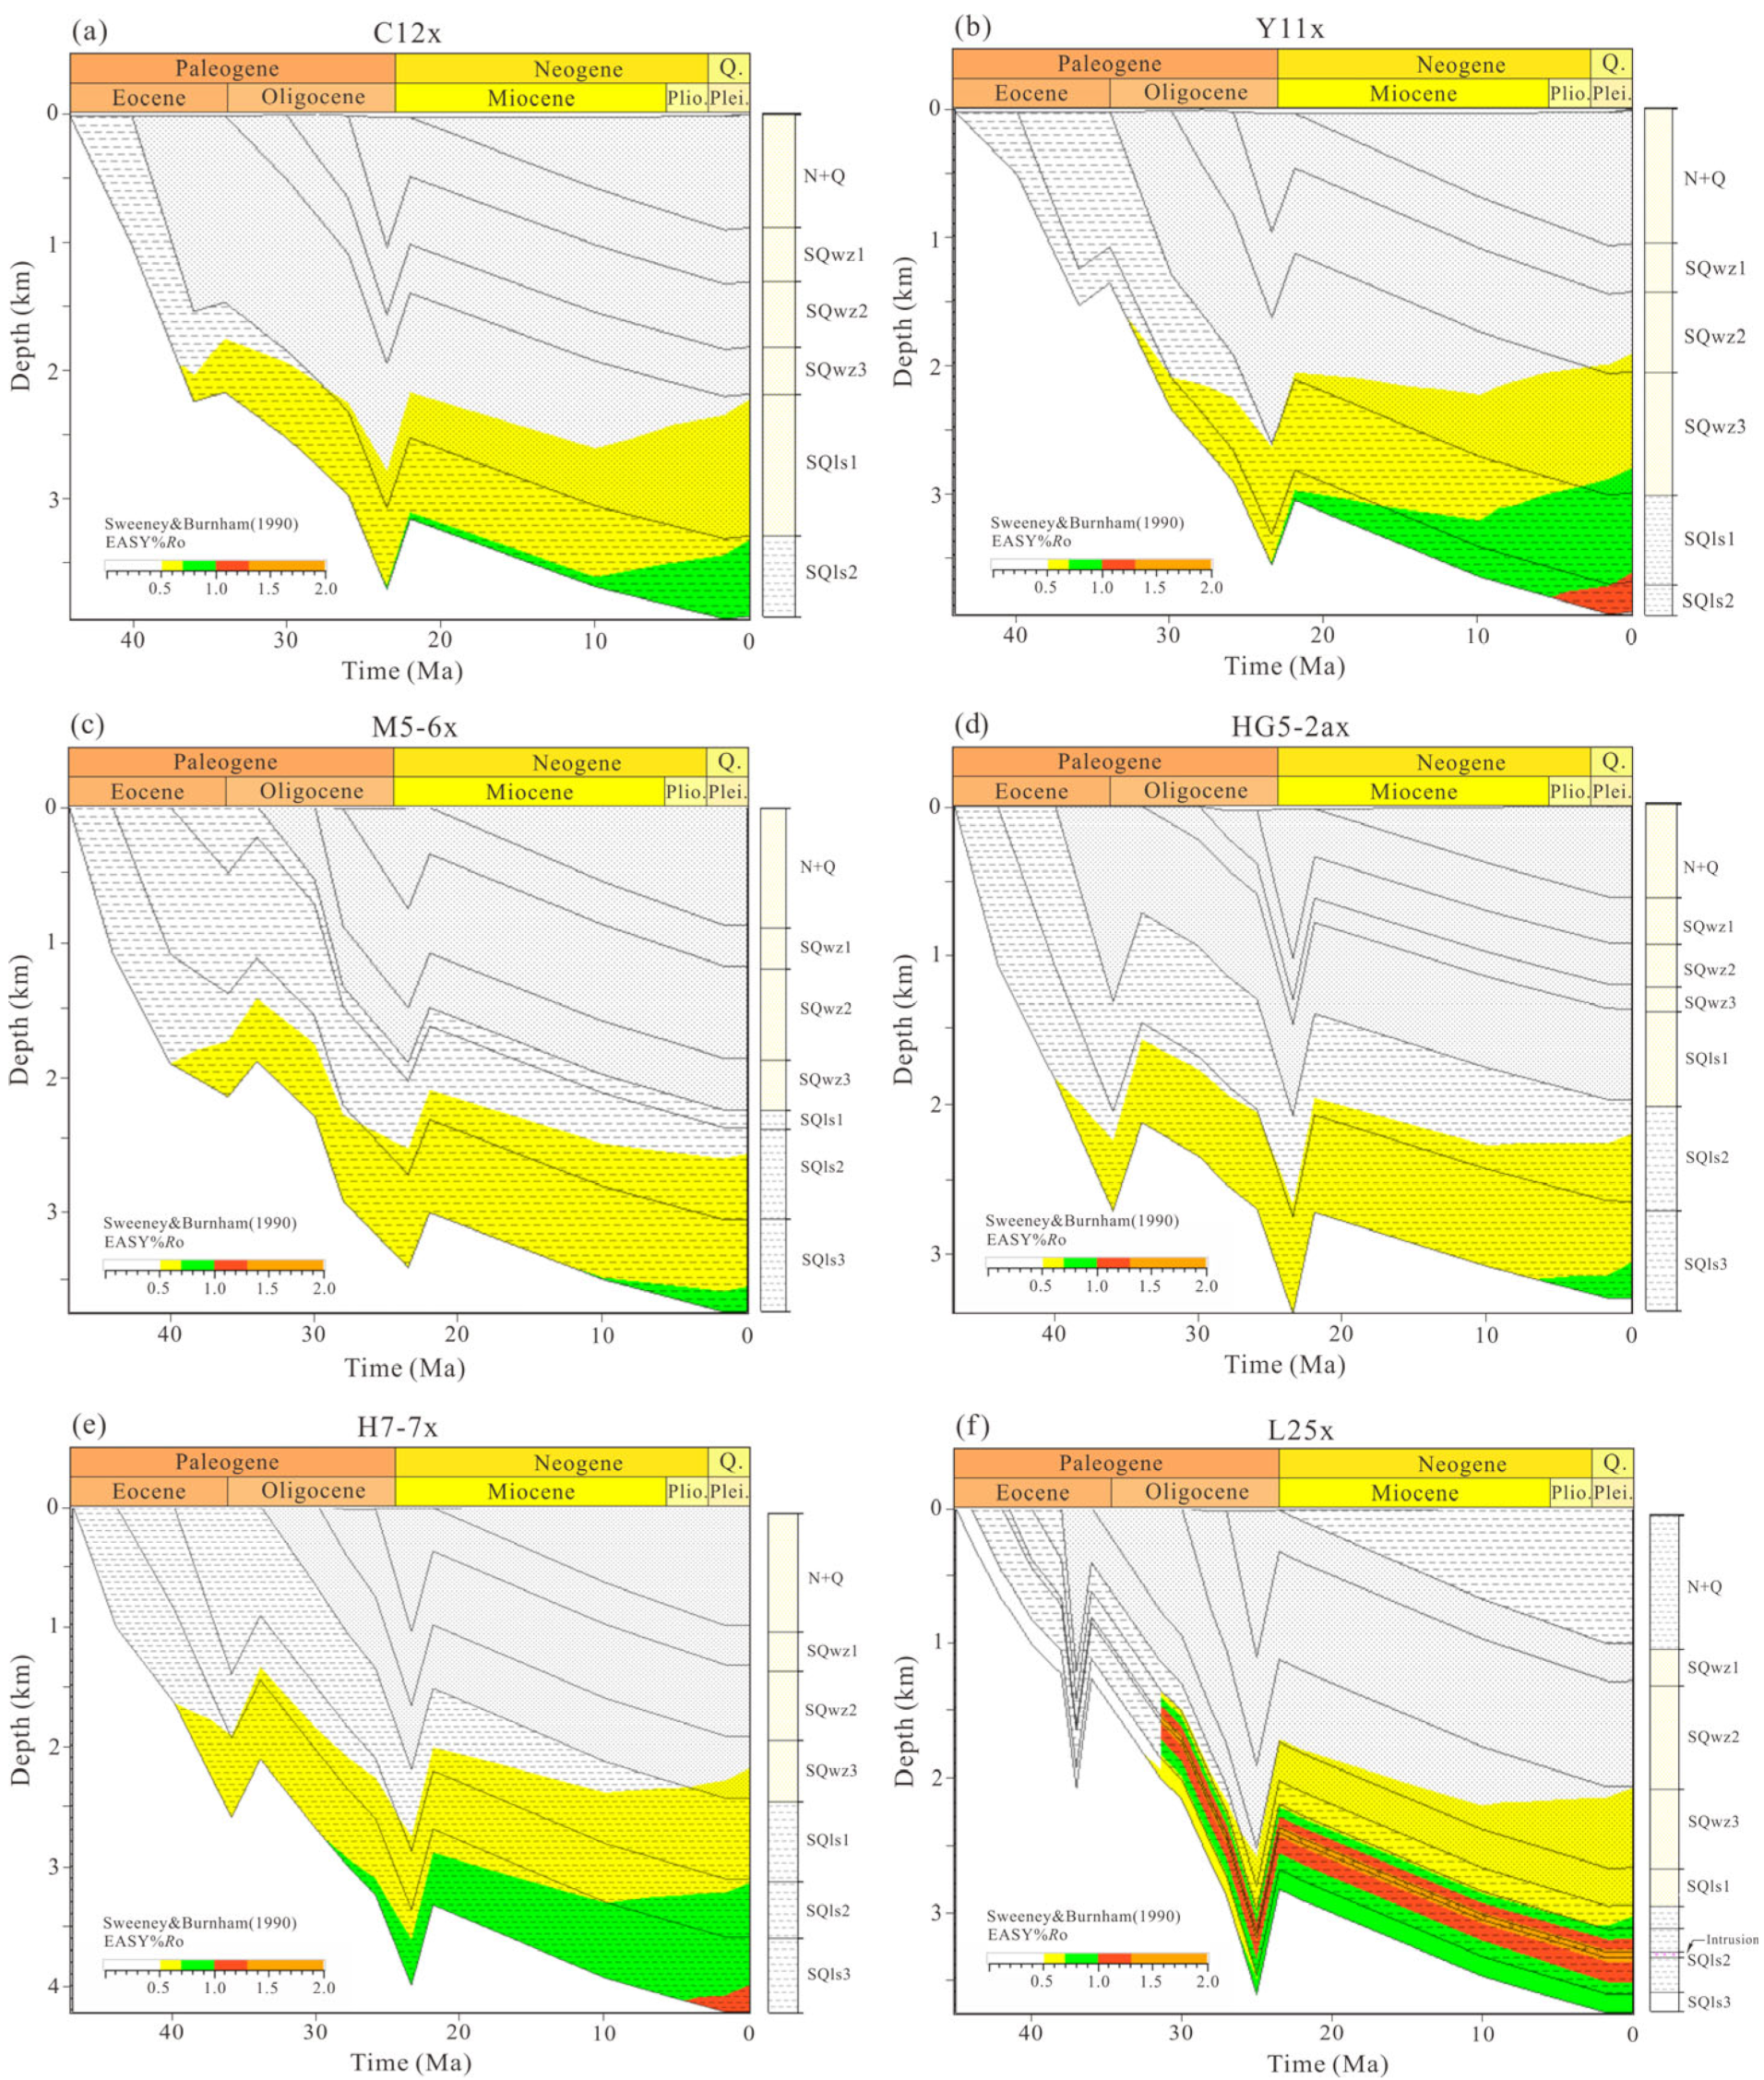
Our thermal history models also incorporate paleo-temperatures, which are given in Figure 6. Simulation results from the study wells show that the Eocene Liushagang Formation of the FD reaches maximum temperatures in the present day, ranging from 110 to 150 °C.

4.3. Maturity History of 1D Basin Modeling

Figure 7 displays models of maturity history for the wells under study. According to the hydrocarbon generation process proposed by Tissot and Welte (1984) [30], the source rocks in the FD range from the early-mature stage (0.5–0.7% Ro) to the late oil generation stage (1.0–1.3% Ro). One-dimensional basin modeling from the well C12x characterizes the thermal evolution of source rocks in the step-fault zone. The SQls2 source rocks entered the oil window in the Late Eocene (35 Ma) and reached the main oil stage presently (Figure 7a). SQls1 source rocks reached the early-mature stage by the Middle Oligocene (28 Ma). The maturity history of hydrocarbon source rocks in the central sag zone is shown in Figure 7b, where the Liushagang Formation’s bottom met the maturity requirements for oil generation during the Early Oligocene (33 Ma), passed the early oil generation stage at 23.5 Ma, and has now reached the late oil generation stage. Owing to the relatively low heat flows (Figure 5d,h), hydrocarbon source rocks in the slope zone of the western FD display lower thermal maturity than in other regions. Only the bottom of SQ2 and SQ3 has reached an early-mature stage (Figure 7c,d). Figure 7e depicts the maturity history of source rocks in the slope zone of the eastern FD. Eocene source rocks entered the early oil stage around 40 Ma, consistent with those in the western FD, and underwent burial and thermal evolution, eventually reaching a peak oil generation stage. Furthermore, source rocks adjacent to volcanic rocks reached a post-mature stage with Ro values greater than 2.0% (Figure 7f).

5. Discussion

5.1. Hydrocarbon Generation History

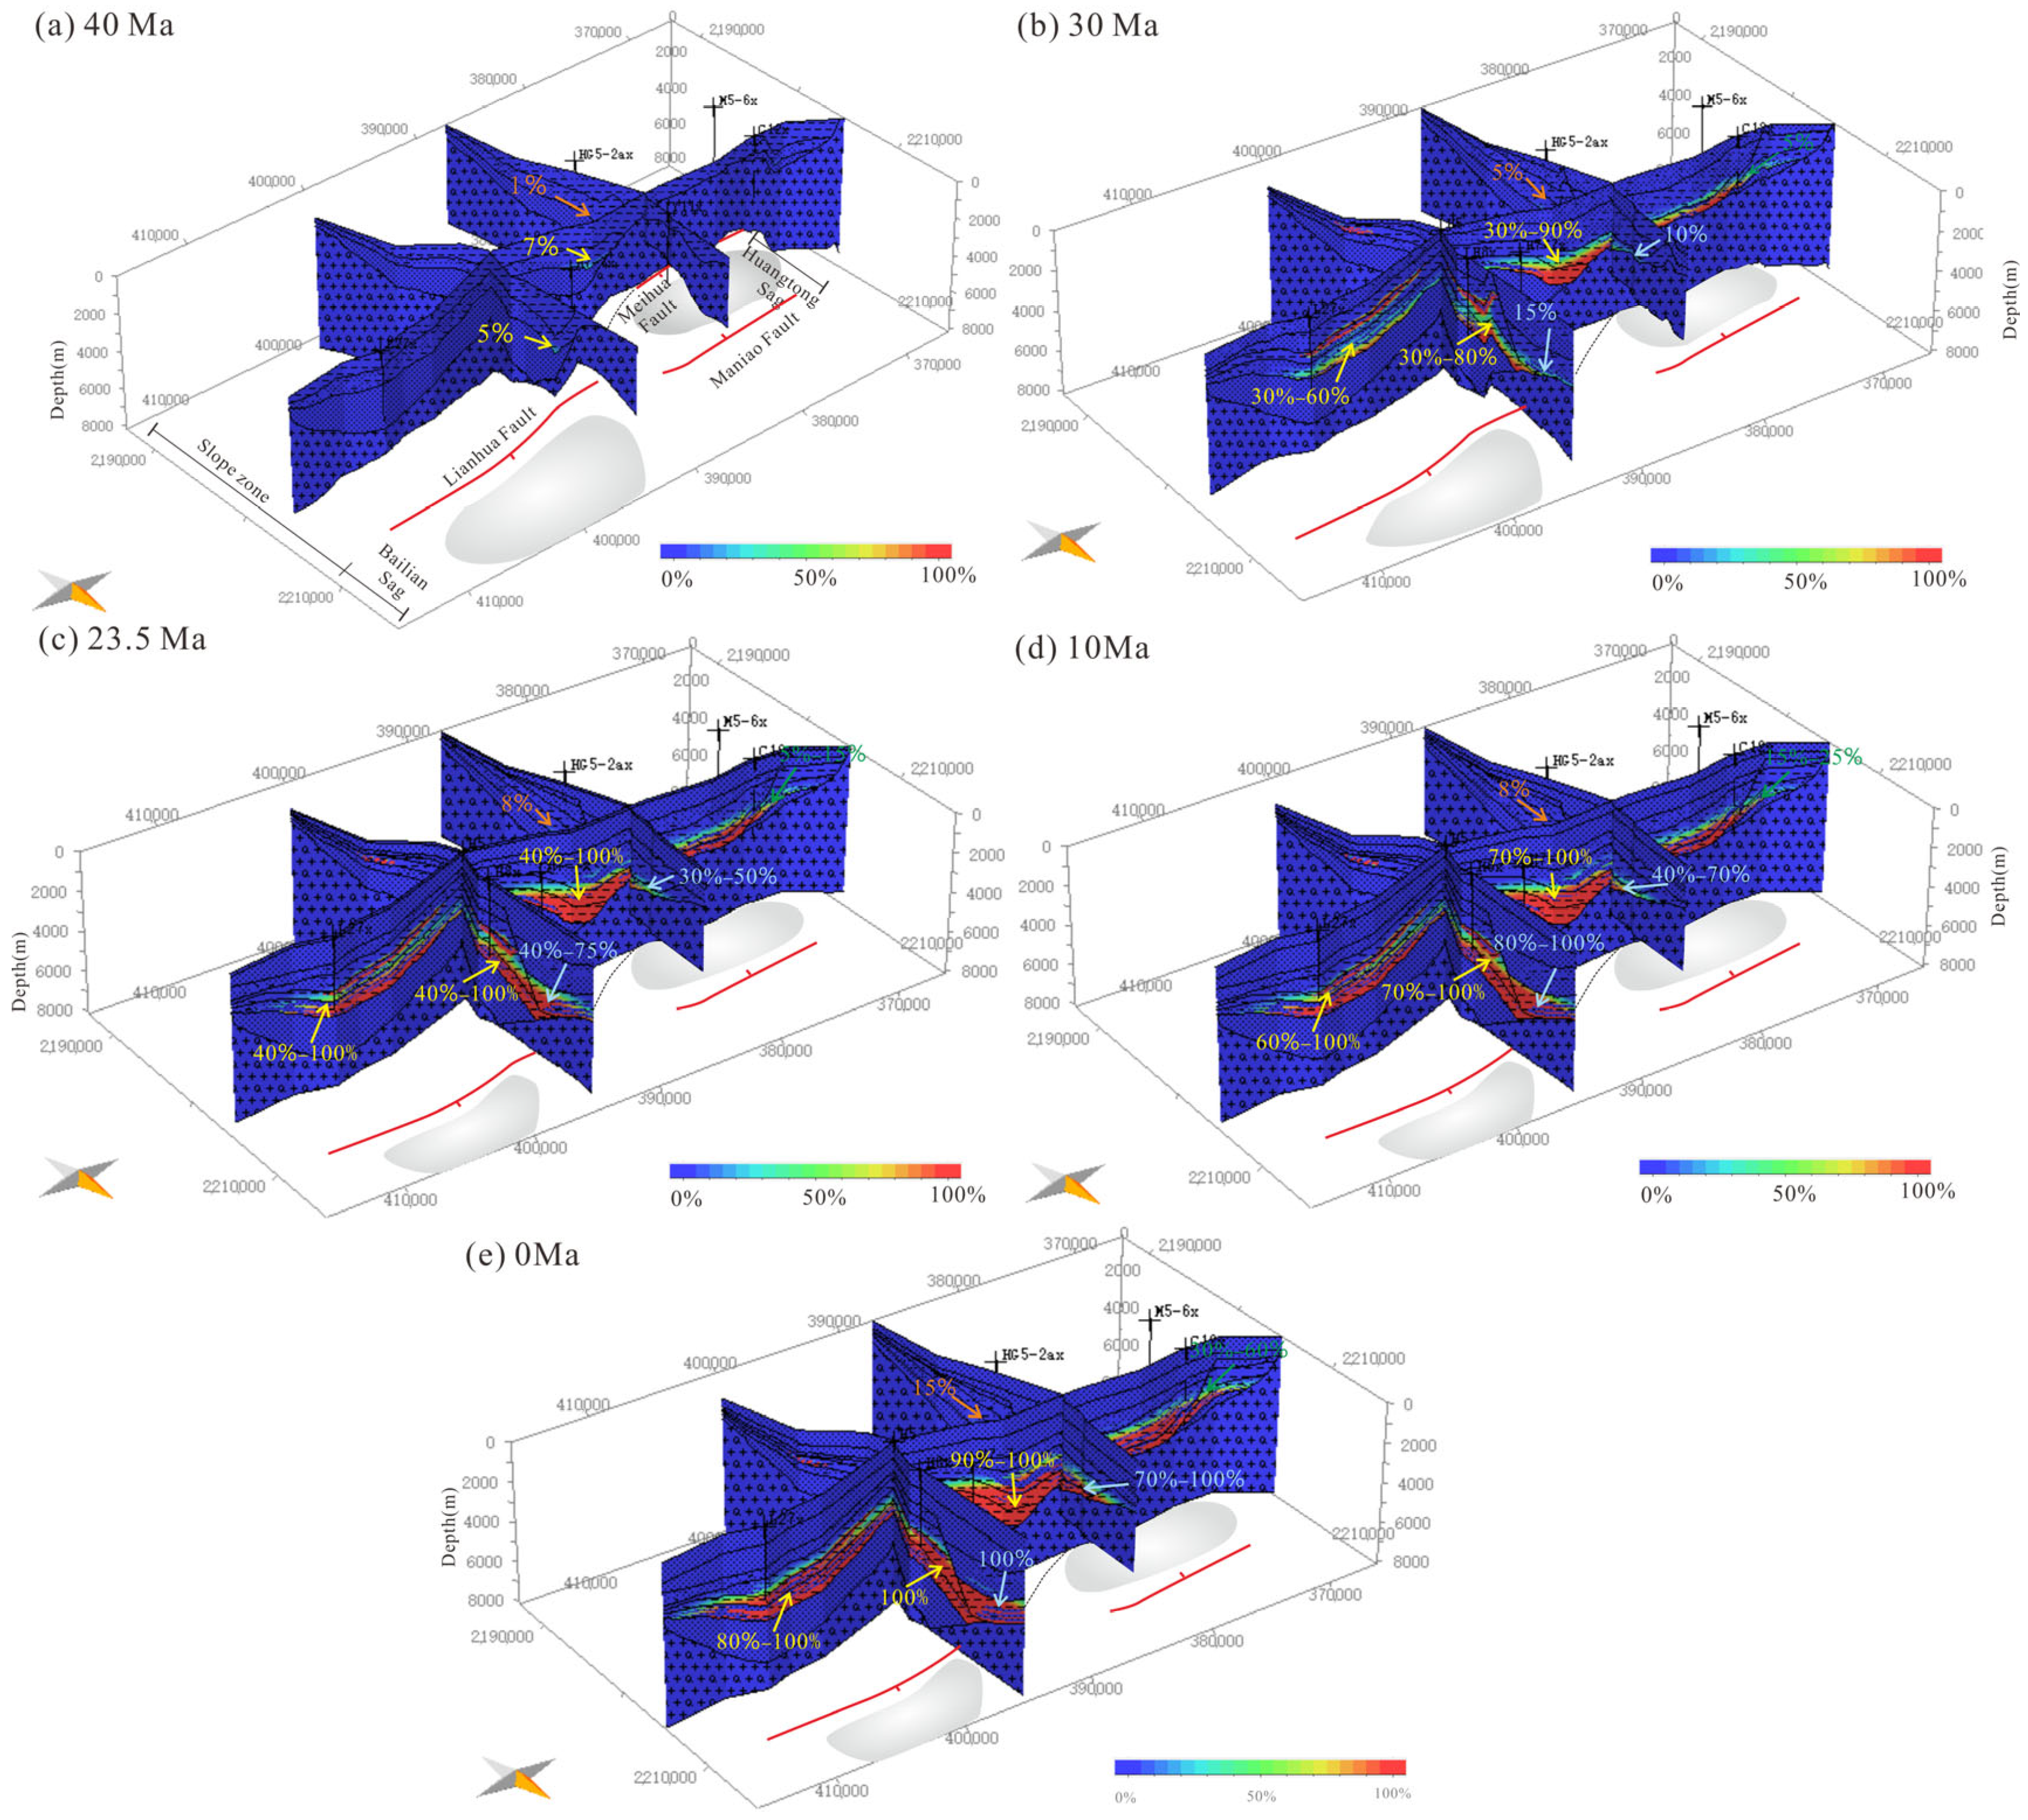
Although the results of 1D basin modeling can only reflect local information, they can provide reference parameters, such as sedimentary rates, boundary conditions, and approximate maturity ranges for source rocks, for calibrating 2D basin modeling. Three representative profiles were selected for 2D basin modeling to reconstruct the dynamic hydrocarbon generation history of the FD (Figure 3). The transformation ratio (TR) generally increases with the maturity of source rocks, and it is widely used to indicate the timing of hydrocarbon generation and expulsion [2,31]. Early oil, peak oil, and late oil windows are defined based on TR, with ranges of 10–25%, 25–50%, and 50–80%, respectively, while TR values above 80% indicate the beginning of oil cracking to gas, with the cracking process ending at a TR of 99%. Figure 8 shows the evolution of the TR with geological time in the FD. It is observed that the source rocks in the step-fault zone underwent an initial period of hydrocarbon generation, with slow hydrocarbon generation starting in the Early Oligocene. The TR value was lower than 15% until 10 Ma when it entered the early oil stage (Figure 8d). Currently, the source rocks have reached the peak oil generation stage to the late oil stage, with TR values ranging from 30% (SQls1) to 50% (SQls2) (Figure 8e). It is consistent with the simulation results of well C12x (Figure 9a). The source rocks of the central sag zone also had a single hydrocarbon generation phase, but over a longer timespan (30–0 Ma) (Figure 9b). Both the SQls2 and SQls1 source rocks reached the early oil window at the Late Oligocene (about 30 Ma), with TRs exceeding 10% (Figure 8b). In the eastern Bailian Sag, due to the greater burial depth, the source rocks reached the late oil stage at 23.5 Ma, with TR values ranging from 40% (SQls1) to 75% (SQls2), and entered the wet gas stage at 10 Ma (Figure 8c,d). In the western Huangtong Sag, the source rocks passed the peak oil generation stage around 10 Ma, with TR values ranging from 40% (SQls1) to 70% (SQls2), and have currently reached the gas generation stage (Figure 8d,e). In contrast, the source rocks in the slope zone were characterized by two major hydrocarbon generation stages. It is evident that the SQls3 source rocks show two stages with relatively high hydrocarbon generation rates, 40–23.5 Ma and 10–0 Ma, respectively (Figure 9c,d). However, the lower heat flow and shallow depth of burial have resulted in a TR of approximately 15% at present, indicating poor resource potential in this area (Figure 8e). The slope of the eastern FD is steeper than that of the western part, leading to a deeper burial of source rocks [9]. The SQls3 source rocks started hydrocarbon generation at 40 Ma and reached the late oil stage at 30 Ma (Figure 8a,b). At the end of the first stage, they entered the gas generation stage with a TR exceeding 90% (Figure 8c). Meanwhile, the SQls2 source rocks were at the peak oil generation stage with a TR ranging from 40% to 60% (Figure 8c). They then almost ceased hydrocarbon generation at 23.5–10 Ma due to the reduced heat flows and tectonic uplift. After 10 Ma, the SQls3 and SQls2 source rocks jointly contributed to the second hydrocarbon generation stage (Figure 8d,e). The simulation results of wells H7-7x and L25x are consistent with the conclusion. In addition, the heating caused by volcanic rocks led to an abrupt increase in TR at 31.4 Ma with the hydrocarbon generation rate exceeding 1 mg HC/g TOC/Ma (Figure 9f). In summary, the heat flow variations caused by tectonic evolution and the intrusion of volcanic rocks are the reasons for the different hydrocarbon generation timing in different structural units of the FD.

5.2. Critical Moment for the Petroleum System

In this study, we have developed an events chart of the Paleogene to the present petroleum system in the Fushan Depression, incorporating our findings as well as information from the previous literature (Figure 10) [6,7,14,16]. This chart offers a concise overview of the temporal relations between different elements and processes of the petroleum system. The critical moment refers to the timing of hydrocarbon generation, migration, and accumulation.
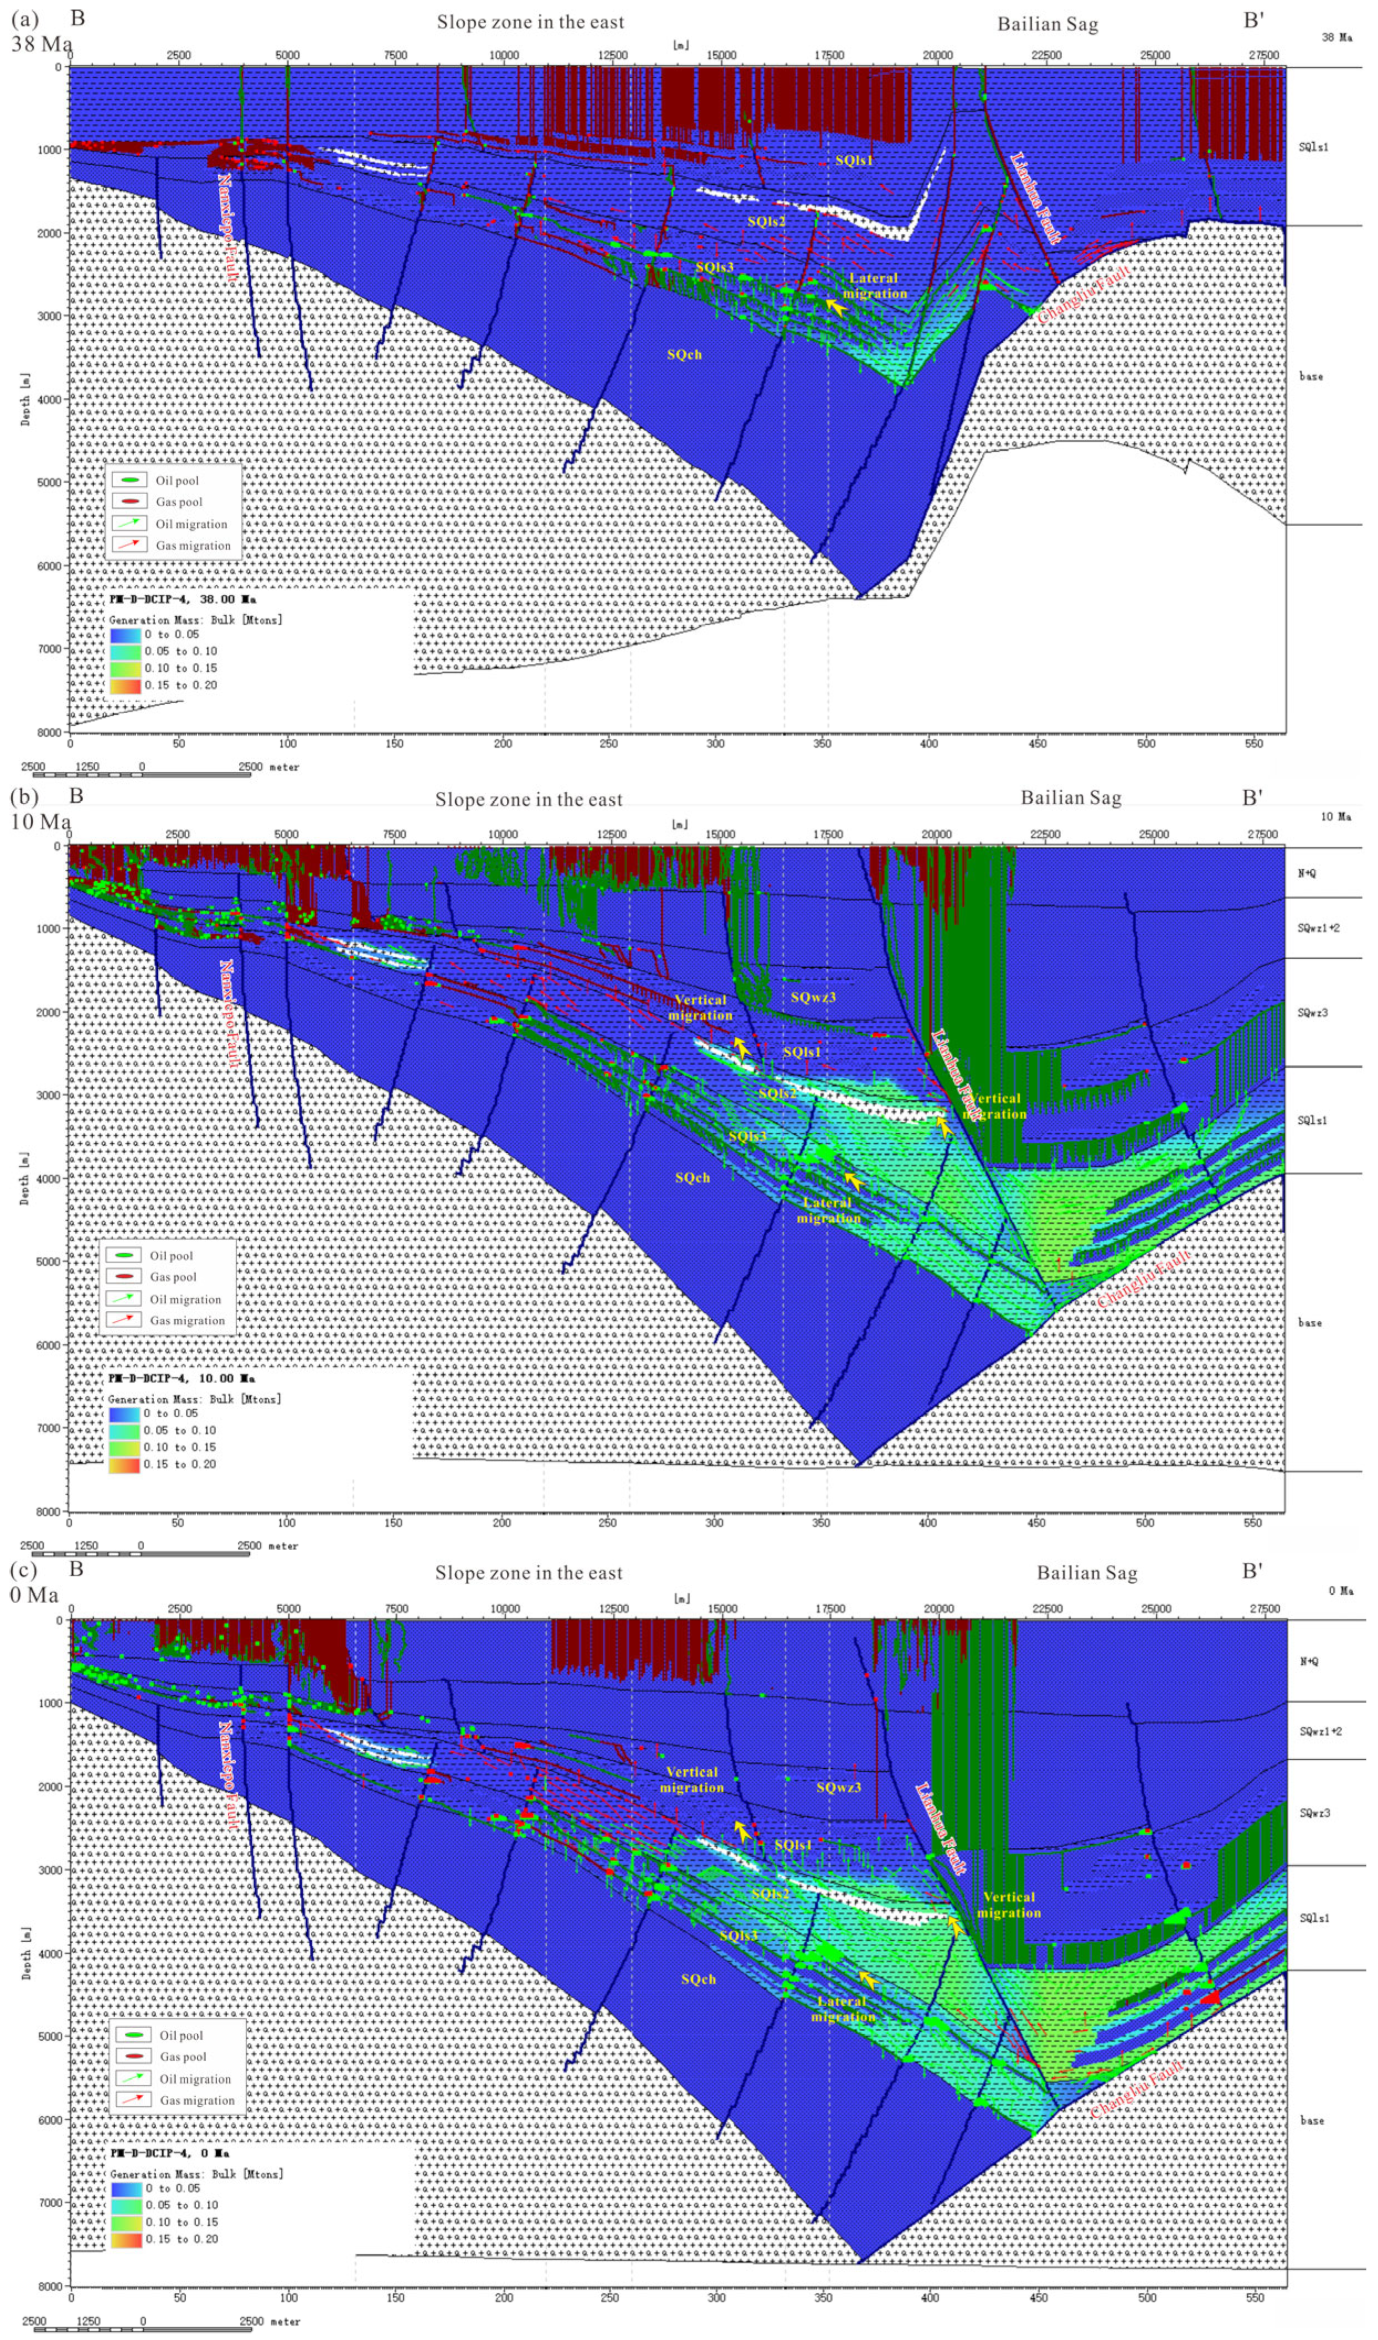
The findings indicate that hydrocarbons in the step-fault zone mainly originated from the SQls2 source rocks and vertically migrated into the sandstones of SQls1 and SQwz3. The complex fault system and mudstone intervals of SQls1 provided favorable sealing conditions. The results of this basin modeling study have demonstrated that hydrocarbon generation and migration in this region primarily occurred within 10 million years, which is the main reason for the late-stage accumulation of hydrocarbons. These findings are consistent with the results reported by Wang et al. (2022) (7–2 Ma) [7] (Figure 11b,c). All the SQls2 and SQls1 mudstones are effective source rocks for the central sag zone, with sandstone interlayers serving as reservoirs. Hydrocarbon generation initiated in the early stage (30 Ma), while vertical migration began after 10 Ma, with migration occurring at 6 Ma, suggesting that a significant amount of hydrocarbons has been retained in in-source lithologic reservoirs and shale reservoirs (Figure 11a–c). It suggests favorable areas for unconventional oil and gas exploration in the FD. Hydrocarbons in the slope zone of the western FD accumulated in the sandstones of the lower Liushagang Formation (SQls3 and lower SQls2) due to the immature source rocks from the upper section (upper SQls2 and SQls1). Migration and accumulation only occurred during the second hydrocarbon generation stage (8–2 Ma) as fewer hydrocarbons were generated during the earlier stage (40–23.5 Ma). By contrast, two oil charging events occurred in the slope zone of the eastern FD, corresponding to two hydrocarbon generation stages. During the first stage, hydrocarbons, contributed by the SQls3 mudstones, migrated into the upper SQls3 and lower SQls2 sandstones, forming the lower petroleum play of the FD (lower layer of the double-layered structure) (Figure 12a). In the second stage, the SQls3 source rock reached peak oil generation, while the SQls2 and SQls1 source rocks entered the early oil generation phase. These source rocks provided sufficient hydrocarbons for the lower and upper petroleum plays, respectively, during 10–0 Ma (Figure 12b,c).

6. Conclusions

A basin modeling investigation has been conducted on six wells and three profiles to reconstruct the burial, thermal, and hydrocarbon generation histories of the Eocene source rocks in the FD. The results indicate that the source rocks in the step-fault zone were buried shallowly and experienced higher heat flows during the rifting phase, followed by lower heat flows during the post-rifting phase. The SQls2 mudstones are the primary hydrocarbon source rocks, characterized by a major hydrocarbon generation stage at 10–0 Ma. In the central sag zone, high heat flows and continuous burial led to a long-lasting hydrocarbon generation stage (30–0 Ma) of the source rocks. The eastern Bailian Sag and the western Huangtong Sag reached hydrocarbon generation peaks at 23.5 Ma and 10 Ma, respectively. Currently, both sags exhibit TR values exceeding 90%. The source rocks in the slope zone exhibit two individual stages of hydrocarbon generation (40–23.5 Ma and 10–0 Ma) controlled by the tectonic uplift and decreased heat flows during the Miocene. However, the gradient and heat flow of the eastern FD slope are greater than those of the western FD, resulting in the different thermal evolution of source rocks. In the slope zone of the western FD, only the SQls3 source rocks contribute to hydrocarbon accumulation, while in the slope zone of the eastern FD, the entirety of the source rocks from the Liushagang Formation has reached a major oil generation phase.

Author Contributions

B.Z.: provided ideas, wrote, reviewed, and edited the manuscript; Z.L. and M.L.: revised the manuscript; T.Y., Y.S. and H.G.: collected data and materials; X.W. and F.L.: analyzed data. All authors have read and agreed to the published version of the manuscript.

Funding

This study was funded by the Hainan Fushan Oilfield Exploration and Development Company (2021-HNYJ-010).

Data Availability Statement

Data will be made available on request.

Acknowledgments

We appreciate the valuable suggestions provided by the editor and anonymous reviewers regarding our manuscript.

Conflicts of Interest

The authors declare no conflict of interest.

References

  1. Karahanoǧlu, N.; Erler, A. Mathematical approach to hydrocarbon generation history and source rock potential in the Thrace Basin, Turkey. Mar. Pet. Geol. 1995, 12, 587–596. [Google Scholar] [CrossRef]
  2. Makeen, Y.M.; Abdullah, W.H.; Pearson, M.J.; Hakimi, M.H.; Ayinla, H.A.; Elhassan, O.M.A.; Abas, A.M. History of hydrocarbon generation, migration and accumulation in the Fula sub-basin, Muglad Basin, Sudan: Implications of a 2D basin modeling study. Mar. Pet. Geol. 2016, 77, 931–941. [Google Scholar] [CrossRef]
  3. Hakimi, M.H.; Al-Matary, A.M.; Hersi, O.S. Burial and thermal history reconstruction of the Mukalla-Sayhut Basin in the Gulf of Aden, Yemen: Implications for hydrocarbon generation from Paleocene potential source rock. J. Afr. Earth Sci. 2018, 144, 59–75. [Google Scholar] [CrossRef]
  4. Gawad, E.A.A.E.; Ghanem, M.F.; Lotfy, M.M.; Mousa, D.A.; Temraz, M.G.; Shehata, A.M. Burial and thermal history simulation of the subsurface Paleozoic source rocks in Faghur basin, north Western Desert, Egypt: Implication for hydrocarbon generation and expulsion history. Egypt. J. Pet. 2019, 28, 261–271. [Google Scholar] [CrossRef]
  5. Li, M.J.; Wang, T.G.; Liu, J.; Lu, H.; Wu, W.Q.; Gao, L.H. Occurrence and origin of carbon dioxide in the Fushan Depression, Beibuwan Basin, South China Sea. Mar. Pet. Geol. 2008, 25, 500–513. [Google Scholar] [CrossRef]
  6. Gan, H.J.; Wang, H.; Shi, Y.; Ma, Q.L.; Liu, E.T.; Yan, D.T.; Pan, Z.J. Geochemical characteristics and genetic origin of crude oil in the Fushan sag, Beibuwan Basin, South China Sea. Mar. Pet. Geol. 2020, 112, 104114. [Google Scholar] [CrossRef]
  7. Wang, X.; Lu, Z.; Li, M.; Guo, H.; Zhu, Z.; Li, X.; Yang, C.; Zeng, B.; Wang, F.; Ran, Z. Petroleum Charging History of the Paleogene Sandstone Reservoirs in the Huangtong Sag of the Fushan Depression, South China Sea. Energies 2022, 15, 1374. [Google Scholar] [CrossRef]
  8. Ma, Q.L.; Zhao, S.E.; Liao, Y.T.; Lin, Z.L. Sequence architectures of Paleogene Liushagang Formation and its significance in Fushan Sag of the Beibuwan Basin. J. China Univ. Geosci. 2012, 37, 667–678. (In Chinese) [Google Scholar]
  9. Liu, E.T.; Wang, H.; Li, Y.; Zhou, W.; Leonard, N.D.; Lin, Z.L.; Ma, Q.L. Sedimentary characteristics and tectonic setting of sublacustrine fans in a half-graben rift depression, Beibuwan Basin, South China Sea. Mar. Pet. Geol. 2014, 52, 9–21. [Google Scholar] [CrossRef]
  10. Liu, E.T.; Wang, H.; Li, Y.; Leonard, N.D.; Feng, Y.X.; Pan, S.Q.; Xia, C.Y. Relative role of accommodation zones in controlling stratal architectural variability and facies distribution: Insights from the Fushan Depression, South China Sea. Mar. Pet. Geol. 2015, 68, 219–239. [Google Scholar] [CrossRef] [Green Version]
  11. Liu, E.T.; Wang, H.; Feng, Y.X.; Pan, S.Q.; Jing, Z.H.; Ma, Q.L.; Gan, H.J.; Zhao, J.X. Sedimentary architecture and provenance analysis of a sublacustrine fan system in a half-graben rift depression of the South China Sea. Sediment. Geol. 2020, 409, 105781. [Google Scholar] [CrossRef]
  12. Li, Y.; Lin, S.; Wang, H.; Luo, D. Depositional setting analysis using seismic sedimentology: Example from the Paleogene Liushagang sequence in the Fushan depression, South China Sea. Geod. Geodyn. 2017, 8, 347–355. [Google Scholar] [CrossRef]
  13. Jin, S.D.; Wang, H.; Cao, H.Y.; Gan, H.J.; Chen, S.B. Lake-type controls on sedimentary infill and petroleum source rocks in the Palaeogene Fushan Depression, Beibuwan Basin, South China. Geol. J. 2019, 55, 3936–3956. [Google Scholar] [CrossRef]
  14. Gan, H.J.; Gong, S.; Tian, H.; Wang, H.; Chen, J.; Ma, Q.L.; Liu, K.X.; Lv, Z.H. Geochemical characteristics of inclusion oils and charge history in the Fushan Sag, Beibuwan Basin, South China Sea. Appl. Geochem. 2023, 150, 105598. [Google Scholar] [CrossRef]
  15. Zeng, B.; Li, M.J.; Wang, X.; Wang, F.Z.; Gong, C.L.; Lai, J.; Shi, Y. Source rock evaluation within a sequence stratigraphic framework of the Palaeogene Liushagang Formation in the Fushan Depression, South China Sea. Geol. J. 2022, 57, 2409–2427. [Google Scholar] [CrossRef]
  16. Zeng, B.; Li, M.J.; Wang, N.; Shi, Y.; Wang, F.Z.; Wang, X. Geochemistry and heterogeneous accumulation of organic matter in lacustrine basins: A case study of the Eocene Liushagang Formation in the Fushan Depression, South China Sea. Pet. Sci. 2022, 19, 2533–2548. [Google Scholar] [CrossRef]
  17. Chen, S.B.; Gan, H.J.; Xia, C.Y.; Zhao, Y.D.; Wang, G.H.; Wang, X. History Simulation of Thermal Evolution and Hydrocarbon Generation of Source Rocks in Bailian Sub-Sag, Fushan Sag, Beibuwan Basin. Xinjiang Pet. Geol. 2014, 35, 672–677. (In Chinese) [Google Scholar]
  18. Li, M.J.; Wang, T.G.; Liu, J.; Zhang, M.Z.; Lu, H.; Ma, Q.L.; Gao, L.H. A discussion on hydrocarbon accumulation dating determined by homogenization temperature and burial history of fluid inclusio—An example from the Fushan depression, Beibuwan Basin. Oil Gas Geol. 2007, 28, 151–158. (In Chinese) [Google Scholar]
  19. Lin, Z.L.; Wang, H.; Li, H.J.; Ma, Q.L.; Li, Y.; Zhao, S.E. Genetic mechanism of double-layer structure in Paleogene of Fushan Sag, Beibu Gulf Basin. Earth Sci. 2015, 40, 169–178. (In Chinese) [Google Scholar]
  20. Liu, E. Tectonic Geothermal History and Hydrocarbon Enrichment Rules in the Fushan Depression, Beibuwan Basin, South China Sea. China University of Geosciences: Wuhan, China, 2015. [Google Scholar]
  21. Peters, K.E.; Kacewicz, M.; Curry, D.J. An overview of basin and petroleum system modeling: Definitions and concepts. In Basin Modeling: New Horizons in Research and Applications; AAPG Hedberg Series; AAPG: Tulsa, OK, USA, 2012; Volume 4, pp. 1–16. [Google Scholar]
  22. Zeinalzadeh, A.; Moussavi-Harami, R.; Mahboubi, A.; Sajjadian, V.A. Basin and petroleum system modeling of the Cretaceous and Jurassic source rocks of the gas and oil reservoirs in Darquain field, south west Iran. Mar. Pet. Geol. 2015, 26, 419–426. [Google Scholar] [CrossRef]
  23. Chen, L.; Gan, H.; Zhu, C.; Tian, J. Study on subsidence history of Weixinan Depression in Beibuwan Basin. J. Xinjiang Pet. Inst. 2002, 14, 12–17. (In Chinese) [Google Scholar]
  24. Wygrala, B. Integrated Study of an Oil Field in the Southern Po Basin, Northern Italy; Kernforschungsanlage Jülich GmbH.: Jülich, Germany, 1989; p. 328. [Google Scholar]
  25. Lachenbruch, A. Crustal temperature and heat productivity: Implications of the linear heat flow relation. J. Geophys. Res. 1970, 75, 3291–3300. [Google Scholar] [CrossRef]
  26. Allen, P.A.; Allen, J.R. Basin Analysis Principles and Applications; Blackwell Scientific Publications: Oxford, UK, 1990; pp. 1–642. [Google Scholar]
  27. Abdalla, Y.M.; Michael, J.P.; William, A.A.; James, E.I.; Arthur, J.W. Modeling petroleum generation in the southern Muglad rift basin, Sudan. Am. Assoc. Pet. Geol. Bull. 1999, 83, 1943–1964. [Google Scholar]
  28. Welte, D.H.; Yukler, A. Petroleum origin and accumulation in basin evolution a quantitative model. Am. Assoc. Petr. Geol. Bull. 1981, 65, 1387–1396. [Google Scholar]
  29. Hakimi, M.H.; Abdullah, W.H.; Shalaby, M.R. Organic geochemistry, burial history and hydrocarbon generation modeling of the upper Jurassic Madbi Formation, Masila basin, Yemen. J. Pet. Geol. 2010, 33, 299–318. [Google Scholar] [CrossRef]
  30. Tissot, B.P.; Welte, D.H. Petroleum Formation and Occurrence; Springer-Verlag: Berlin/Heidelberg, Germany, 1984. [Google Scholar]
  31. Hantschel, T.; Kaurauf, A.I. Fundamentals of Basin and Petroleum Systems Modeling; Springer: Berlin/Heidelberg, Germany, 2009; p. 476. [Google Scholar]
Figure 1. Schematic map showing the location (a) and the structural units (b) of the Fushan Depression (modified after Liu et al., 2015a [10]). Blue arrows indicate representative profiles AA’, BB’ and CC’.
Processes 11 02051 g001
Figure 2. Regional stratigraphy of the Fushan Depression, Beibuwan Basin (modified after Zeng et al., 2022 [7]).
Processes 11 02051 g002
Figure 3. Two-dimensional lithofacies models for three representative profiles showing the sequence stratigraphic division. The locations are illustrated in Figure 1b. FDFM = Fan delta front mudstone; SLM = Shallow lake mudstone; DFM = Braided river delta front mudstone; SDLM: Semi-deep lake mudstone; TBFM = Turbidite fan mudstone; Mixed lithology of N + Q = Sandstone (95%) + Conglomerate (5%); Mixed lithology of SQwz1 + 2 = Sandstone (85%)+ Mudstone (15%); Mixed lithology of SQch = Sandstone (90%) + Mudstone (10%). The locations of the representative profiles AA’, BB’ and CC’ are illustrated in Figure 1b.
Processes 11 02051 g003
Figure 4. Sedimentation rates of different sequences in the well C12x, Y11x, M5-6x, HG5-2ax, H7-7x, and L25x.
Processes 11 02051 g004
Figure 5. Plots of calculated curves and calibration data versus depth ((ac) and (eg)). Diagrams showing the heat flow history with time for studied wells (d,h).
Processes 11 02051 g005
Figure 6. Burial and thermal histories of the studied wells C12x (a), Y11x (b), M5-6x (c), HG5-2ax (d), H7-7x (e) and L25x (f) in the Fushan Depression.
Processes 11 02051 g006
Figure 7. Burial and maturity histories cross all sequences in the representative wells C12x (a), Y11x (b), M5-6x (c), HG5-2ax (d), H7-7x (e) and L25x (f).
Processes 11 02051 g007
Figure 8. Evolution of the transformation ratio with age in the FD. The orange symbols represent the slope zone in the western FD, the yellow symbols represent the slope zone in the eastern FD, the blue symbols represent the central sag zone, and the green symbols represent the northern step-fault zone.
Processes 11 02051 g008
Figure 9. Evolution of the transformation ratio and hydrocarbon generation rate with age in the studied wells C12x (a), Y11x (b), M5-6x (c), HG5-2ax (d), H7-7x (e) and L25x (f).
Processes 11 02051 g009
Figure 10. Events chart of the Paleogene to the present petroleum system in the Fushan Depression.
Processes 11 02051 g010
Figure 11. Simulation results of hydrocarbon generation, migration, and accumulation in Profile CC’ at critical moments 30 ma (a), 10 ma (b) and 0 ma (c).
Processes 11 02051 g011
Figure 12. Simulation results of hydrocarbon generation, migration, and accumulation in Profile BB’ at critical moments 38 ma (a), 10 ma (b) and 0 ma (c).
Processes 11 02051 g012
Table 1. Main input data for basin modeling of the studied well.
FormationAge (Ma)C12x WellY11x Well
/EventFromToTopThicknessLithologyTopThicknessLithology
(m)/Erosion (m) (m)/Erosion (m)
Quaternary S.1.650015ST(90%) + C(10%)020ST(98%) + C(2%)
Neogene S.23.51.6515883ST(92%) + C(8%)201038ST(95%) + C(5%)
Erosion-T224.523.5898−500-1058−450-
SQwz12724.5898420ST(95%) + SH(5%)1058381ST(90%) + SH(10%)
SQwz230271318506ST(80%) + SH(20%)1439626ST(77%) + SH(23%)
SQwz334301824368ST(85%) + SH(15%)2065953ST(69%) + SH(31%)
Erosion-T436342192−50-3018−100-
SQls1403621921105ST(70%) + SH(30%)3018699ST(35%) + SH(65%)
SQls244403297623ST(25%) + SH(75%)3717233ST(5%) + SH(95%)
SQls349443920--3950--
SQch6549------
FormationAge (Ma)M5-6x WellHG5-2ax Well
/EventFromToTopThicknessLithologyTopThicknessLithology
(m)/Erosion (m) (m)/Erosion (m)
Quaternary S.1.650010ST(93%) + C(7%)015ST(90%) + C(10%)
Neogene S.23.51.6510889ST(95%) + C(5%)15603ST(96%) + SH(4%)
Erosion-T224.523.5899−350-618−650-
SQwz12724.5899300ST(85%) + SH(15%)618307ST(95%) + SH(5%)
SQwz230271199679ST(71%) + SH(29%)925276ST(72%) + SH(28%)
SQwz334301878382ST(75%) + SH(25%)1201163ST(70%) + SH(30%)
Erosion-T436342260−150-1364−450-
SQls140362260132ST(37%) + SH(63%)1364609ST(65%) + SH(35%)
SQls244402392678ST(5%) + SH(95%)1973678ST(10%) + SH(90%)
SQls349443070680ST(28%) + SH(72%)2651649ST(8%) + SH(92%)
SQch65493750--3300--
FormationAge (Ma)H7-7x WellL25x Well
/EventFromToTopThicknessLithologyTopThicknessLithology
(m)/Erosion (m) (m)/Erosion (m)
Quaternary S.1.650010ST(98%) + SH(2%)010ST(91%) + C(9%)
Neogene S.23.51.6510999ST(90%) + SH(10%)101012ST(88%) + SH(12%)
Erosion-T224.523.51009−600-1022−700-
SQwz12724.51009326ST(90%) + SH(10%)1022278ST(70%) + SH(30%)
SQwz230271335591ST(86%) + SH(14%)1300778ST(48%) + SH(52%)
SQwz334301926510ST(80%) + SH(20%)2078603ST(26%) + SH(74%)
Erosion-T436342436−300-2681−550-
SQls140362436669ST(31%) + SH(69%)2681455ST(8%) + SH(92%)
SQls244403105485ST(2%) + SH(98%)3136510ST(11%) + SH(86%) + G(3%)
SQls349443590630ST(25%) + SH(75%)3646116ST(43%) + SH(57%)
SQch65494220--3762--
Note. S. = Sediments. C = Conglomerate. ST = Sandstone. SH = Shale. G = Gabbro.
Table 2. Summary of input parameters for Eocene source rocks.
FormationTOCHIKerogen TypeKinetic Model
(%)(mg HC/g TOC)
SQls11.18180Type II(Burnham, 1989 T-II)
SQls21.78243Type II(Burnham, 1989 T-II)
SQls31.62248Type II(Burnham, 1989 T-II)
Disclaimer/Publisher’s Note: The statements, opinions and data contained in all publications are solely those of the individual author(s) and contributor(s) and not of MDPI and/or the editor(s). MDPI and/or the editor(s) disclaim responsibility for any injury to people or property resulting from any ideas, methods, instructions or products referred to in the content.