Article

Characterization of Extra Low-Permeability Conglomerate Reservoir and Analysis of Three-Phase Seepage Law

1
School of Geoscience and Technology, Southwest Petroleum University, Chengdu 610500, China
2
Research Institute of Exploration and Development, PetroChina Xinjiang Oilfield Company, Karamay 834000, China
*
Author to whom correspondence should be addressed.
Processes 2023, 11(7), 2054; https://doi.org/10.3390/pr11072054
Submission received: 8 May 2023 / Revised: 13 June 2023 / Accepted: 7 July 2023 / Published: 10 July 2023
(This article belongs to the Special Issue New Insight in Enhanced Oil Recovery Process Analysis and Application)

Abstract

:
The micro distribution of residual oil in low-permeability sandstone reservoirs is closely related to pore structure, and the differences in pore structure often determine the reservoir’s productivity and development effectiveness from a macro perspective. On the basis of in-depth research, this paper analyzes the distribution law of the remaining microscopic oil, establishes the digital core multi-stage pore network modeling of the strongly sorted heterogeneous conglomerate reservoir in the Lower Wuerhe Formation of Block 8 of the Karamay Oilfield, the three-phase seepage simulation method considering the release of dissolved gas, and the three-phase permeability curve test. The research results are as follows: (1) Conventional physical property analysis shows that the permeability of core samples exhibits an inverse rhythmic distribution with layer depth. (2) CT core analysis and mercury injection experiments indicate that the area with porosity ranging from 9% to 21% accounts for 79% and is the main seepage channel area. Larger pores play an important role in seepage. (3) Through comparative experiments on cores with different permeability, it was found that the degassing phenomenon of low-permeability rock samples is more severe. In the actual process of reservoir development, it is necessary to reasonably handle the impact of water injection on development effectiveness, select appropriate water injection methods and cycles, and avoid premature water breakthrough in ultra low-permeability reservoirs.

1. Introduction

With the rapid improvement of oil and gas technology and the continuous deepening of exploration and development, the reserves and production of low-permeability oil and gas reservoirs continue to increase. According to preliminary statistics, 58% of China’s existing proven unutilized oil-in-place reserves are oil reservoirs with a permeability of less than 50 × 10−3 μm2 (50 × 10−6 mD) [1]. Low-permeability oil reservoirs are currently the mainstay of production-capacity construction and oilfield production in new areas, including many conglomerate oil reservoirs [2]. Current production-capacity construction specifically includes geological surveys, logging and other process technologies for low-permeability oil reservoirs, construction work in pipelines, pumping stations, sewage discharge, safety, and comprehensive information management and digital oilfield construction. Due to the unique pore structure of low-permeability reservoirs, they exhibit characteristics such as high-water injection pressure, slow oil well performance, rapid increases in water content after water breakthrough, and rapid decreases in the liquid production and oil recovery index in actual development. These characteristics are closely related to their pore structure, as the complexity of pore structure brings great difficulties to water injection and oil recovery, leading to increased development difficulty [3,4], and a large amount of remaining oil is retained in the reservoir. The physical properties of the rock surface in low-permeability conglomerate reservoirs vary greatly. The capillary and interfacial forces in pores are significantly different from those in medium- and high-permeability reservoirs. Therefore, the distribution mechanism of residual oil in sandy conglomerate reservoirs is different from that of conventional reservoirs with medium and high permeability. This makes some techniques and comprehensive adjustment methods suitable for residual oil in the later stage of development of medium- and high-permeability conventional reservoirs unusable in low-permeability reservoirs [5]. The conglomerate reservoir has large rock particles, developed fractures, and strong heterogeneity, but the matrix is dense. Generally speaking, the physical characteristics of reservoirs are low porosity, low permeability, and dense reservoirs [6]. According to statistics, the average recovery rate of low-permeability reservoirs in China and other countries is only about 20%, and most of the crude oil is retained in the reservoir and cannot be recovered [7]. Therefore, there is great potential for improving the recovery rate of low-permeability and extra low-permeability reservoirs. In order to better develop low-permeability conglomerate reservoirs, it is necessary to conduct in-depth research on reservoir characterization and seepage laws. At the same time, the method of studying the flow problem in porous media at the pore scale is of great significance for finely characterizing the microscopic flow mechanism and revealing new cognitions to greatly improve oil recovery [8]. Microscopic seepage theory and macroscopic seepage theory are two parallel theoretical systems, which together constitute the theoretical system of seepage in porous media [9]. Therefore, from a theoretical point of view, it is of great significance to study the laws of fluid flow in porous media at the pore scale for the development of microscopic seepage theory and the improvement of the theoretical system of seepage in porous media.
The Lower Wuerhe Formation of the Upper Permian system in Block 8 of Karamay Oilfield is located in the Baijiantan area of Karamay City, about 35 km southeast of Karamay City. The terrain of the whole area is flat, the average ground elevation is about 267 m, and the relative ground height difference is less than 10 m [10]. The north of the reservoir is adjacent to the seventh area, in the west there is a pinch out in the paleo-uplift of Well 202, the east is bordered by the tenth area, and the southeast dips at the slope belt of the northwestern margin of the Junggar Basin. The Lower Wuerhe Formation in Block 8 was discovered in May 1965 due to oil production from Well JY-1, and a development test plan was prepared in December 1978. So far, it has gone through development tests, one infill and widening adjustment, and two infill adjustments [11]. The geographical and structural location of Block 8 of the Karamay Oilfield is shown in Figure 1.
The Lower Wuerhe Formation in Block 8 of the Karamay Oilfield is a glutenite complex of fan delta piedmont pluvial facies, with an average permeability of about 1.2 × 10⁻³ μm2, and high-angle fractures with east–west strikes are developed, which is a typical extra low-permeability fractured conglomerate reservoir [12]. The extra low-permeability conglomerate reservoir is easy to degas during the production process, and there is three-phase seepage in the formation, which seriously affects the water injection development and is an important reason for the low water flooding rate [13]. It is necessary to establish a test or prediction method for the three-phase relative permeability curve suitable for extra low-permeability conglomerate reservoirs to quantitatively evaluate the water flooding mechanism under degassing conditions and to provide support for reservoir engineering calculations under various production conditions.
The three-phase relative permeability curves under different saturation histories of the formation can be used to understand the three-phase seepage law of extra low-permeability conglomerate reservoirs [14]. During the development of low-permeability oil and gas reservoirs, there is a phenomenon of non-linear seepage between oil and water [15]. The seepage curve is roughly composed of two parts. The low-speed seepage section is non-linear, and the high-speed seepage section is quasi-linear. The non-linear section is the main stage affecting the development of low-permeability oil fields [16]. There are two main methods for studying three-phase relative seepage problems: the mathematical modeling method and the physical simulation method. Stone’s statistical model is often used in the mathematical model method; that is, the two-phase relative permeability curve is used to calculate the three-phase relative permeability curve [17]. This method is fast, simple, and widely used, but it is too idealized with multiple assumptions and is only applicable to water wet rock cores [18]. In some cases, the calculation results deviate from the experimental values. The actual flow process of the reservoir can be simulated by using the physical simulation method to test the three-phase relative permeability curve [19]. This method is relatively straightforward and can also provide experimental data under up to 13 saturation process conditions for the actual situation of oil and gas migration and production [20]. However, due to some limitations of laboratory instruments and measurement methods, three-phase saturation cannot be measured synchronously and accurately, and there are problems, such as end effect, which restrict the study of measuring the three-phase relative permeability curve with the physical simulation method.
Currently, research on conglomerate reservoirs primarily concentrates on describing the reservoir, investigating the formation mechanism, conducting seismic interpretation, and performing logging interpretation using geological methods. However, there is relatively less research dedicated to characterizing conglomerate reservoirs and understanding the three-phase seepage law [21]. The existing experimental research methods of the seepage law are mainly aimed at medium-high-permeability reservoirs [22]. For low-permeability reservoirs, rocks have complex physical properties and abnormal seepage laws, and problems in the development of many low-permeability reservoirs need to be solved urgently [23]. Therefore, it is necessary to study the characterization of ultra low-permeability conglomerate reservoirs and three-phase seepage laws. The purpose of this paper is to establish a laboratory test method for the three-phase permeability of extra low-permeability conglomerate reservoirs and a three-phase seepage simulation method based on the pore network model and to obtain extra low-permeability conglomerate reservoirs in the Lower Wuerhe Formation in Block 8.

2. Methodology

2.1. Three-Phase Relative Permeability Curve Test

The relative permeability curve is one of the most important basic data in reservoir development. It is used for many reasons, such as reservoir numerical simulation, dynamic analysis, and prediction. Relative permeability data are indispensable for almost all reservoir fluid calculations. They can be used to estimate productivity, injection capacity, and final recovery factor, and they can be used to evaluate and plan production measures and diagnose formation damage under various operating conditions [24].
In recent years, many scholars at home and abroad have conducted research on the seepage law of low-permeability rock based on experiments. The experimental methods are summarized, including the steady-state method, unsteady-state method, capillary equilibrium method, and plate model method. The steady-state method entails injecting the fluid into the rock core by using the pressure source until it is balanced; that is, the pressure difference at both ends is constant, the flow rate is equal, and the flow data are recorded to study the seepage law of low-permeability rocks.
This article establishes an experimental testing method that uses CT scanning technology to determine the stable state of three-phase fluids and online tests the saturation of the three-phase fluids. Specifically, by placing the sample in a CT scanner for scanning, information such as the density and absorption coefficient of the three-phase fluid in the sample can be obtained, thereby analyzing the distribution and saturation of the three-phase fluid. The three-phase fluid saturation history is determined according to the actual situation of the reservoir, and the three-phase isotonic lines of the conglomerate core under different histories are obtained. This mainly includes: (1) research on the simulation method of three-phase saturation history; (2) research on the test method of steady-state three-phase relative permeability of extra low-permeability conglomerate. Figure 2 is a schematic diagram of the experimental setup.
Among them, the CT scanning system uses GE’s LIGHT SPEED 8-slice spiral CT. This experiment uses two scanning voltages of 100 kV and 140 kV, with a scanning current of 150 mA and a spiral scanning method, with a minimum scanning layer thickness of 1.25 mm. CT scanning rock image analysis software (CTIAS1.0) is used for CT data processing.
The experiment was conducted at room temperature and measured using steady-state methods. The experimental process is as follows: ① After drying the core, place it in a core holder and fully saturate it with 5% NaBr, and then driven it to a bound water state using simulated oil. ② Fix the total flow rate, continuously increase the injection rate of the water, reduce the injection rate of the oil, and simulate the conventional waterdrive process. ③ Simulate the saturation process of DDI (depleted-dissolved-injection), which fixes the total flow rate of the fluid and injects oil, gas, and water simultaneously, continuously increasing the injection amount of gas and reducing the injection amount of water and oil while ensuring that the injection rate ratio of water and oil remains unchanged. At each injection state, when the pressure stabilizes, record the fluid flow rate and pressure difference sensor values of each phase. ④ Simulate the reverse saturation process IID (injection-induced solution), which reduces the injection rate of gas, increases the injection rate of water and oil, and also records the flow rate and pressure difference sensor values of each phase of the fluid after the pressure stabilizes. CT scans were performed on dry core, fully saturated NaBr, bound water, residual oil, and each stable state at two voltages of 100 kV and 140 kV, respectively. Then, the three-phase fluid saturation of the core between the two pressure measurement points was calculated.

2.2. Simulation Calculation Method of Three-Phase Relative Permeability Curve

The mathematical model method is based on the following basic assumptions: water phase strongly wets rocks, gas phase is non-wetting phase, and oil phase is intermediate wetting phase. The three-phase relative permeability of the wetting phase and the non-wetting phase only depends on its own saturation, that is, the three-phase relative permeability can be replaced by the two-phase relative permeability under the same saturation condition.
An experimental test method is established, and the CT online saturation test is used to obtain the unsteady oil–water and oil–gas phase permeability curves. The specific contents mainly include:
(1)
Take the fully dried sample and place it in the experimental device. Calculate the permeability of different saturations through different pressure differences and flow rates. Based on experimental data, the permeability curves of the unstable oil-water phase of the ultra-low permeability conglomerate are obtained by statistical analysis and organization of permeability under different saturations.
(2)
Take the sample from the ultra low-permeability conglomerate and dry it thoroughly before conducting the test. Place the sample in the experimental device and first inject water to fully saturate the sample. Then, continuously inject gas and record saturation and permeability data over time. Analyze and organize the saturation and permeability at different time points based on experimental data, and obtain the non-stationary oil- and gas-phase permeability curve of ultra low-permeability conglomerate.
(3)
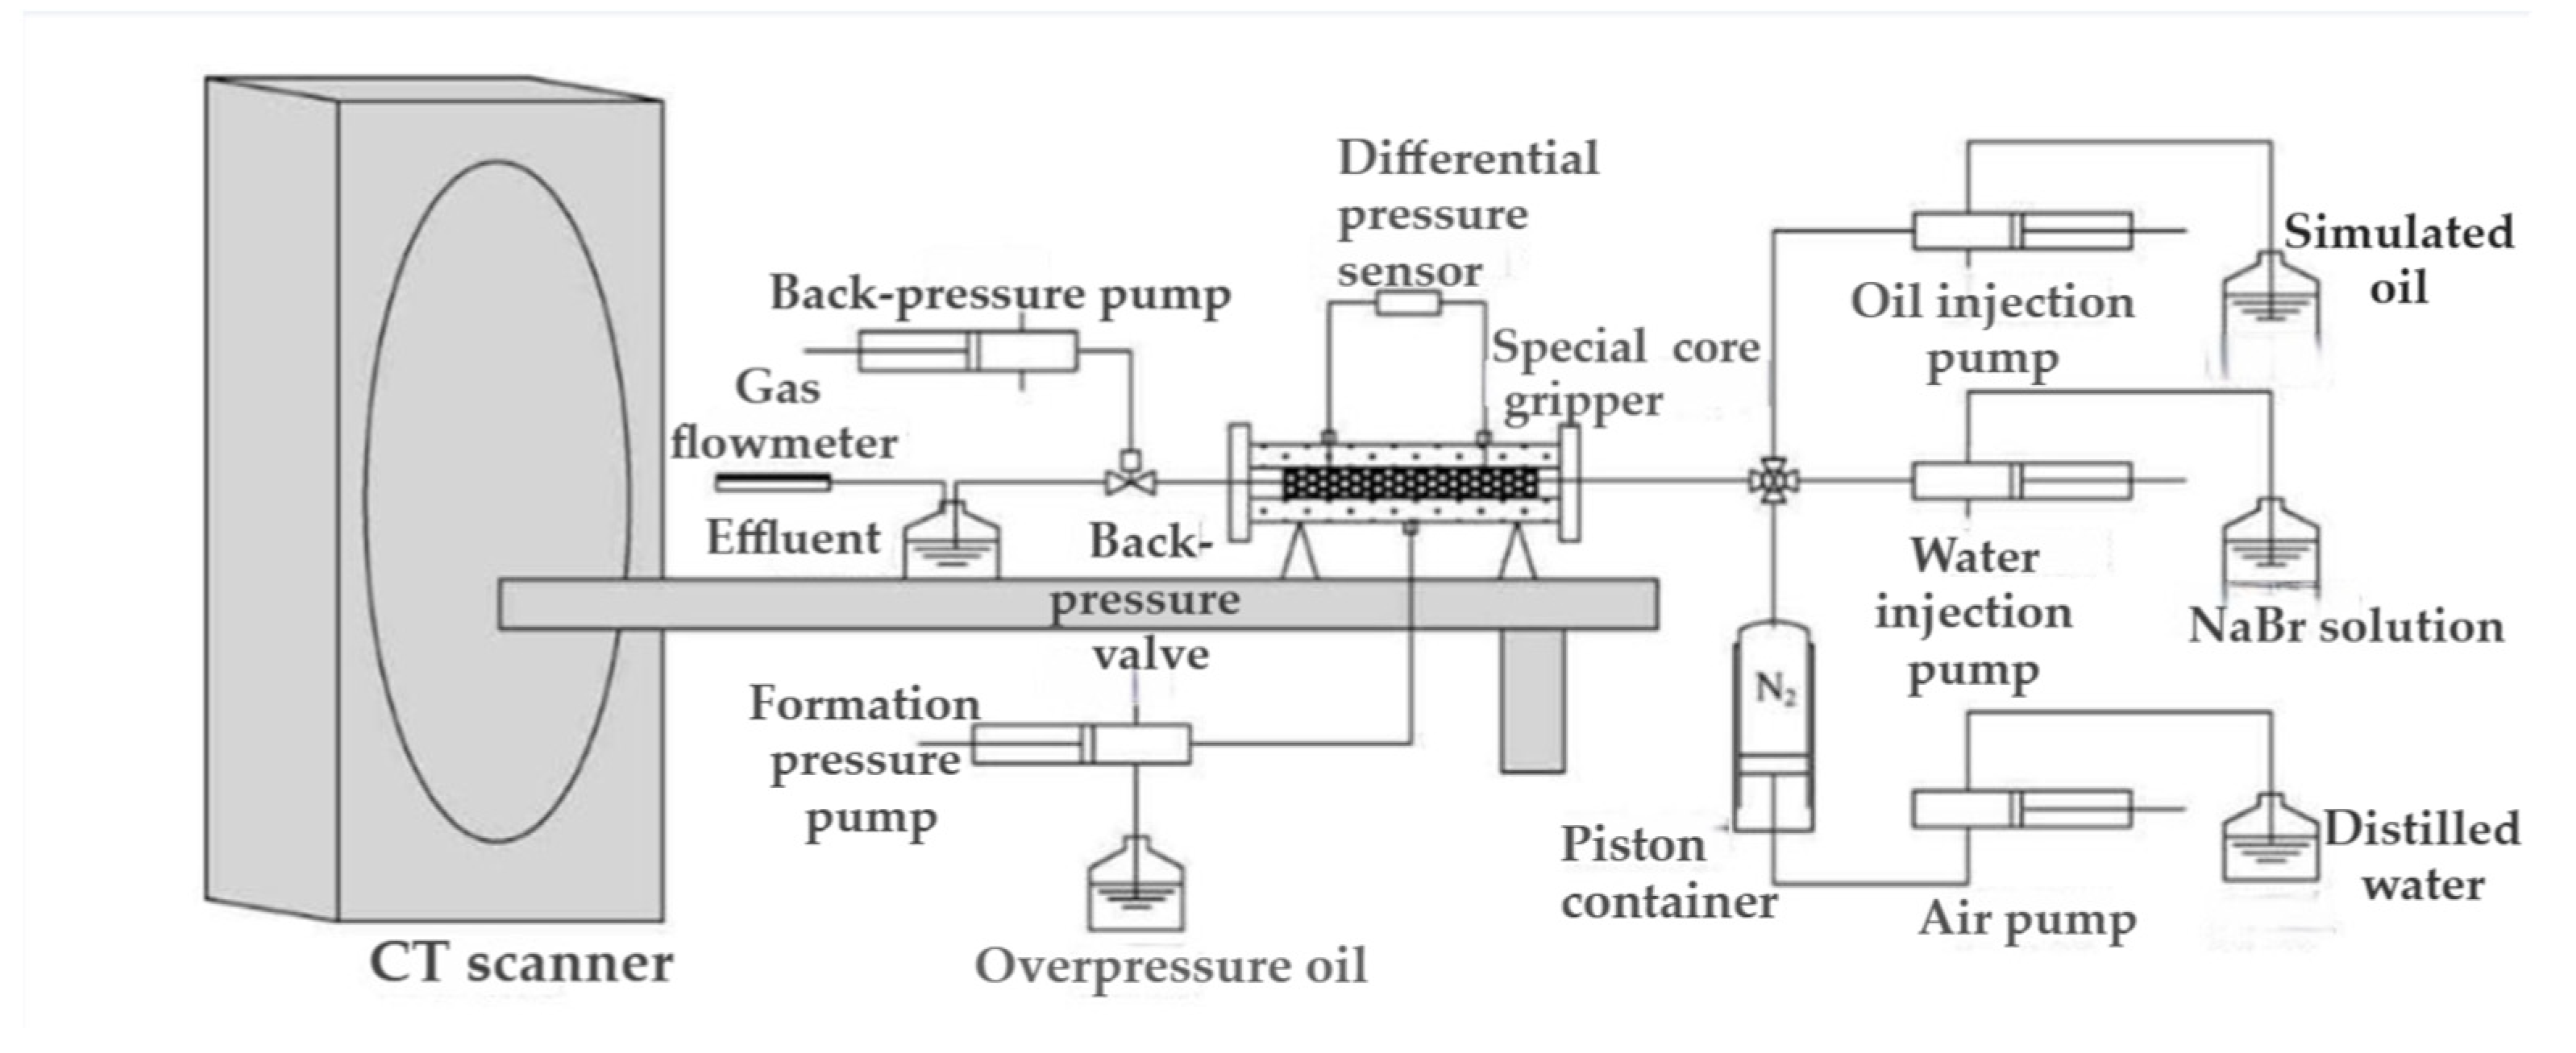
Place the dried sample into the experimental device and continuously inject different fluids (water, oil, gas) and record the corresponding CT images to derive the distribution of fluid saturation during the process. Based on experimental data, the distribution of fluid saturation along the process is modeled and analyzed using Eclipse and compared and validated with experimental results.
(4)
Based on the previous experimental results, establish a three-phase permeability model for ultra low-permeability conglomerate, including permeability calculations at both macro and micro scales. Simulate and calculate the three-phase permeability of ultra low-permeability conglomerate using computer software, and obtain the three-phase permeability curve of ultra low-permeability conglomerate.
(5)
Select representative samples and place them in the experimental device. Inject CO2 gas and control the injection flow rate and time under different pressure and temperature conditions, and measure recovery rate and remaining oil quantity. Calculate and analyze the recovery efficiency of CO2 flooding based on experimental data, providing a reference basis for the application and implementation of CO2 flooding.

2.3. Establishment and Characterization of Conglomerate Reservoir Pore Network Model

A multi-scale characterization method for the pore-throat structure of conglomerate cores was established, and the pore-throat data of rock samples were obtained by means of mercury intrusion and micro-CT. The nitrogen adsorption method and gasoline quality evaluation method preemptively test parameters such as porosity and permeability, and then the intrusion porosimeter is sent to the laboratory for testing according to ASTM D4404-84 standards [25]. The three-dimensional structure of conglomerate core samples was characterized using the MicroXCT-400 micro-CT scanner produced by Xtek Company in Finland.
It mainly includes: (1) research on 3D imaging of conglomerate and extraction method of pore structure; (2) research on quantitative characterization method of pore throat structure of different scales of the conglomerate core; (3) research on multi-level network integration technology of conglomerate core; (4) the establishment of the pore network model of the real conglomerate core.

2.4. Three-Phase Seepage Simulation Parameter Optimization Based on Pore Network Model

An adaptive model was established, and a unitized three-phase seepage simulation was carried out based on the pore network model. An algorithm was established to calculate the three-phase relative permeability, oil displacement efficiency, and other parameters, and the experimental data were used for correction. The methods are as follows:
(1)
Geological data are obtained through seismic exploration and well location data, and modeling and visualization are carried out using Eclipse software.
(2)
An adaptive mesh partitioning method is adopted to ensure the high accuracy and reliability of the model.
(3)
The boundary conditions of the pore network model are set, including information such as the inlet pressure and outlet pressure of each layer.
(4)
A three-phase seepage simulation program is run, and Eclipse simulation calculations are performed. During the calculation process, adjustments and optimizations can be made as needed.
(5)
The calculation results are to be analyzed, and problems that arise in the simulation are optimized and improved. Result analysis helps to understand the movement patterns of three-phase fluids in the reservoir and provides support for subsequent decision-making.

3. Results and Discussion

3.1. Reservoir Physical Properties

The reservoir physical property is the physical property of an oil and gas reservoir. Broadly speaking, it also includes the framework property, porosity, permeability, fluid-bearing property, thermal property, conductivity, acoustic property, radioactivity, and various sensitivities of reservoir rocks. In a narrow sense, it generally refers to the porosity and permeability of reservoir rocks. The effective reservoir refers to the reservoir with permeability and movable fluid (hydrocarbon or formation water), which can produce a liquid with industrial value (hydrocarbon or a mixture of hydrocarbon and water) under the existing technology conditions. The effective reservoir is different from the effective oil layer. The fluid produced in the effective reservoir can be either hydrocarbon or water, so the effective reservoir contains the effective oil layer. The Lower Wuerhe Formation in Block 8 has a certain understanding of the reservoir in the previous development process, and the reservoir understanding is the basis of all other work. However, due to the particularity of the conglomerate and the problems exposed during the development process, it is necessary for us to further study the physical properties and seepage capacity of the reservoir in order to understand the production decline and the three-phase degassing and other issues, and to fully understand the reservoir characteristics and development potential. Well T85722 is the main well for the current mining target and has important engineering significance. The core and geological data are relatively complete and easy to obtain and utilize. This will provide convenience for developing scientific and reasonable experimental plans and analyses. Therefore, for the main oil layer in the oilfield, we selected Well T85722 as the main research object; obtained standard experimental cores by drilling, cutting, and grinding; then washed and dried the experimental cores and tested and calculated the porosity and permeability of the cores at the same time. The analysis results show that the reservoir cores are all low porosity and low permeability, and the permeability of the core samples presents an inverse rhythm pattern distribution with the horizon depth. The average porosity of the plunger sample is 12.6%, and the average permeability is 0.551 mD (Figure 3).
The axial and slice homogeneity of 90 samples were evaluated by CT scanning technology. Figure 4 shows the distribution of CT numbers along the axis of a typical sample. These experimental results show that the axial and slice homogeneity of most samples is relatively good, and the CT value changes are small. However, with the decrease in the sample permeability, the core layer and axial homogeneity become worse. Figure 5 shows the CT value distribution of two typical conglomerates on the axial section. It can be seen that the CT value distribution of the two conglomerates is wider than that of the general sandstone, which means that the conglomerate is less homogeneous than the sandstone, and its pore size is poor [26].

3.2. Reservoir Pore Structure Characteristics

3.2.1. Reservoir Pore Type and Size

The pore structure of the reservoir is complex and includes intergranular pores, interface pores, intragranular pores, and other pore types, and primary pores and secondary pores coexist, mainly secondary solution pores. The reservoir is a huge thick conglomerate reservoir with low porosity (porosity 12%), extra-low permeability (permeability 1.2 mD), buried depth (average depth of 2623 m), and microfractures. The pore structure of the core of Well 85,722 was further studied and determined by casting thin section analysis. A total of six cast thin slices were analyzed, and the measurement results showed that after the rock formed pores around the grains through dissolution, it experienced an acidic environment and formed a large number of authigenic quartz ring growths. After that, it experienced an alkaline environment, and calcite grew again. Most of the pores are secondary intergranular dissolved pores and secondary intragranular dissolved pores. The summary analysis is shown in Table 1.

3.2.2. Reservoir Pore Throat Structure Parameters

Due to the small pore throat, low permeability and low pore fluid seepage velocity, the seepage law of low permeability reservoirs is significantly different from that of conventional high-permeability reservoirs. When the oil-water interface is not in equilibrium, the capillary pressure dynamic effect is more significant, which has a greater impact on the oil-water seepage law and waterdrive oil development characteristics. Therefore, it is necessary to analyze the dynamic effect of the capillary pressure in low-permeability reservoirs. The constant-velocity mercury intrusion instrument was used to test and analyze six rocks. The results show that the main distribution of pores is 75-200 microns, and the throat distribution that mainly contributes to seepage is 1-2 microns. Figure 6 and Figure 7 show the summary of the curves. It can be seen from Figure 6 that the pore distribution range of cores with different permeabilities is basically the same. However, from Figure 7, it can be seen that the distribution of the throats of cores with different permeabilities is very different, and the radius of the throats of cores with larger porosities is larger, which proves that the permeability of the core is mainly determined by the throat radius of the core. The pore throat (radius) ratio is an important parameter in the analysis of rock pore throat characteristics. When the ratio of pore radius to throat radius is small, the pore is controlled by the larger throat, which is conducive to the oil and gas recovery in the pore. On the contrary, it is not conducive to oil and gas recovery in the pore. With the increase in permeability, the pore throat (radius) ratio tends to decrease. Porosity, permeability and average pore throat radius are positively correlated, and the correlation is good. In addition, the larger the average pore throat radius and the maximum pore throat radius, the more obvious the permeability growth. In the low-permeability conglomerate reservoir, the pore throat radius is the key factor for controlling the seepage ability of the reservoir. The appearance of the pore throat with a larger radius plays an obvious role in improving the seepage ability of the reservoir.

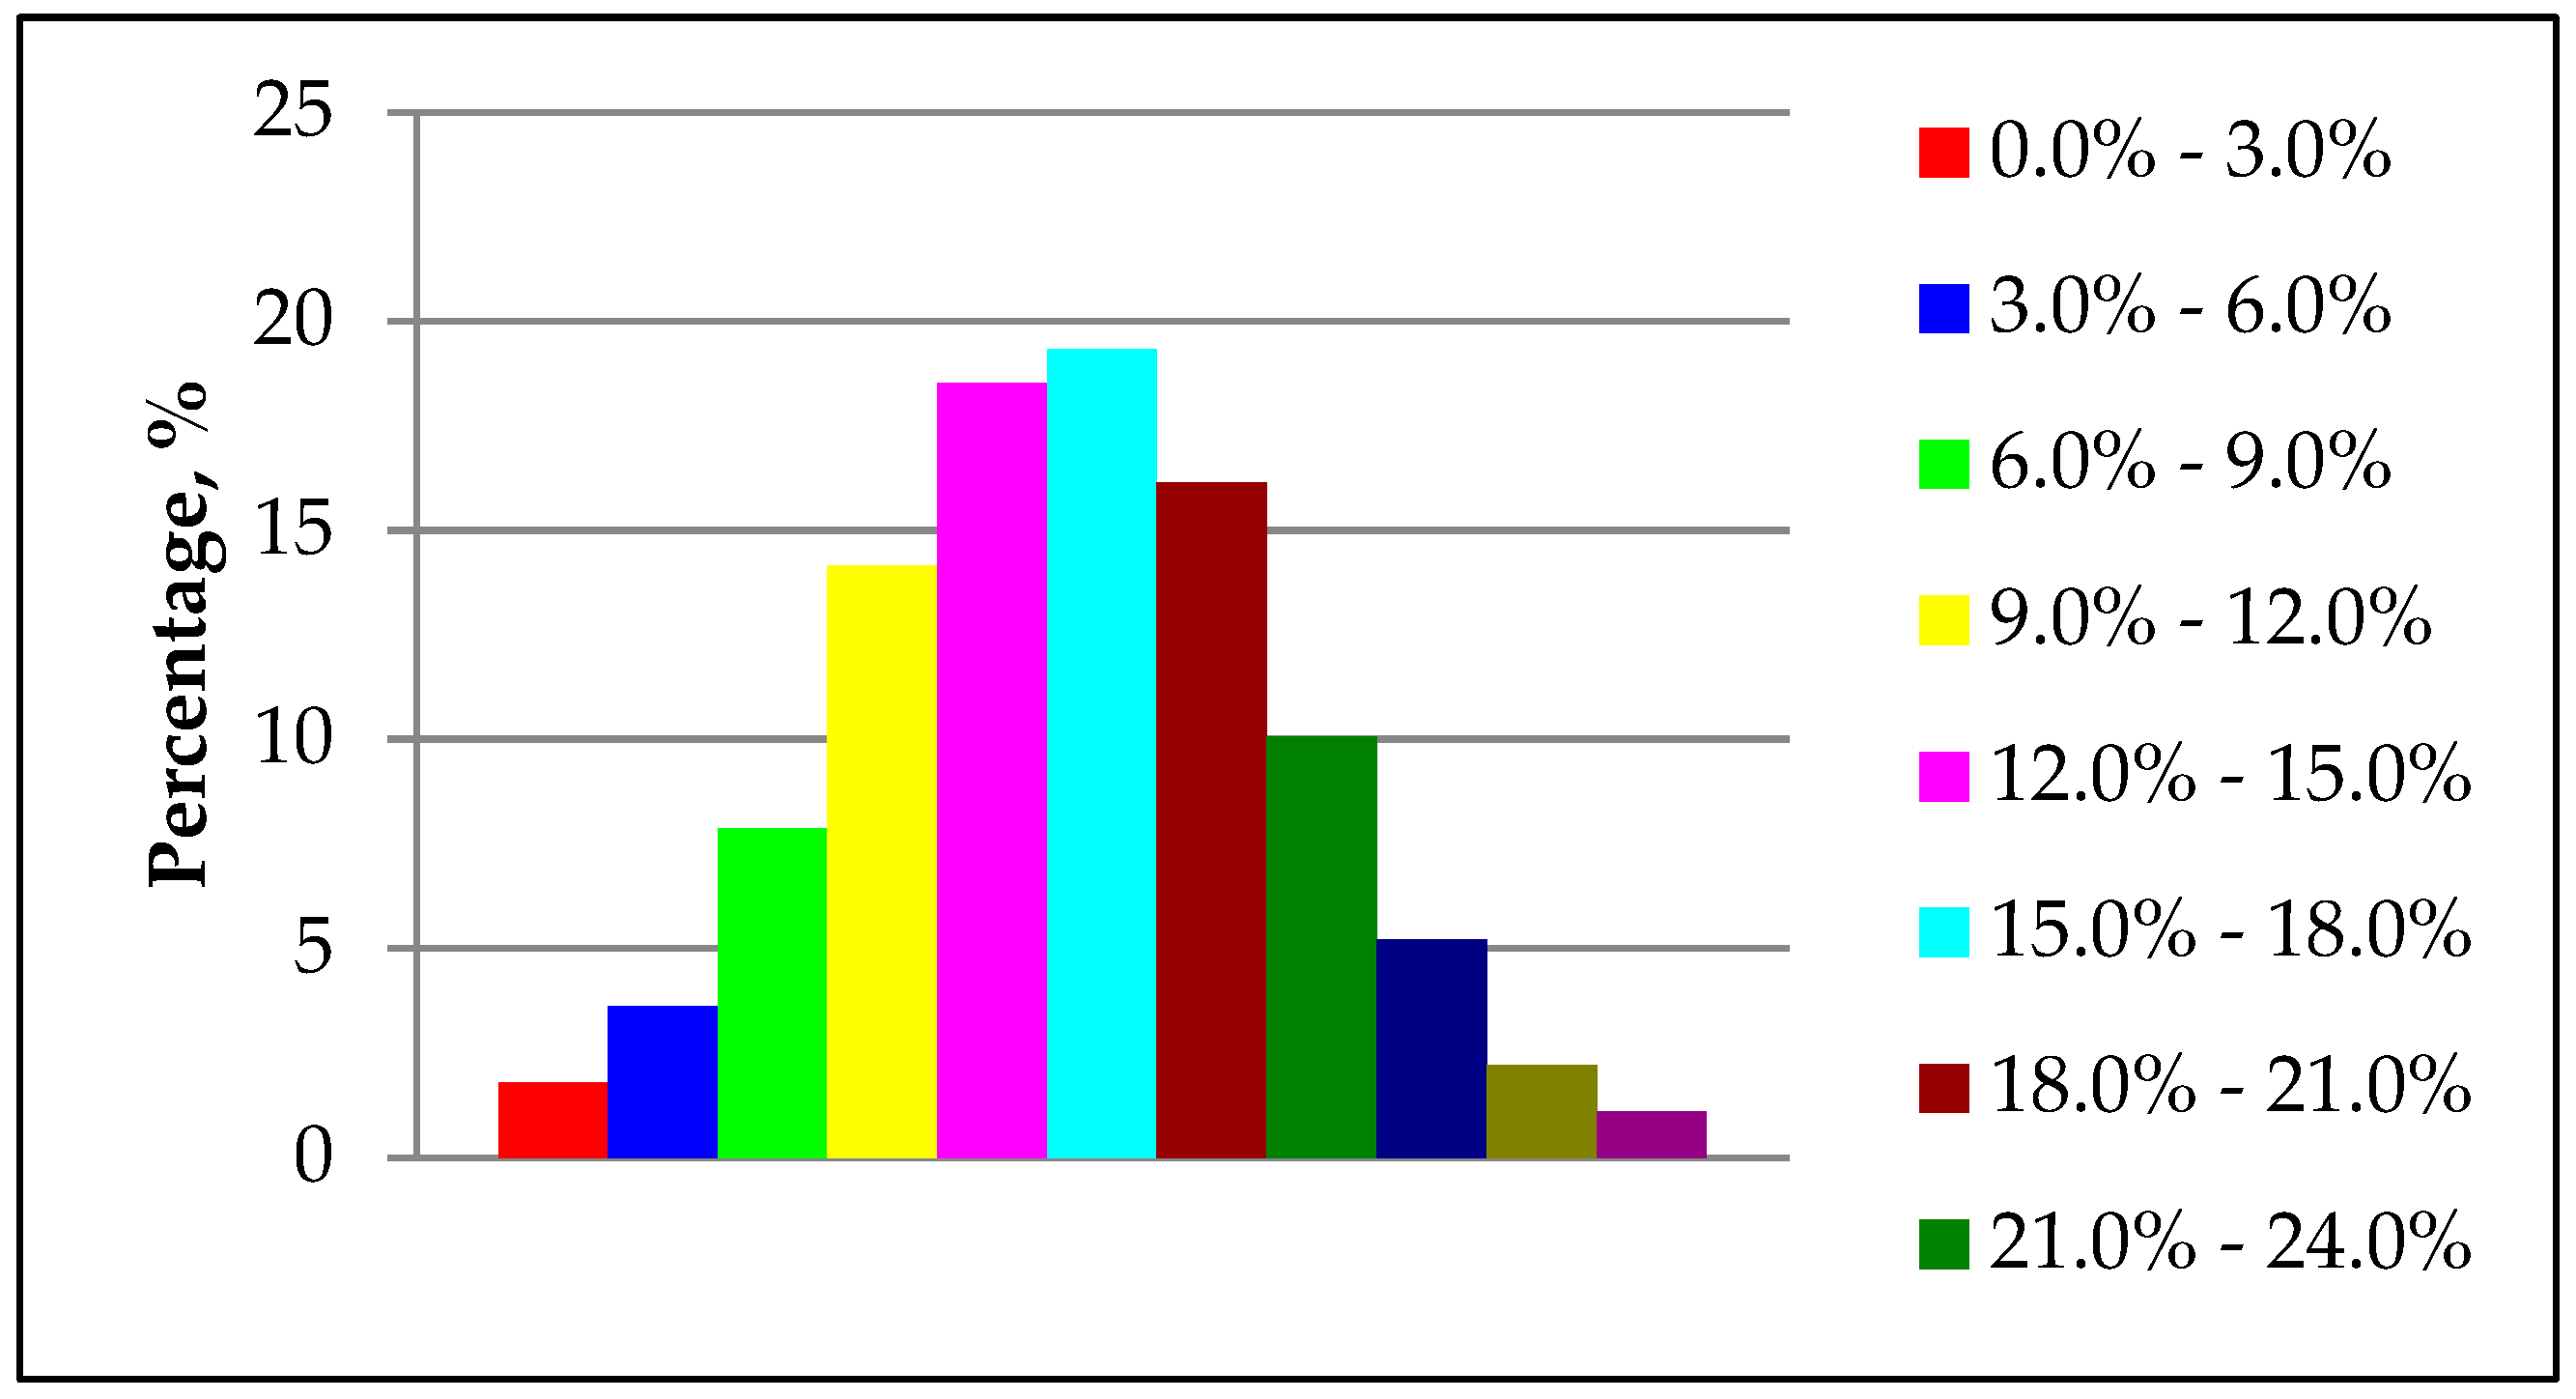
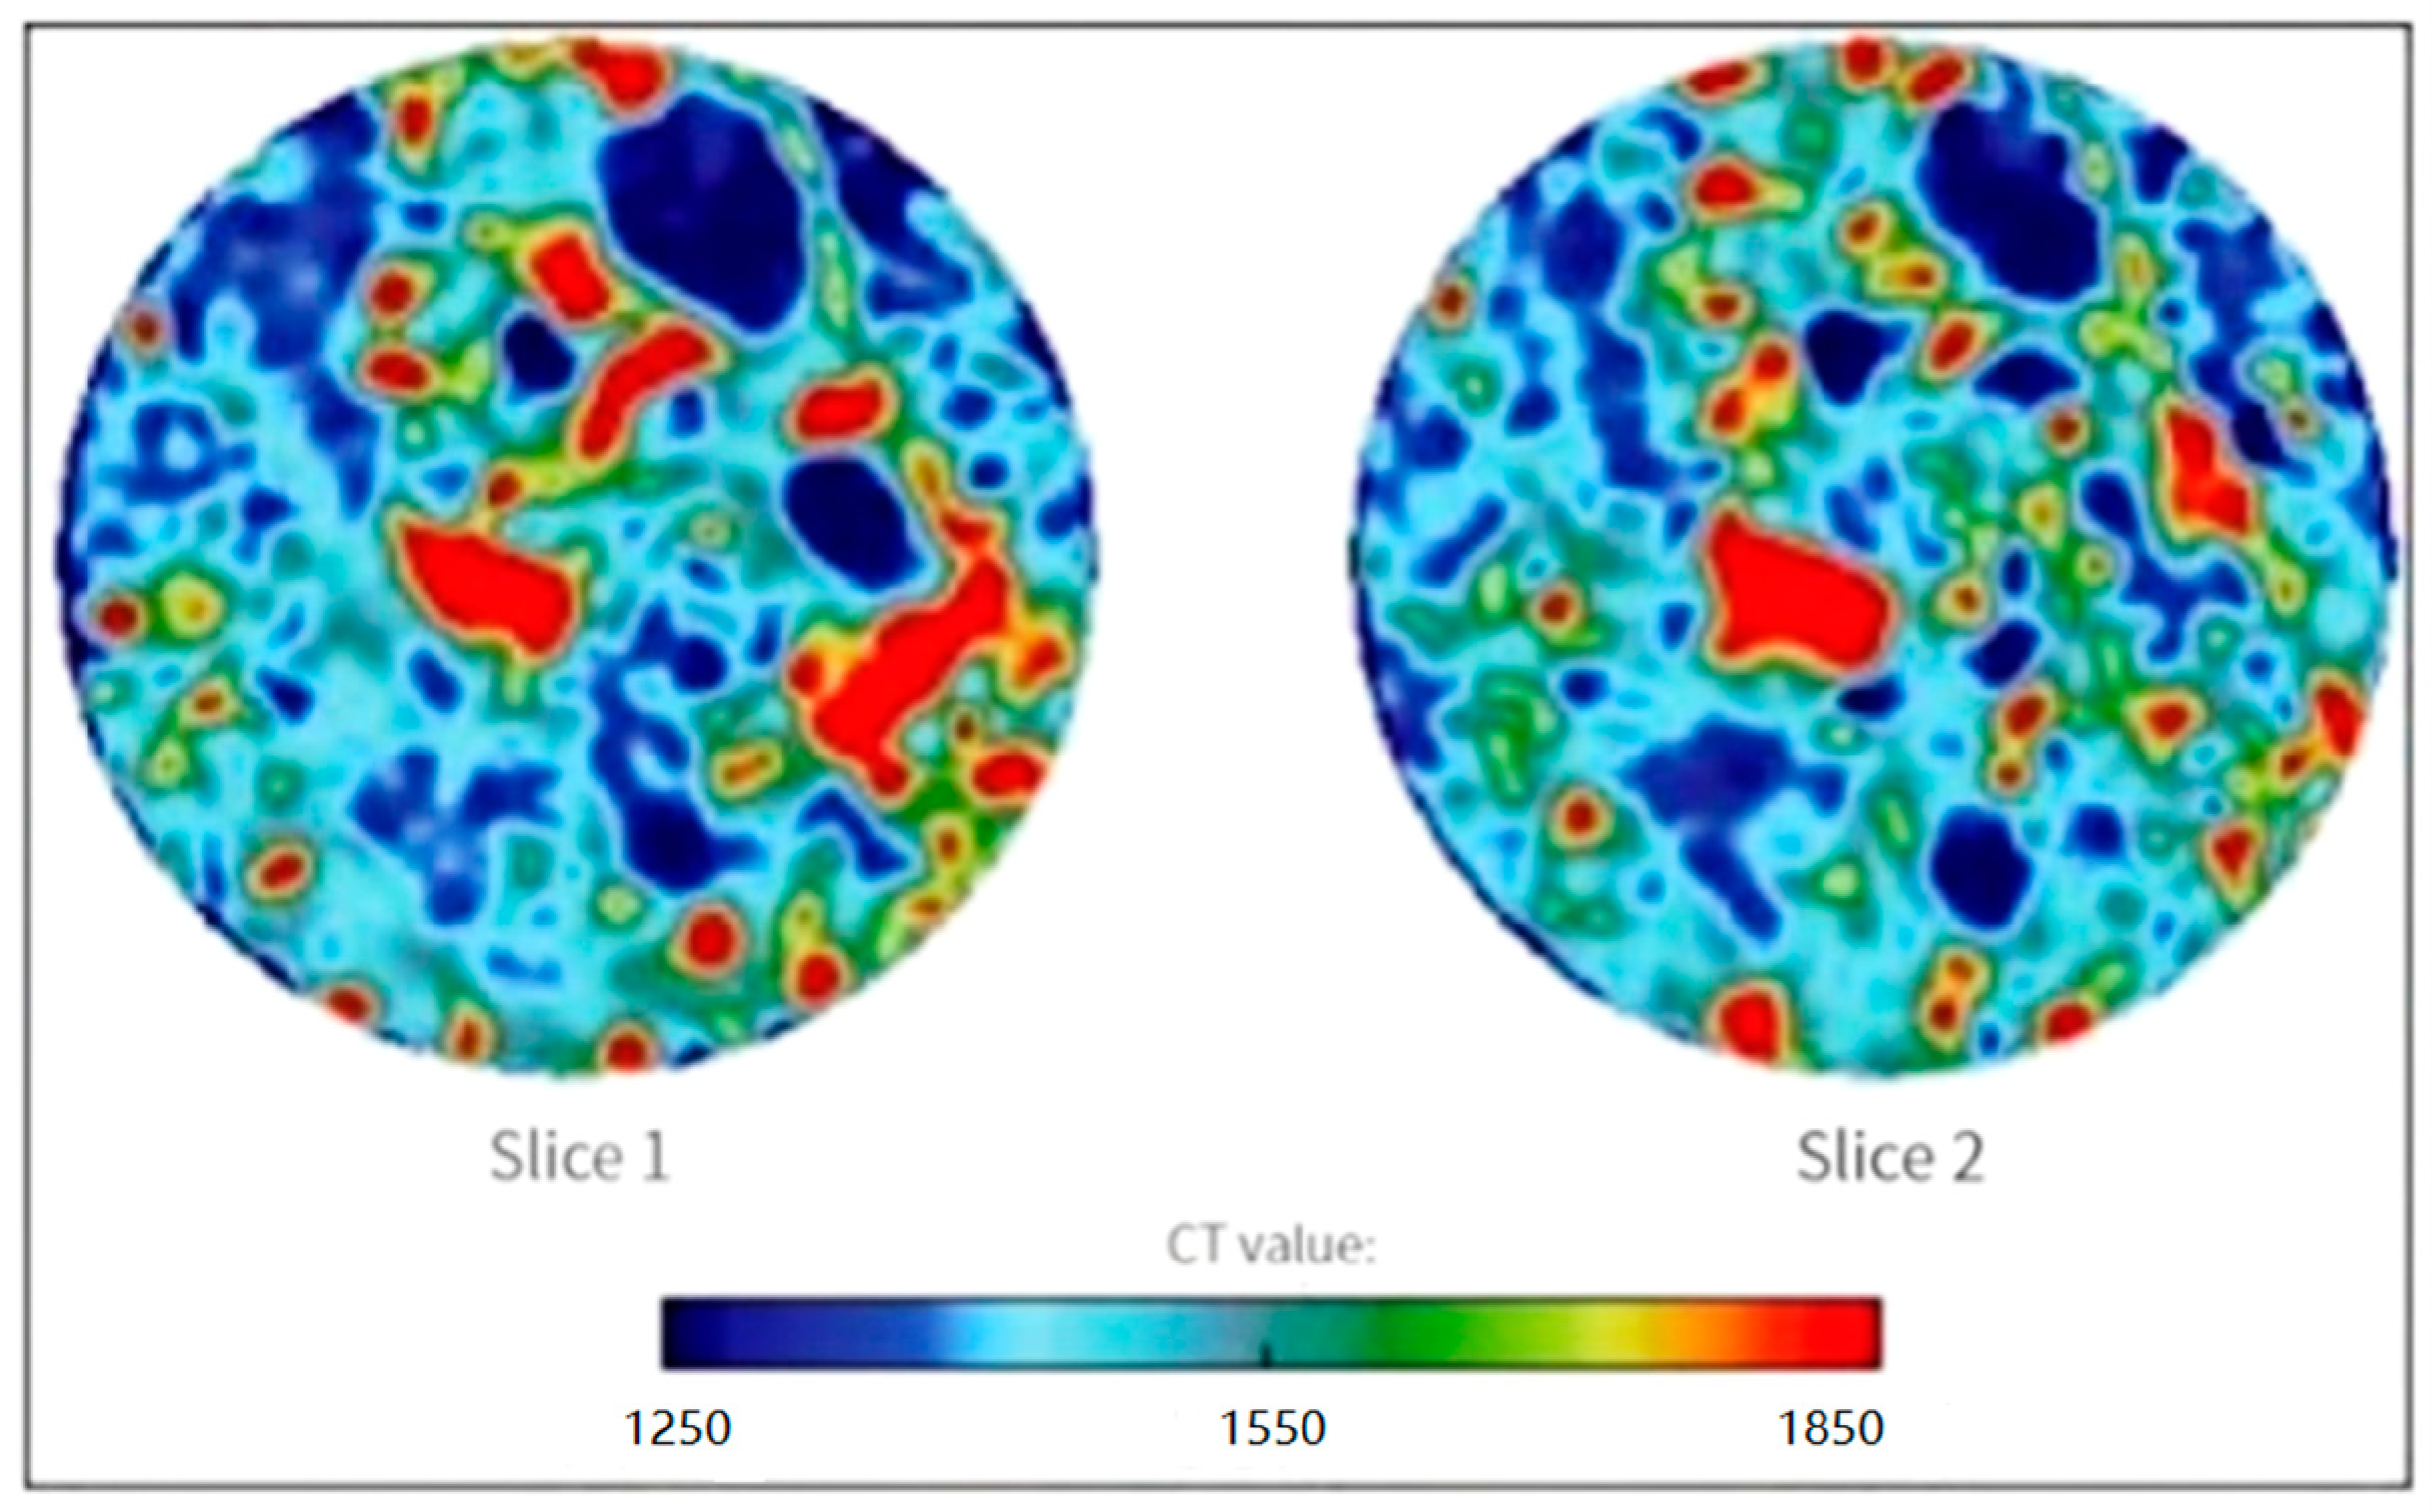
3.2.3. CT Scan Porosity Analysis

Macroscopic CT scan analysis was performed on a 1.5-inch parallel sample using CT scanning technology to obtain information on the porosity distribution inside the conglomerate core. As shown in Figure 8, it can be seen that the areas with a porosity of 9% to 21% account for the majority, and they are the main seepage passage areas. Therefore, compared with the pores with a porosity below 9%, larger pores play a dominant role in seepage. The reconstruction map of the CT value distribution of the core slice shows strong heterogeneity, as shown in Figure 9.

3.3. Three-Phase Seepage Characteristics of Extra Low–Permeability Conglomerate Reservoirs and the Influence of Different Factors

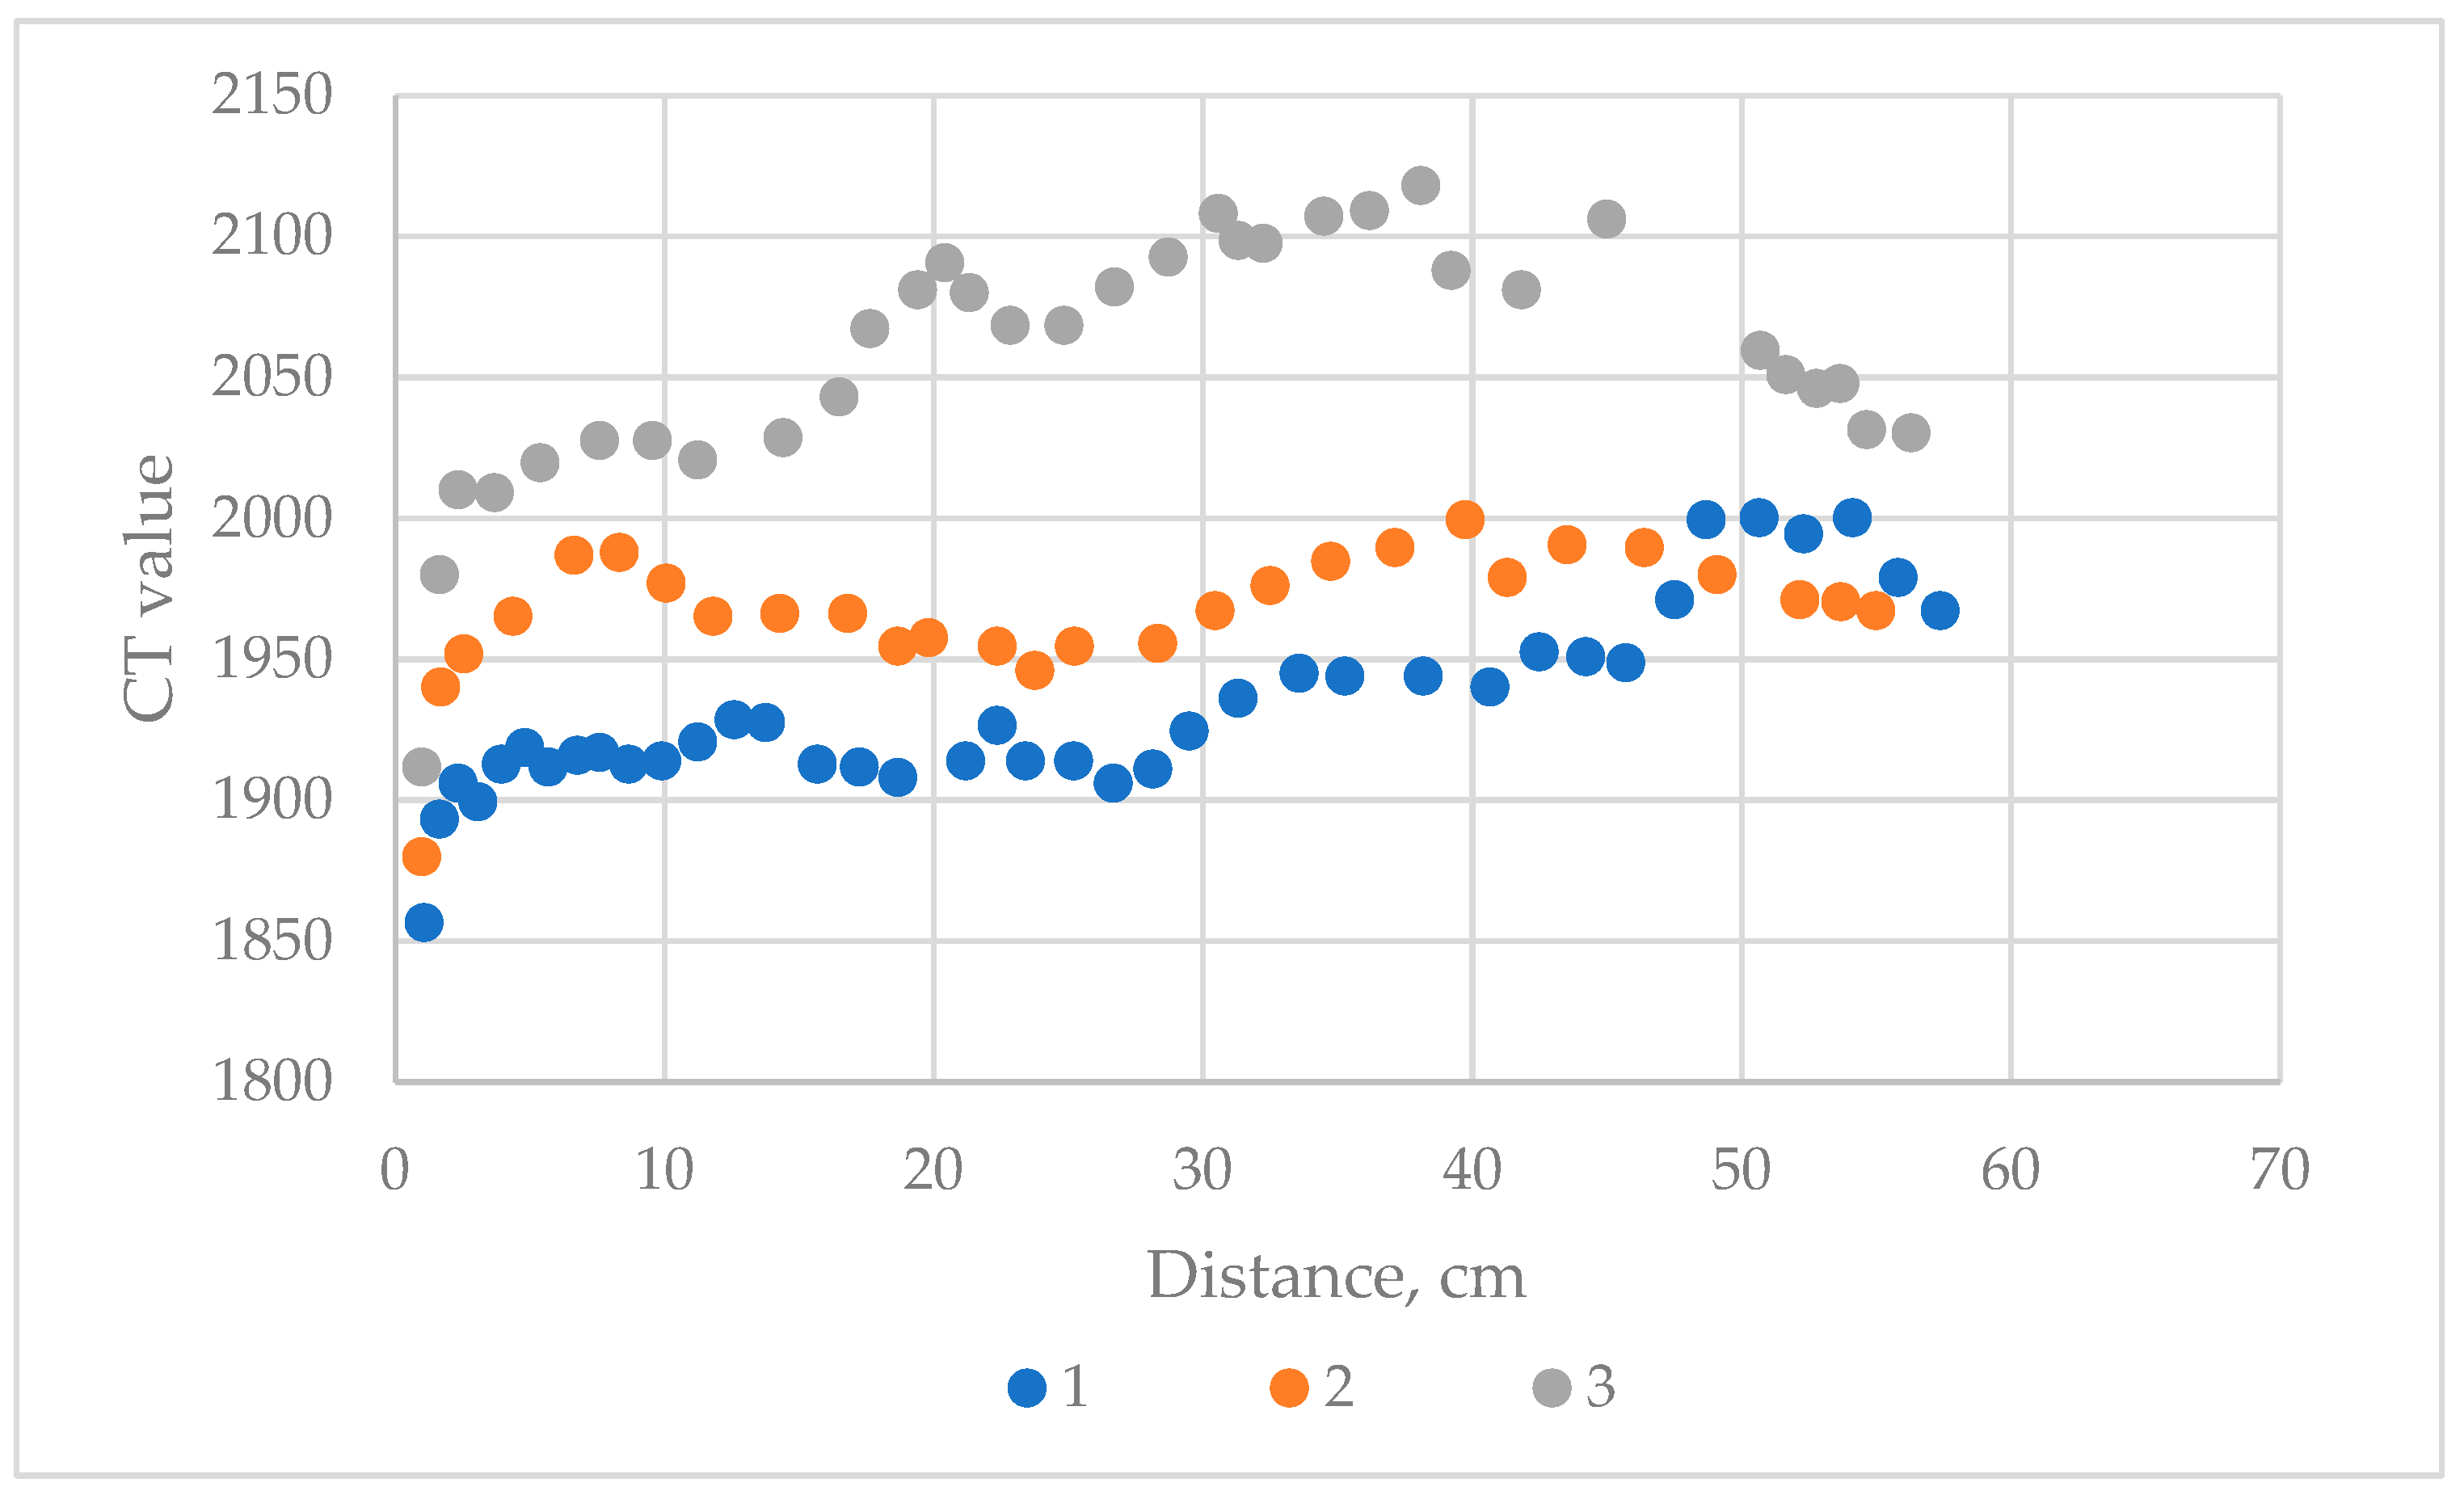
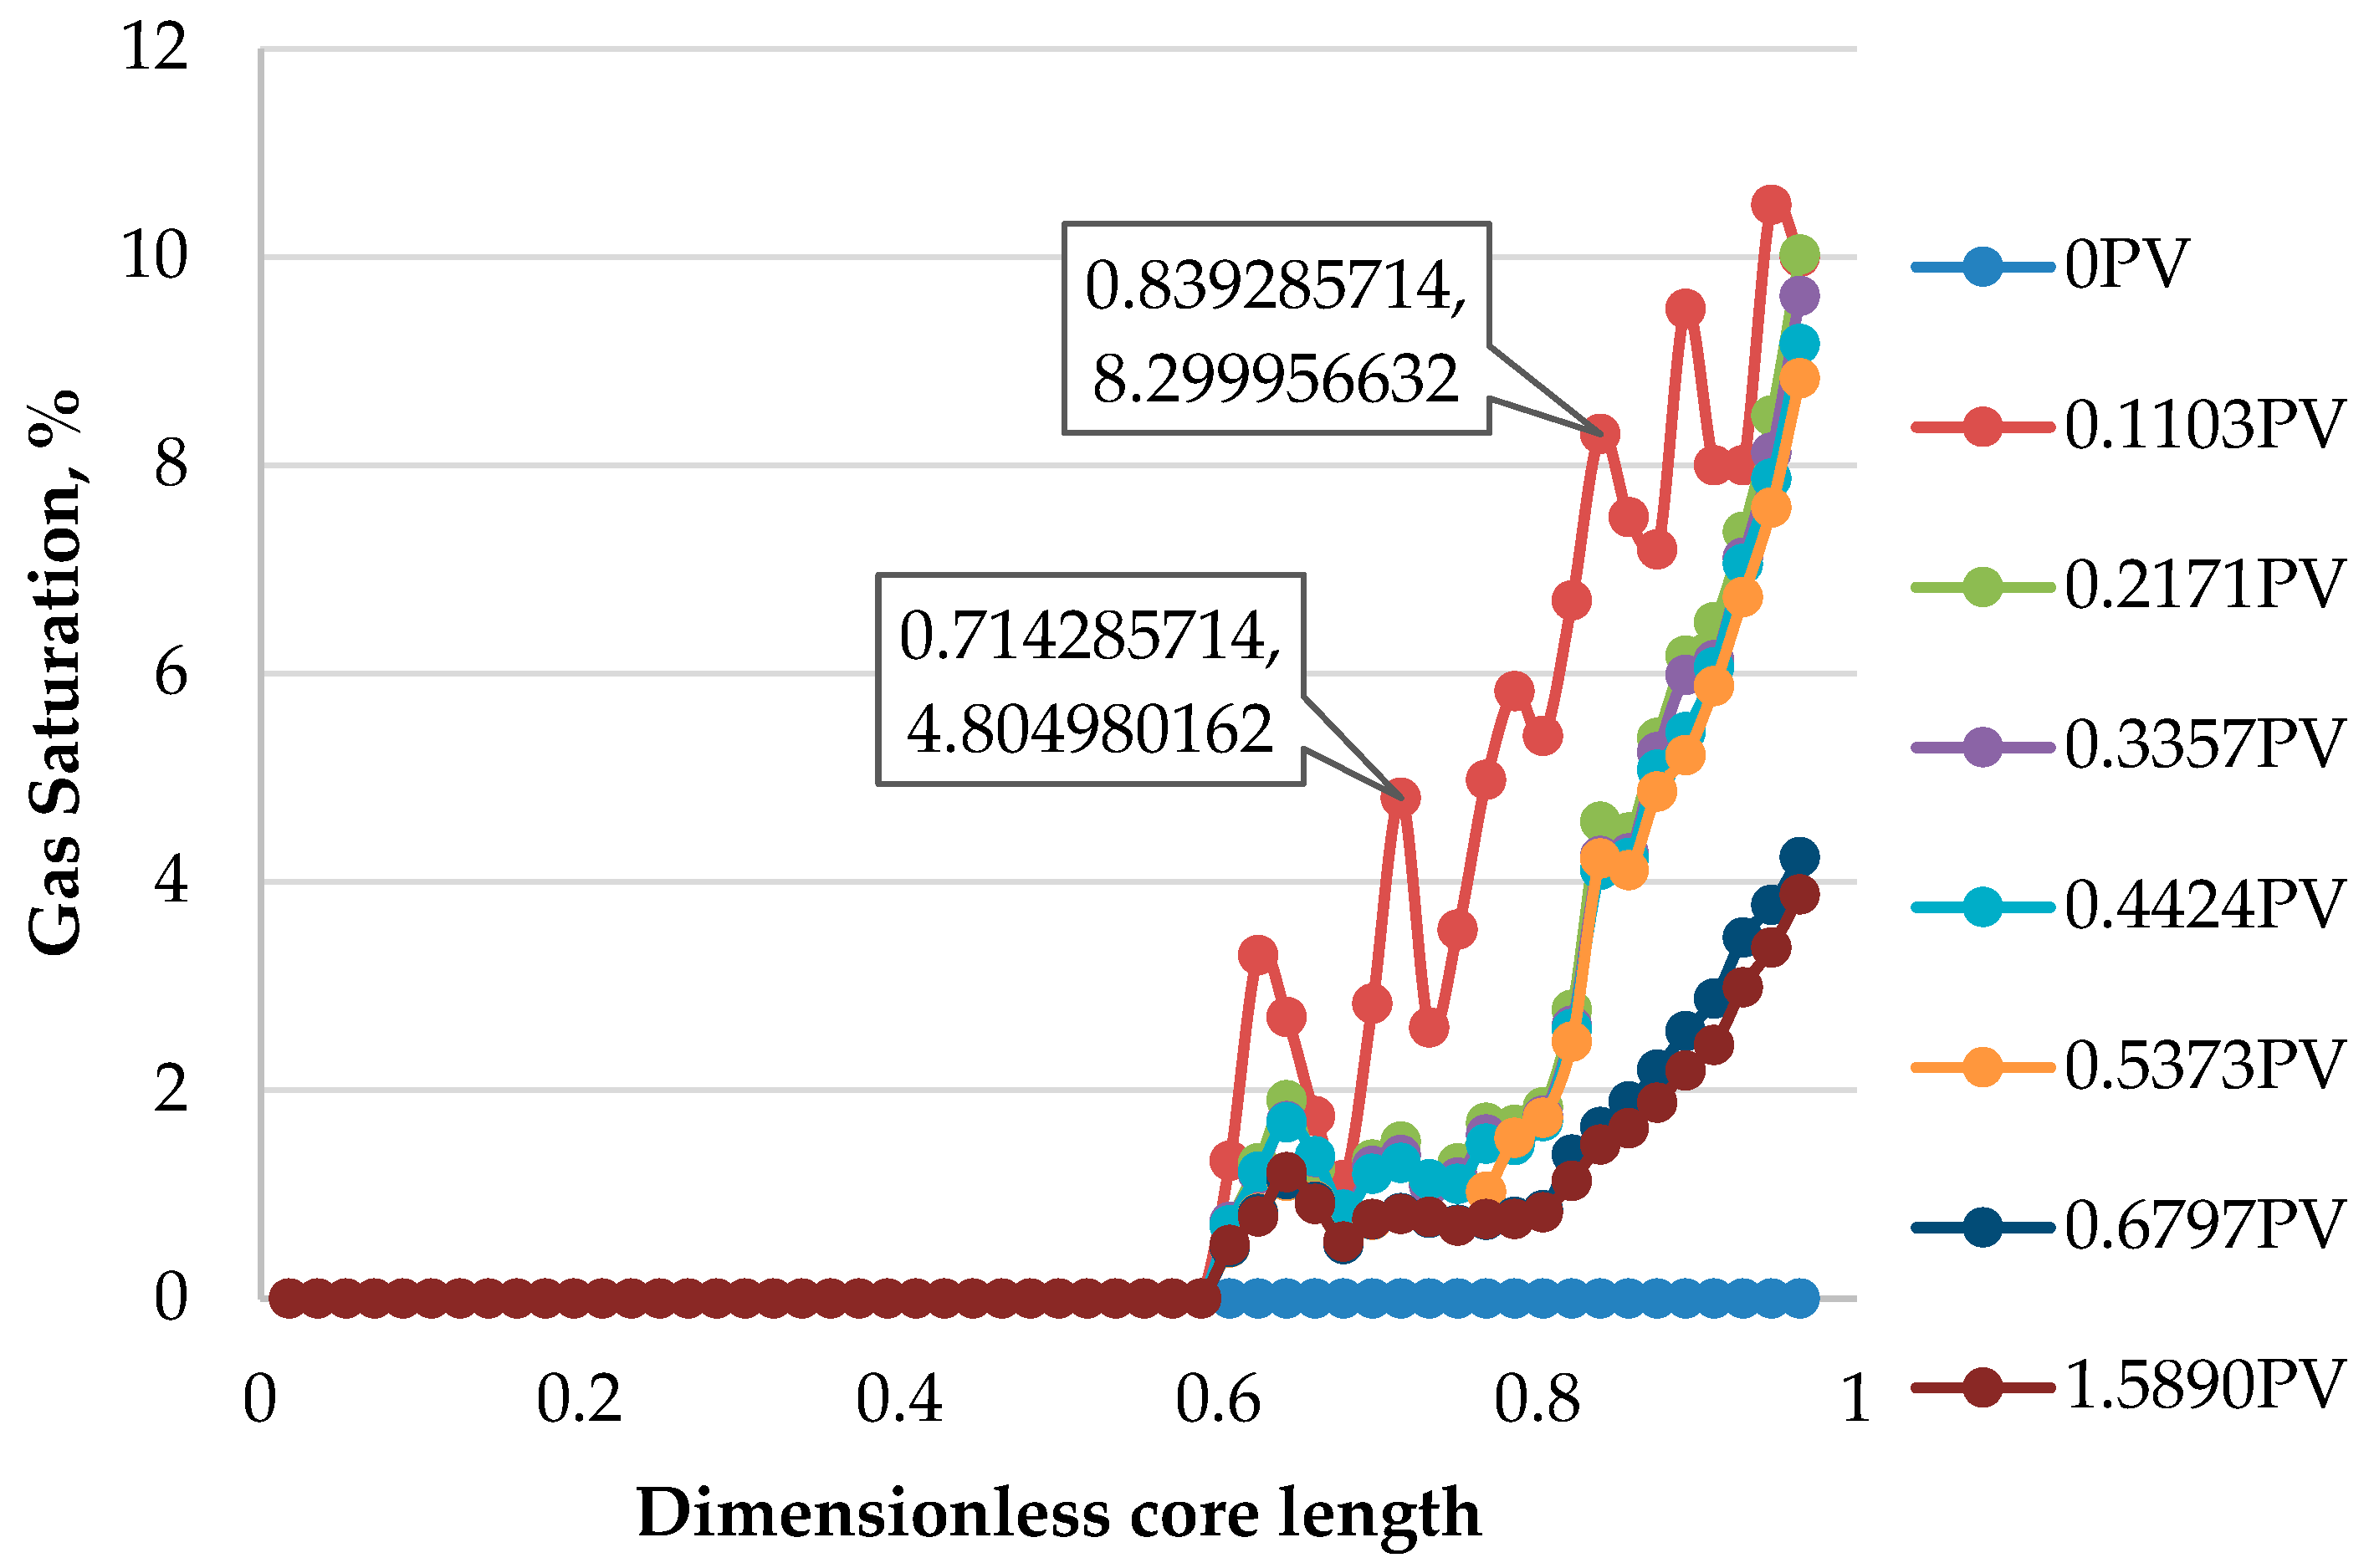
3.3.1. Change Characteristics of Saturation Distribution along the Way

Through the core displacement system of CT scanning, the real-time dynamic detection of the multiphase saturation field in the core can be realized so that the change in fluid saturation in the core can be observed during the process. When creating irreducible water, although the pressure is very low, due to the strong heterogeneity of the core, it can be seen from the distribution of water phase saturation along the path that the coning phenomenon is obvious, resulting in high irreducible water saturation, and the initial water saturation exhibited a low inlet side and a high outlet side (Figure 10). During gas production in gas wells, due to the pressure drop around the wellbore and the material balance relationship in the gas reservoir, the gas water interface will be deformed and tapered up in the bottom water gas reservoir. The upward ridge of the bottom water is mainly caused by the pressure drop generated during gas well production. However, because the density of water is greater than that of gas, the hydrostatic pressure increases when the coning is rising, and the water cone tends to be stable within a certain production range. When the gas well production exceeds the critical production, the water cone becomes unstable and the bottom hole flowing pressure decreases gradually, which inevitably causes the water to break through the well and reach another balance.
The outlet back pressure is set to 8 MPa. It can be seen from Figure 11 that when the outlet pressure is low, the distance from the degassing point to the injection port is significantly advanced, and both are affected by the pressure distribution. The gas saturation at the end gradually increased. When the water-flooding front does not reach the gas-bearing area, the oil at the front end drives the gas at the rear end, and the gas saturation decreases. The water-phase front completely sweeps the gas-bearing area under the joint promotion of oil and water. The gas is pushed to the outlet end for production, and the entire gas-bearing area maintains a very low-bound gas state. The high gas saturation near the outlet may be due to the initial production of more gas, or the gas at the front of the core may be transported to the outlet under pressure and accumulated.

3.3.2. Variation Characteristics of Three-Phase Saturation History

Figure 12 shows a schematic diagram of the saturation history inside the core at different stages. Combined with the distribution information, including pressure and saturation along the route at different times, it can be judged that there are two saturation history regions along the core during the initial pressure reduction. There are three saturation history regions along the core at the initial stage of the water flooding process, namely the water flooding oil at the inlet end, the oil single-phase flow at the middle section, and the oil flooding gas at the outlet end. After the flooding front enters the dissolved gas precipitation zone, there are three saturation history zones. At this time, there is three-phase seepage near the core outlet, namely, the water-flooding oil at the inlet end, the three-phase seepage at the middle section, and the oil-displacing gas at the outlet end. After the edge reaches the outlet end, there are two kinds of saturation history regions, which are water flooding at the inlet end and three-phase seepage at the outlet end.

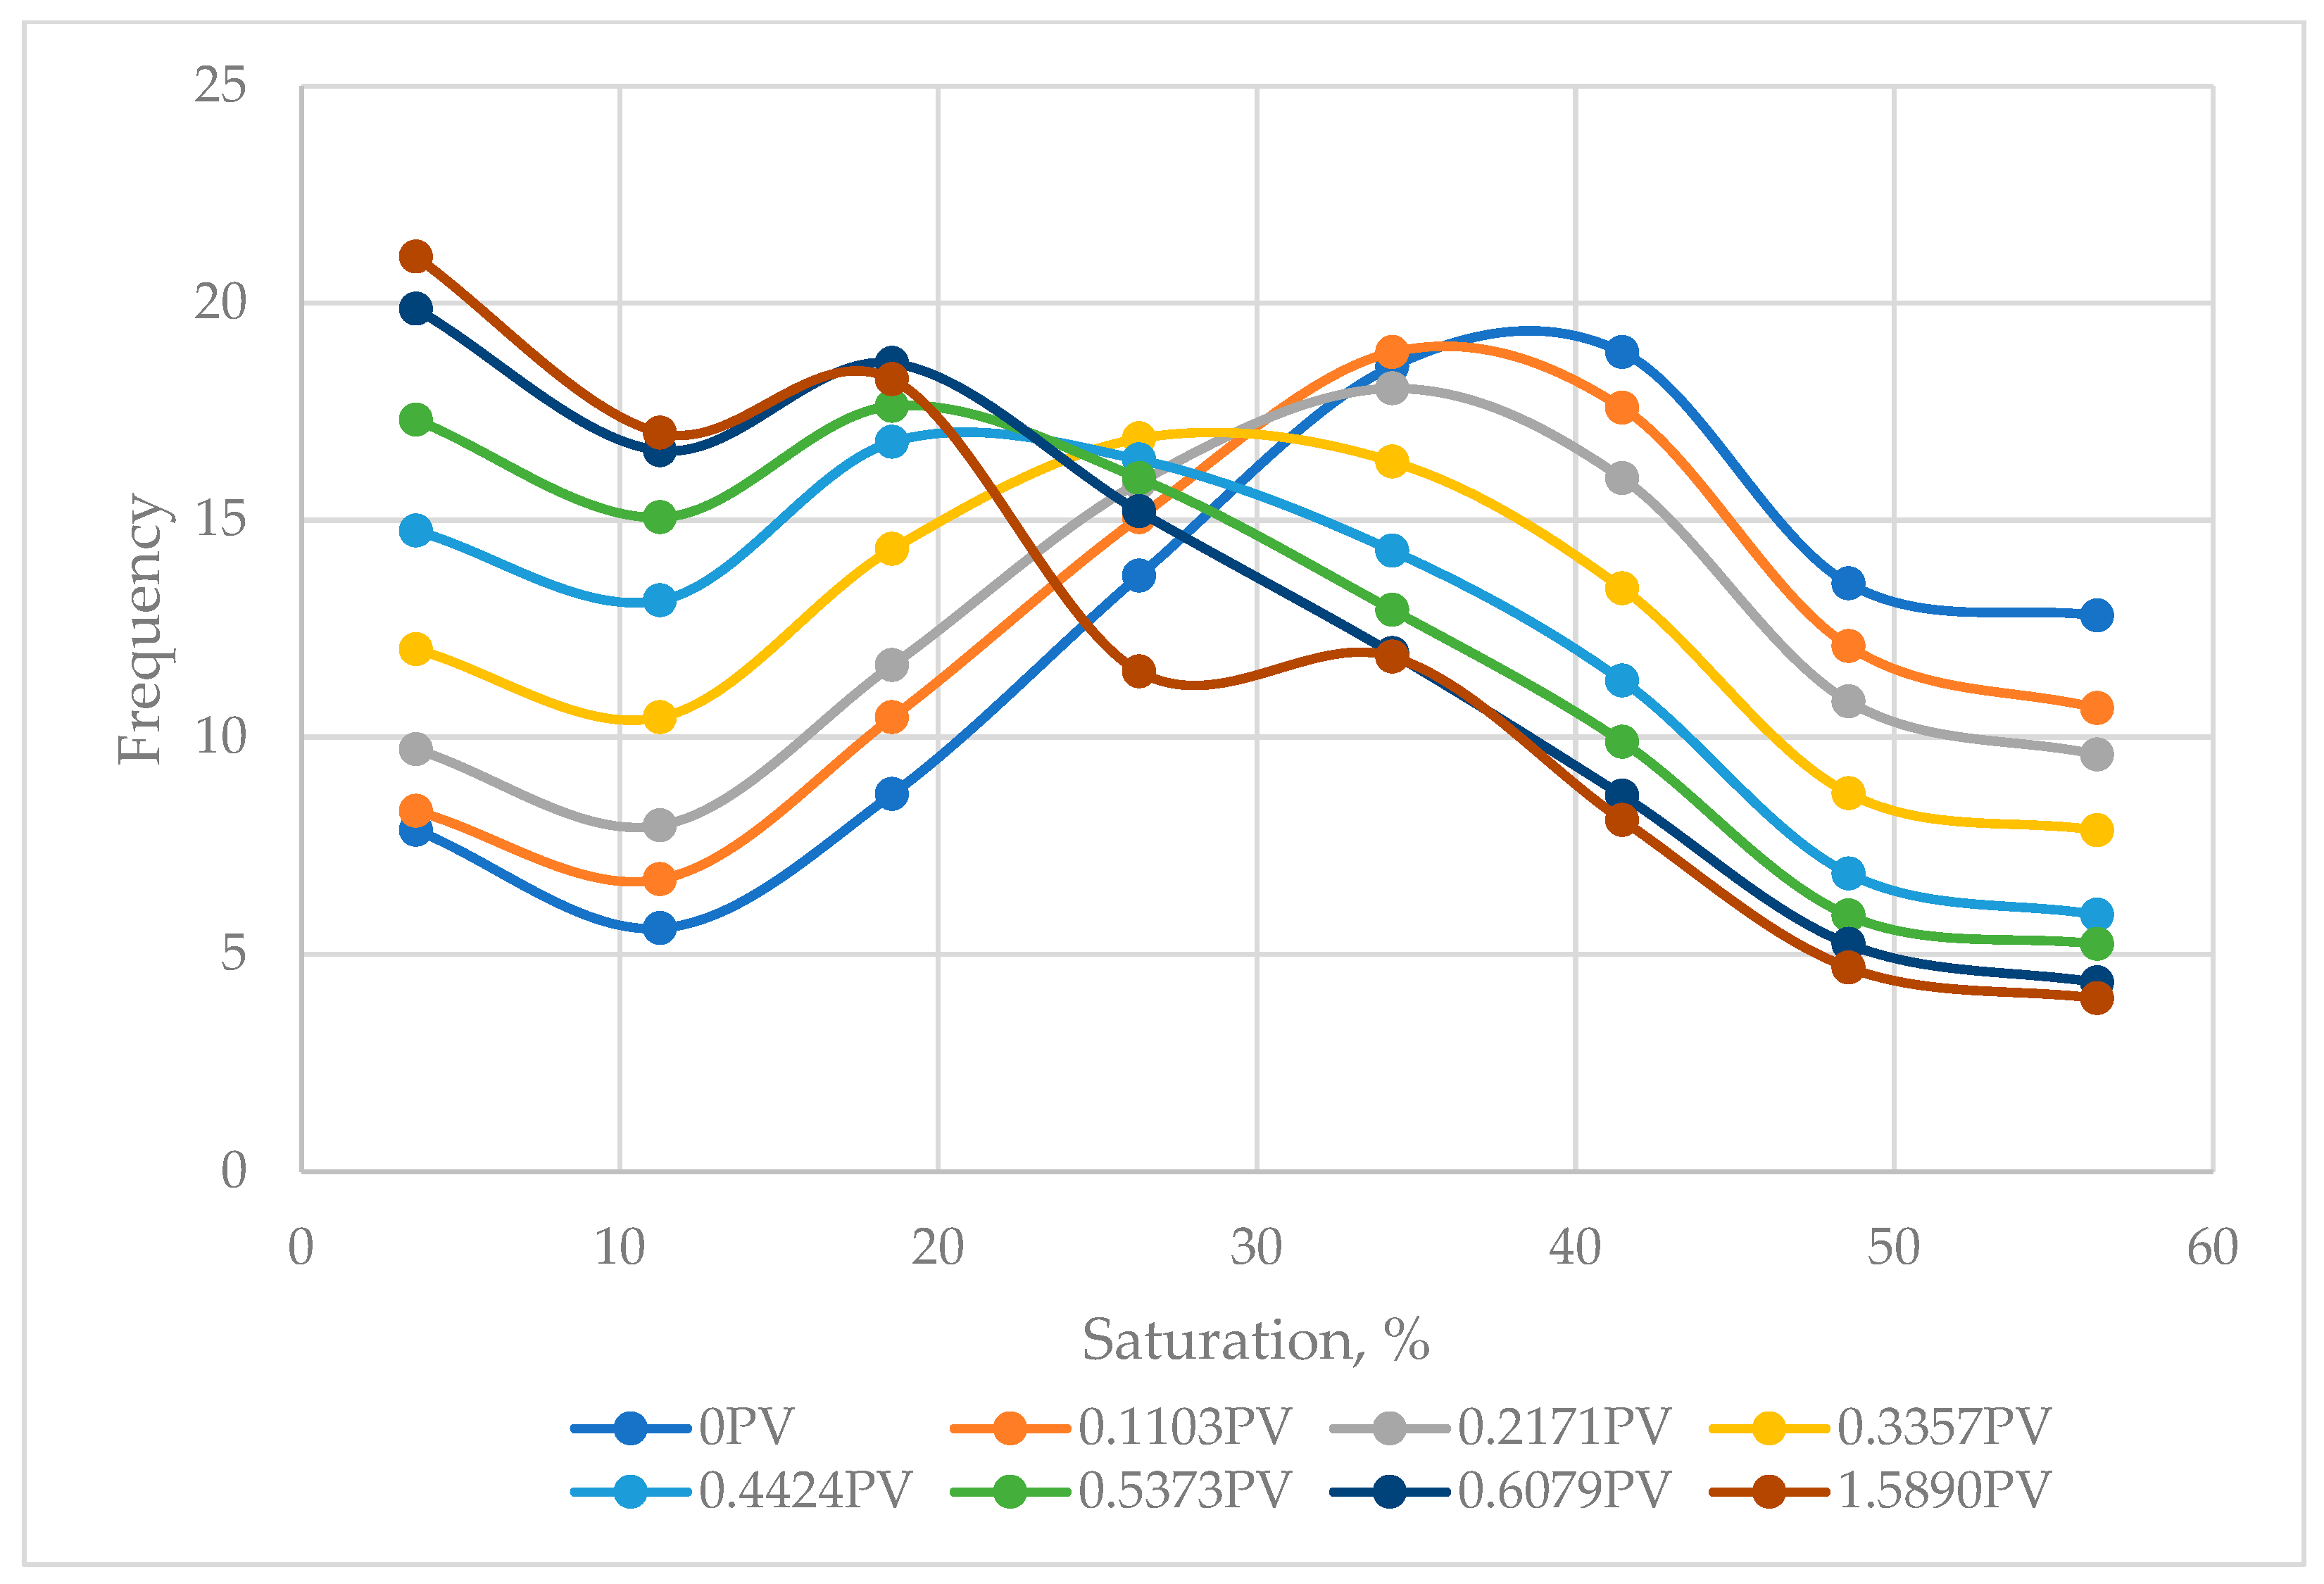
3.3.3. Distribution Characteristics of Remaining Oil

It can be seen from Figure 13 that the distribution frequency of oil saturation decreases from the initial peak value of 41% to a peak value of 20% after water flooding. It can be concluded that the swept degree of this core is high, but the microscopic oil displacement efficiency is low. If we want to improve the recovery factor, we need to improve the microscopic oil displacement efficiency. Further scanning of the cores after water flooding by micro-CT found that those with pores below 65 microns were in the poor passive condition.

3.3.4. Influence of Different Original Oil Saturation

Considering the influence of dissolved gas, it can be seen from Figure 14 that different original oil contents have a great influence on the relative permeability of oil and water and residual oil saturation. The trend is that the residual oil saturation in the state of irreducible water is the lowest because when the water flows (not bound water), the dissolved gas is captured to form an airlock Jamin effect, which hinders the flow of the oil phase.

3.3.5. Influence of Different Core Permeability

A comparison experiment was also carried out on cores with different permeabilities, and it was found that the degassing phenomenon was more serious for the rock samples with low permeability. Rock samples with higher permeability have less degassing due to larger pore throats and easier pressure replenishment. Reservoir porosity and permeability are inherent properties of reservoir rocks. When water injection is used to displace crude oil in the reservoir, reservoir porosity and permeability will inevitably affect the oil displacement efficiency of injected water. However, the correlation between reservoir physical properties and water drive efficiency is not very obvious. As one of the factors affecting the water drive efficiency, reservoir physical property cannot reflect or judge the waterdrive efficiency alone. It needs to be comprehensively reflected and characterized in combination with other influencing factors. The oil displacement efficiency of cores with different permeability is shown in Table 2.

4. Conclusions

Low-permeability oil reservoirs are currently the mainstay of production-capacity construction and oilfield production in new areas. This project has established the digital core multi-stage pore network model, the three-phase seepage simulation method considering the release of dissolved gas, and the three-phase permeability curve test of the strongly sorted heterogeneous conglomerate reservoir in the Lower Wuerhe Formation of Block 8 of the Karamay oil field.
(1)
The reservoir cores in the study area are all of low porosity and low permeability, and the permeability of the core samples is distributed in an inverse rhythm pattern with layer depth. This reservoir is a thick conglomerate reservoir with low porosity (porosity 12%), ultra-low permeability (permeability 1.2 mD), burial depth (average burial depth of 2623 m), and microfractures.
(2)
CT core analysis and mercury intrusion experiments indicate that the area with porosity ranging from 9% to 21% accounts for 79%, making it the main seepage channel area. Larger pores play a major role in seepage.
(3)
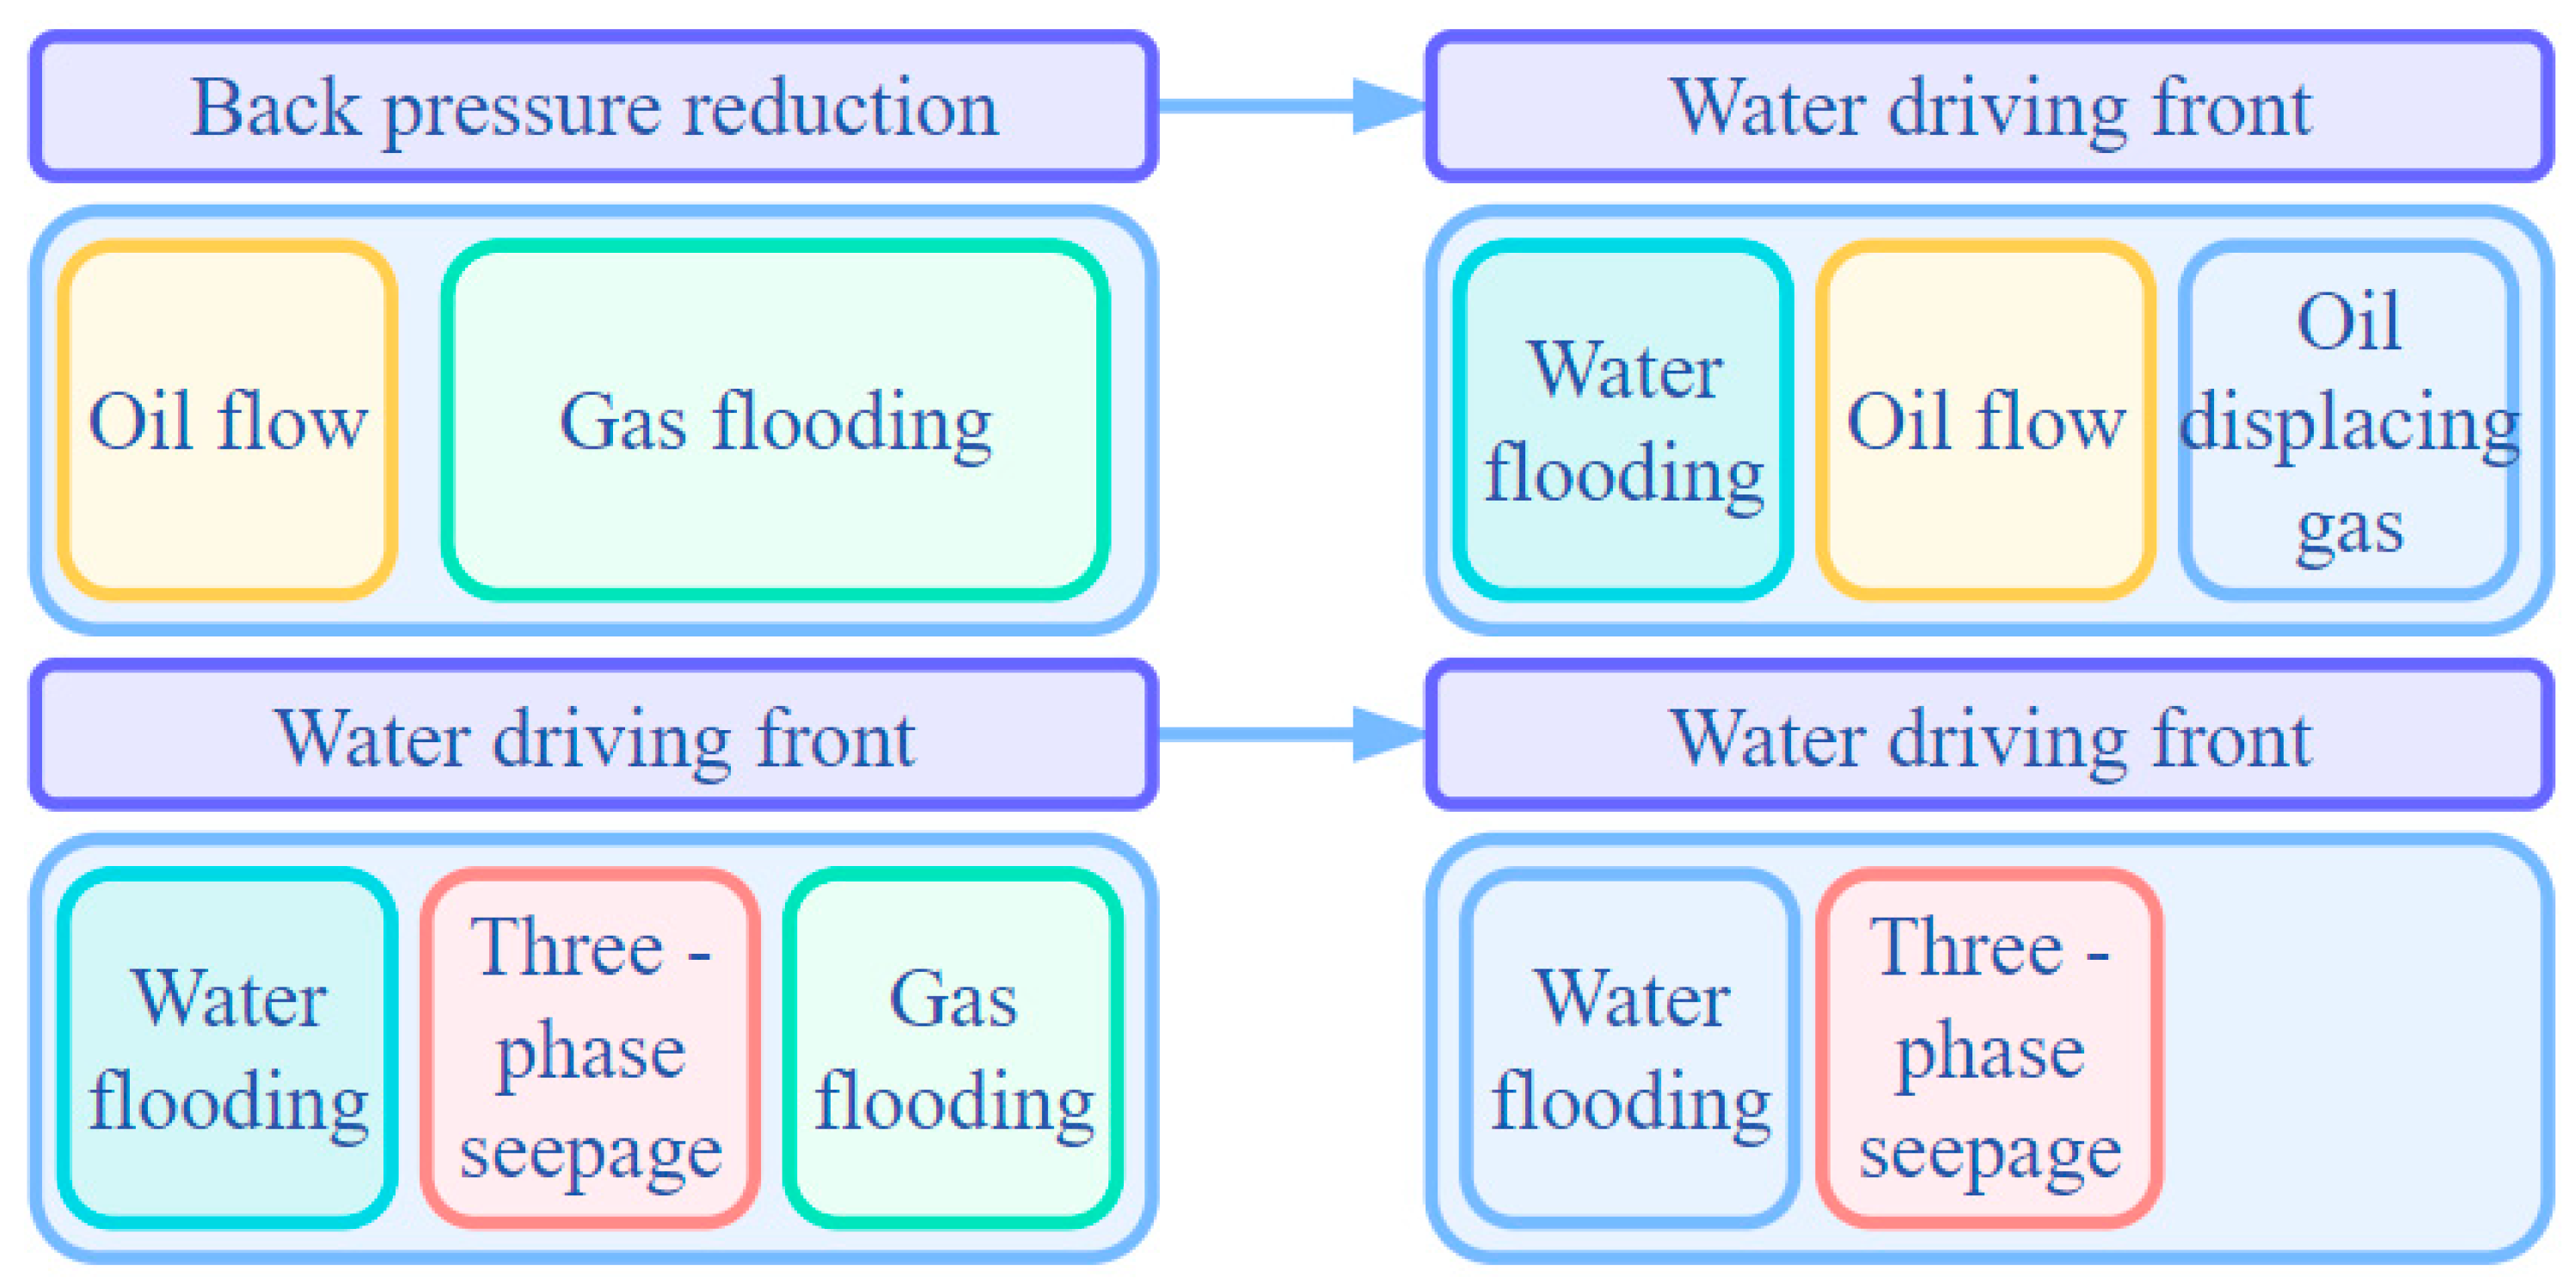
The CT scanning core displacement system achieves real-time dynamic detection of the multiphase saturation field in the core. At the beginning of the waterdrive process, there are two saturated historical regions along the core. After the displacement front enters the dissolved gas precipitation zone, there are three saturation history zones, at which time there is three-phase seepage near the core outlet.
(4)
In terms of the remaining oil distribution characteristics, the distribution frequency of oil saturation decreased from the initial peak of 41% to a peak of 20% after water flooding. Different original oil content has great influence on oil–water relative permeability and residual oil saturation. The degassing phenomenon of rock samples with different permeability is also different. The degassing phenomenon is more severe in rock samples with low permeability. It is necessary to comprehensively consider factors such as reservoir porosity and permeability to comprehensively reflect and characterize waterdrive efficiency.
In the actual process of reservoir development, it is necessary to treat the impact of water injection on the development effect reasonably, choose appropriate water injection methods and cycles, avoid premature water breakthrough in ultra low-permeability reservoirs, and improve oilfield production efficiency.

Author Contributions

Conceptualization, Z.J. and H.T.; methodology, L.Z.; software, X.W.; validation, Z.J., J.W. and X.W.; formal analysis, L.Z.; investigation, H.T.; resources, L.Z.; data curation, X.W.; writing—original draft preparation, J.W.; writing—review and editing, Z.J.; visualization, H.T.; supervision, Z.J.; project administration, Z.J.; funding acquisition, Z.J. All authors have read and agreed to the published version of the manuscript.

Funding

This work was supported by the research and pilot test of Oil Recovery Enhancement Technology (2022KT08).

Informed Consent Statement

Informed consent was obtained from all subjects involved in the study.

Data Availability Statement

The figures and tables used to support the findings of this study are included in the article.

Acknowledgments

The authors would like to show sincere thanks to those who have contributed to this research.

Conflicts of Interest

The authors declare no conflict of interest.

Abbreviations

CTComputed Tomography
kPermeability; mD
PVthe pore volume; non-dimensional

References

  1. Shun, G.; Chao, D.; Jianshan, Q.; Lan, G.; Yongping, W.; Qing, Z.; Baojun, W. Development strategy of proved un-developed geological reserves in the Yanchang oil region, Ordos Basin#br#. China Pet. Explor. 2021, 26, 85. [Google Scholar] [CrossRef]
  2. Fan, Y.M. Classification and evaluation of undeveloped reserves in low permeability reservoirs based on development technology. Pet. Exp. Geol. 2022, 44, 337–341. [Google Scholar]
  3. Kang, X.; Hu, W.; Cao, J.; Jin, J.; Wu, H.; Zhao, Y.; Wang, J. Selective dissolution of alkali feldspars and its effect on Lower Triassic sandy conglomerate reservoirs in the Junggar Basin, northwestern China. Geol. J. 2018, 53, 475–499. [Google Scholar] [CrossRef]
  4. Zhou, Y.; Wu, S.; Li, Z.; Zhu, R.; Xie, S.; Jing, C.; Lei, L. Multifractal Study of Three-Dimensional Pore Structure of Sand-Conglomerate Reservoir Based on CT Images. Energy Fuels 2018, 32, 4797–4807. [Google Scholar] [CrossRef]
  5. Wang, H.-X.; Wang, G.; Chen, Z.X.J.; Wong, R.C. Deformational characteristics of rock in low permeable reservoir and their effect on permeability. J. Pet. Sci. Eng. 2010, 75, 240–243. [Google Scholar] [CrossRef]
  6. Qin, Q.; Cheng, H.; Wang, M.; Sun, M.; Zhao, L. Analyzing the wettability of tight sandstone of Taiyuan formation in Shenfu block, eastern margin of ordos basin. IOP Conf. Ser. Earth Environ. Sci. 2021, 671, 012022. [Google Scholar] [CrossRef]
  7. Kang, W.-L.; Zhou, B.-B.; Issakhov, M.; Gabdullin, M. Advances in enhanced oil recovery technologies for low permeability reservoirs. Pet. Sci. 2022, 19, 1622–1640. [Google Scholar] [CrossRef]
  8. Li, X.; Yang, Z.; Li, S.; Huang, W.; Zhan, J.; Lin, W. Reservoir characteristics and effective development technology in typical low-permeability to ultralow-permeability reservoirs of China National Petroleum Corporation. Energy Explor. Exploit. 2021, 39, 1713–1726. [Google Scholar] [CrossRef]
  9. Clarke, R.H. Reservoir Properties of Conglomerates and Conglomeratic Sandstones: GEOLOGIC NOTES. AAPG Bull. 1979, 63, 799–803. [Google Scholar] [CrossRef]
  10. Sneider, R.M.; King, H.R.; Hawkes, H.E.; Davis, T.B. Methods for Detection and Characterization of Reservoir Rock, Deep Basin Gas Area, Western Canada. J. Pet. Technol. 1983, 35, 1725–1734. [Google Scholar] [CrossRef]
  11. Yin, S.; Chen, Y.; Wu, X. Different pore structure modalities in sandy conglomerate reservoirs and their forming mechanisms. Arab. J. Geosci. 2018, 11, 654. [Google Scholar] [CrossRef]
  12. Sneider, R.; Richardson, F.; Paynter, D.; Eddy, R.; Wyant, I. Predicting Reservoir Rock Geometry and Continuity in Pennsylvanian Reservoirs, Elk City Field, Oklahoma. J. Pet. Technol. 1977, 29, 851–866. [Google Scholar] [CrossRef]
  13. Zhang, D.; Ma, S.; Zhang, J.; Zhu, Y.; Bin Wang, B.; Zhu, J.; Fan, X.; Yang, H.; Liang, T. Field experiments of different fracturing designs in tight conglomerate oil reservoirs. Sci. Rep. 2022, 12, 3220. [Google Scholar] [CrossRef] [PubMed]
  14. Wei, X.; Guo, Y.; Cheng, H.; Meng, X.; Cheng, M.; Yang, T.; Xu, C. Rock mass characteristics in Beishan, a preselected area for China’s high-level radioactive waste disposal. Acta Geol. Sin. 2019, 93, 116–126. [Google Scholar] [CrossRef]
  15. Xiong, J.; Wang, H.; Huang, L.; Zhang, H.; Liu, X.; Yin, G. Rock stress sensitivity in low-permeability gas reservoirs and its impact on productivity. IOP Conf. Ser. Earth Environ. Sci. 2020, 570, 022021. [Google Scholar] [CrossRef]
  16. Krause, F.F.; Collins, H.N.; Nelson, D.A.; Machemer, S.D.; French, P.R. Multiscale anatomy of a reservoir: Geological characterization of Pembina-Cardium pool, west-central Alberta, Canada. Aapg Bull. 1987, 71, 1233–1260. [Google Scholar]
  17. Afzali, S.; Zendehboudi, S.; Mohammadzadeh, O.; Rezaei, N. Hybrid mathematical modelling of three-phase flow in porous media: Application to water-alternating-gas injection. J. Nat. Gas Sci. Eng. 2021, 94, 103966. [Google Scholar] [CrossRef]
  18. Schäfer, G.; Roupert, R.D.C.; Alizadeh, A.H.; Piri, M. On the prediction of three-phase relative permeabilities using two-phase constitutive relationships. Adv. Water Resour. 2020, 145, 103731. [Google Scholar] [CrossRef]
  19. Zhu, X.; Wang, S.; Feng, Q.; Zhang, L.; Chen, L.; Tao, W. Pore-scale numerical prediction of three-phase relative permeability in porous media using the lattice Boltzmann method. Int. Commun. Heat Mass Transf. 2021, 126, 105403. [Google Scholar] [CrossRef]
  20. Zheng, M.; Li, J.; Wu, X.; Li, P.; Wang, W.; Wang, S.; Xie, H. Physical modeling of oil charging in tight reservoirs: A case study of Permian Lucaogou Formation in Jimsar Sag, Junggar Basin, NW China. Pet. Explor. Dev. 2016, 43, 241–250. [Google Scholar] [CrossRef]
  21. Wang, J.; Ge, H.; Liu, J.; Shen, Y.; Zhang, Z.; Luo, S.; Liu, D. Effects of Gravel Size and Content on the Mechanical Properties of Conglomerate. Rock Mech. Rock Eng. 2022, 55, 2493–2502. [Google Scholar] [CrossRef]
  22. Tan, F.; Li, H.; Xu, C.; Li, Q.; Peng, S. Quantitative evaluation methods for water-flooded layers of conglomerate reservoir based on well logging data. Pet. Sci. 2010, 7, 485–493. [Google Scholar] [CrossRef] [Green Version]
  23. Liu, Z.; Li, Y.; Chen, X.; Chen, Y.; Lyu, J.; Sui, M. The Optimal Initiation Timing of Surfactant-Polymer Flooding in a Waterflooded Conglomerate Reservoir. SPE J. 2021, 26, 2189–2202. [Google Scholar] [CrossRef]
  24. Malvić, T.; Sučić, A.; Cvetković, M.; Resanović, F.; Velić, J. Low permeability Neogene lithofacies in Northern Croatia as potential unconventional hydrocarbon reservoirs. Open Geosci. 2014, 6, 182–194. [Google Scholar] [CrossRef]
  25. Kaminskaite, I.; Fisher, Q.; Michie, E. Impact of Laboratory-Induced Deformation and Naturally-Occurring Faults on Fluid Flow in Carbonates. In Proceedings of the Fifth International Conference on Fault and Top Seals, Palermo, Italy, 8–12 September 2019; pp. 1–5. [Google Scholar] [CrossRef]
  26. Liu, C.; Yin, C.; Lu, J.; Sun, L.; Wang, Y.; Hu, B.; Li, J. Pore structure and physical properties of sandy conglomerate reservoirs in the Xujiaweizi depression, northern Songliao Basin, China. J. Pet. Sci. Eng. 2020, 192, 107217. [Google Scholar] [CrossRef]
Figure 1. Geographical and Structural Location of Block 8 of Karamay Oilfield.
Processes 11 02054 g001
Figure 2. Schematic diagram of three-phase relative permeability test based on CT scanning.
Processes 11 02054 g002
Figure 3. The porosity and permeability of the measured samples.
Processes 11 02054 g003
Figure 4. Axial distribution curve of CT value of core.
Processes 11 02054 g004
Figure 5. CT value distribution of two typical conglomerate axial sections.
Processes 11 02054 g005
Figure 6. Pore size distribution of core at permeability k = 3.35 and k = 0.72.
Processes 11 02054 g006
Figure 7. Pore throat size distribution of core at permeability k = 3.35 and k = 0.72.
Processes 11 02054 g007
Figure 8. Porosity distribution frequency of core T01381.
Processes 11 02054 g008
Figure 9. Reconstruction diagram of CT value distribution of the core slice.
Processes 11 02054 g009
Figure 10. Distribution of water saturation along the water flooding process.
Processes 11 02054 g010
Figure 11. Distribution of gas saturation at back pressure of 8 MPa.
Processes 11 02054 g011
Figure 12. Saturation history inside the core at different stages.
Processes 11 02054 g012
Figure 13. Frequency variation of oil saturation distribution at different times.
Processes 11 02054 g013
Figure 14. Oil displacement efficiency under different original oil content.
Processes 11 02054 g014
Table 1. Analysis results of the pore structure of the cast thin sections of the cores used in the study.
Pore Structures
Core NumberT01251T07252T14251T23251T28252T36251
Depth, m2532.672544.082556.492591.62605.12613.7
Primary pores----10%-
Secondary intragranular dissolution pores35%35%32%30%30%30%
Intergranular pores55%65%58%50%50%60%
Hetero group sparingly soluble pores10%10%10%20%10%10%
Pore surface rate, %89115106
Total pore surface rate, %89115106
Average pore diameter, μm256186355108160430
Average throat width, μm323040316284
Average pore-throat ratio8.286.28.883.482.585.1
Average coordination number0.40.40.40.40.80.4
Secondary intergranular dissolved pores are negatively correlated with depth, average throat width is positively correlated with depth, and average pore throat ratio is positively correlated with depth, while other parameters are not obviously correlated with depth.
Table 2. Oil displacement efficiency of cores with different permeability.
Core SamplePermeability (mD)Whether OverpressureOil Displacement Rate (%)
T082511.04No50.1
T252510.57No44.3
T302510.36No42.1
T272510.27No28.8
T182510.19Yes11.6
Disclaimer/Publisher’s Note: The statements, opinions and data contained in all publications are solely those of the individual author(s) and contributor(s) and not of MDPI and/or the editor(s). MDPI and/or the editor(s) disclaim responsibility for any injury to people or property resulting from any ideas, methods, instructions or products referred to in the content.

