Abstract
Gas-liquid two-phase swirling flow is widely used for gas-liquid separation in the power, chemical, petroleum, and nuclear industries. However, the majority of current research on swirling flow focuses on identifying flow patterns and does not pay more attention to topics such as the boundary where swirling flow forms. The length and diameter of the central gas core are the main focus of the current studies as well as the distribution patterns of gas-liquid two-phase. Comparative studies on the gas-liquid distribution morphology, such as whether the gas phase is separated and the separation mode, are lacking. In this paper, a combination of visual experimental observations and numerical simulations of Computational Fluid Dynamics (CFD) is used to investigate the formation conditions of gas-liquid two-phase swirling flow in three types of cyclonic components. The results show that the minimum superficial liquid velocity for the formation of swirling flow in the horizontal tube is about 0.375~0.82 m/s when the superficial gas velocity is less than 10 m/s. The formation of swirling flow is almost independent of the geometric swirl number and superficial liquid velocity when the superficial gas velocity is greater than 10 m/s. At low inlet superficial velocities, the tangential velocity determines the transition from swirling flow to stratified flow. However, at higher inlet superficial velocities, the decay of the cyclonic field is mainly affected by the wave amplitude of the gas-liquid interface. In both co-current and counter-current horizontal inline gas-liquid cyclone separators, the flow split is related to the vortex core breakdown of the central gas core. In addition, the numerical simulation results show that the breakdown of the vortex core is related to the pressure distribution inside the separator. This work enriches the study of swirling flow and provides a basis for the performance improvement of inline gas-liquid cyclone separators.
1. Introduction
The gas-liquid two-phase swirling flow refers to a rotating movement by which two types of fluids, including gas and liquid, move axially and, meanwhile, move tangentially. It is widely used for gas-liquid separation in the areas of power, chemical, petroleum, and nuclear industries [1,2,3,4]. The definition and classification of various rotational flow patterns have not yet been unified due to the fact that the judgment of flow patterns is often influenced by the subjective perception of researchers. Wang et al. classified the swirling flow into spiral wavy stratified flow, spiral bubble flow, spiral slug flow, spiral linear flow, spiral axial flow, and spiral dispersive flow. Bai et al. divided the swirling flow into three types: rotating gas column flow, rotating intermittent flow, and rotating annular flow. Shakutsui et al. divided the swirling flow into chain flow, twisted flow, spiral flow, and twisted foam flow. The swirling flow in this study refers to the flow type in which a columnar gas core exists in the center of a horizontal cylindrical pipe, and the outer annular layer is the rotating liquid phase. The formation of swirling flow is the prerequisite condition for achieving gas-liquid separation, while the change of gas-liquid morphology has an important influence on the separation process [5,6]. Wang et al. studied the classification of swirling flow patterns in horizontal pipe when the superficial gas velocity and superficial liquid velocity were 0.01~3.4 m/s and 0.05~2.7 m/s, respectively. They also explored the influence of parameters such as cyclonic blade angle and blade area on the flow pattern [7]. Bai et al. experimentally investigated the flow pattern identification and the transition from rotating bubble flow to rotating segment plug flow in a vertical cyclonic flow pipe [8,9]. Liu et al. studied the effect of swirl decay on the flow pattern in horizontal pipe [10]. Yan et al. conducted an experimental study on the gas-liquid flow pattern in a three-stage gas-liquid cyclone separator under different inlet gas volume fractions [11]. However, the above studies focused on the identification of flow types but hardly considered the effect of geometric swirl numbers on flow patterns, and the study of boundary conditions of swirling flow formation is not systematic and comprehensive enough.
In the swirling flow field, the gas-liquid flow pattern and interface morphology are mainly influenced by the cyclonic flow generation structure (tangential inlet, static swirl element, etc.), initial cyclonic intensity, flow field parameters (gas velocity, liquid velocity), whether the gas phase is separated or not, as well as the different separation method adopted (counter-current type, co-current type). The experimental results of Alexander and Bryant et al. showed that there is a natural gas core length in the tangential inlet counter flow gas-liquid cyclonic field, and the corresponding theoretical equation was proposed [12]. Using the Response Surface Method (RSM) and numerical simulation methods, Qian et al. proposed a theoretical model to predict the length of gas cores and investigated the effect of the entrance angle on the length of gas cores [13]. The first model for calculating the diameter of the gas core within a liquid-liquid hydrocyclone based on pressure equilibrium was presented by Barrientos et al. Subsequently, Concha et al. developed the Barrientos model by correlating the pressure drop, the normal component of the radial velocity gradient, and the geometric parameters using an empirical formulation [14]. Davidson et al. proposed a correction model for calculating the diameter of the air core within the hydrocyclone based on the flow relationship [15,16]. A semi-theoretical-semi-empirical model for the diameter of the gas nucleus within the hydrocyclone was proposed by Neesse et al. and further simplified in order to be used for estimating the diameter of the gas core [17]. However, existing studies have mainly focused on the vertically placed hydrocyclones and have focused on the length and diameter of the gas core, while the study on the influence of the gas-liquid separation method on the gas-liquid morphology in horizontal pipe is relatively insufficient.
To address the shortcomings of existing studies, this paper aims to investigate some important conditions for the formation of swirling flow in horizontal cylindrical pipes and discusses the effect of flow field decay and gas phase separation methods on swirling flow patterns. The visualization experiment system and digital image processing method are used to obtain the critical velocity of forming swirling flow in the horizontal cylindrical pipe and reveal the influence law of different parameters on the swirling flow pattern. Combined with Computational Fluid Dynamics (CFD) numerical simulations, the internal flow fields of three cyclonic components under different operating conditions are analyzed, and then the change of the cyclonic number and tangential velocity on the rotating-flow transformation and the influence mechanism are discussed. This study provides results on the formation boundary of swirling flow and the influence of related factors on swirling flow, which is expected to provide the basis for the accurate classification of swirling flow and the performance improvement of tubular gas-liquid cyclone separation equipment.
2. Research Methods
2.1. Experimental Methods and Image Processing
2.1.1. Research Object
As shown in Figure 1, this study involves three common types of horizontal inline cyclones. The first type is a cyclone pipe consisting of a cyclone section containing a stationary cyclone element and a straight pipe section. In a cyclonic flow pipe, the gas-liquid pattern is only related to the structural parameters of the static swirl element and the inlet flow parameters. Therefore, the boundary conditions of swirling flow formation and the effect of flow field decay on the gas-liquid morphology are mainly studied in the cyclonic flow pipe. The second and third cyclonic assemblies are gas-liquid separators, which are mainly used to study the effect of the separation method on the gas-liquid morphology. The two most common types of gas-liquid separation are considered here. One is co-current flow separation, where the gas flows out in the same direction as the incoming flow. The other one is counter-flow separation, i.e., the direction of gas outflow is opposite to the direction of the incoming flow. Considering the fact that the gas phase can be separated out in different proportions, so in addition to the static swirl element and the inlet flow, the separated gas flow rate also affects the gas-liquid morphology in the swirling field.
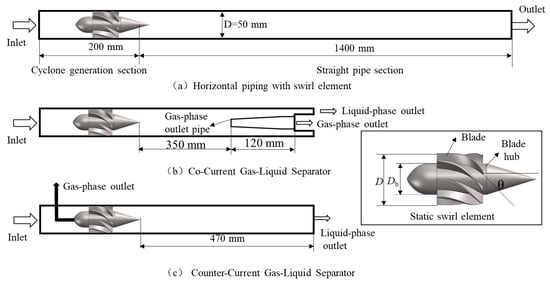
Figure 1.
Schematic diagram of the structure of three typical cyclone devices.
The static swirl element is the key structure that induces cyclonic flow in the above three types of cyclonic devices. The geometric swirl number of the static swirl element, calculated by Equation (1), is related to the initial swirl intensity of the flow field [18],
where D is the diameter of the static swirl element, which is 50 mm; Db is the diameter of the blade hub, which is 30 mm; and θ is the blade exit angle. In this study, the blade exit angles are 30°, 45°, and 60°, corresponding to the geometric swirl numbers of 0.4715, 0.8167, and 1.4145, respectively.
During the experiment, the inlet flow parameter that can be changed is the superficial velocity, which is calculated by Equation (2),
where Q is the volume flow rate, and D is the pipe diameter. The subscript i for g represents the gas phase, and i for l indicates the liquid phase.
During the separation process, in order to study the effect of the separated gas flow rate on the gas-liquid morphology, the gas phase flow split (FS), as shown in Equation (3), is introduced,
where Q is the volume flow rate, the subscript g denotes the gas phase, and the subscripts out and in represent the outlet and inlet, respectively.
For cyclonic flow pipes, numerous experiments are performed by varying the superficial gas velocity, superficial liquid velocity, and geometric cyclonic number. These experiments are carried out to analyze different flow patterns and to confirm the formation of boundaries for rotational flows. In order to study the effect of the separation status of the gas phase on the gas-liquid morphology, experiments are conducted on two different types of cyclonic separators. In addition, numerical simulation studies are carried out to clarify the effect of flow field parameters on the gas-liquid morphology. The experimental and numerical simulation settings are shown in Table 1.

Table 1.
Arrangement of experiments and CFD numerical simulations.
2.1.2. Visualization Experiment System
The visualization experiment system is shown in Figure 2, which is mainly composed of a gas-liquid supply part, gas-liquid metering part, SV static mixer, horizontal inline cyclone device, digital camera system, and a light source. Water from the tank is transported by a centrifugal pump to a liquid flow meter for accurate inline metering and then enters the SV static mixer from the left end. The gas from the gas cylinder or air compressor is depressurized, metered, and then enters the SV static mixer from the middle inlet. After mixing by the static mixer, the gas-liquid mixture enters the horizontal inline cyclone device, which is made of transparent Plexiglas, in order to record the gas-liquid morphology using a digital camera system. The liquid phase flowing out of the horizontal tubular cyclone assembly enters the water tank, where the residual fraction of the gas phase is emptied, and the pure liquid phase is recycled. The gas phase with a small amount of liquid enters the vertical gas-liquid separator, and the separated gas phase is discharged to the atmosphere after metering. Pressure gauges are installed at the inlet and outlet of the horizontal inline cyclonic device to collect pressure data. A Sony HDR-XR550 digital video camera, a NEX-5C digital camera, and an IDT Motion Pro Y3-S2 high-speed camera are utilized to record the dynamic behavior of gas-liquid in the cyclonic device. The gas-liquid pattern in the cyclonic device is photographed in the horizontal direction only. In addition, when studying the separation method on the gas-liquid morphology, the separated gas phase is introduced into the gas-liquid separation system. The flow split can then be obtained by dividing the gas volume flow rate of the separated by that of the inlet.
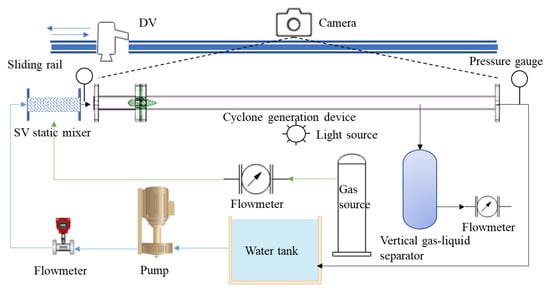
Figure 2.
Flow diagram of the visualization experiment system.
2.1.3. Image Processing Process
The images taken by the visualized experimental system are used to obtain gas-liquid interface information, such as the diameter of the central gas core, by means of image processing. A certain amount of gas and liquid is passed through the horizontal inline cyclonic device and operated stably over a period of time. As shown in Figure 3, image I of the gas-liquid mixture passing through the cyclonic device is first taken carefully. In MATLAB R2019a, image I is filtered to remove the noise and then cropped to obtain the image J of the target region. Image J actually contains only the portion in the red box in Figure 3. Next, the image J is converted into a grayscale image and then into a binary image K after the edges of the image J are obtained using the canny algorithm. Subsequently, the upper and lower edges of the binary image K are counted pixel by pixel in top-to-bottom and left-to-right order, and their coordinate positions are obtained. The pixel data of the gas-liquid interface is obtained by calculating the distance between the upper and lower edge coordinates. Finally, the gas-liquid interface data or the central gas core diameter is obtained based on the correspondence between the pixel and the actual size [19].
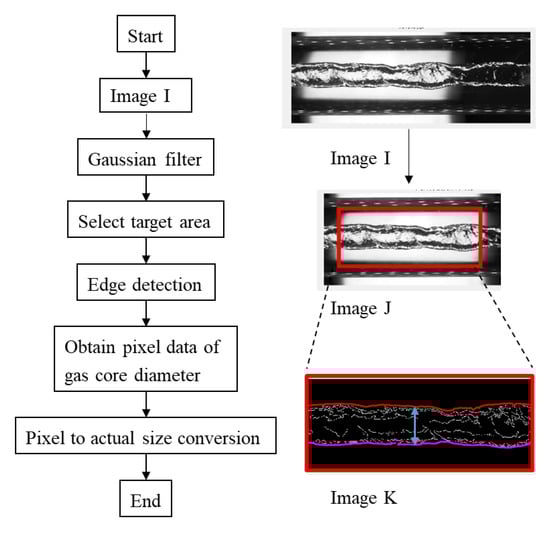
Figure 3.
Illustration of image processing process.
2.2. Numerical Simulation Methods and Model Validation
2.2.1. Grid Generation and Validation
The physical model building, mesh generation, and model solving in CFD numerical simulation are performed using ANSYS software (Version 2020 R1) [20]. The physical models of the three horizontal inline cyclonic devices and the corresponding grids are shown in Figure 4. ICEM CFD 2020 software is adopted to delineate the hexahedral mesh of the physical model, and the maximum mesh size is set to 2 mm. The grid is much denser at the walls and blades of static swirl elements as needed. In general, the more severe the warping of the blade, the more difficult it is to generate high-quality meshes. As an example, the structure with the most severe blade twisting (Sw = 1.4145) has a 3 × 3 × 3 determinant of the grid > 0.45, an aspect ratio < 20, an angle > 14°, and a maximum warping of 40°. It can be seen that the generated mesh is of high quality and meets the requirement of reliable numerical simulation.
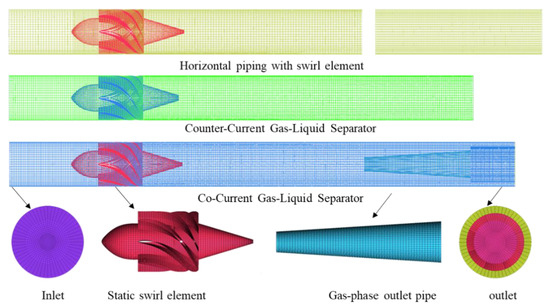
Figure 4.
Hexahedral meshing results for three horizontal inline cyclonic devices.
The tangential velocity distribution of the liquid phase at the z = 2D position of the cyclonic flow pipe for five different grid numbers is shown in Figure 5. It can be seen that the difference in tangential velocity becomes smaller as the number of grids increases. The relative error of tangential velocity is 2.03% for grid numbers 751,318 and 846,466, so the number of grids is guaranteed to be larger than 751,318 in the later numerical simulations.
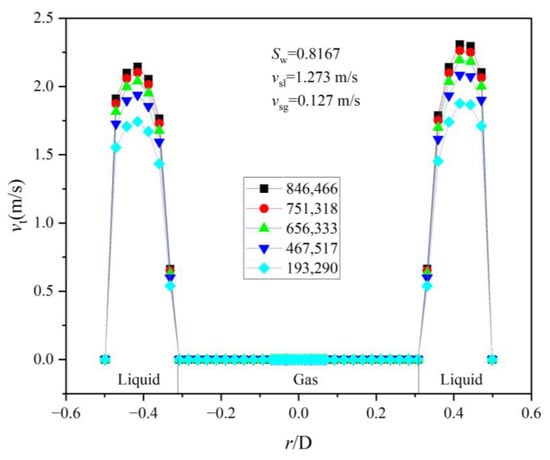
Figure 5.
Liquid-phase tangential velocity distribution at z = 2D in the swirling flow pipe.
2.2.2. Model Settings
In the CFD numerical simulation, the Eulerian multiphase flow model is chosen to capture the gas-liquid flow pattern and the gas-liquid interface. Enable the Multi-Fluid VOF option and choose the sharp/dispersed method for interface capture. The Multi-Fluid VOF model has better robustness and is also able to accurately capture the gas-liquid interface [21]. The sharp/dispersed method is a hybrid approach for flows consisting of both sharp and dispersed interfaces [22,23]. The mass and momentum conservation equations in the Eulerian multiphase flow model are given by Equations (4) and (5) [24],
The volume constraint is,
where αi, ρi, μt,i, , are the volume fraction, density, viscosity, and turbulence velocity, respectively; The subscript i represents the gas phase when it is g and the liquid phase when it is l.
The research results of Liu et al. showed that, compared with the RSM model, the RNG k-ε model is much better when the swirl number is less than 2 [3]. The RNG k-ε model, which can simulate separated flow, secondary flow, and cyclonic flow, is chosen as the turbulence model in this study. The transport equations for the turbulent kinetic energy (k) and turbulent energy dissipation rate (ε) in the model are,
where is the turbulent vortex viscosity coefficient, is the turbulent kinetic energy generation term, , is the model coefficient.
In the multiphase flow model, the primary phase is water with density and viscosity of 998.2 kg/m3 and 0.001 Pa·s, respectively. The second phase is air with density and viscosity of 1.225 kg/m3 and 17.2 × 10⁻⁶ Pa·s, respectively. The inlet boundary is the velocity inlet, and all exits are set to outflow. The hydraulic diameter, inlet velocity, and inlet air content are set according to actual conditions. The SIMPLE algorithm is chosen to solve the equations of pressure and velocity coupling, PRESTO is preferred for pressure interpolation solution, and the second-order windward format is intended for equation discretization. During the non-stationary simulation, the calculation accuracy is set to 10−6, the time step is set to 10−5, and the total number of calculation steps is preset to 106.
2.2.3. Model Validation
The differential pressure between the inlet and outlet of the cyclone flow pipe at different inlet liquid velocities is shown in Figure 6. It can be seen that the experimentally obtained pressure drop is closer to the numerical simulation results, and the maximum relative error is 4.2%. Therefore, the established numerical simulation method can be considered accurate enough.
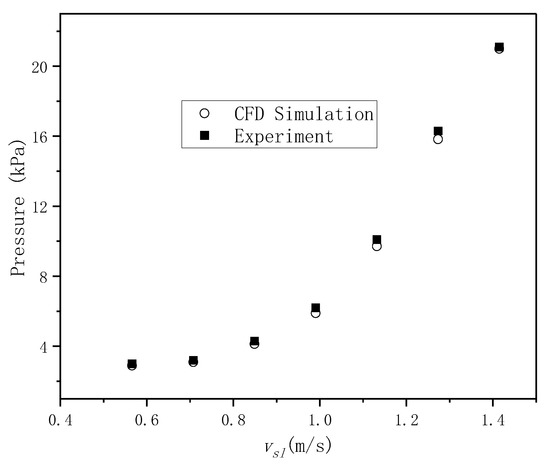
Figure 6.
Effect of superficial liquid velocity on pressure drop in the cyclonic flow pipe.
3. Results and Discussion
3.1. Formation Conditions of Swirling Flow
In a horizontal tubular cyclonic device, the swirling flow may decay to other types of flow patterns as the flow develops downstream. The formation conditions of swirling flow are studied in a length range of z = 8D behind the static swirl element of the cyclonic flow pipe. With the inlet superficial gas velocity of 0.042 m/s and the geometric swirl number of 1.4145, the gas-liquid mixture in the cyclone pipe after the static swirl element shows different states as the superficial liquid velocity increases. As shown in Figure 7, the gas-liquid mixture gradually changes from stratified flow to annular flow as the superficial liquid velocity increases. When the inlet superficial liquid velocity is <0.142 m/s, the flow in the cyclone is stratified. However, the gas-liquid interface is not flat, and there are a few large bubbles at the interface. When the inlet superficial liquid velocity is 0.283 m/s, the annular flow is formed at a very small distance downstream of the static swirl element and then transforms into a stratified flow after a section of transition flow. When the inlet superficial liquid velocity is 0.325 m/s, the length of the annular flow increases, and the gas-liquid interface is very rough. As the flow develops, the annular flow gradually spreads. When the inlet superficial liquid velocity is 0.375 m/s, a more stable annular flow is basically formed. The wave amplitude of the gas-liquid interface is reduced compared with the previous one, and the length that the annular flow could maintain increases significantly. When the inlet superficial liquid velocity is 1.415 m/s, the diameter of the central gas core of the annular flow decreases significantly compared with the previous one. There is a diameter mutation on the gas nucleus, and the gas line after the stationary swirl element is more visible [25]. At larger superficial liquid velocities (e.g., 1.839 m/s), the abrupt change in gas-core diameter shifts forward to the tail of the static swirl element, and a significant distortion of the gas-liquid interface occurs. The interfacial distortion and interfacial wave amplitude increase significantly with the increase of superficial liquid velocity.
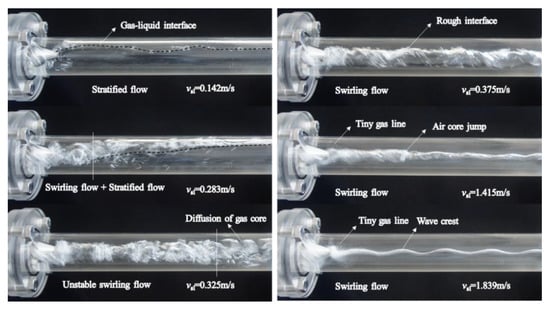
Figure 7.
Gas-liquid distribution patterns in the cyclonic flow pipe at different superficial liquid velocities.
The variation of the gas-liquid distribution pattern with the superficial gas velocity for the inlet superficial liquid velocity of 0.375 m/s and 1.839 m/s is shown in Figure 8. As shown in Figure 8a, a more stable swirling flow can be formed at the inlet superficial liquid velocity of 0.375 m/s. At this time, with the increase of superficial gas velocity, the diameter of the gas core slightly enlarges, and the wave amplitude and distortion of the gas-liquid interface grows. This indicates that the increase in superficial gas velocity is not beneficial to the stability of the central gas core. Figure 8b shows the case where the superficial gas velocity is much larger than the critical velocity for the formation of the swirling flow. It can be seen that with the increase of the superficial gas velocity, the diameter of the gas core increases while the amplitude of the gas-liquid interface decreases. In addition, the increase of the superficial gas velocity causes the sudden change point or jump position of the gas core diameter to move from the end of the static swirl element to the downstream of the flow direction. Comparing the effects of superficial liquid velocity and superficial gas velocity, it can be obtained that the former plays a key role in the formation of rotational flow. The superficial gas velocity mainly affects the wave amplitude of the gas-liquid interface and the fluctuation characteristics of the interface.
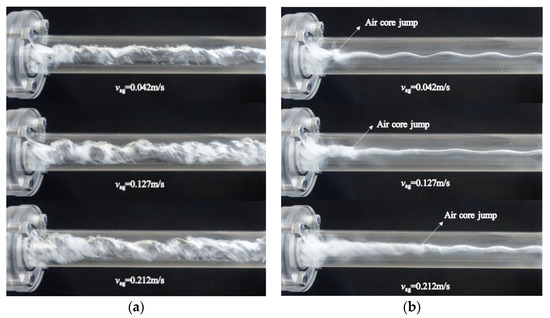
Figure 8.
Gas core morphology with increasing superficial gas velocity in the cyclonic flow pipe. (a) vsl = 0.375 m/s. (b) vsl = 1.839 m/s.
As shown in Figure 9, the superficial gas velocity and superficial liquid velocity are varied at three geometric swirl numbers to obtain the flow pattern boundary inside the cyclonic pipe. Comparing the existing flow pattern maps, it can be found that the pattern boundaries in this paper are more consistent with the results of Rao and Shakutsui [9,10,26,27]. The swirling flow can be formed at very low superficial liquid velocities when the superficial gas velocity is approximately greater than 10 m/s. When the superficial gas velocity is less than 10 m/s, the critical superficial liquid velocity for the formation of swirling flow is almost independent of the superficial gas velocity but is influenced by the geometric swirl number. The critical superficial liquid velocity for the formation of swirling flow gradually decreases as the geometric swirl number rises.
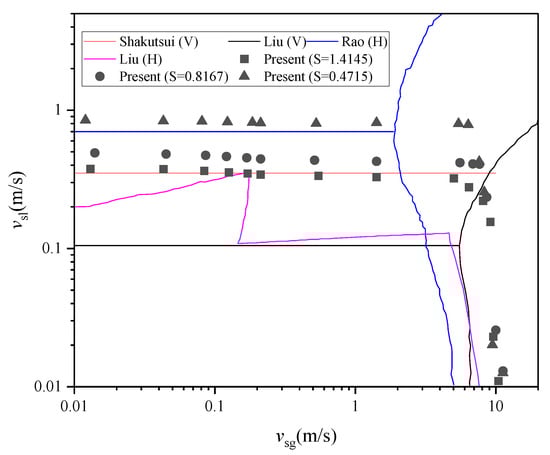
Figure 9.
Comparison of swirling flow boundaries in the cyclone pipe (V is vertical pipe, H is horizontal pipe).
3.2. Rotational Field Decay and Its Effect on Rotational Flow
3.2.1. Decay Law of the Rotational Flow Field
The significant difference between rotational flow and non-rotational flow is the existence of rotational motion in the tangential direction of the swirling flow field. The parameters related to the cyclonic field are the tangential velocity and the swirl number. The swirl number is the ratio of the axial flux of tangential momentum to the axial flux of axial momentum. Here we use the swirl number of the liquid phase to express the swirl intensity of the flow field. It can be calculated by Equation (9),
where ρ is the density, u is the axial velocity, w is the tangential velocity, R is the radius of the pipe, r is the radial distance, and the subscript l represents the liquid phase.
The cyclonic strength and tangential velocity decay in the direction of flow due to the presence of friction [28]. The results show that the decay of the cyclonic intensity is mainly related to the cyclonic generation method and the Reynolds number [29]. For both weak and strong cyclonic flows, the decay of the swirl number can be approximated as an exponential form, as shown in Equation (10) [30,31],
where a is the initial swirl number, b is the decay rate, and x is the dimensionless distance, i.e., the ratio of the distance from the current location to the reference position to the pipe diameter.
The swirl number of flow fields in the cyclone pipe is obtained by numerical simulation when the inlet superficial liquid velocity is 1.13 m/s, and the inlet superficial gas velocity is 0.21 m/s. As shown in Figure 10, the swirl number reaches a maximum value near the exit of the blade of the static swirl element for three geometric swirl numbers. The exponential function can fit the swirl number downstream of z/D > 0 well, and the fitting results show that the decay rate is 0.012~0.021. Murphy’s simulations of the liquid-phase cyclonic field indicate a decay rate from 0.03 to 0.045, which is slightly greater than the results of this study [32]. This is because the blade exit angle used in Murphy’s study is 75°, and the greater the blade exit angle, the greater the decay rate. Reader-Harris’ study shows that the decay rate is about 1.07 times the friction factor, and the decay rate is 0.022 according to the working condition (Re = 56,398) in this study [33]. It can be seen that the results of this study are more consistent with those of Reader-Harris.
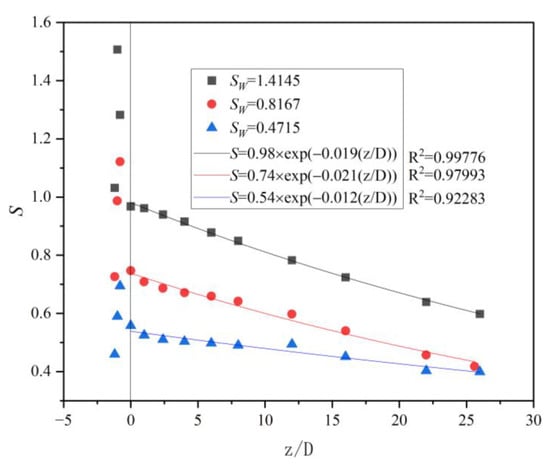
Figure 10.
The variation of swirl number in the axial direction in the cyclonic flow pipe.
3.2.2. Effect of Cyclonic Field Decay on Flow Pattern Transformation
As shown in Figure 11, for the working condition where swirling flow can just be formed initially (e.g., Sw = 1.4145, vsl = 0.318 m/s), swirling flow can be formed within 6D after the static swirl element. The shape of the central gas core is difficult to maintain and tends to be shifted in the tail of the swirling flow (z = 4D~6D). As the flow develops (about z = 6D~9D), the gas core in the center breaks up, and the gas-liquid interface becomes chaotic, forming a transition zone of the flow pattern. Downstream of the transition zone, the ruptured bubbles gradually float upward under the effect of gravity to form a stratified flow.
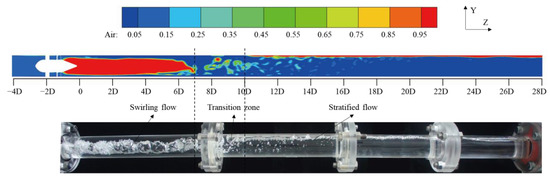
Figure 11.
Evolution of gas-liquid rotational flow to stratified flow in a cyclonic flow pipe.
The variation of the swirl number with axial position is shown in Figure 12, and it can be seen that the swirl number is zero at the position where the inlet fluid is not rotating (z = −3D). The maximum swirl number is reached at the blade exit of the static swirl element (z = −0.8D). Subsequently, the swirl number gradually decays with increasing axial distance. As an example, the decay of the swirl number is explained in detail for a working condition with a geometric swirl number of 1.4145. In the swirling flow region (z = 0~6D), the swirl number is reduced from the maximum value to 0.48. In the flow transition zone and pre-stratified flow (z = 6D~14D), the swirl number gradually decreases from 0.48 to 0.036. In this region, the swirl number is not zero, and no rotational flow is formed. In the middle and late stages of stratified flow (z = 14D~26D), the swirl number is almost zero. The swirl numbers at the tail of the swirling flow are 0.48 and 0.49 for the inlet superficial liquid velocity of 0.318 m/s and 0.4 m/s, respectively. However, when the inlet superficial liquid velocity is 0.6 m/s, the swirl number at the tail of the swirling flow is only 0.16. This suggests that the swirl number or its decay is not the key factor for the shift or transformation of the rotational flow pattern.
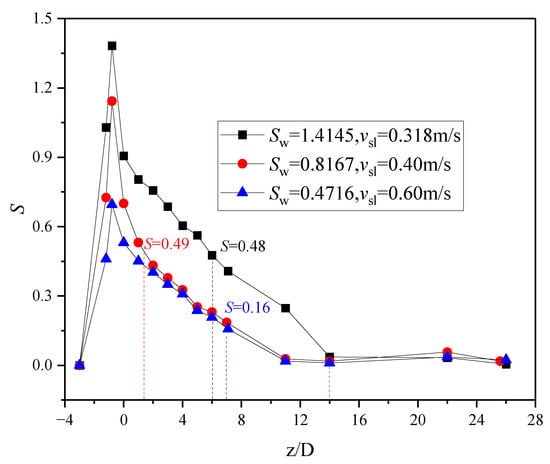
Figure 12.
Variation of swirl number with axial position in the cyclonic flow pipe.
In the swirling flow region, the gas phase volume distribution and the tangential velocity distribution of the liquid phase are shown in Figure 13. It can be seen that the tangential velocity gradually increases from zero and then decreases to zero from the gas core boundary to the inner wall surface of the pipe. It should be noted that the region where the central tangential velocity is zero corresponds to the gas core, and no liquid phase exists. The weak rotational strength and the influence of gravity lead to poor symmetry of the tangential velocity distribution in width and height. The tangential velocity of the tail of the swirling flow is about 0.5 m/s under the three conditions, which indicates that the tangential velocity of the liquid phase can be used as a basis for judging the transformation of the flow pattern.
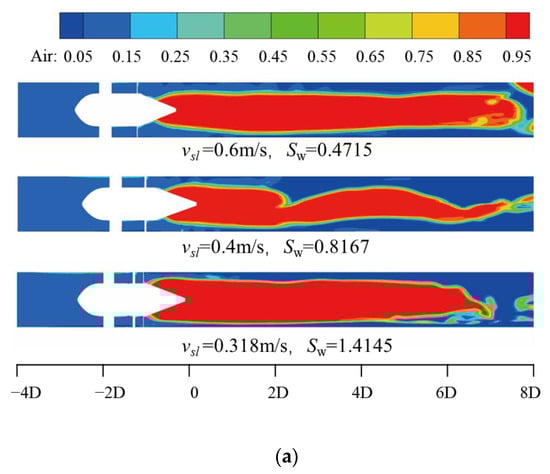
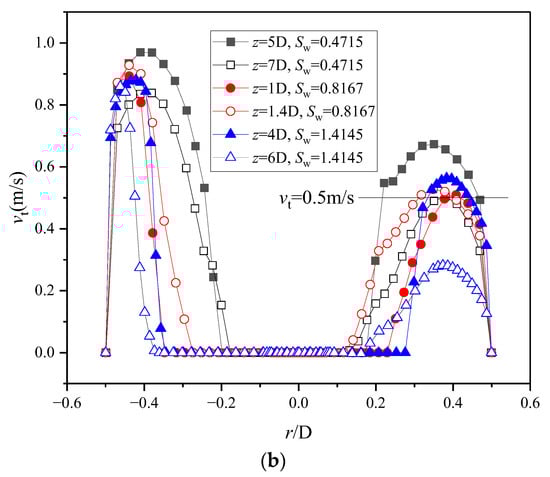
Figure 13.
Distribution of gas-phase volume fraction and liquid-phase tangential velocity in the swirling flow region. (a) Contour map of gas phase volume distribution. (b) Liquid phase tangential velocity distribution at different axial positions.
3.2.3. Effect of Cyclonic Field Decay on the Gas-Liquid Interface
When the cyclonic strength can sustain the swirling flow over long distances, the decay of the flow field in the cyclonic pipe mainly affects the morphology of the gas-liquid interface. The variation of gas core morphology along the axial direction at three geometric swirl numbers for the inlet superficial liquid velocity of 1.13 m/s and the inlet superficial gas velocity of 0.21 m/s is shown in Figure 14. Within the length of the experimental pipeline, the gas core can be divided into four stages, A, B, C, and D, according to its morphology. Stage A is characterized by the presence of gas lines around the central gas core of the swirling flow. Stage B is a smooth gas-core stage featuring a clear and relatively smooth gas-liquid interface with no major fluctuation. Stage C is an unstable gas-core stage, which is marked by a relatively rough and fluctuating gas-liquid interface. Stage D is the diffusion stage of the gas core. At this stage, the gas nucleus is difficult to maintain a cylindrical shape, and the gas-liquid interface is not clear. It can be expected that if the pipe is long enough, a transition zone of flow pattern will appear after stage D. Eventually, the gas core disappears completely, and the flow pattern changes to other kinds of flow patterns.
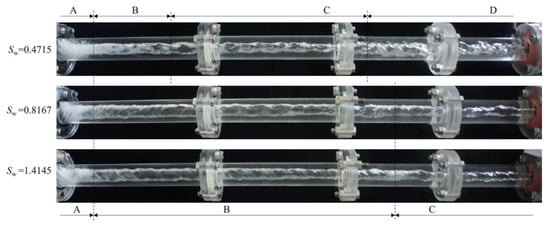
Figure 14.
Variation of gas-liquid morphology along the axial direction in the cyclonic flow pipe.
Based on the morphology and diameter fluctuation range of the central gas core, the lengths of the four stages, A, B, C, and D, are obtained, as shown in Figure 15. Since the main feature of stage A is the accompanying gas line, it cannot be distinguished by the gas core diameter data alone. The gas-liquid interface at stage B is smoother, i.e., the variation of the gas nucleus diameter is smaller, so the range of the smooth zone can be roughly judged by the gas nucleus diameter data. Since the gas-liquid interface in stage B is smoother, the range of the smooth zone can be determined from the gas-core diameter data. In stage C, the gas-liquid interface starts to show larger fluctuation, and the interface is rougher. Instead of decreasing, the diameter of the gas nucleus in stage D increases. In short, stages B, C, and D can be better distinguished by gas-core diameter data, and the interface smooth section is more suitable for gas-liquid separation.
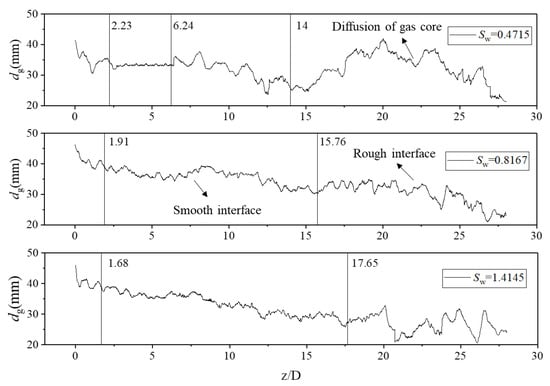
Figure 15.
Diameter distribution of gas core in the axial direction in the pipe.
3.3. Effect of Separation Method on the Gas-Liquid Morphology of Swirling Flow
3.3.1. Gas-Liquid Morphology in Co-Current Gas-Liquid Separator
- (1)
- Effect of flow split on gas-liquid morphology
When the inlet superficial liquid velocity is 1.13 m/s, the inlet superficial gas velocity is 0.21 m/s, and the geometric swirl number is 1.4145, the gas-liquid morphology in the co-current gas-liquid separator with different flow split (FS) is shown in Figure 16. It can be seen that the gas-liquid morphology and gas core diameter are almost constant at FS = 0~0.6. As the FS increases from 0.6 to 0.8, the gas core diameter decreases significantly, and the wavelength at the gas-liquid interface decreases. The gas core diameter is almost equal to the inlet diameter of the gas-phase outlet pipe when FS = 0.84. With further increase of the FS, vortex core breakdown occurs. A similar phenomenon is also observed in the study of Zhang et al. [25]. More bubbles are generated around the breaking point, and the position of the breaking point will gradually move toward the incoming flow. It should be noted that for FS < 0.84, the gas core diameter is larger than the inlet diameter of the gas-phase outlet pipe, and no vortex core breakdown occurs in the separation section. Under this condition, there are almost no liquid droplets present at the gas phase outlet. However, when FS > 0.84, the appearance of the vortex core breaking point could cause more liquid phase to flow out from the gas-phase outlet.
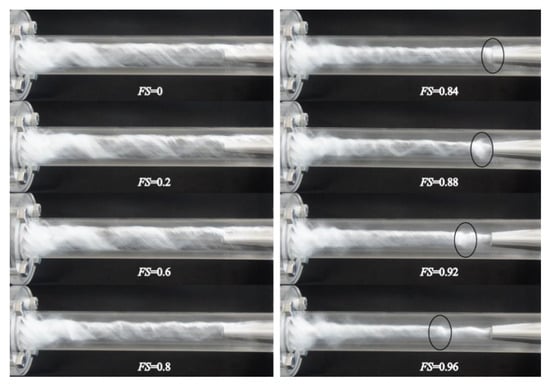
Figure 16.
Changes of gas-liquid morphology in the separation section of the co-current gas-liquid separator under different FS. The location of the black circles in the figure is the vortex core breaking point.
The gas-liquid morphology and the appearance of vortex core breakdown are related to the low-pressure area inside the co-current gas-liquid separator [34,35,36]. The numerical simulation results of the pressure distribution in the separation section with different FS are shown in Figure 17. At FS = 0.5, the low-pressure region (about −12 kPa) has a larger extent, and the boundary does not show abrupt changes. When FS = 0.9, a mutation appears on the boundary of the low-pressure zone near the gas-phase outlet pipe, and the radial size of the low-pressure zone decreases significantly after the mutation point. The abrupt position on the boundary of the low-pressure area gradually moves toward the incoming flow when the FS increases furthermore. The distribution of the low-pressure zone and the changing trend of the boundary mutation points are more consistent with the experimentally observed jump in the gas core diameter.
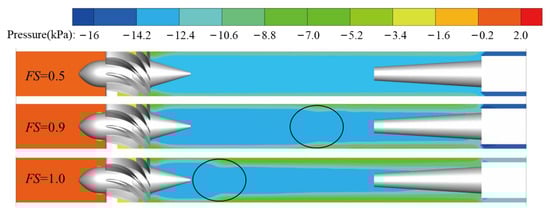
Figure 17.
Pressure distribution in the co-current gas-liquid separator at different FS.
- (2)
- Effect of FS on gas core diameter
The relationship between the diameter of the central gas core of the co-current gas-liquid separator and the FS is shown in Figure 18. It can be seen that the diameter of the gas core just changes slightly with the variation of FS when FS < 0.6. When FS > 0.6, the gas core diameter gradually decreases with the growth of the FS. This is because when the FS is relatively small, the loss of gas phase in the central gas core is not enough to disrupt the balance among the liquid phase force, gas phase force, and interfacial tension at the interface [37]. Once the FS is too large, the loss of the gas phase at the center weakens the force at the gas-phase interface. At this moment, the curvature of the gas-liquid interface needs to be increased to reach a new equilibrium. The increase in the curvature of the interface corresponds to a decrease in the diameter of the gas core. Therefore, the diameter of the gas core reduces gradually with the increment of FS.
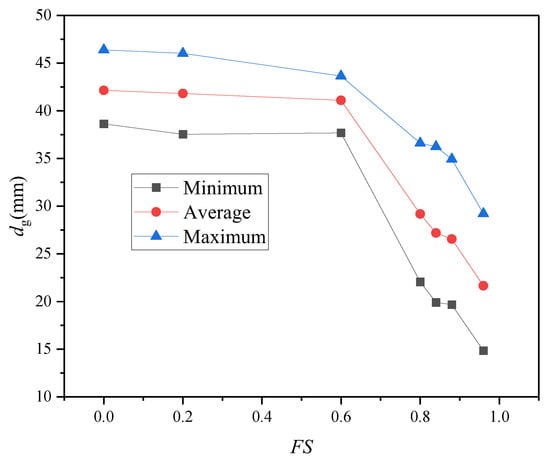
Figure 18.
Relationship between the diameter of the gas core of the co-current gas-liquid separator and the FS.
3.3.2. Gas-Liquid Morphology in the Counter Gas-Liquid Separator
- (1)
- Effect of flow split on gas-liquid morphology
Figure 19 illustrates how the FS affects the shape of the gas core in the counter gas-liquid separator with an inlet superficial liquid velocity of 1.13 m/s, inlet superficial gas velocity of 0.21 m/s, and geometric swirl number of 1.4145. The gas-liquid morphology hardly changes with the variation of the FS when FS < 0.6. At FS = 0.8, vortex core breakdown occurs in the separation section. The morphology of the gas core after the breaking point is a thin spiral shape, which is completely different from the shape of the gas core before the breakdown. In the co-current gas-liquid separator, however, a similar phenomenon does not occur even when the FS is equal to 1. With the further increase of the FS, the vortex core breaking point in the counter gas-liquid separator gradually moves towards the incoming flow direction. Eventually, the vortex core breakup point stays near the gas phase outlet. In other words, the emergence and movement of the vortex core breaking point in the counter gas-liquid separator is similar to that of the co-current gas-liquid separator.
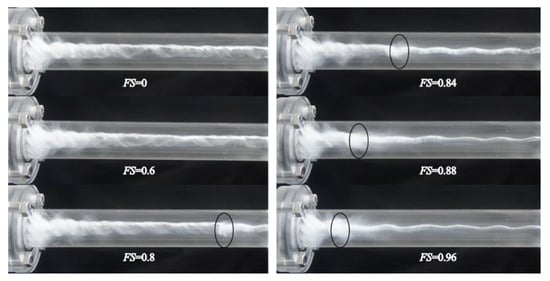
Figure 19.
Variation of gas-liquid morphology in the separation section of counter gas-liquid separator with different FS. The location of the black circles in the figure is the vortex core breaking point.
Compared with the co-current gas-liquid separator, the FS at the point of vortex core breakdown in the counter gas-liquid separator is slightly smaller. The location of the vortex core breaking point is closer to the static swirl element in the counter gas-liquid separator for the same FS. This is because the gas phase flows in the opposite direction to the incoming flow during the counter separation, which accelerates the reflux of the gas phase in the low-pressure region within the separation section. In addition, in the counter gas-liquid separator, a large number of bubbles are generated at the vortex core breaking point near the exit of the static swirl element. This is obviously not beneficial to the complete separation of the gas and liquid phases.
- (2)
- Effect of FS on gas core diameter
In the counter gas-liquid separator, the variation of the central gas core diameter with the FS is shown in Figure 20. The gas core diameter just varies slightly with the FS when FS < 0.6. However, at FS > 0.6, the diameter of the gas core gradually diminishes with the increase of the FS. The reason for the decrease in gas core diameter is related to the pressure equilibrium at the gas-liquid interface and vortex core breakdown. The diameter of the gas core is significantly reduced after the vortex core is broken in the counter gas-liquid separator. The smaller diameter gas core occupies a larger length, which contributes more to the calculation of the average gas core diameter.
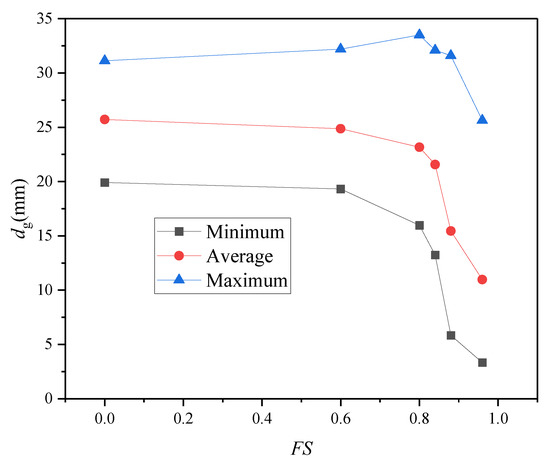
Figure 20.
Relationship between the diameter of the central gas core and the FS.
4. Conclusions
Based on the specifically built visualization experimental system and CFD numerical simulation method, the formation condition of rotational flow and the influence of flow field decay and gas-phase separation method on the gas-liquid morphology are studied. The main findings are as follows,
- (1)
- Experimental methods are used to obtain the critical condition for the formation of swirling flow in horizontal pipe. The formation of rotational flow is determined by the inlet superficial liquid velocity and influenced by the geometric swirl number when the inlet superficial gas velocity is less than 10 m/s. However, for superficial gas velocities greater than 10 m/s, the inlet superficial liquid velocity hardly affects the formation of rotational flow.
- (2)
- The effects of the decay of swirl number and tangential velocity on the gas-liquid flow pattern and interface morphology in the horizontal pipe are investigated. The decay of tangential velocity in the flow field is the key to transforming the rotational flow into a stratified flow when the rotational intensity is small. The decay of the flow field mainly affects the gas-liquid interface at higher rotational intensities.
- (3)
- In both co-current and counter gas-liquid separators, there exists a critical FS value that will cause vortex core breakdown at the center of the rotational flow field. The location of the vortex core breakdown is related to the low-pressure region in the cyclonic field. The diameter of the central gas core remains essentially the same when the FS < 0.6. When the FS > 0.6, the diameter of the gas core gradually reduces with the increment of the FS. The variation of gas core diameter is mainly related to the pressure distribution and vortex core breakdown of the cyclonic field in the separation section.
Author Contributions
Conceptualization, C.S.; Methodology, L.K. and Y.J.; Validation, J.L.; Writing—original draft, Q.W.; Writing—review & editing, G.D.; Supervision, J.C.; Project administration, M.Z. and C.W. All authors have read and agreed to the published version of the manuscript.
Funding
This research was funded by the National Science and Technology Major Project (No. 2017ZX05032005-002), the National Natural Science Foundation of China (No. 51806019, No. 52274059).
Data Availability Statement
Not applicable.
Conflicts of Interest
The authors declare no conflict of interest.
References
- Sines, J.N.; Straiton, B.J.; Zuccarelli, C.E.; Marashdeh, Q.M.; Teixeira, F.L.; Fan, L.-S.; Motil, B.J. Study of Gas-Water Flow Inside of a Horizontal Passive Cyclonic Gas-Liquid Phase Separator System Using Displacement-Current Phase Tomography. Gravit. Space Res. 2018, 6, 28–43. [Google Scholar] [CrossRef]
- Yin, J.; Qian, Y.; Zhang, T.; Wang, D. Measurement on the Flow Structure of a Gas-Liquid Separator Applied in TMSR. Ann. Nucl. Energy 2019, 126, 20–32. [Google Scholar] [CrossRef]
- Liu, S.; Yang, L.-L.; Zhang, D.; Xu, J.-Y. Separation Characteristics of the Gas and Liquid Phases in a Vane-Type Swirling Flow Field. Int. J. Multiph. Flow 2018, 107, 131–145. [Google Scholar] [CrossRef]
- Høydal, J.; Kristiansen, O.; Eikrem, G.O.; Fjalestad, K. Method and System for Fluid Separation with an Integrated Control System. US20150290560A1, 28 February 2018. Available online: https://patents.google.com/patent/US20150290560A1/en (accessed on 30 June 2023).
- Krishna, V.; Sripriya, R.; Kumar, V.; Chakraborty, S.; Meikap, B.C. Identification and Prediction of Air Core Diameter in a Hydrocyclone by a Novel Online Sensor Based on Digital Signal Processing Technique. Chem. Eng. Process. Process Intensif. 2010, 49, 165–176. [Google Scholar] [CrossRef]
- Nieuwstadt, F.T.M.; Dirkzwager, M. A Fluid Mechanics Model for an Axial Cyclone Separator. Ind. Eng. Chem. Res. 1995, 34, 3399–3404. [Google Scholar] [CrossRef]
- Wang, S.L.; Rao, Y.C.; Wu, Y.X.; Zhou, S.D.; Sun, L. Experimental Study on Gas-Liquid Spiral Flow Generated by Twist Tape. Chin. J. Hydrodyn. Ser. A 2013, 28, 105–110. [Google Scholar]
- Liu, W.; Bai, B. Transition from Bubble Flow to Slug Flow along the Streamwise Direction in a Gas–Liquid Swirling Flow. Chem. Eng. Sci. 2019, 202, 392–402. [Google Scholar] [CrossRef]
- Liu, L.; Bai, B. Flow Regime Identification of Swirling Gas-Liquid Flow with Image Processing Technique and Neural Networks. Chem. Eng. Sci. 2019, 199, 588–601. [Google Scholar] [CrossRef]
- Liu, S.; Liu, L.; Zhang, J.; Gu, H. Experimental Study on Flow Patterns of Decaying Swirling Gas-Liquid Flow in a Horizontal Pipe. In Volume 3: Student Paper Competition—Thermal-Hydraulics: Verification and Validation, Proceedings of the 2020 International Conference on Nuclear Engineering Collocated with the ASME 2020 Power Conference, Virtual, Online, 4–5 August 2020; American Society of Mechanical Engineers: New York, NY, USA, 2020. [Google Scholar]
- Wang, G.; Yan, C.; Fan, G.; Wang, J.; Xu, J.; Zeng, X.; Liu, A. Experimental Study on a Swirl-Vane Separator for Gas–Liquid Separation. Chem. Eng. Res. Des. 2019, 151, 108–119. [Google Scholar] [CrossRef]
- Hoffmann, A.C.; de Jonge, R.; Arends, H.; Hanrats, C. Evidence of the ‘Natural Vortex Length’ and Its Effect on the Separation Efficiency of Gas Cyclones. Filtr. Sep. 1995, 32, 799–804. [Google Scholar] [CrossRef]
- Qian, F.; Zhang, M. Study of the Natural Vortex Length of a Cyclone with Response Surface Methodology. Comput. Chem. Eng. 2005, 29, 2155–2162. [Google Scholar] [CrossRef]
- Concha, F.; Barrientos, A.; Montero, J.; Sampaio, R. Air Core and Roping in Hydrocyclones. Int. J. Min. Process. 1996, 44–45, 743–749. [Google Scholar] [CrossRef]
- Davidson, M.R. An Adaptive Method of Predicting the Air Core Diameter for Numerical Models of Hydrocyclone Flow. Int. J. Min. Process. 1995, 43, 167–177. [Google Scholar] [CrossRef]
- Steffens, P.R.; Whiten, W.J.; Appleby, S.; Hitchins, J. Prediction of Air Core Diameters for Hydrocyclones. Int. J. Min. Process. 1993, 39, 61–74. [Google Scholar] [CrossRef]
- Neesse, T.; Dueck, J. Air Core Formation in the Hydrocyclone. Min. Eng. 2007, 20, 349–354. [Google Scholar] [CrossRef]
- Yin, J.; Qian, Y.; Ma, Y.; Wang, D. Experimental Study on the Bubble Trajectory in an Axial Gas-Liquid Separator Applied for Tritium Removal for Molten Salt Reactors. Nucl. Eng. Des. 2017, 320, 133–140. [Google Scholar] [CrossRef]
- Stevenson, P.; Sederman, A.J.; Mantle, M.D.; Li, X.; Gladden, L.F. Measurement of Bubble Size Distribution in a Gas–Liquid Foam Using Pulsed-Field Gradient Nuclear Magnetic Resonance. J. Colloid Interface Sci. 2010, 352, 114–120. [Google Scholar] [CrossRef] [PubMed]
- Ansys Fluent 2020 R1-Theory Guide. Available online: https://forum.ansys.com/forums/topic/ansys-fluent-2020-r1-theory-guide-user-guide-full-pdf/ (accessed on 30 June 2023).
- Chen, G.; Wang, Q.; He, S. Assessment of an Eulerian Multi-Fluid VOF Model for Simulation of Multiphase Flow in an Industrial Ruhrstahl-Heraeus Degasser. Metall. Res. Technol. 2019, 116, 617. [Google Scholar] [CrossRef]
- Zahedi, P.; Zhang, J.; Arabnejad, H.; McLaury, B.S.; Shirazi, S.A. CFD Simulation of Multiphase Flows and Erosion Predictions under Annular Flow and Low Liquid Loading Conditions. Wear 2017, 376–377, 1260–1270. [Google Scholar] [CrossRef]
- Parsi, M.; Agrawal, M.; Srinivasan, V.; Vieira, R.E.; Torres, C.F.; McLaury, B.S.; Shirazi, S.A.; Schleicher, E.; Hampel, U. Assessment of a Hybrid CFD Model for Simulation of Complex Vertical Upward Gas-Liquid Churn Flow. Chem. Eng. Res. Des. 2016, 105, 71–84. [Google Scholar] [CrossRef]
- Akhlaghi, M.; Mohammadi, V.; Nouri, N.M.; Taherkhani, M.; Karimi, M. Multi-Fluid VoF Model Assessment to Simulate the Horizontal Air–Water Intermittent Flow. Chem. Eng. Res. Des. 2019, 152, 48–59. [Google Scholar] [CrossRef]
- Tianxing, Z.; Khezzar, L.; AlShehhi, M.; Xia, Y.; Hardalupas, Y. Experimental Investigation of Air–Water Turbulent Swirling Flow of Relevance to Phase Separation Equipment. Int. J. Multiph. Flow 2019, 121, 103110. [Google Scholar] [CrossRef]
- Shakutsui, H.; Hayashi, K.; Suzuki, T. Flow Patterns of Gas-Liquid Two-Phase Swirling Flow in a Vertical Pipe. Jpn. J. Multiph. Flow 2010, 24, 305–312. [Google Scholar] [CrossRef]
- Rao, Y.; Liu, Z.; Wang, S.; Li, L. Numerical Simulation on the Flow Pattern of a Gas–Liquid Two-Phase Swirl Flow. ACS Omega 2022, 7, 2679–2689. [Google Scholar] [CrossRef] [PubMed]
- Sheen, H.J.; Chen, W.J.; Jeng, S.Y.; Huang, T.L. Correlation of Swirl Number for a Radial-Type Swirl Generator. Exp. Fluid Sci. 1996, 12, 444–451. [Google Scholar] [CrossRef]
- Li, H.; Tomita, Y. Characteristics of Swirling Flow in a Circular Pipe. J. Fluids Eng. 1994, 116, 370–373. [Google Scholar] [CrossRef]
- Kitoh, O. Experimental Study of Turbulent Swirling Flow in a Straight Pipe. J. Fluid Mech. 1991, 225, 445–479. [Google Scholar] [CrossRef]
- Steenbergen, W.; Voskamp, J. The Rate of Decay of Swirl in Turbulent Pipe Flow. Flow Meas. Instrum. 1998, 9, 67–78. [Google Scholar] [CrossRef]
- Murphy, S.; Delfos, R.; Pourquié, M.J.B.M.; Olujić, Ž.; Jansens, P.J.; Nieuwstadt, F.T.M. Prediction of Strongly Swirling Flow within an Axial Hydrocyclone Using Two Commercial CFD Codes. Chem. Eng. Sci. 2007, 62, 1619–1635. [Google Scholar] [CrossRef]
- Reader-Harris, M.J. The Decay of Swirl in a Pipe. Int. J. Heat Fluid Flow 1994, 15, 212–217. [Google Scholar] [CrossRef]
- Lucca-Negro, O.; O’Doherty, T. Vortex Breakdown: A Review. Prog. Energy Combust. Sci. 2001, 27, 431–481. [Google Scholar] [CrossRef]
- Jochmann, P.; Sinigersky, A.; Hehle, M.; Schäfer, O.; Koch, R.; Bauer, H.-J. Numerical Simulation of a Precessing Vortex Breakdown. Int. J. Heat Fluid Flow 2006, 27, 192–203. [Google Scholar] [CrossRef]
- Syred, N. A Review of Oscillation Mechanisms and the Role of the Precessing Vortex Core (PVC) in Swirl Combustion Systems. Prog. Energy Combust. Sci. 2006, 32, 93–161. [Google Scholar]
- Gomez, E.L. Dispersed Two-Phase Swirling Flow Characterization for Predicting Gas Carry-under in Gas-Liquid Cylindrical Cyclone Compact Separators. Ph.D. Thesis, The University of Tulsa, Tulsa, OK, USA, 2001. [Google Scholar]


Disclaimer/Publisher’s Note: The statements, opinions and data contained in all publications are solely those of the individual author(s) and contributor(s) and not of MDPI and/or the editor(s). MDPI and/or the editor(s) disclaim responsibility for any injury to people or property resulting from any ideas, methods, instructions or products referred to in the content. |
© 2023 by the authors. Licensee MDPI, Basel, Switzerland. This article is an open access article distributed under the terms and conditions of the Creative Commons Attribution (CC BY) license (https://creativecommons.org/licenses/by/4.0/).