Article

A Gas Prominence Prediction Model Based on Entropy-Weighted Gray Correlation and MCMC-ISSA-SVM

1
Liaoning Institute of Science and Engineering, Jinzhou 121000, China
2
College of Business Administration, Liaoning Technical University, Huludao 125105, China
*
Author to whom correspondence should be addressed.
Processes 2023, 11(7), 2098; https://doi.org/10.3390/pr11072098
Submission received: 22 March 2023 / Revised: 15 June 2023 / Accepted: 20 June 2023 / Published: 13 July 2023

Abstract

:
To improve the accuracy of coal and gas prominence prediction, an improved sparrow search algorithm (ISSA) and an optimized support vector machine (SVM) based on the Markov chain Monte Carlo (MCMC) filling algorithm prediction model were proposed. The mean value of the data after filling in the missing values in the coal and gas prominence data using the MCMC filling algorithm was 2.282, with a standard deviation of 0.193. Compared with the mean fill method (Mean), random forest filling method (random forest, RF), and K-nearest neighbor filling method (K-nearest neighbor, KNN), the MCMC filling algorithm showed the best results. The parameter indicators of the salient data were ranked by entropy-weighted gray correlation analysis, and the salient prediction experiments were divided into four groups with different numbers of parameter indicators according to the entropy-weighted gray correlation. The best results were obtained in the fourth group, with a maximum relative error (maximum relative error, REmax) of 0.500, an average relative error (average relative error, MRE) of 0.042, a root mean square error (root mean square error, RMSE) of 0.144, and a coefficient of determination (coefficient of determination, R2) of 0.993. The best predicted parameters were the initial velocity of gas dispersion (X2), gas content (X4), K1 gas desorption (X5), and drill chip volume (X6). To improve the sparrow search algorithm (sparrow search algorithm, SSA), the adaptive t-distribution variation operator was introduced to obtain ISSA, and the prediction models of improved sparrow search algorithm optimized support vector machine based on Markov chain Monte Carlo filling algorithm (MCMC-ISSA-SVM), sparrow search algorithm optimized support vector machine based on Markov chain Monte Carlo filling algorithm (MCMC-SSA-SVM), genetic algorithm optimized support vector machine based on Markov chain Monte Carlo filling algorithm (MCMC-GA-SVM) and particle swarm optimization algorithm optimized support vector machine based on Markov chain Monte Carlo filling algorithm (MCMC- PSO -SVM) were established for coal and gas prominence prediction using the ISSA, SSA, genetic algorithm (genetic algorithm, GA) and particle swarm optimization algorithm (particle swarm optimization, PSO) respectively. Comparing the prediction experimental results of each model, the prediction accuracy of MCMC-ISSA-SVM is 98.25%, the error is 0.018, the convergence speed is the fastest, the number of iterations is the least, and the best fitness and the average fitness are the highest among the four models. All the prediction results of MCMC-ISSA-SVM are significantly better than the other three models, which indicates that the algorithm improvement is effective. ISSA outperformed SSA, PSO, and GA, and the MCMC-ISSA-SVM model was able to significantly improve the prediction accuracy and effectively enhance the generalization ability.

1. Introduction

With the rapid development of industrial information and intelligence [1], coal output and consumption are growing day by day, and mining efforts are subsequently increasing, making coal mine safety accidents frequent. Coal and gas protrusion is one of the most destructive hazards in coal mining, and the extent of the damage is not to be underestimated [2], which not only leads to casualties and affects the effective and safe production of the coal mining industry but also causes huge losses to the national economy. Therefore, the use of effective methods for predicting the risk of coal and gas protrusion not only provides the basis for the continued development of the coal industry but also provides some guidance for the safe production of coal mines.
Lu Yiyu et al. [3] developed a multifunctional physical simulation test system based on deep coal rock engineering and geological conditions to improve the accuracy of coal and gas protrusion prediction. The geological background of the coal seam environment generally includes four aspects: ground stress, geological and tectonic conditions, media structure, and gas, which are described in turn.
Ground stress is a contributing factor to the occurrence of coal and gas protrusions. The effect of ground stress is related to the magnitude of the ground stress; the greater the ground stress in the coal mining process, the greater the likelihood of coal and gas protrusion [4].
Geological and tectonic conditions are unstable due to the movement of the earth, and when the surrounding coal rock is affected, the equilibrium is disturbed, which has a direct impact on the coal seam and changes the state of the gas [5]. Geological and tectonic conditions are one of the most important factors in the occurrence of coal and gas protrusions.
The structure of the coal body is a manifestation of geological changes. The original form of the coal body can be broken by geological activity [6], and its original internal structure can be destroyed, reducing the strength of the coal body. The more severely the media structure is damaged, the more likely it is that coal and gas protrusions will occur.
Gas is present in coal seams. It is an essential factor in coal and gas protrusion. Conditions such as gas content and gas pressure are important factors in the occurrence of coal and gas protrusions; the higher the gas content and gas pressure, the greater the risk of coal and gas protrusions [7].
Scholars at home and abroad have carried out a lot of research work on coal and gas prominence [8,9,10], and based on this, some new prediction methods have been proposed. Research on the prediction of coal and gas prominence was first conducted using the static prediction method. Yuan Liang [11] et al. developed a coal and gas prominence simulation test system based on a comprehensive hypothesis, which improved the accuracy and repeatability of the prediction. Lei Yang [12] explored the mechanism of coal and gas protrusion and conducted experiments on coal and gas protrusion by constructing numerical models. Gui Fu [13,14] et al. analyzed the influencing factors of protrusion through coal and gas protrusion accidents and proposed methods to predict protrusion and prevent accidents. The dynamic forecasting method was later applied to coal and gas protrusions. Xueqiu He et al. [15] proposed a prominent dynamic real-time monitoring and early warning technique by dynamically and continuously monitoring electromagnetic radiation and other data to mine its relationship with prominent omens. Jupeng Tang et al. [16] for coal and gas protrusion power hazard prediction by acoustic emission monitoring technique; for improving the accuracy of protrusion prediction. Junhui Mou [17] analyzed the law of coal and gas prominence in coal mines and proposed a new method of sensitivity of prominence prediction index to monitor the dynamic phenomenon of coal mine outbursts. Xusheng Zhao [18] established an online integrated system and database for coal and gas prominence prediction based on characteristics such as gas and geological conditions to achieve real-time prediction of coal and gas prominence. In recent years, machine learning prediction methods have been applied to coal and gas protrusions. Baohe Zhu [19] identified the main influencing factors of prominence based on the combined action hypothesis and used a non-linear support vector machine prediction method to accurately predict whether coal and gas prominence would occur. Yuhong Wang [20] used gray correlation analysis to screen coal and gas prominence influencing factors for dimensionality reduction and established particle swarm optimization algorithms based on sub-dimensional evolution and quantum gate node neural network models for prediction experiments. Kai Wang [21,22] et al. explored the mechanism of coal and gas protrusion, analyzed typical cases, and used big data and deep learning techniques to achieve coal and gas protrusion prediction. Wang Wei [23] constructed a prediction model after determining the subjective and objective weights of the predictors and conducting experiments on hazard prediction in mines. Yaqin Wu [24] developed an improved genetic simulated annealing algorithm (genetic simulated annealing algorithm, GASA) and optimized back propagation (back propagation, BP) neural network algorithm prediction model and used the model for coal and gas prominence prediction to improve the prediction speed.
The data was collected using the Mining Engineering Collaborative Big Data Cloud Platform system. Analysis of the data revealed that there were missing values and that prediction models that did not account for missing data would compromise the accuracy of the model predictions. Accordingly, the use of the Markov chain Monte Carlo algorithm (MCMC) is proposed to fill in the missing values in the coal and gas prominence dataset in order to expand the valid dataset. Entropy-weighted gray correlation analysis was performed on the complete data set after filling. The entropy-weighted gray correlation for each indicator was calculated, ranked according to its magnitude, and divided into four groups of experiments with different numbers of indicator parameters. The data from each group of experiments was input into a support vector machine (SVM) model for prediction. The best predictor parameters were identified through screening. To prevent the sparrow search algorithm (SSA) from falling into local optimality, an adaptive t-distribution adaptive operator was introduced to improve the SSA, and the parameters of the SVM were optimized with the improved sparrow search algorithm (ISSA). The model of an improved sparrow search algorithm optimized support vector machine based on the Markov chain Monte Carlo filling algorithm (MCMC-ISSA-SVM) was established to improve the coal and gas prominence prediction capability, and its prediction results were compared with those of other models in order to verify the model’s performance. The main methods used are literature research, numerical simulation, and comparative experimental methods.

2. Data Collection and MCMC Fills in the Missing Data

A coal mine in Shanxi Province, China, is a high-concentration gas mine, and coal and gas protrusions occur frequently during the construction of this mine. Data on coal and gas prominence was collected using the Mining Engineering Collaborative Big Data Cloud Platform system to monitor the 405 and 406 excavation faces in the No. 3 mineable coal seam of this coal mine. The parameter indicators and data sets obtained are shown in Table 1.
The dataset contains one category label, prominence hazard (X10), and nine parameter indicators, namely coal damage type (X1), initial rate of gas dispersion (X2), coal robustness factor (X3), gas content (X4, m3/t), K1 gas desorption (X5, m L / ( g m i n 0.5 ) ), drill chip volume (X6, kg/m), burial depth (X7, m), coal thickness (X8, m), and distance from tectonic zone (X9, m), where X8 and X9 data are missing and need to be filled in so as not to affect the prediction.
MCMC is a chain-multiple-filling algorithm. MCMC can effectively analyze the variation of all parameters in a mathematical model and is suitable for more complex mathematical models [25]. The data collected belonged to a multivariate arbitrary missing pattern, a machine missing mechanism, and the number of missing items was less than 30%, for which the accuracy of using MCMC was higher than other methods such as the mean fill method. For better validation, the datasets were filled one by one using the mean fill method (Mean), random forest filling method (random forest, RF), and K-nearest neighbor filling method (K-nearest neighbor, KNN), and the results were compared. The mean and standard deviation corresponding to the different filling methods are shown in Figure 1.

3. Entropy-Weighted Gray Correlation Analysis

Steps in entropy-weighted gray correlation analysis.
(1)
There are n evaluation objects and m evaluation indicators, and the evaluation matrix is R.
R = ( X 1 , X 2 , , X n ) = x 1 ( 1 ) x 2 ( 1 ) x n ( 1 ) x 1 ( 2 ) x 2 ( 2 ) x n ( 2 ) x 1 ( m ) x 2 ( m ) x n ( m ) X i = ( x i ( 1 ) x i ( 2 ) x i ( m ) T i = 1 , 2 ,   , n
(2)
Determining the reference series.
R 0 = x 0 ( 1 ) , x 0 ( 2 ) , , x 0 ( m )
(3)
The dimensionless processing of the filled data gives the following matrix.
R = ( X 1 , X 2 , , X n ) = x 1 ( 1 ) x 2 ( 1 ) x n ( 1 ) x 1 ( 2 ) x 2 ( 2 ) x n ( 2 ) x 1 ( m ) x 2 ( m ) x n ( m )
(4)
Calculate the absolute difference between the elements corresponding to the comparison sequence and the reference sequence. i = 1 , 2 , n ,   j = 1 , 2 , m .
x 0 ( j ) x i ( j )
(5)
Determining the maximum and minimum difference.
max i = 1 n max j = 1 m x 0 ( j ) x i ( j )
min i = 1 n min j = 1 m x 0 ( j ) x i ( j )
(6)
To determine the degree of association between the comparison series and the reference series, the gray correlation coefficient is calculated. ρ is the resolution factor and takes values in the range [0, 1].
ε i ( j ) = min i = 1 n   min j = 1 m x 0 ( j ) x i ( j ) + ρ · max i = 1 n max j = 1 m x 0 ( j ) x i ( j ) x 0 ( j ) x i ( j ) + ρ · max i = 1 n max j = 1 m x 0 ( j ) x i ( j )
(7)
Pij is the weight of the characteristics of the jth evaluation object under the ith evaluation indicator, called the contribution degree.
P i j = x i j i = 1 n x i j
(8)
ej is the total contribution of the jth indicator, called the entropy value.
e j = 1 ln n i = 1 n P i j ln P i j
(9)
ω j is the entropy weight of the jth indicator; calculate the entropy weight.
ω j = 1 e j j = 1 m 1 e j
(10)
Calculating the entropy-weighted gray correlation. The entropy-weighted gray correlation was calculated, and the results are shown in Table 2.
r i = 1 m j = 1 m ω j · ε i ( j )
Table 2. Entropy-weighted gray correlation results.
IndicatorsX1X2X3X4X5X6X7X8X9
ri0.0100.0160.0090.0170.0150.0130.0110.0110.012
sort829134675
The higher the ri value, the greater the correlation between this parameter indicator and the risk of protrusion, and the greater the role it plays in the coal and gas protrusion process. It should therefore be given priority when conducting prominence prediction experiments.

4. Building MCMC-ISSA-SVM Prediction Model

4.1. Sparrow Search Algorithm

The sparrow search algorithm (SSA) is a new swarm intelligence algorithm [26,27]. It has been demonstrated that SSA requires fewer parameters, is stable, and has excellent global search capability and fast convergence. It has a wide range of application prospects due to its advantages [28,29,30,31,32].
The matrix of the set of sparrows with population size n and spatial dimension d.
X i = X i , 1 , X i , 2 , , X i , d , i 1 , n
Corresponding matrix of fitness values.
F x = f x 1 , f x 2 f x n T
f(xi) indicates the individual fitness value. The primary goal of the discoverer is to explore new spaces randomly in search of food, and the discoverer’s location is updated by the following formula.
X i , j r + 1 X i , j r exp i α r max , R 2 < S T X i , j r + Q L , R 2 S T
r represents the current number of iterations, j [ 1 , d ] , rmax represents the maximum number of iterations, Xi,j represents the position of the ith sparrow in the jth dimension, α is a random number taking values in the range (0, 1]. R2 is the warning value and takes values in the range [0, 1]. ST stands for safety value and takes values in the range [0.5, 1]. Q is a random number that follows a normal distribution. L is a 1 × d row matrix.
The joiner will follow the finder and keep fighting for food with him. The location of the joiner is updated as follows:
X i , j r + 1 Q exp X w o r s t , j r X i , j r i 2 , i < n / 2 X p r + 1 + X i , j r X p r + 1 + A + L , i n / 2
X w o r s t , j r represents currently in the worst position. X p r + 1 represents the current best position of the discoverer. A is a 1 × d row matrix that takes the value 1 or −1.
A + = A T A A T 1
When the population is foraging, the lower-adapted joiners are not grabbing food and need to fly close to the best locations to get food, usually with 10% to 20% of the sparrows acting as vigilantes. The position of the vigilantes is updated according to the following formula.
X i , j r + 1 X b e s t , j r + β X i , j r X b e s t , j r , f i > f b X i , j r + K X i , j r X w o r s t , j r f i f w o r s t + ε , f i = f b
X b e s t , j r represents current best position. β represents a random number that follows a standard normal distribution. fworst represents the worst adaptation of the population. K is a random number of [−1, 1]. ε is a very small constant value.

4.2. Improved Sparrow Search Algorithm

The population diversity of the sparrow search algorithm will be greatly reduced in the later stage, which will lead the sparrow search algorithm to fall into local convergence easily, and the convergence speed of the sparrow search algorithm will also be reduced, resulting in a poor merit-seeking effect. To improve the SSA algorithm’s tendency to fall into local convergence, slow convergence speed, and low accuracy, the adaptive t-distribution variation operator was introduced to enhance the diversity of the sparrow population in order to improve the algorithm’s search optimization capability and convergence speed [33].
The probability density function for the distribution of t is given in Equation (18).
f ( x ) = Γ ( n + 1 2 ) Γ ( n 2 ) n π ( 1 + x 2 n ) n + 1 2 , x ( , + )
Γ (n + 1/2) denotes the second type of Euler integral, and n denotes the t-distribution degree of freedom. The sparrow positions were updated according to Equation (19) after
adding the t-distribution variance operator.
X i , j r = X i , j r + λ t ( r ) X i , j r
r denotes the number of iterations. rmax denotes the maximum number of iterations. X i , j r represents the current position of the i-th sparrow. X i , j r represents the position of the ith sparrow after t-distribution variation. λ is the variance control factor and takes values in the range [0, 1].
λ = 1 r r max 1
λt(r) is the variation operator that enhances the diversity of the sparrow population and improves the algorithm’s local optimization- seeking ability.
The specific variation strategy is as follows: first generate a random number between [0, 1], called rand, then define the variation probability formula. 20 is the number of sparrow populations.
p = ( 1 r r max ) 20 + 0 . 05
Finally, the judgment condition is determined; when p > rand, the variation operation is performed on the updated optimal sparrow position; otherwise, no variation is performed. To improve the efficiency of the algorithm, the formula for updating the position of the vigilantes is improved.
X i , j r + 1 X b e s t , j r + β X i , j r X b e s t , j r , f i > f b X i , j r + β ( X w o r s t , j r X b e s t , j r ) , f i = f b
The specific steps for building the MCMC-ISSA-SVM prediction model are as follows: The main flow of building the MCMC-ISSA-SVM model is shown in Figure 2.
Step 1: Import the collected raw coal and gas prominence data and fill in the missing data using the MCMC algorithm to finally obtain a complete dataset with good results.
Step 2: Determine the model inputs and outputs based on the filled data set. Identify each parameter indicator as a salient predictive feature and salient hazards as category labels. The predictive features and category labels are used as input values to the model. Determine the predicted salient hazard category and prediction accuracy as the output values of the model. Consistency and standardization of the data using the corresponding methods based on the indicator characteristics.
Step 3: Select a training set and a test set for the prominent prediction experiment. A portion of the data is selected to form the training set to train the model, and the remaining portion forms the test set to test the predictive effectiveness of the model.
Step 4: Initialize the SVM penalty parameter c, the kernel function parameter g, and the relevant parameters of the MCMC-ISSA-SVM model. Set the sparrow population size to 20, the maximum number of iterations to 100, the proportion of discoverers to 70%, the proportion of followers to 30%, the proportion of vigilantes to 20%, and the safety value ST to 0.6.
Step 5: Classification of training samples using cross-validation. The number of cross-validation folds is set to 5, and the cross-validation recognition accuracy of the SVM coal and gas prominence type is used as the fitness value of the individual sparrow. The optimal fitness value and location information are retained.
Step 6: Rank the fitness of all individuals in the sparrow population. Individuals with higher fitness levels are considered discoverers, and the remaining sparrows are considered followers.
Step 7: Update finder locations according to Equation (14). Sparrows can search extensively when they are in a safe state. If the warning value is greater than the safety value, the sparrow population will fly to a safe space to forage.
Step 8: Update the follower positions according to Equation (15). According to the ranking principle, when i > n/2, the individual fitness value is low, and these followers need to search for other locations to improve their individual fitness.
Step 9: Update the position of vigilantes aware of danger according to Equation (22). Sparrows at the periphery of the population will move closer to the safe area. Sparrows at the center of the population will walk randomly to get closer to other sparrows. The fitness value of this iteration is compared with the current best fitness value, and the global optimal sparrow position is updated.
Step 10: Compare the magnitude of the variation probability p and the random number rand. When the value of the variation probability p is greater than the random number rand, a t-distribution variation operation is performed on the updated optimal sparrow position. Conversely, the variation condition is not satisfied.
Step 11: If mutation occurs, calculate the adaptation values for the sparrow population before and after mutation and compare the two. If no mutation occurs, the fitness value of the new position of the individual sparrow is calculated, and the updated sparrow fitness value is compared with the original optimal sparrow fitness value. Eventually, the sparrow with the better fitness value is selected as the current sparrow location based on whether or not there is variation, and the global optimum information is updated.
Step 12: Determine whether the number of iterations satisfies the termination condition. If the condition is not satisfied, the number of iterations is increased by 1 and then returned to step 6. If the termination condition is satisfied, the iteration is stopped, and the optimal combination of parameters c and g is directly output. The MCMC-ISSA-SVM model is built, and the test set samples are input to the model. The final output is the result of the coal and gas prominence prediction.

5. Coal and Gas Prominence Prediction

5.1. Conduct Group Experiments to Select the Best Parameter Indicators

The entropy-weighted gray correlation analysis method was used on the coal and gas prominence dataset to screen parameter indicators for the coal and gas prominence prediction experiment. Different influencing factors were selected as parameter indicators for the coal and gas prominence prediction experiment according to the ranking of the entropy-weighted gray correlation. The greater the entropy-weighted gray correlation, the fewer parameter indicators are included. The experiment was divided into four groups, and the groupings are shown in Table 3.
Different experimental results can be obtained by inputting different parameter index data into the MCMC-SVM prediction model. Coal and gas prominence predictions were made for each group of experimental data separately, and a comparison of the predicted and actual values of coal and gas prominence is shown in Figure 3.
There were six, four, two, and one outlier sample point in the results of the four sets of experiments. Group 4 experiments had the highest number of correct predictions and the highest prediction accuracy of the test set. In order to observe the experimental results more clearly, the relative errors of the four groups of experiments were compared, and the results are shown in Figure 4.
The relative error (RE) is used to reflect the degree of confidence in the predicted value. yi denotes the true value, and yp denotes the predicted value.
R E = y i y p y i
The mean relative error (MRE) represents the average of the relative errors.
M R E = 1 n i = 1 n y i y p y i
The root mean square error (RMSE) is used to measure the error between the predicted and actual values.
R M S E = 1 n ( y i y p ) 2
The coefficient of determination (R2) is a measure of how well the prediction model fits. ym represents the average of the true values.
R 2 = 1 ( y i y p ) 2 ( y i y m ) 2
REmax denotes the maximum relative error. Using the above four indicators to evaluate the experimental results, the smaller the value of the first three indicators, the better the prediction result, and the opposite for R2, the larger the value, the better the experimental result. The results of evaluation indicators for each experimental group are shown in Table 4.

5.2. Prediction of Coal and Gas Prominence by MCMC-ISSA-SVM Model

The prediction models of improved sparrow search algorithm optimized support vector machine based on Markov chain Monte Carlo filling algorithm (MCMC-ISSA-SVM), sparrow search algorithm optimized support vector machine based on Markov chain Monte Carlo filling algorithm (MCMC-SSA-SVM), genetic algorithm optimized support vector machine based on Markov chain Monte Carlo filling algorithm (MCMC-GA-SVM) and particle swarm optimization algorithm optimized support vector machine based on Markov chain Monte Carlo filling algorithm (MCMC-PSO-SVM) were established using the ISSA, SSA, genetic algorithm (genetic algorithm, GA) and particle swarm optimization algorithm (particle swarm optimization, PSO) respectively. The best results were obtained from Group 4 experiments, and the data corresponding to the four main parameter indicators of gas dispersion initial velocity (X2), gas content (X4), K1 gas desorption (X5), and drill cuttings (X6) included in Group 4 experiments were input into each model for coal and gas protrusion prediction. As a result, the training and test sets were randomly divided, and the results had a certain randomness. In order to be able to further analyze the prediction effect more accurately, each model was subjected to repeated prediction experiments 50 times; the prediction results were recorded each time, and the experimental results were tallied, as shown in Figure 5.
To obtain a more intuitive picture of the prediction effectiveness of the models, the average of the prediction results of 50 experiments for each model was calculated as its prediction accuracy. The experimental error of each model was then calculated based on the prediction accuracy. The results for each model are shown in Figure 6.
The best-fit and mean-fit convergence curves allow a better comparison and analysis of the dynamic process of finding the optimum and the speed of convergence of each model iteration. The best fit and average fit convergence curves for each model optimization process are shown in Figure 7.
The best-fit curve of the MCMC-ISSA-SVM model reached a prediction accuracy of 98.25% after 5 iterations and remained stable. The average fit was 66% in the first generation, rising rapidly to 90% after 4 iterations, and then fluctuating up and down in the range of 85–95%. The best fit curve of the MCMC-SSA-SVM model reached a prediction accuracy of 92.41% after 10 iterations and remained stable. The average fit increased rapidly from 61% accuracy to 84% after 6 iterations and has been fluctuating up and down in the interval of 80–90% since then. The best-fit curve of the MCMC-GA-SVM model took 22 iterations before it reached a steady state. Its prediction accuracy was 87.25%, and the average fitness was overwhelmingly distributed, mainly in the interval of 75–85%. The best-fit curve of the MCMC-PSO-SVM model took 42 iterations to converge to a steady state. Its prediction accuracy was 82.66%, and the average fitness was overwhelmingly distributed, mainly in the interval range of 70–80%.
As can be seen in Figure 6 and Figure 7, the MCMC-SSA-SVM model has a prediction accuracy of 92.41% with an error of 0.078, while the MCMC-ISSA-SVM has a prediction accuracy of 98.25% with an error of 0.018. Improvements to the algorithm have resulted in a 5.84% increase in prediction accuracy, a 0.060 decrease in error, a reduction in the number of iterations by 5, and a reduction in the number of iterations. The best fit and average fit increased by about 5%. This shows that the improvement of SSA by the adaptive t-distribution variation operator is effective. The prediction accuracy of MCMC-GA-SVM was 87.25% with an error of 0.128, and that of MCMC-PSO-SVM was 82.66% with an error of 0.183. The comparison revealed that MCMC-ISSA-SVM had the highest prediction accuracy and the lowest error. In addition, it has the fastest convergence speed, the lowest number of iterations, the highest best fit, and the average fit among the four models, and the prediction results are significantly better than the other three models. It indicates that ISSA has better optimization capability than SSA, PSO, and GA, and MCMC-ISSA-SVM can improve prediction performance.

6. Results

(1)
The MCMC filling algorithm was used to fill the missing values and compared with the mean, RF, and KNN filling results. The mean value of MCMC-filled data is 2.28 and the standard deviation is 0.19, which is closer to the mean and standard deviation of the original dataset than the mean and standard deviation of other models, indicating that MCMC-filled data is the best. The results indicate that the MCMC algorithm performs well in filling missing values and can optimize the dataset effectively.
(2)
The parameter indicators of the prominence data were ranked by entropy-weighted gray correlation analysis and divided into four experimental groups with different numbers of parameter indicators according to the entropy-weighted gray correlation, which were input into the MCMC-SVM model for prominence prediction experiments. The last group of experimental coal and gas prominence predictions has the best effect. The results show that the entropy-weighted gray correlation analysis can effectively filter the prediction parameters, reduce the interference of other parameters, and improve the prediction accuracy.
(3)
An improved sparrow search algorithm is proposed to enhance sparrow population diversity by adding an adaptive t-distribution variation operator and improving the update position of vigilantes. The MCMC-ISSA-SVM model is established and compared with the MCMC-SSA-SVM model for experiments, and it is found that the improved prediction accuracy is improved by 5.84%, the error is reduced by 0.060, the number of iterations is reduced by 5, and the best and average fitness are increased by about 5%. The results show that the improvement of the algorithm is effective.
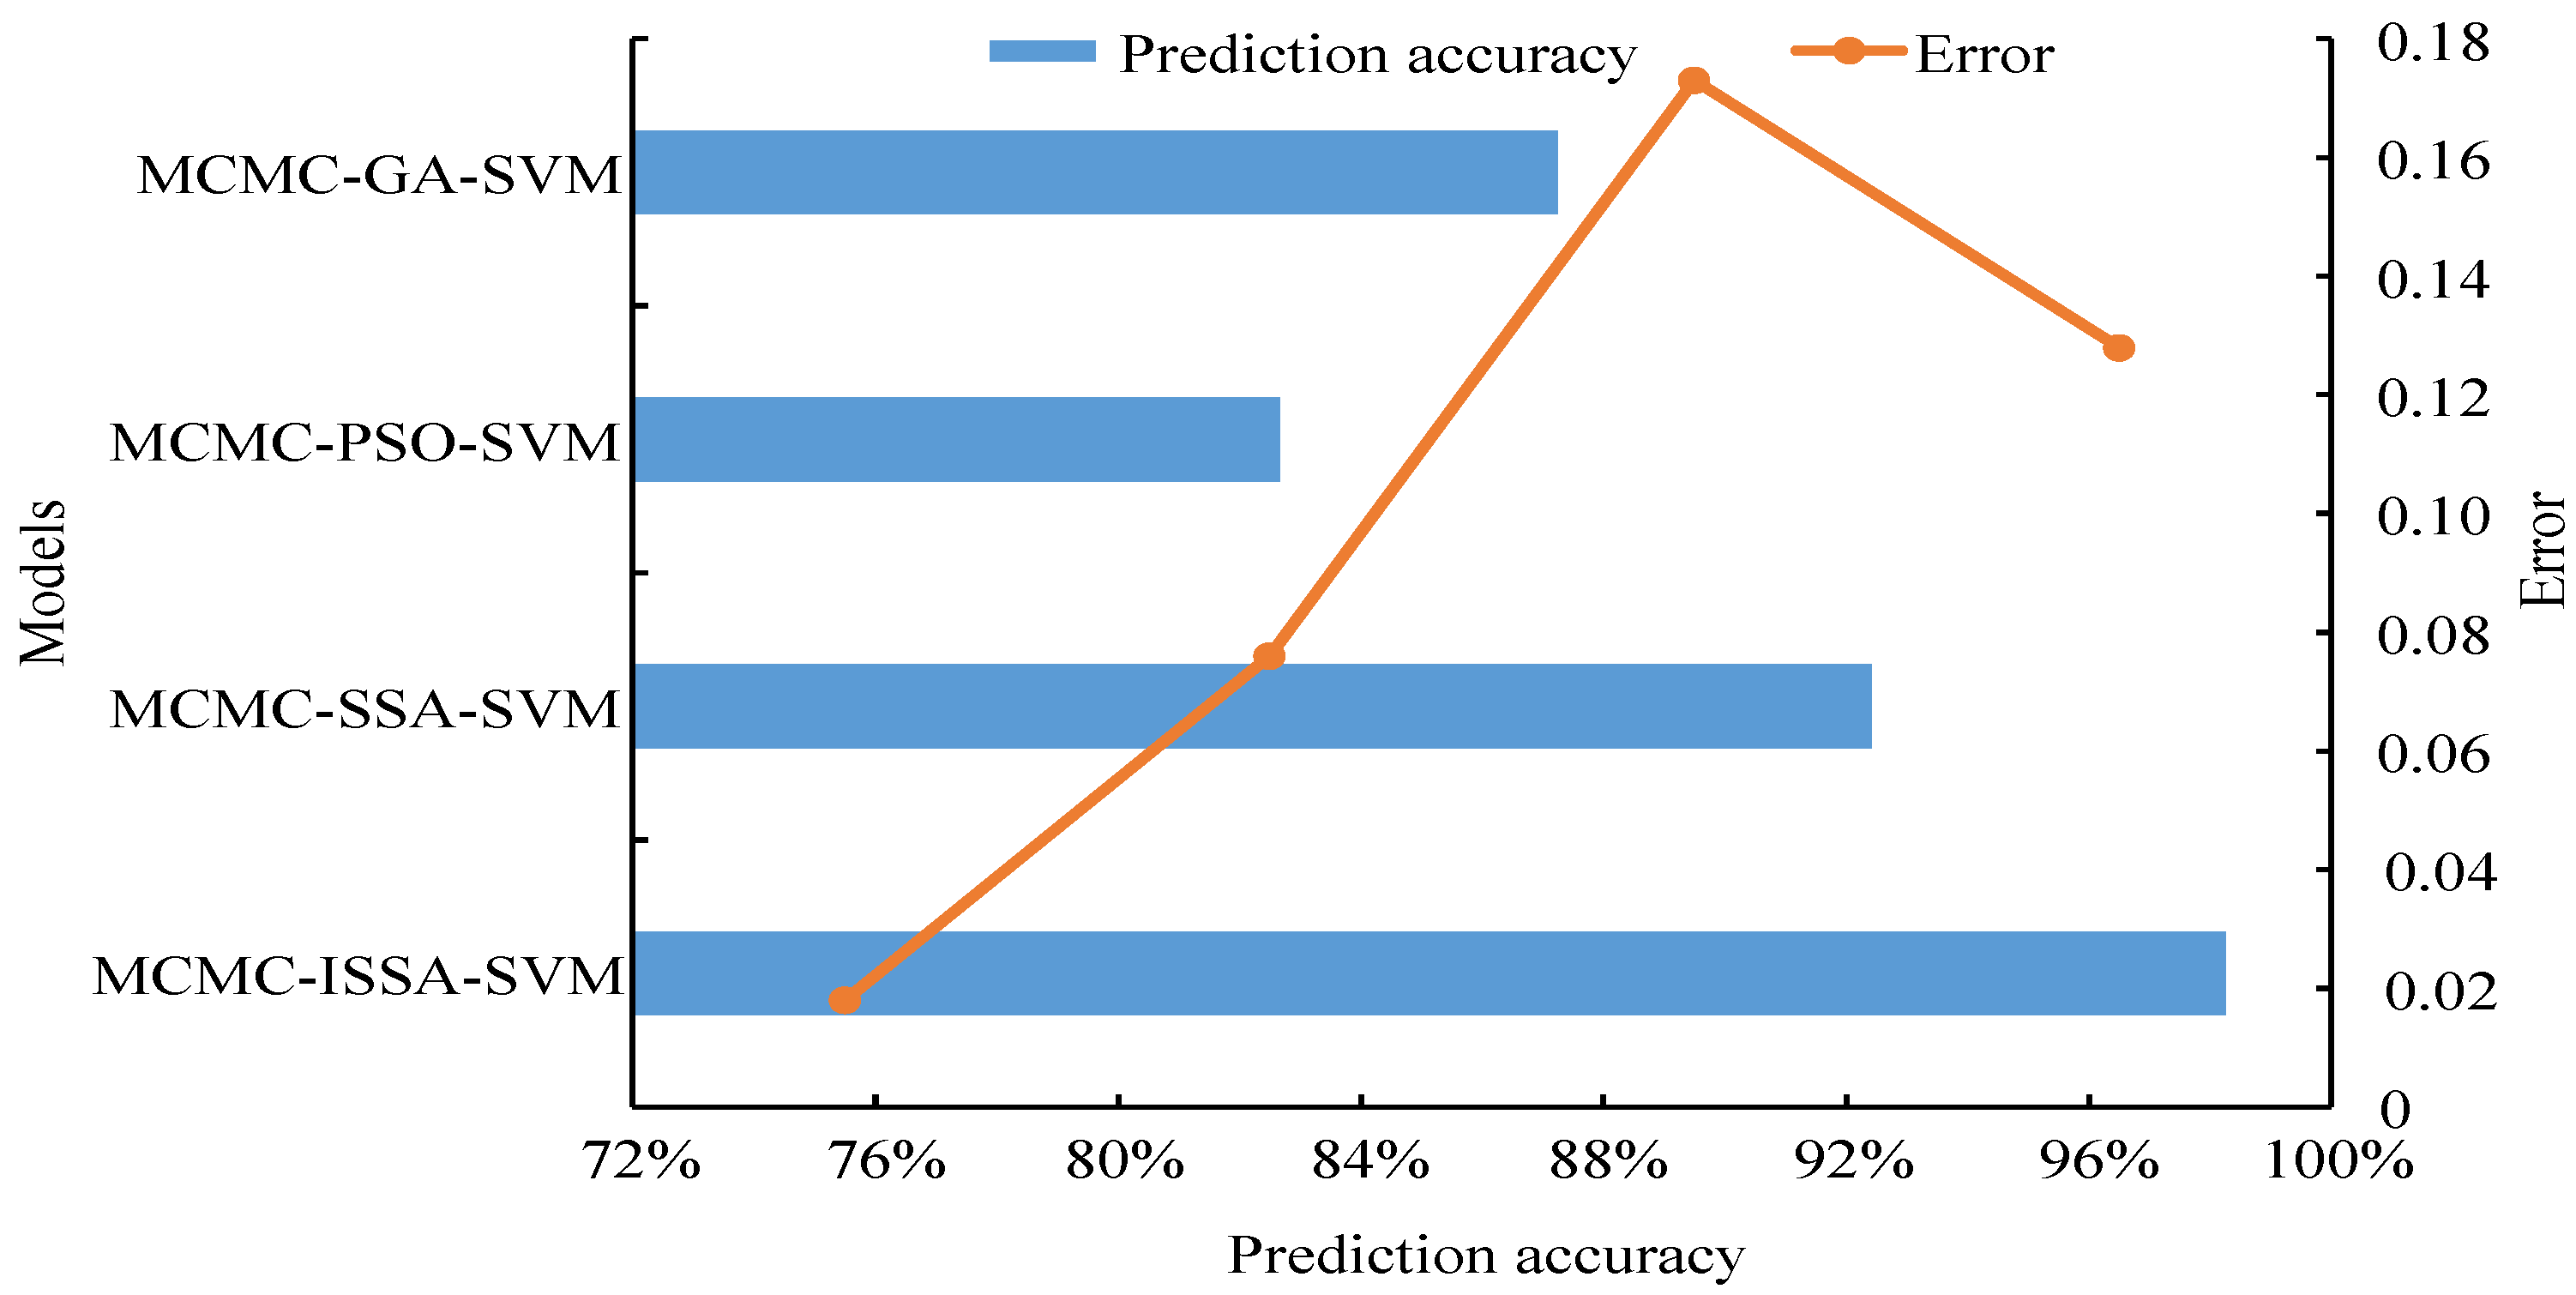
(4)
The prediction accuracy of MCMC-ISSA-SVM is 98.25% with an error of 0.018, which is significantly better than the other three models. In addition, its convergence speed is the fastest, the number of iterations is the least, and the best fitness and average fitness are the highest among the four models. The results verified that ISSA outperformed SSA, PSO, and GA in terms of optimization seeking, and the proposed MCMC-ISSA-SVM model could indeed significantly improve the prediction accuracy and effectively enhance the generalization ability.
Other methods mainly choose one of both an optimized dataset and an improved algorithm for modeling, and this paper mainly deals with both an optimized dataset and an improved algorithm before building a model to be applied to coal and gas prominence prediction. There are some limitations to this method. The changes in ground stress, geological structure conditions, media structure, and gas at the construction location will affect the coal and gas prominence prediction, and the collected data set is suitable for this method when there is a deficiency.

Author Contributions

A gas prominence prediction model based on entropy-weighted gray correlation and MCMC-ISSA-SVM: Use entropy-weighted gray correlation and machine learning algorithms; software, SPSS and Matlab; data curation, Y.G.; writing—original draft preparation, Y.G.; supervision, L.S. All authors have read and agreed to the published version of the manuscript.

Funding

This study was supported by the National Natural Science Foundation Project (71771111). Project name: Research on the prediction method and application of coal and gas outbursts based on big data. Discipline classification: G0104. Prediction and evaluation. Project leader: L.S. Funding amount: 460,000 yuan.

Data Availability Statement

The data are shown in Table 1.

Conflicts of Interest

The authors declare no conflict of interest.

Nomenclature

SymbolsExplanation
MCMCMarkov chain Monte Carlo
SSAsparrow search algorithm
ISSAimproved sparrow search algorithm
SVMsupport vector machine
GAgenetic algorithm
PSOparticle swarm optimization
MCMC-ISSA-SVMimproved sparrow search algorithm optimized support vector machine based on Markov chain Monte Carlo filling algorithm
MCMC-SSA-SVMsparrow search algorithm optimized support vector machine based on Markov chain Monte Carlo filling algorithm
MCMC-GA-SVMgenetic algorithm optimized support vector machine based on Markov chain Monte Carlo filling algorithm
MCMC-PSO-SVMparticle swarm optimization algorithm optimized support vector machine based on Markov chain Monte Carlo filling algorithm
RFrandom forest
KNNK-nearest neighbor
RErelative error
REmaxmaximum relative error
MREaverage relative error
RMSEroot mean square error
R2coefficient of determination
GASAgenetic simulated annealing algorithm
BPback propagation
ρresolution factor
Pijthe weight of the characteristics of the jth evaluation object under the ith evaluation indicator
ejentropy value of the jth indicator
ω j the entropy weight of the jth indicator
rientropy-weighted gray correlation
STsafety value
R2warning value
cpenalty parameters for support vector machines
gkernel function parameter for support vector machine
λt(r)variation operator
Pvariation probability
randrandom number
rthe number of iterations
rmaxthe maximum number of iterations

References

  1. Lu, X.M.; Kan, S.T. Key technologies and outlook of power hazard ontogenetic warning methods in coal mines. J. Coal 2020, 45, 128–139. [Google Scholar] [CrossRef]
  2. Shao, L.S.; Wang, Z.; Li, C.M. A mine ventilation optimization algorithm based on simulated annealing and improved particle swarm. J. Syst. Simul. 2021, 33, 2085–2094. [Google Scholar] [CrossRef]
  3. Lu, Y.Y.; Peng, Z.Y.; Xia, B.W.; Yu, P.; Ou, C. Multifunctional physical simulation experimental system for deep coal rock engineering—Coal and gas protrusion simulation experiment. J. Coal 2020, 45, 272–283. [Google Scholar] [CrossRef]
  4. Yu, B.F. Research on the mechanism of coal and gas protrusion. Coal Sci. Technol. 1979, 8, 34–42. [Google Scholar] [CrossRef]
  5. Zhan, X.F. Research on Analysis and Prediction of Coal and Gas Protrusion Accidents. Master’s Thesis, Liaoning Technical University, Fuxin, China, 2020. [Google Scholar] [CrossRef]
  6. Wang, L.Y. Coal and Gas Prominence Class Prediction Based on Optimal Kernel Limit Learning Machine. Master’s Thesis, Liaoning Technical University, Fuxin, China, 2022. [Google Scholar] [CrossRef]
  7. Lin, H.F.; Zhou, J.; Jin, H.W.; Li, S.; Zhao, P.; Liu, S. Collaborative coal and gas protrusion hazard level prediction method based on feature selection and machine learning. J. Min. Saf. Eng. 2023, 40, 361–370. [Google Scholar] [CrossRef]
  8. Zhang, Q.; Yang, C.-L.; Li, X.-C.; Li, Z.-B.; Li, Y. Mechanism and Classification of Coal and Gas Outbursts in China. Adv. Civ. Eng. 2021, 2021, 5519853. [Google Scholar] [CrossRef]
  9. Dong, G.W.; Liang, X.M.; Wang, Q.X. A New Method for Predicting Coal and Gas Outbursts. Shock. Vib. 2020, 2020, 8867476. [Google Scholar] [CrossRef]
  10. Zhang, C.; Jiao, D.; Dong, Z.; Zhang, H. Risk assessment method of coal and gas outburst based on improved comprehensive weighting and cloud theory. Energy Explor. Exploit. 2022, 40, 777–799. [Google Scholar] [CrossRef]
  11. Yuan, L.; Wang, W.; Wang, H.P.; Zhang, B.; Liu, Z.; Yu, G.; Zuo, Y. Simulation test system for coal and gas protrusion induced by coal uncovering in roadway excavation. J. China Univ. Min. Technol. 2020, 49, 205–214. [Google Scholar] [CrossRef]
  12. Lei, Y.; Cheng, Y.; Ren, T.; Tu, Q.; Li, Y.; Shu, L. Experimental Investigation on the Mechanism of Coal and Gas Outburst: Novel Insights on the Formation and Development of Coal Spallation. Rock Mech. Rock Eng. 2021, 54, 5807–5825. [Google Scholar] [CrossRef]
  13. Fu, G.; Xie, X.; Jia, Q.; Tong, W.; Ge, Y. Accidents analysis and prevention of coal and gas outburst: Understanding human errors in accidents. Process Saf. Environ. Prot. 2020, 134, 1–23. [Google Scholar] [CrossRef]
  14. Black, D.J. Review of coal and gas outburst in Australian underground coal mines. Int. J. Min. Sci. Technol. 2019, 29, 815–824. [Google Scholar] [CrossRef]
  15. Song, D.Z.; He, X.Q.; Dou, L.M.; Zu, Z.; Wang, A.; Li, Z. Research on microseismic area detection technology for coal seam protrusion hazard. Chin. J. Saf. Sci. 2021, 31, 89–94. [Google Scholar] [CrossRef]
  16. Tang, J.P.; Hao, N.; Pan, Y.S.; Sun, S. Experimental study on the characteristics of coal and gas protrusion precursors based on acoustic emission energy analysis. J. Rock Mech. Eng. 2021, 40, 31–42. [Google Scholar] [CrossRef]
  17. Mou, J.; Liu, H.; Zou, Y.; Li, Q. A new method to determine the sensitivity of coal and gas outburst prediction index. Arab. J. Geosci. 2020, 13, 465. [Google Scholar] [CrossRef]
  18. Zhao, X.; Sun, H.; Cao, J.; Ning, X.; Liu, Y. Applications of online integrated system for coal and gas outburst prediction: A case study of Xinjing Mine in Shanxi, China. Energy Sci. Eng. 2020, 8, 1980–1996. [Google Scholar] [CrossRef]
  19. Zhu, B.H.; Zheng, B.Y.; Dai, Y.J.; Liu, C. Prediction of coal and gas protrusion hazard in tunnels based on nonlinear support vector machine. Mod. Tunn. Technol. 2020, 57, 20–25. [Google Scholar] [CrossRef]
  20. Wang, Y.H.; Sun, F.C.; Fu, H.; Xu, Y. Coal and gas prominence prediction based on optimized quantum gate node neural network. Inf. Control. 2020, 49, 249–256. [Google Scholar] [CrossRef]
  21. Wang, K.; Du, F. Coal-gas compound dynamic disasters in China: A review. Process Saf. Environ. Prot. 2020, 133, 1–17. [Google Scholar] [CrossRef]
  22. Wang, C.; Wei, L.; Hu, H.; Wang, J.; Jiang, M. Early Warning Method for Coal and Gas Outburst Prediction Based on Indexes of Deep Learning Model and Statistical Model. Front. Earth Sci. 2022, 10, 811978. [Google Scholar] [CrossRef]
  23. Wang, W.; Wang, H.; Zhang, B.; Wang, S.; Xing, W. Coal and gas outburst prediction model based on extension theory and its application. Process Saf. Environ. Prot. 2021, 154, 329–337. [Google Scholar] [CrossRef]
  24. Wu, Y.Q.; Gao, R.L.; Yang, J.Z. Prediction of coal and gas outburst: A method based on the BP neural network optimized by GASA. Process Saf. Environ. Prot. 2020, 133, 64–72. [Google Scholar] [CrossRef]
  25. Gong, S.H.; Pan, T.L.; Wu, D.H.; Ji, Z. Research on MCMC-based method for filling missing micro grid PV data. Renew. Energy 2018, 36, 346–350. [Google Scholar] [CrossRef]
  26. Xue, J.K.; Shen, B. A novel swarm intelligence optimization approach: Sparrow search algorithm. Syst. Sci. Control. Eng. 2020, 8, 22–34. [Google Scholar] [CrossRef]
  27. Song, J.; Cong, Q.M.; Yang, S.S.; Yang, J. Improved sparrow search algorithm for water quality prediction in RBF neural networks. Comput. Syst. 2023, 4, 255–261. [Google Scholar] [CrossRef]
  28. Chen, X.R.; Wu, L.F.; Yang, X.Z. Fractional-order PID parameter tuning based on improved sparrow search algorithm. Control. Decis. Mak. 2023, 1–7. [Google Scholar] [CrossRef]
  29. Xu, K.; Zheng, H.; Tu, Y.C.; Wu, S. Improved sparrow algorithm and Q-Learning optimized integrated learning for rail circuit fault diagnosis. J. Railw. Sci. Eng. 2023, 1–13. [Google Scholar] [CrossRef]
  30. He, J.; Liu, S.-M.; Chen, H.-T.; Wang, S.-L.; Guo, X.-Q.; Wan, Y.-R. Flood Control Optimization of Reservoir Group Based on Improved Sparrow Algorithm (ISSA). Water 2022, 15, 132. [Google Scholar] [CrossRef]
  31. Shi, H.Y.; Chen, M.X. A two-stage transformer fault diagnosis method based multi-filter interactive feature selection integrated adaptive sparrow algorithm optimized support vector machine. IET Electr. Power Appl. 2022, 17, 341–357. [Google Scholar] [CrossRef]
  32. Chen, G.J.; Chen, G.F. An Improved Sparrow Algorithm Based on Small Habitats in Cooperative Communication Power Allocation. Electronics 2023, 12, 1153. [Google Scholar] [CrossRef]
  33. Li, N.; Xue, J.K.; Shu, H.S. UAV trajectory planning based on adaptive t-distribution variational sparrow search algorithm. J. Donghua Univ. (Nat. Sci. Ed.) 2022, 48, 69–74. [Google Scholar] [CrossRef]
Figure 1. The mean and standard deviation corresponding to different filling methods.
Processes 11 02098 g001
Figure 2. Flow chart for building MCMC-ISSA-SVM prediction model.
Processes 11 02098 g002
Figure 3. Test set prediction results for each set of experiments.
Processes 11 02098 g003
Figure 4. Relative errors for each group of experiments compared.
Processes 11 02098 g004
Figure 5. Statistics of prediction experimental results for different models.
Processes 11 02098 g005
Figure 6. Prediction accuracy and error for each model.
Processes 11 02098 g006
Figure 7. Fitness curves for each model.
Processes 11 02098 g007
Table 1. Coal and gas prominence data.
X1X2X3X4X5X6X7X8X9X10
3.0015.500.367.780.293.20351.002.4036.001.00
3.0015.700.367.760.193.40366.002.4062.001.00
2.0015.750.367.810.263.20366.002.4078.001.00
2.0015.560.367.300.343.80367.002.4047.001.00
3.0015.800.367.050.233.13364.002.4021.001.00
3.0015.580.367.680.233.27364.002.403.001.00
3.0017.400.367.980.263.33365.002.4035.001.00
3.0017.520.368.680.263.13365.002.4035.001.00
3.0017.430.368.770.223.07368.002.1011.001.00
3.0015.320.368.350.253.33365.002.6043.001.00
3.0015.560.367.920.283.40363.002.6037.001.00
3.0015.560.367.860.213.27365.002.509.001.00
3.0015.420.367.840.253.53365.002.5020.001.00
3.0015.350.368.210.273.53364.002.5031.001.00
2.0015.450.368.350.253.53364.002.1042.001.00
2.0016.020.367.680.203.33366.002.1029.001.00
3.0016.220.368.300.293.47365.002.4010.001.00
3.0016.310.367.850.233.47365.002.4022.001.00
3.0015.890.367.660.183.47366.002.4022.001.00
3.0015.860.367.480.203.53369.002.3013.001.00
3.0016.020.368.660.283.40365.002.304.001.00
3.0017.660.289.320.303.27365.002.4038.002.00
3.0017.560.3610.100.293.33365.002.4047.002.00
3.0018.620.369.840.283.27368.002.1043.002.00
3.0016.350.369.630.323.27366.002.1026.002.00
3.0016.580.3610.100.303.27366.002.1015.002.00
3.0018.350.3610.500.283.20367.002.105.002.00
3.0018.550.369.920.303.33367.002.105.002.00
3.0017.660.3610.600.283.27368.002.1024.002.00
3.0016.480.3611.100.203.07368.002.109.002.00
3.0015.670.3610.700.263.40370.002.108.002.00
3.0016.350.369.300.263.33369.002.0011.602.00
3.0017.200.368.780.303.33370.002.006.802.00
3.0016.330.368.820.223.33367.002.0028.002.00
2.0016.230.2810.200.343.40363.002.6028.002.00
2.0016.550.2811.200.333.47363.002.6015.002.00
2.0017.500.3010.500.373.13368.002.0020.002.00
3.0017.630.3010.900.223.47363.002.403.002.00
3.0016.880.369.800.293.47364.002.3016.002.00
3.0017.060.3610.200.303.27362.002.3022.002.00
3.0016.690.3013.900.363.27368.002.109.003.00
2.0017.520.2813.500.333.80360.002.308.003.00
2.0018.210.3012.900.383.60363.002.0011.003.00
3.0015.690.367.460.263.33365.002.2026.491.00
2.0016.200.367.900.263.33365.002.3027.121.00
3.0016.550.368.750.253.33368.002.1018.402.00
3.0016.320.3610.100.353.53360.002.2020.492.00
3.0016.530.369.700.333.53365.002.1017.542.00
3.0015.850.369.800.323.67360.002.3017.022.00
3.0016.210.3012.900.343.33370.002.1012.453.00
Table 3. Experimental groupings.
Name of Experimental GroupIncluded Parameter IndicatorsEntropy-Weighted Gray Correlation
1X1~X9ri > 0.008
2X2, X4, X5, X6, X7, X8, X9ri > 0.010
3X2, X4, X5, X6, X9ri > 0.012
4X2, X4, X5, X6ri > 0.013
Table 4. Comparison of experimental results.
Experimental GroupREmaxMRERMSER2
10.5000.1110.2260.981
21.0000.0830.3230.945
30.5000.0630.1770.989
40.5000.0420.1440.993
Disclaimer/Publisher’s Note: The statements, opinions and data contained in all publications are solely those of the individual author(s) and contributor(s) and not of MDPI and/or the editor(s). MDPI and/or the editor(s) disclaim responsibility for any injury to people or property resulting from any ideas, methods, instructions or products referred to in the content.

