Sedimentary Environment and Organic Matter Enrichment Model of Saline Lake Source Rock in the Linhe Depression, Hetao Basin, China

Abstract
:1. Introduction
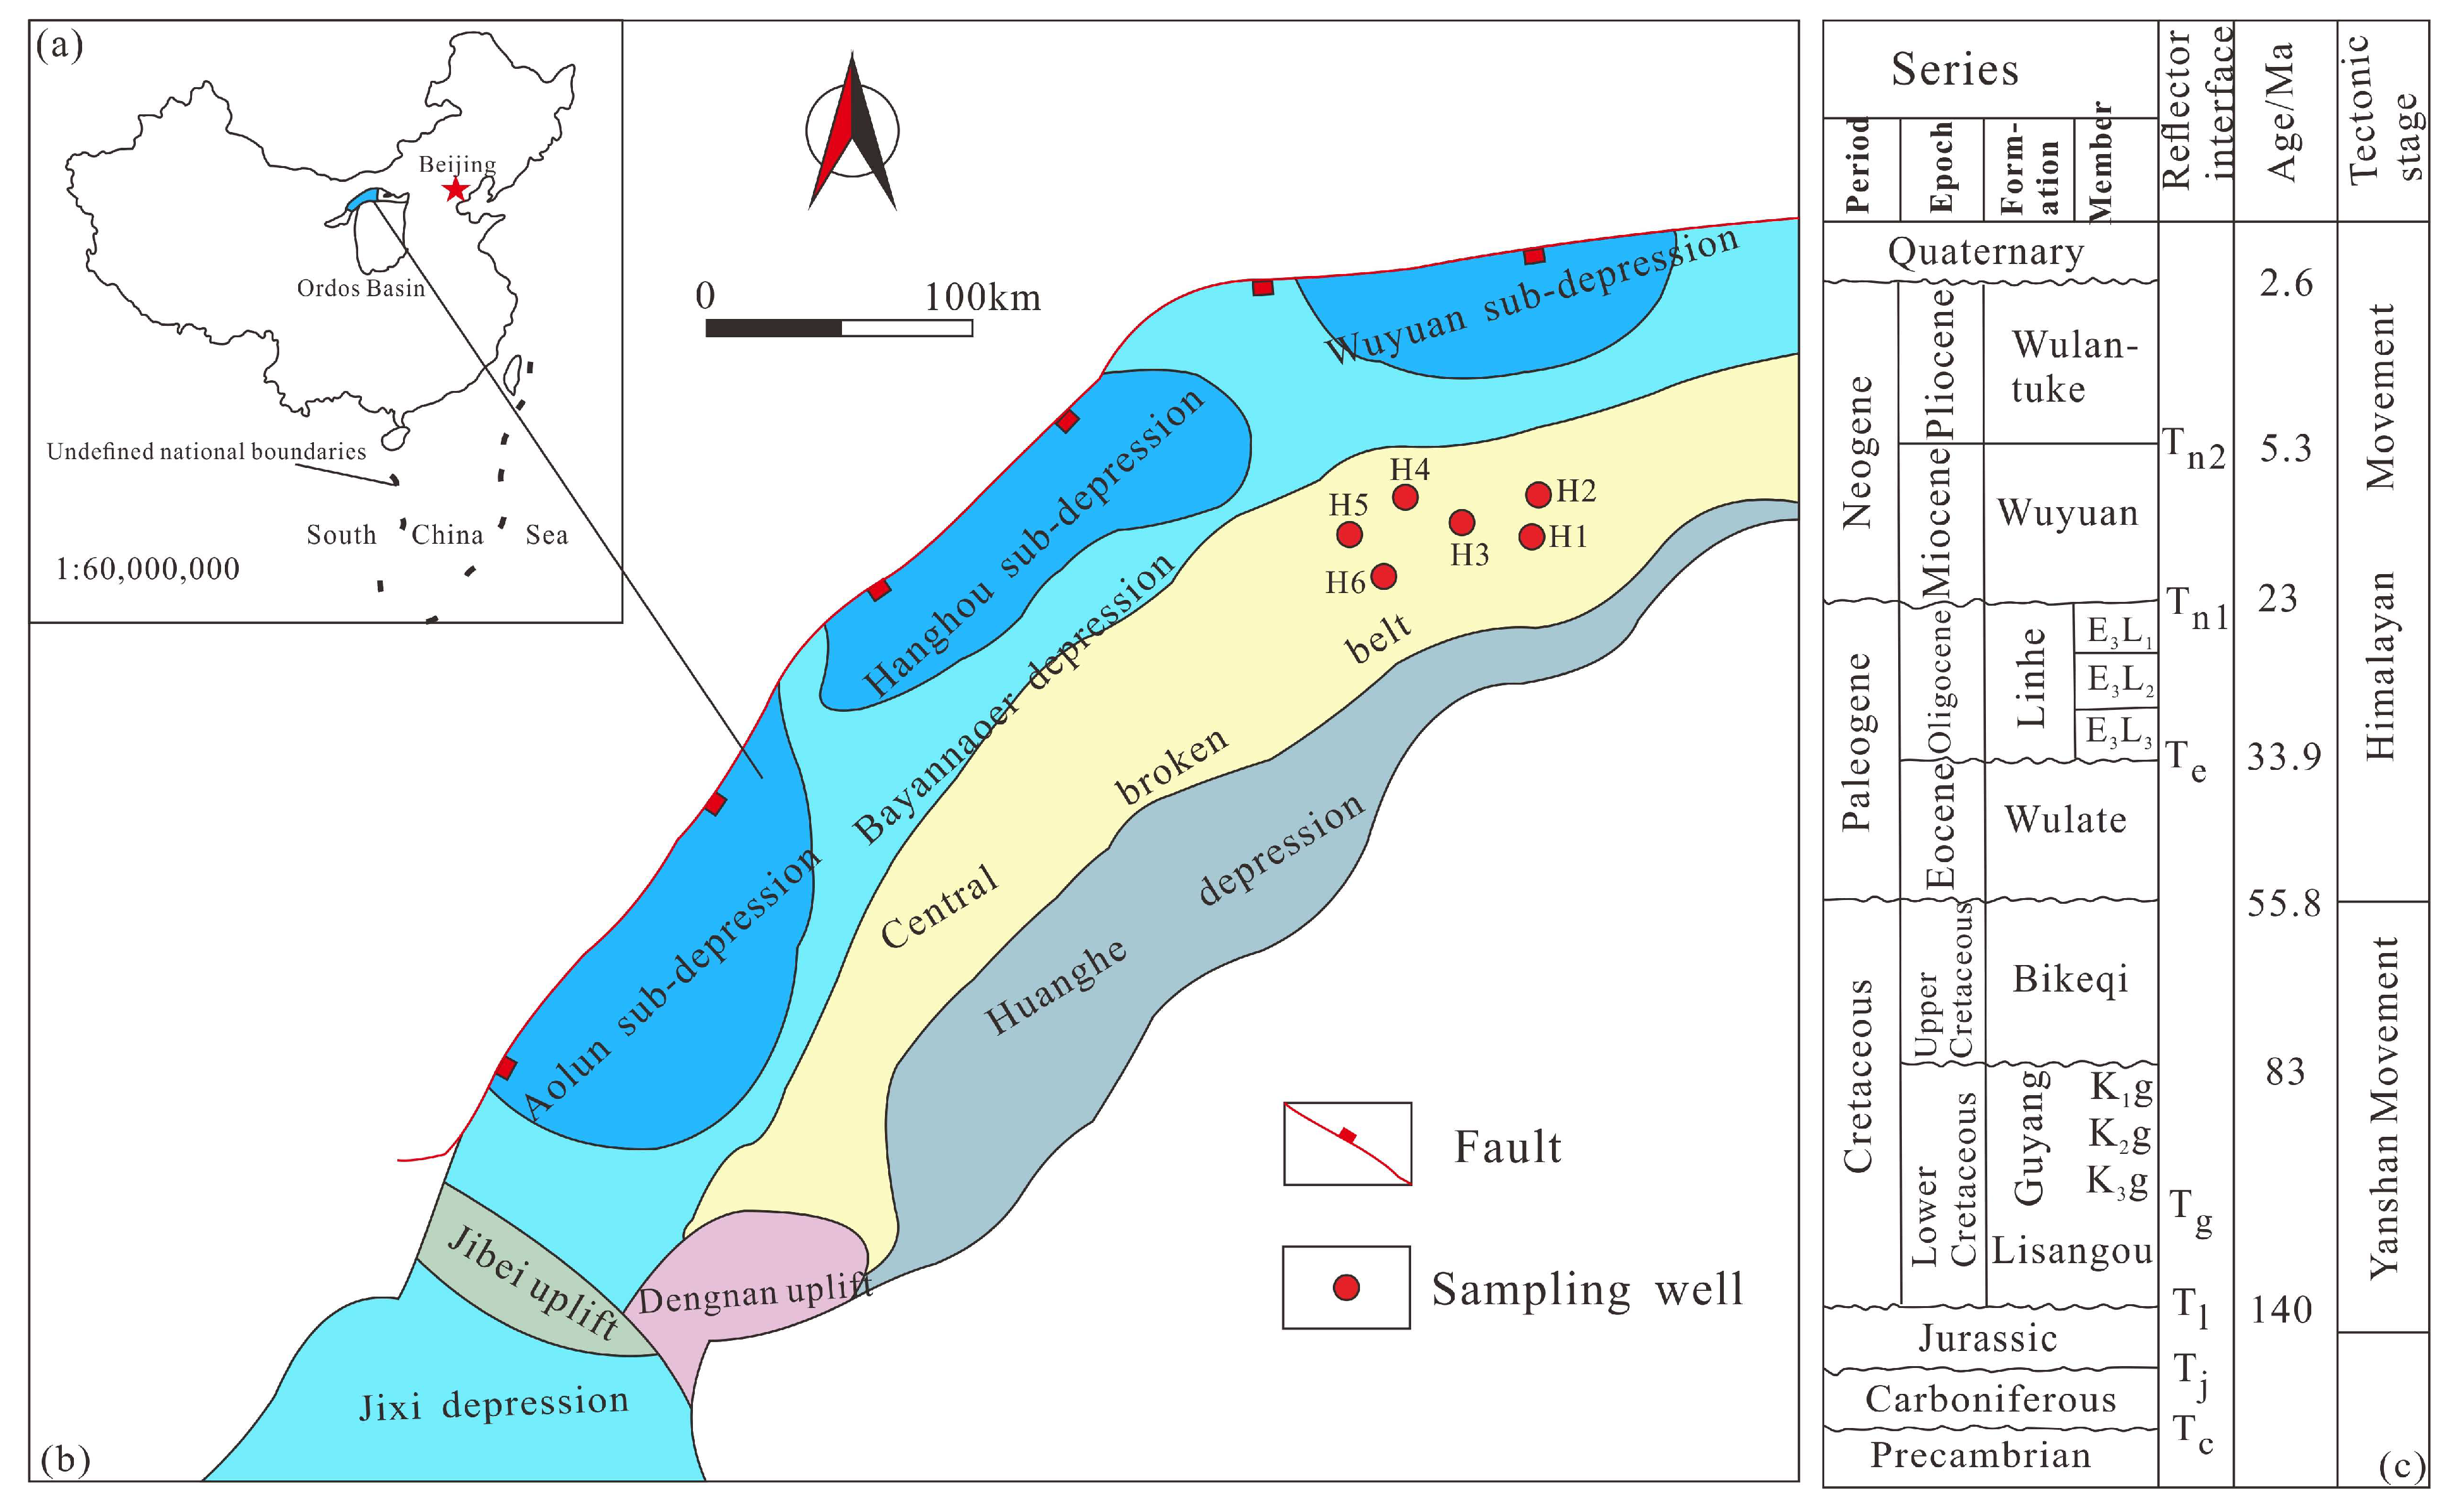
2. Geological Setting
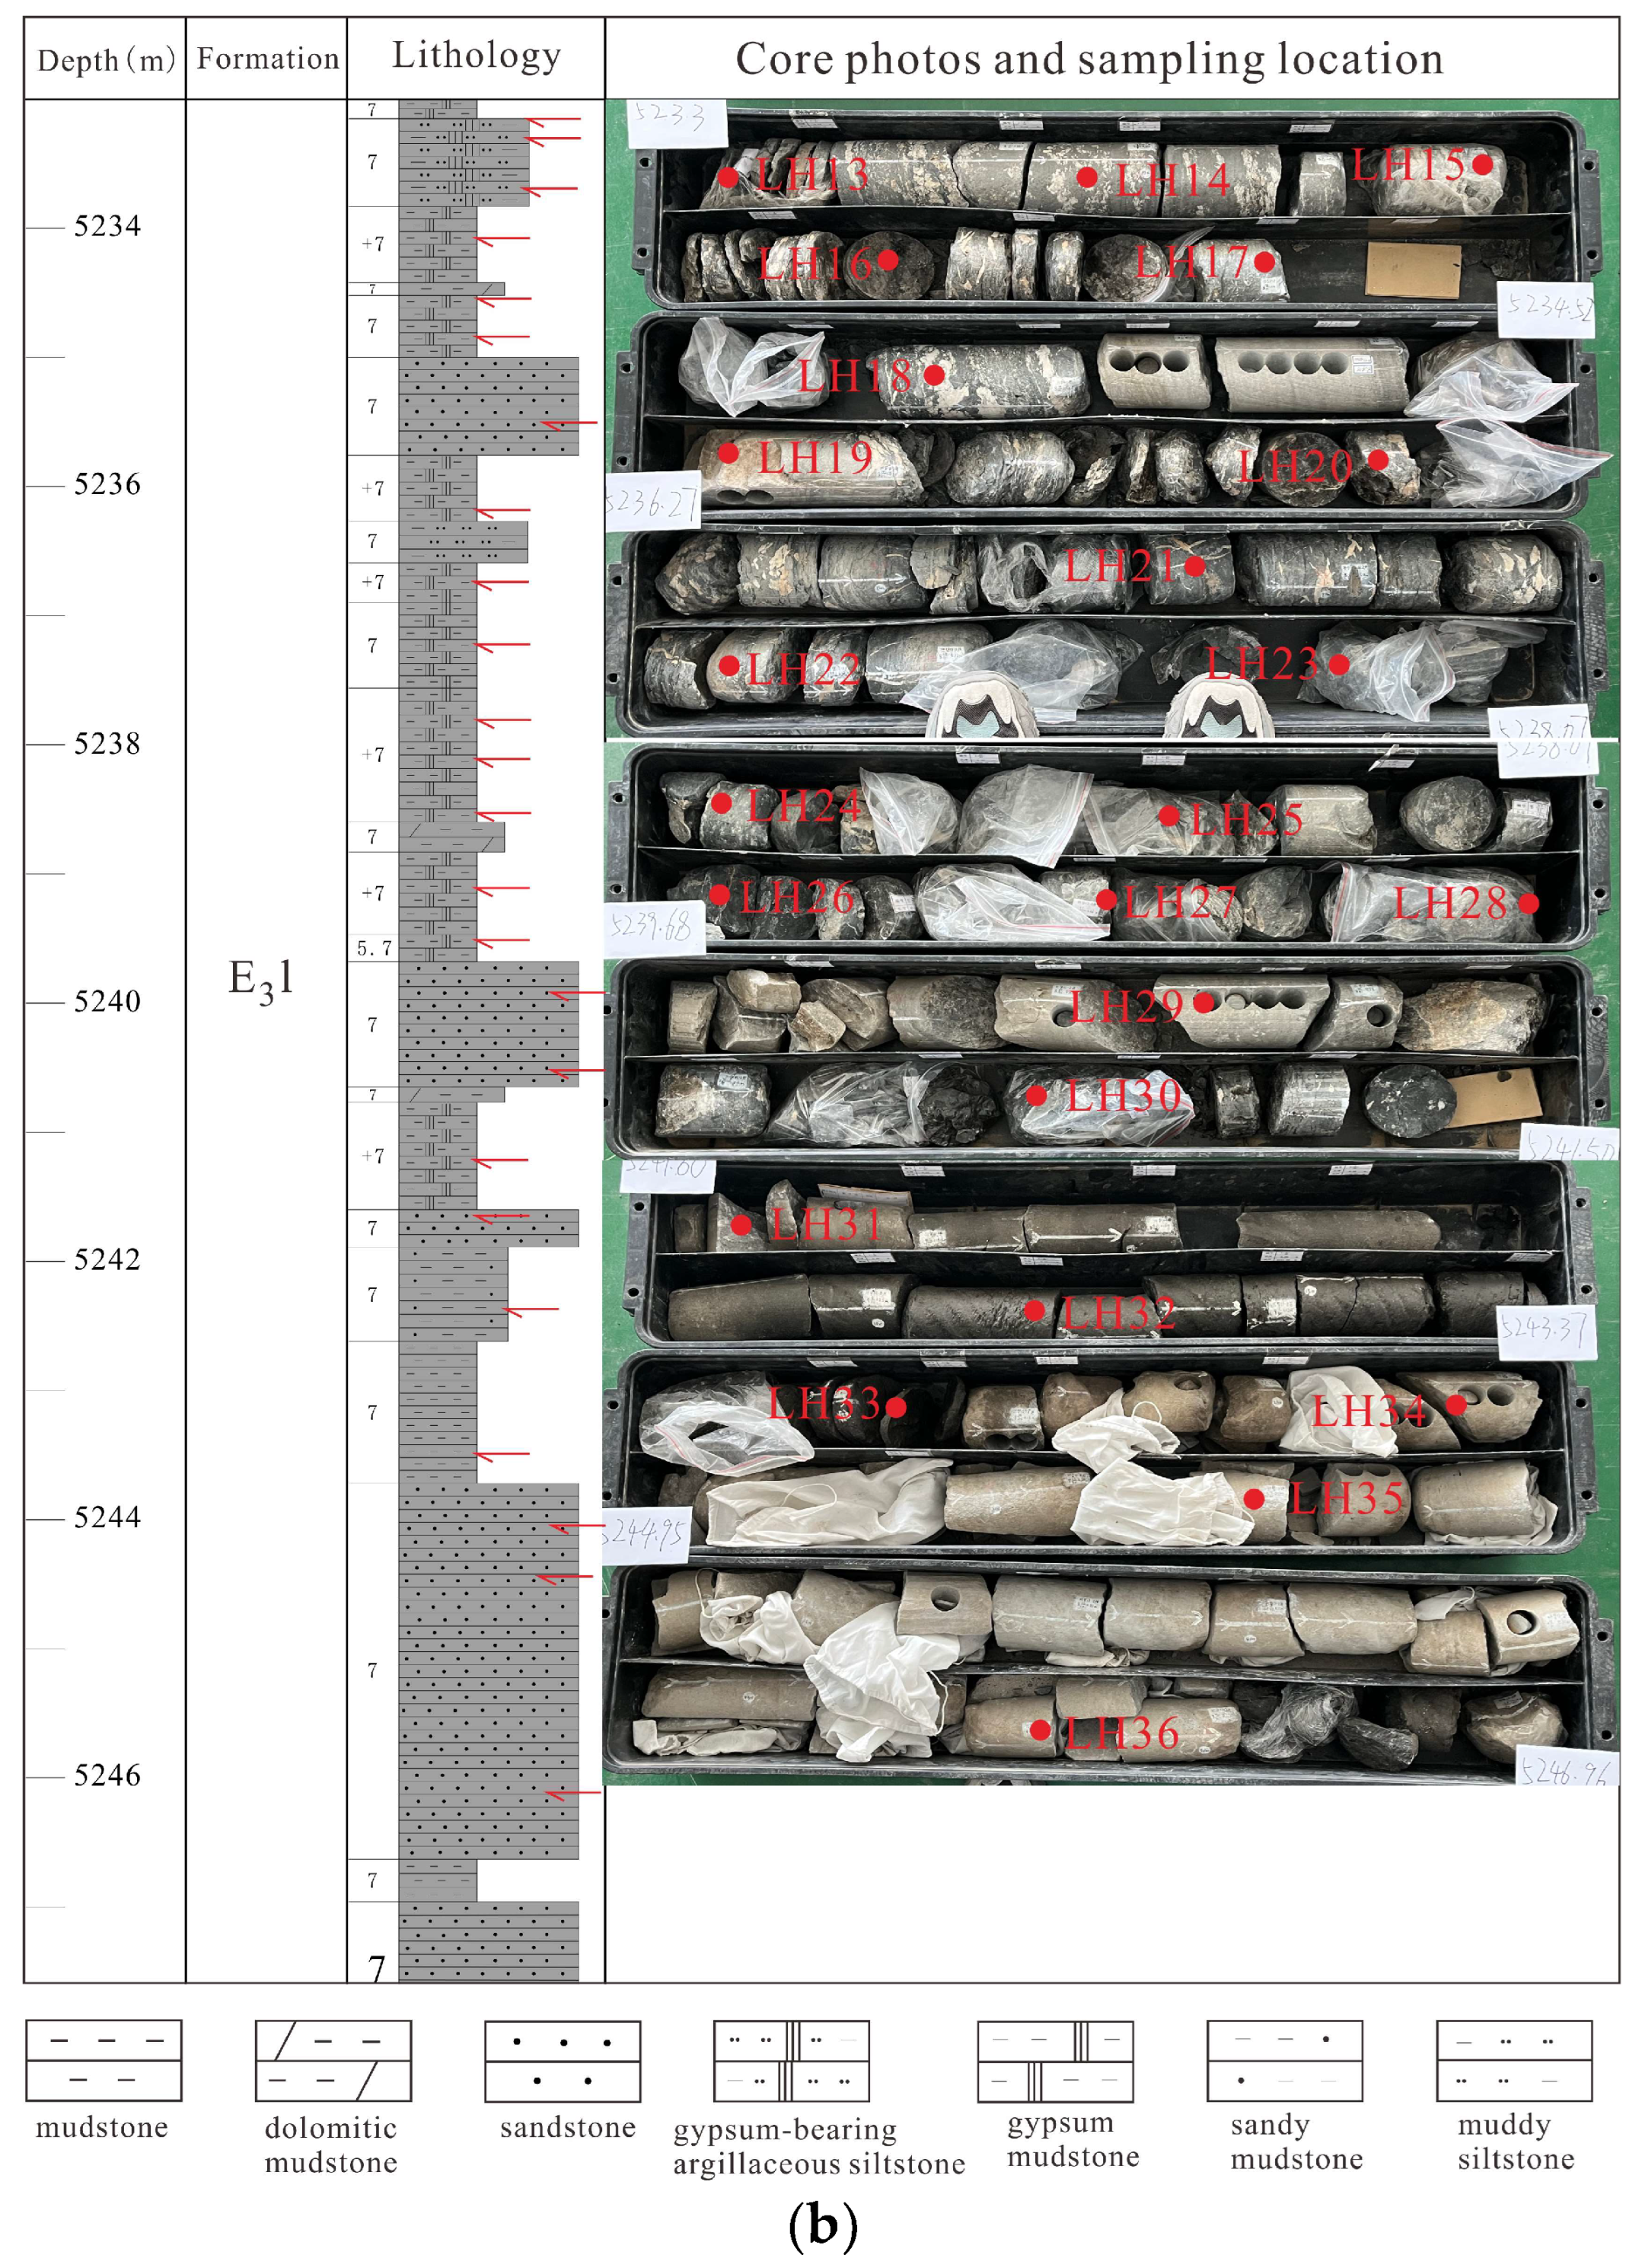
3. Materials and Methods
4. Results
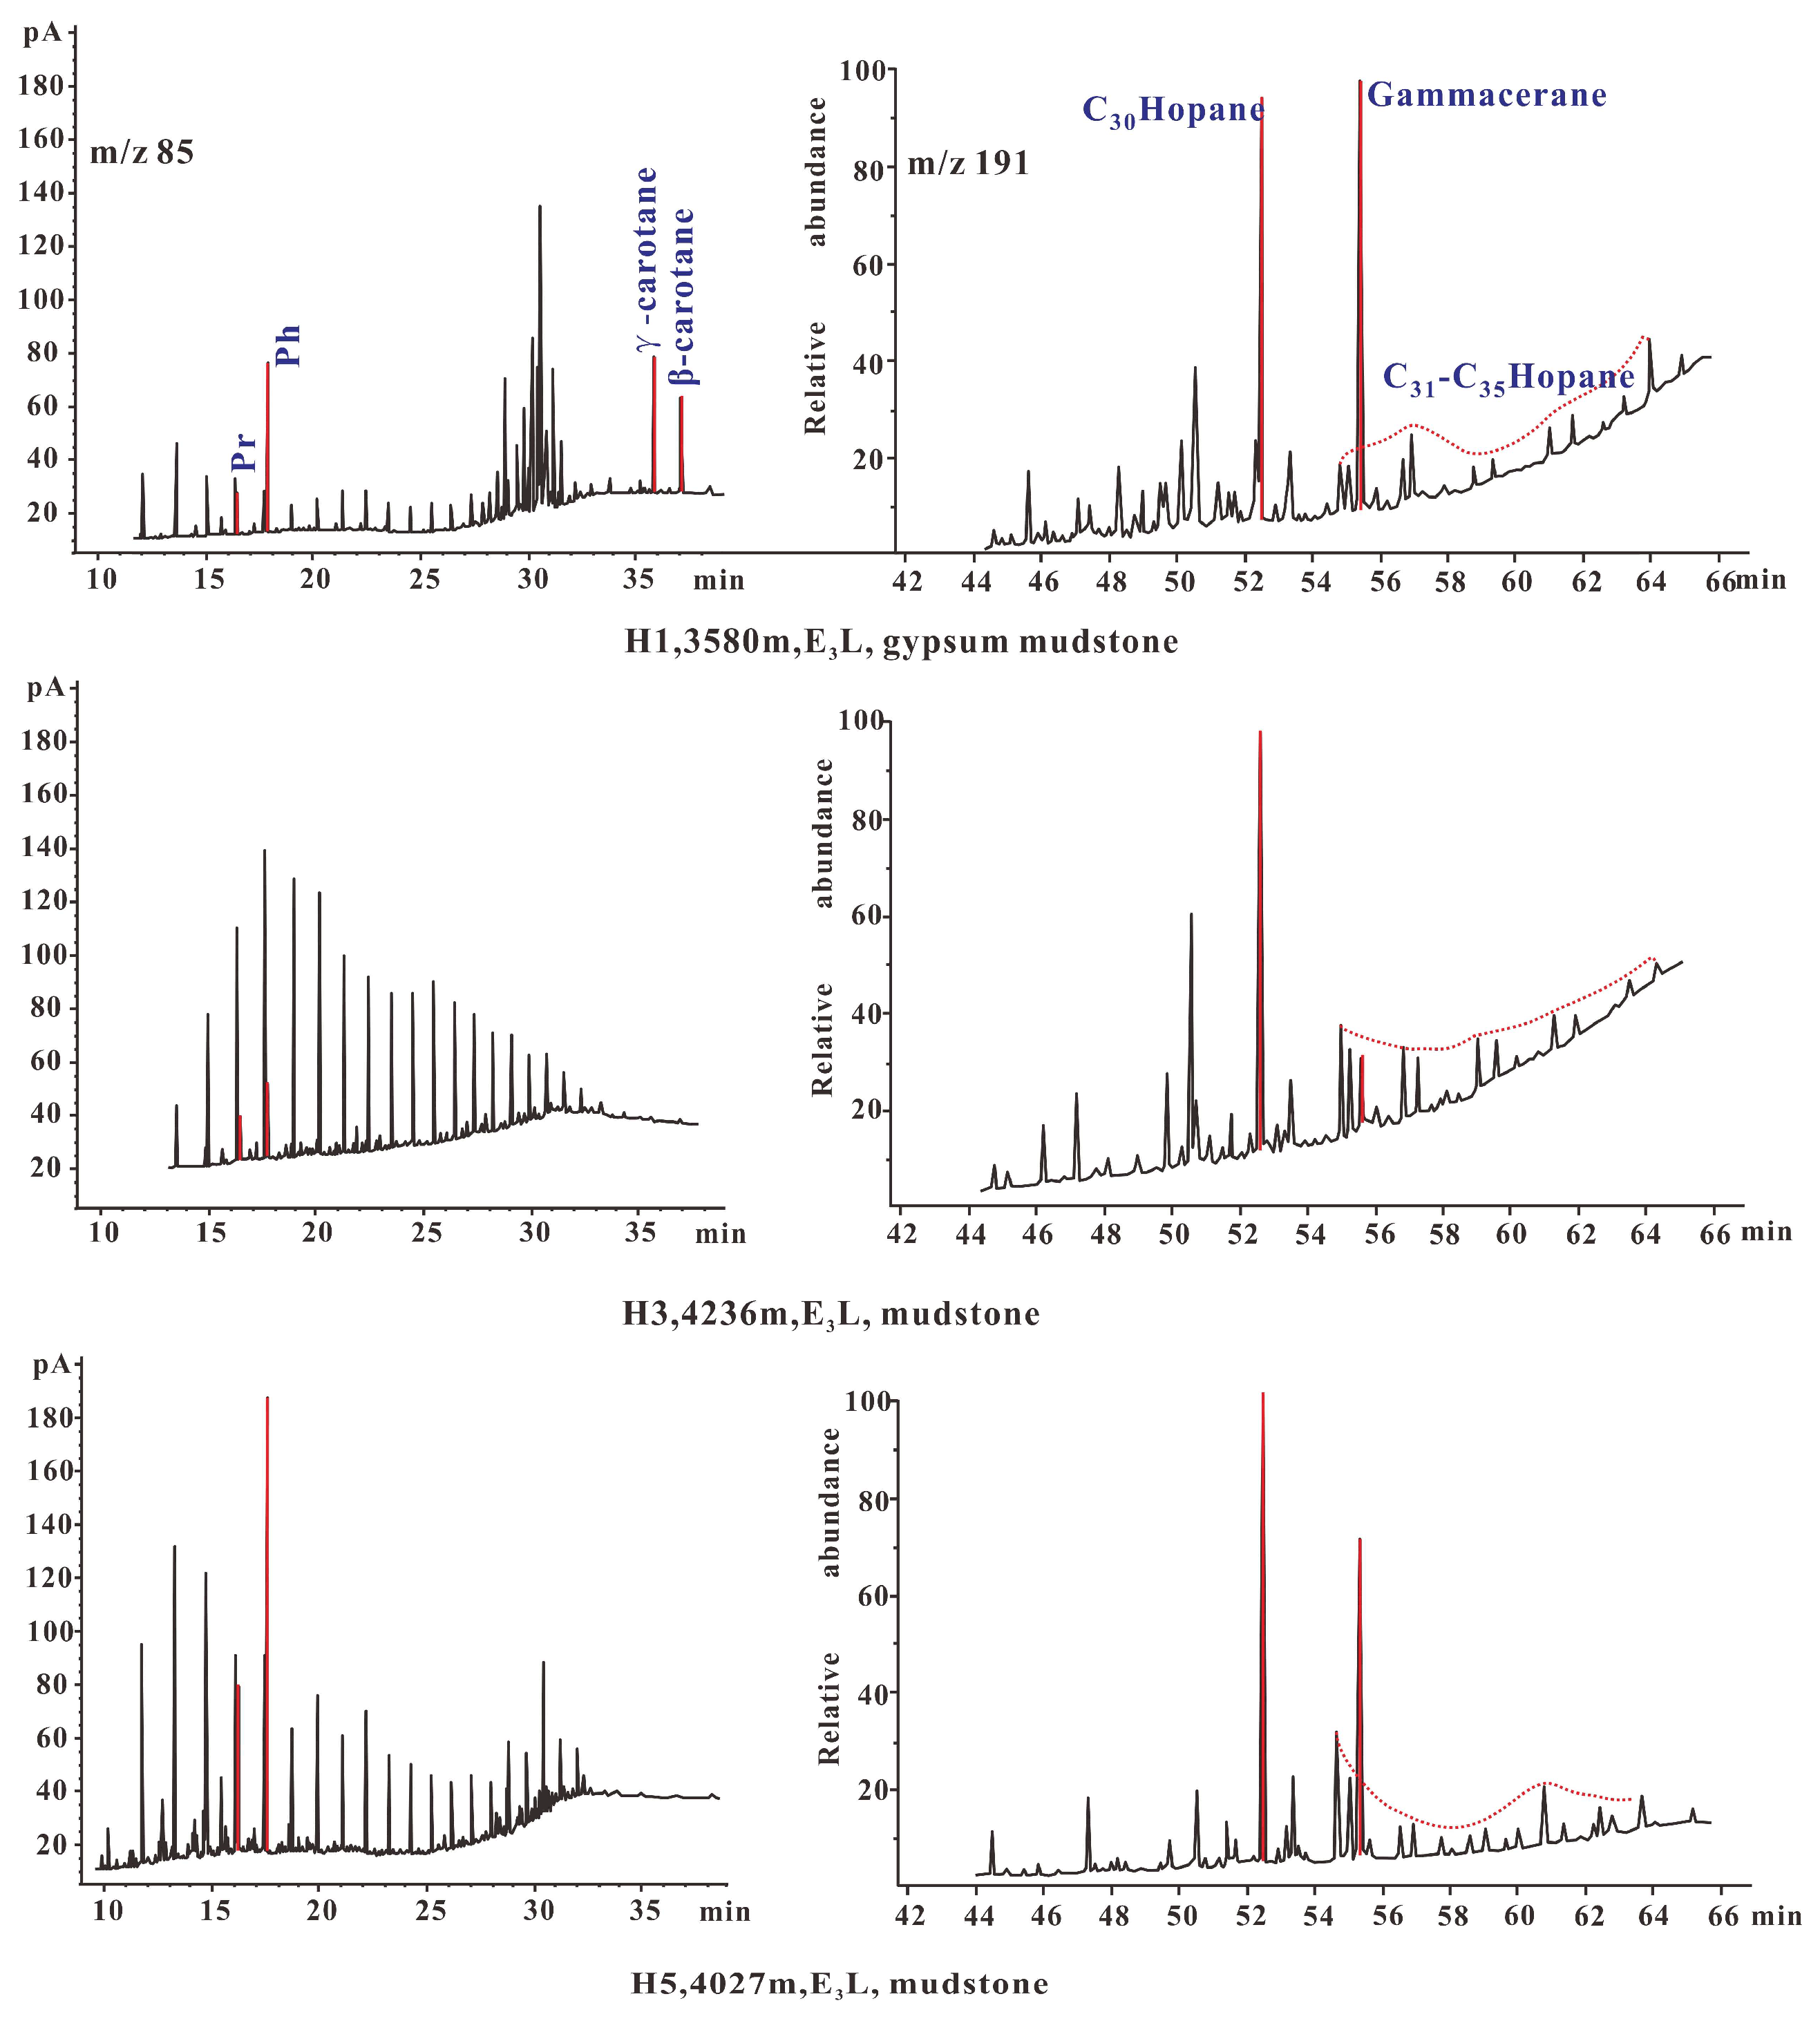
4.1. Organic Geochemistry
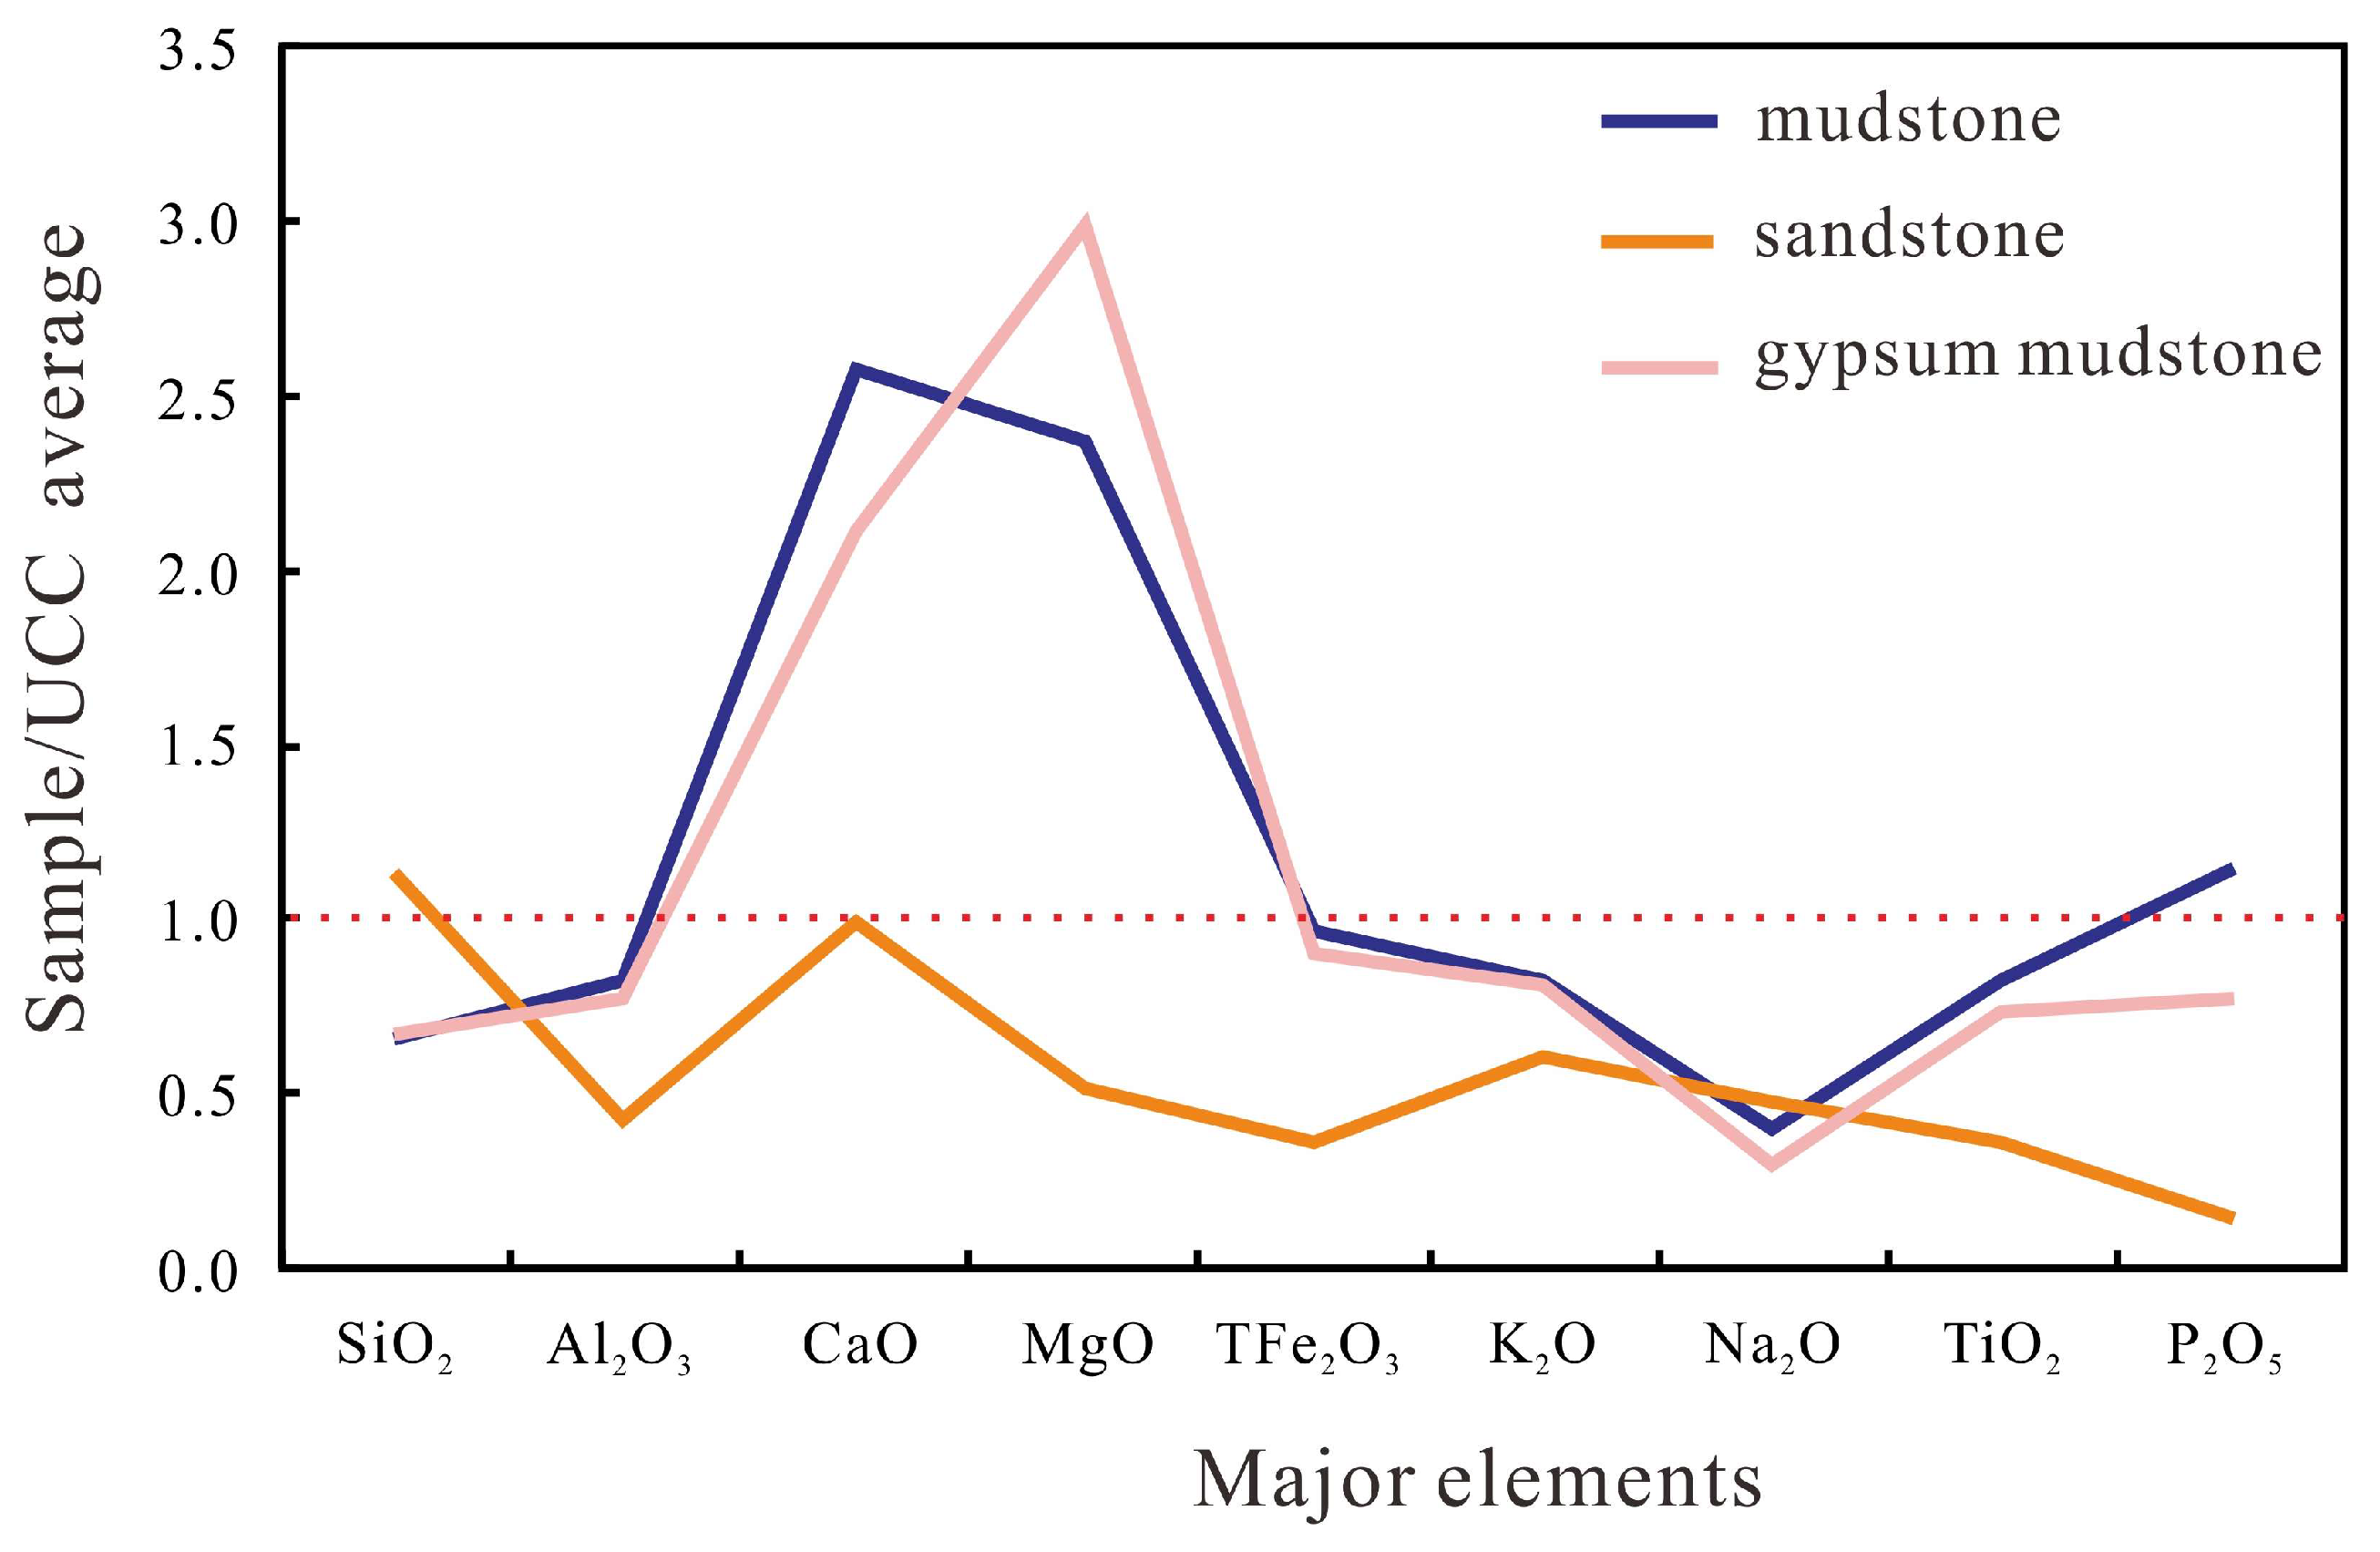
4.2. Geochemistry of Elements
4.2.1. Major Elements
4.2.2. Trace Elements
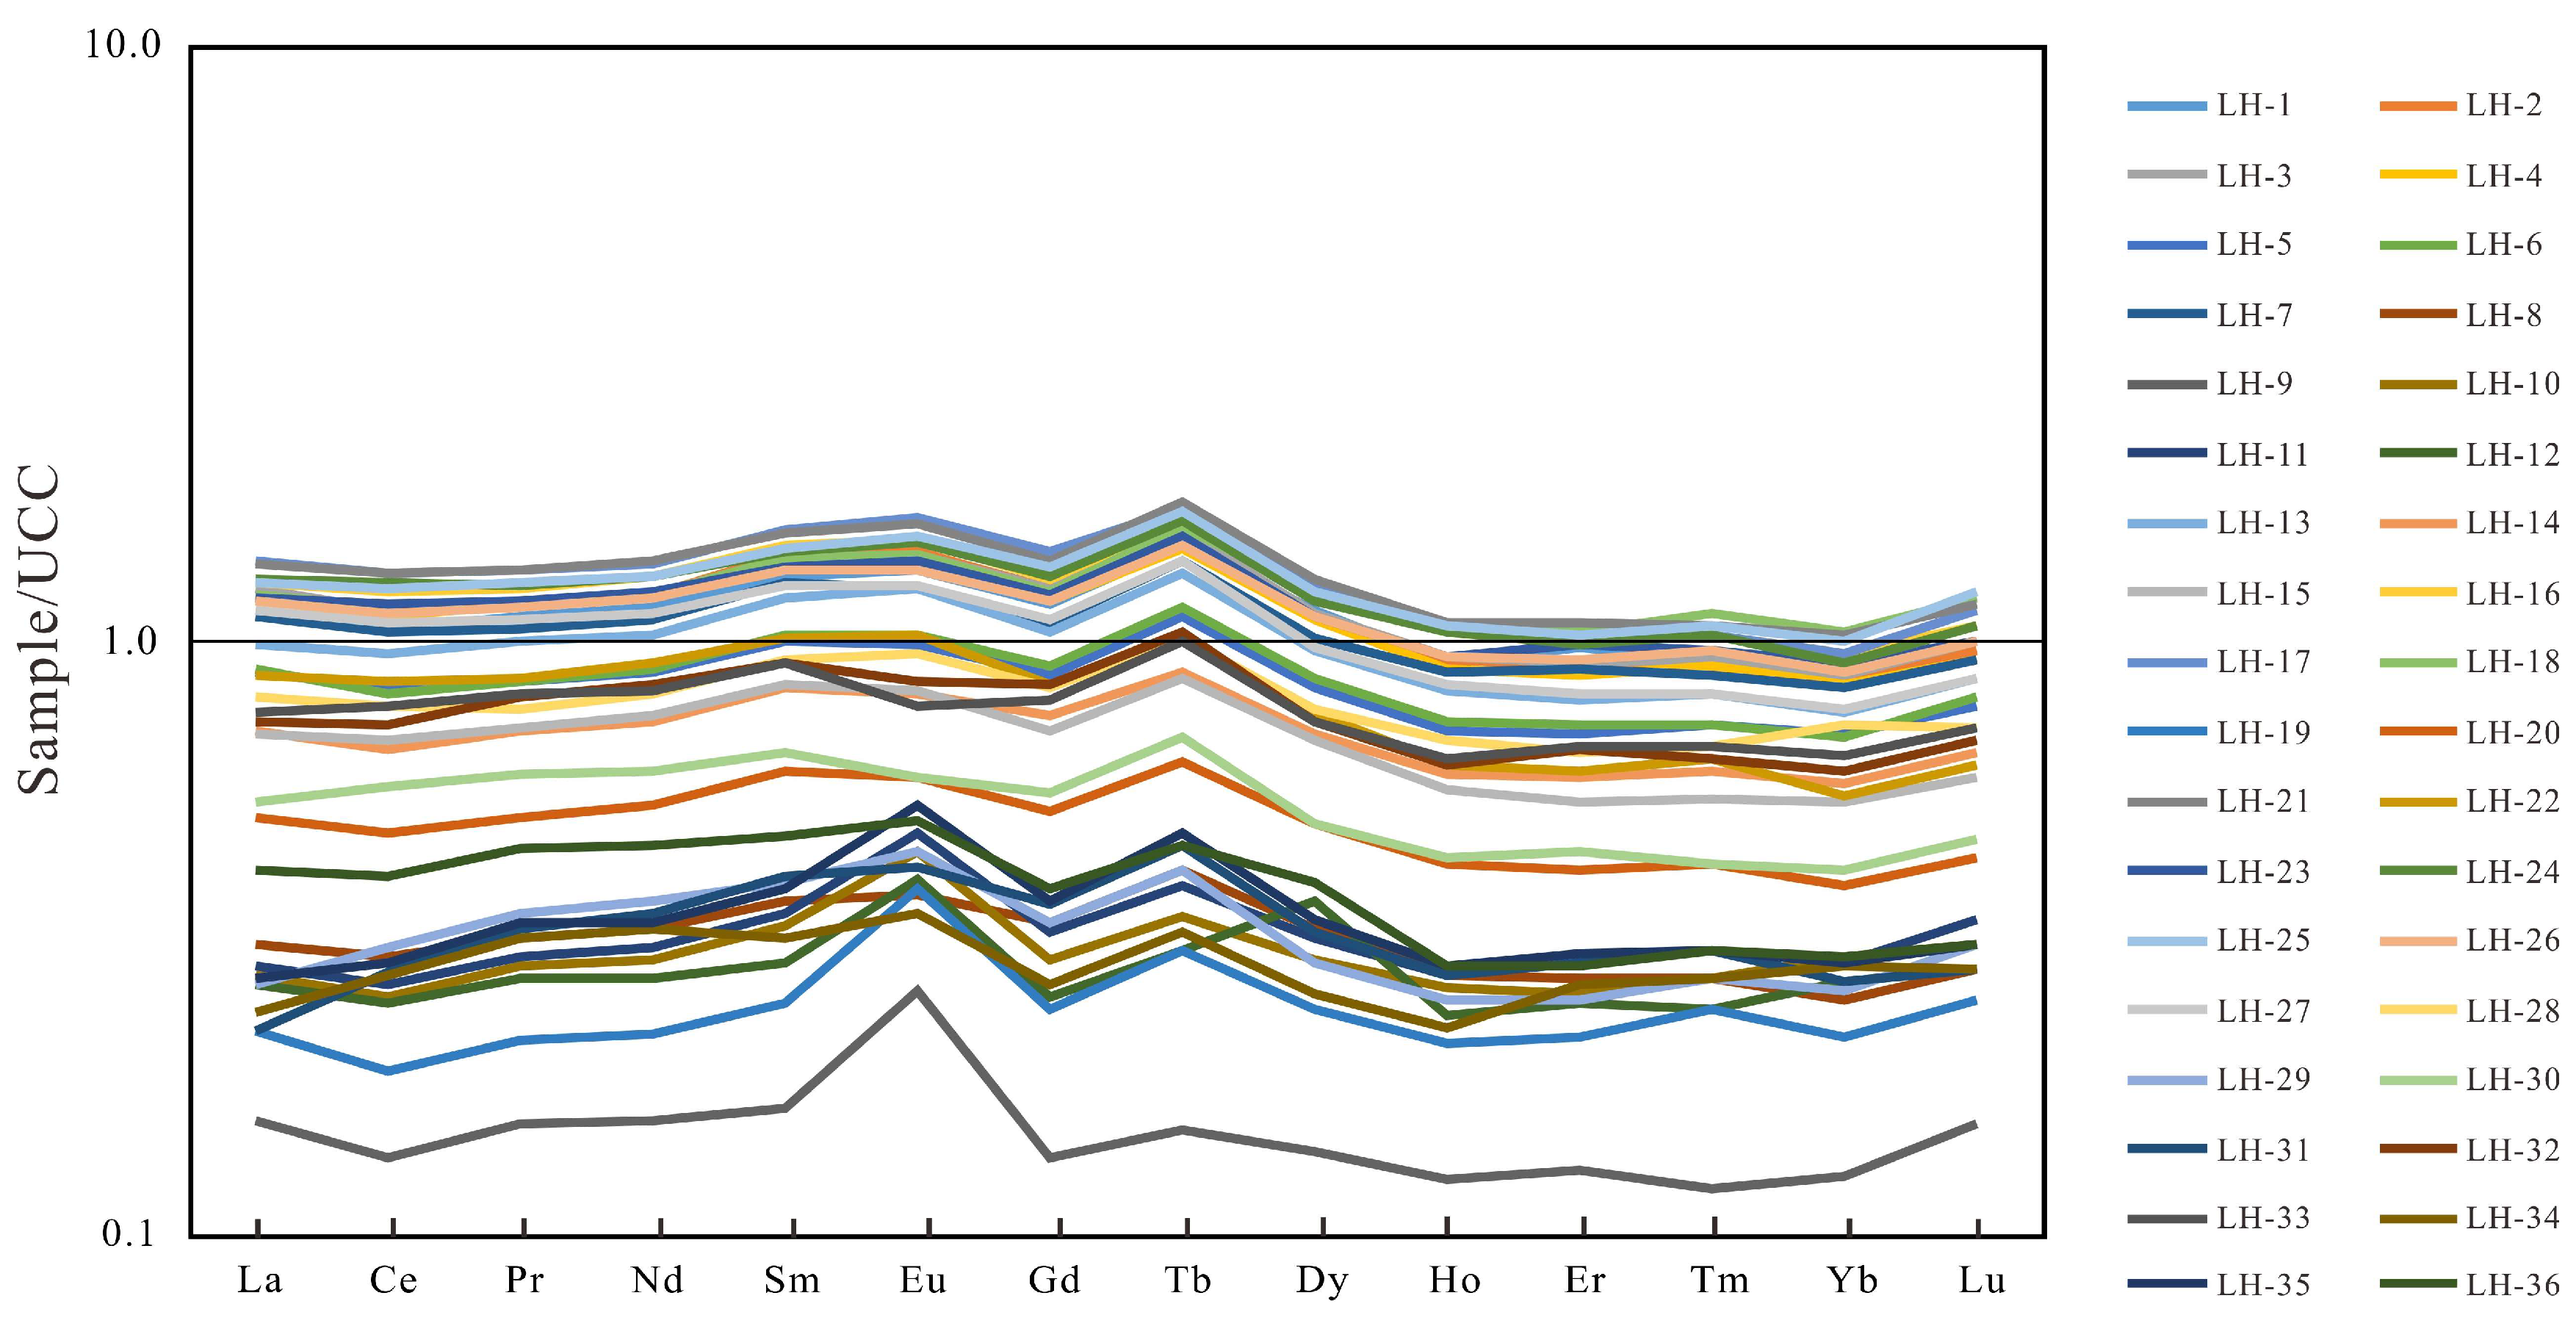
4.2.3. Rare Earth Elements
5. Discussion
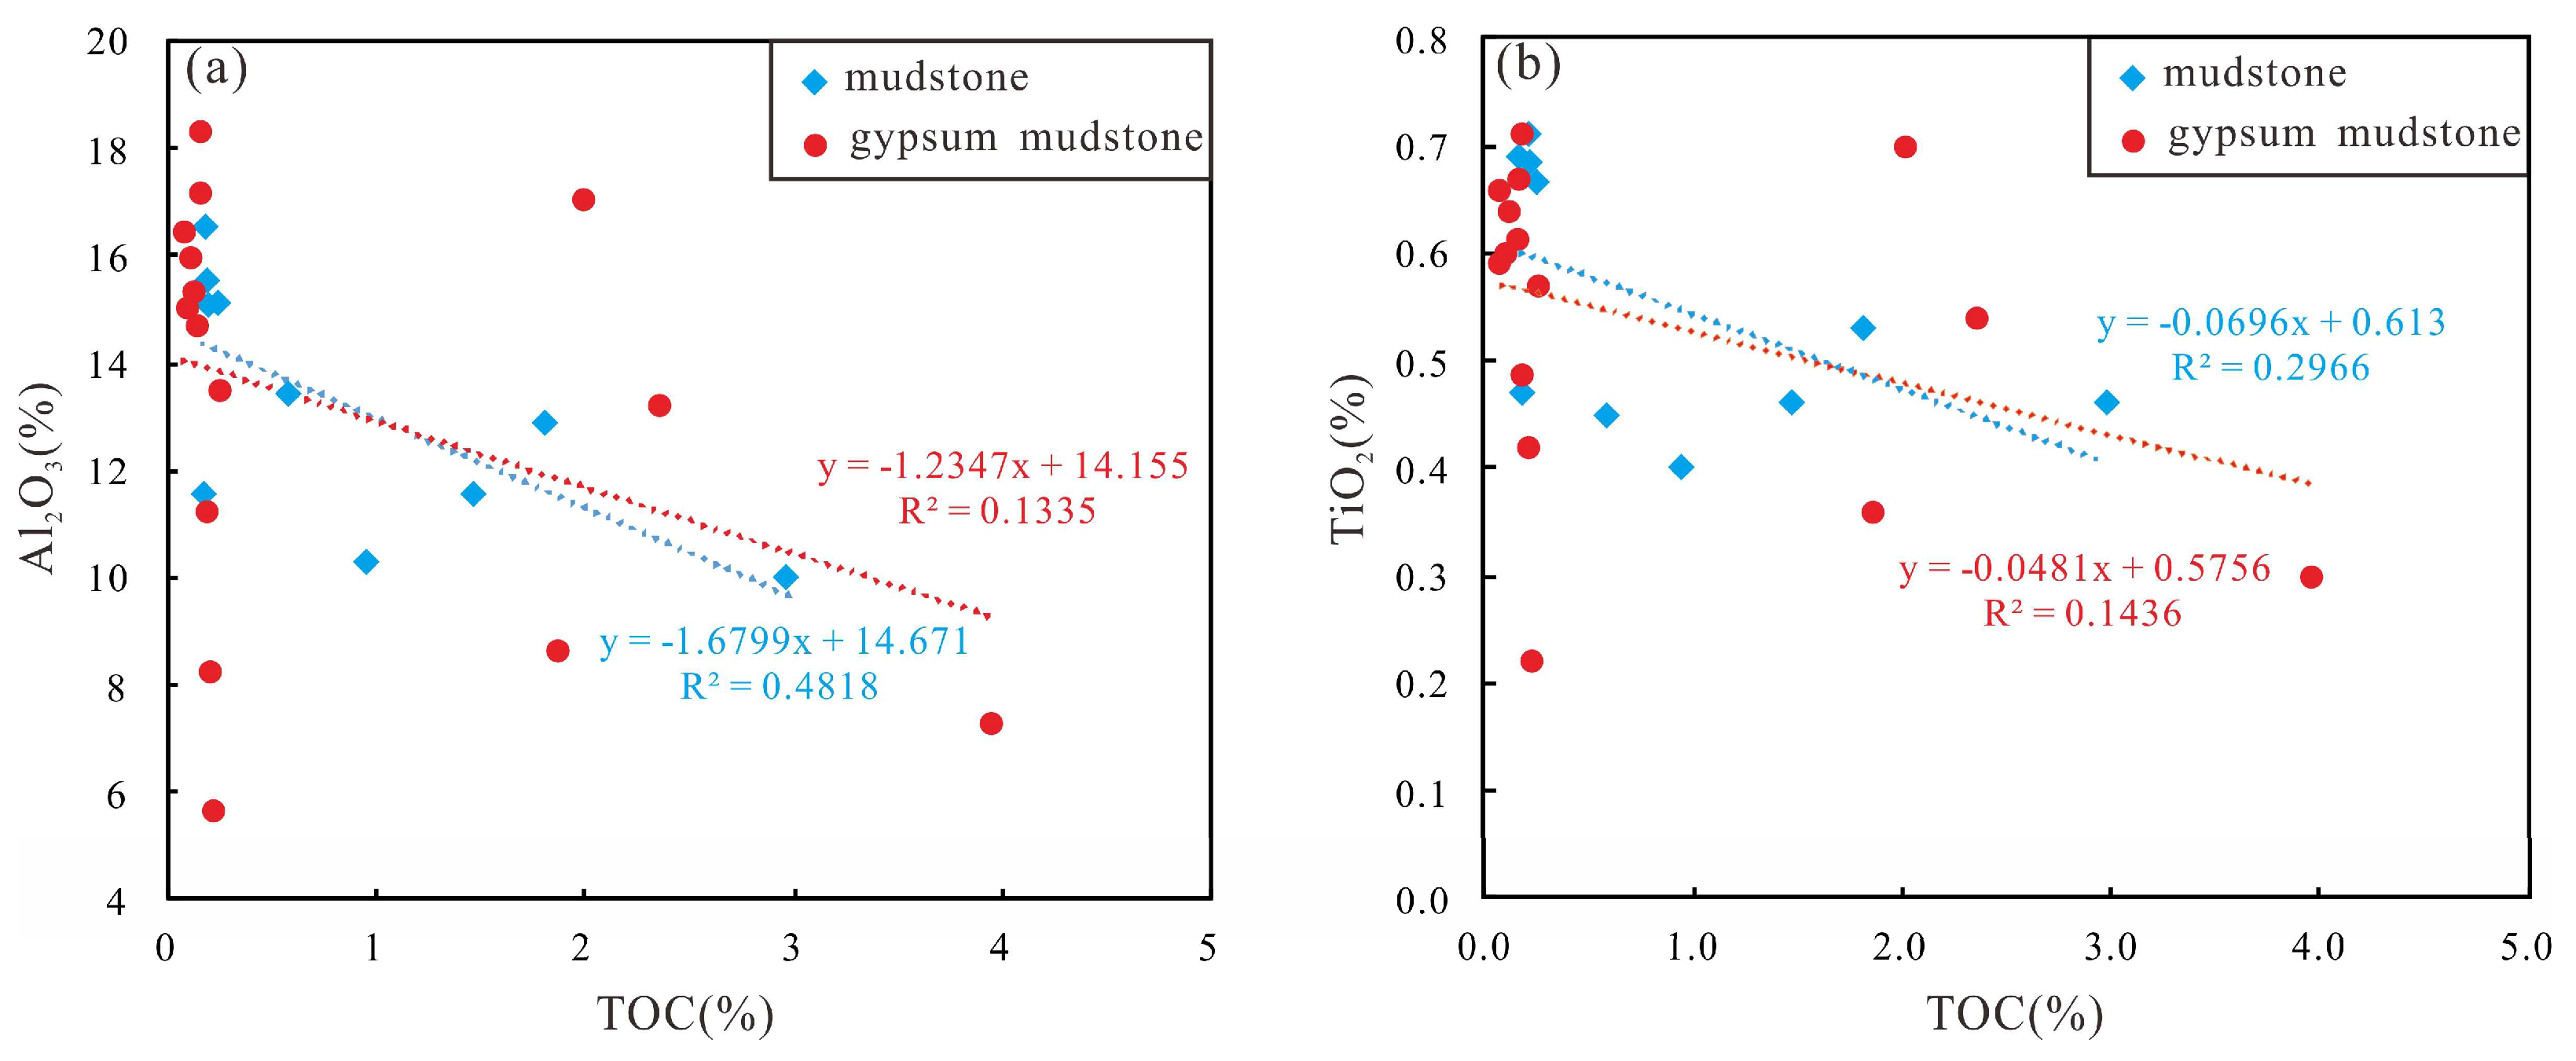
5.1. Terrigenous Input
5.2. Redox
5.3. Paleosalinity
5.4. Paleoclimate
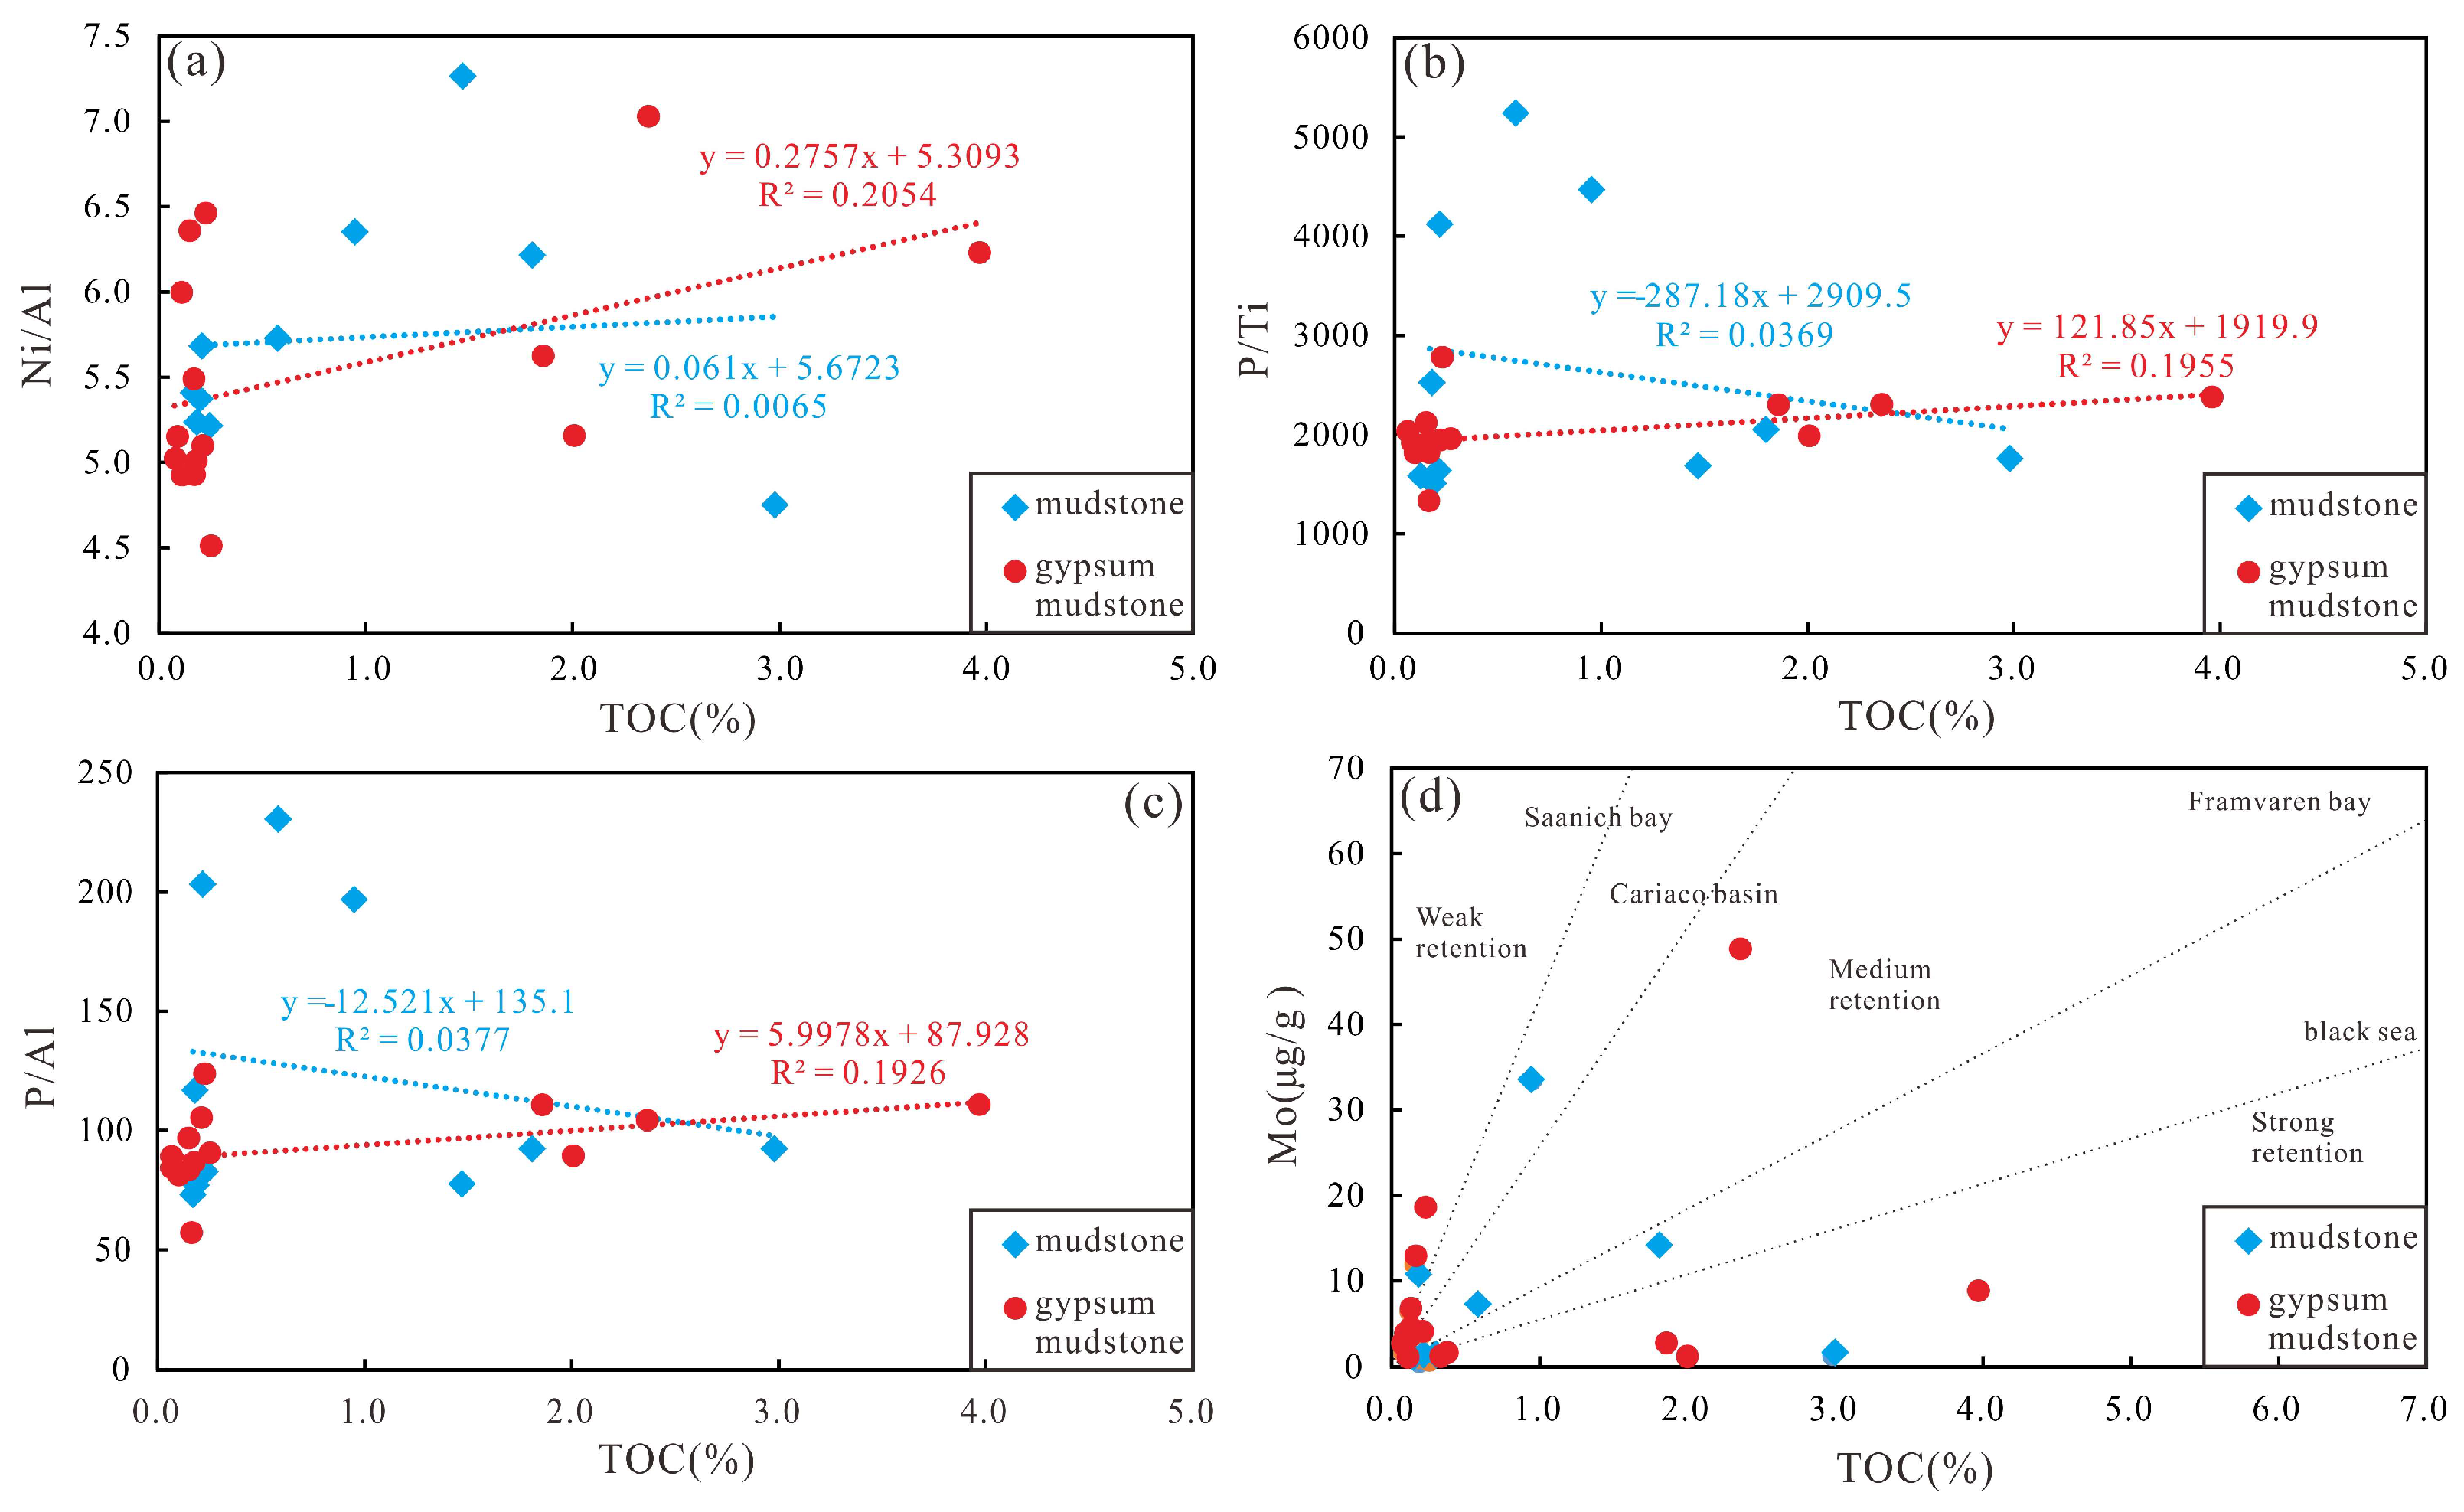
5.5. Paleoproductivity and Water Body Limitation
5.6. Sedimentation Rate and Paleowater Depth
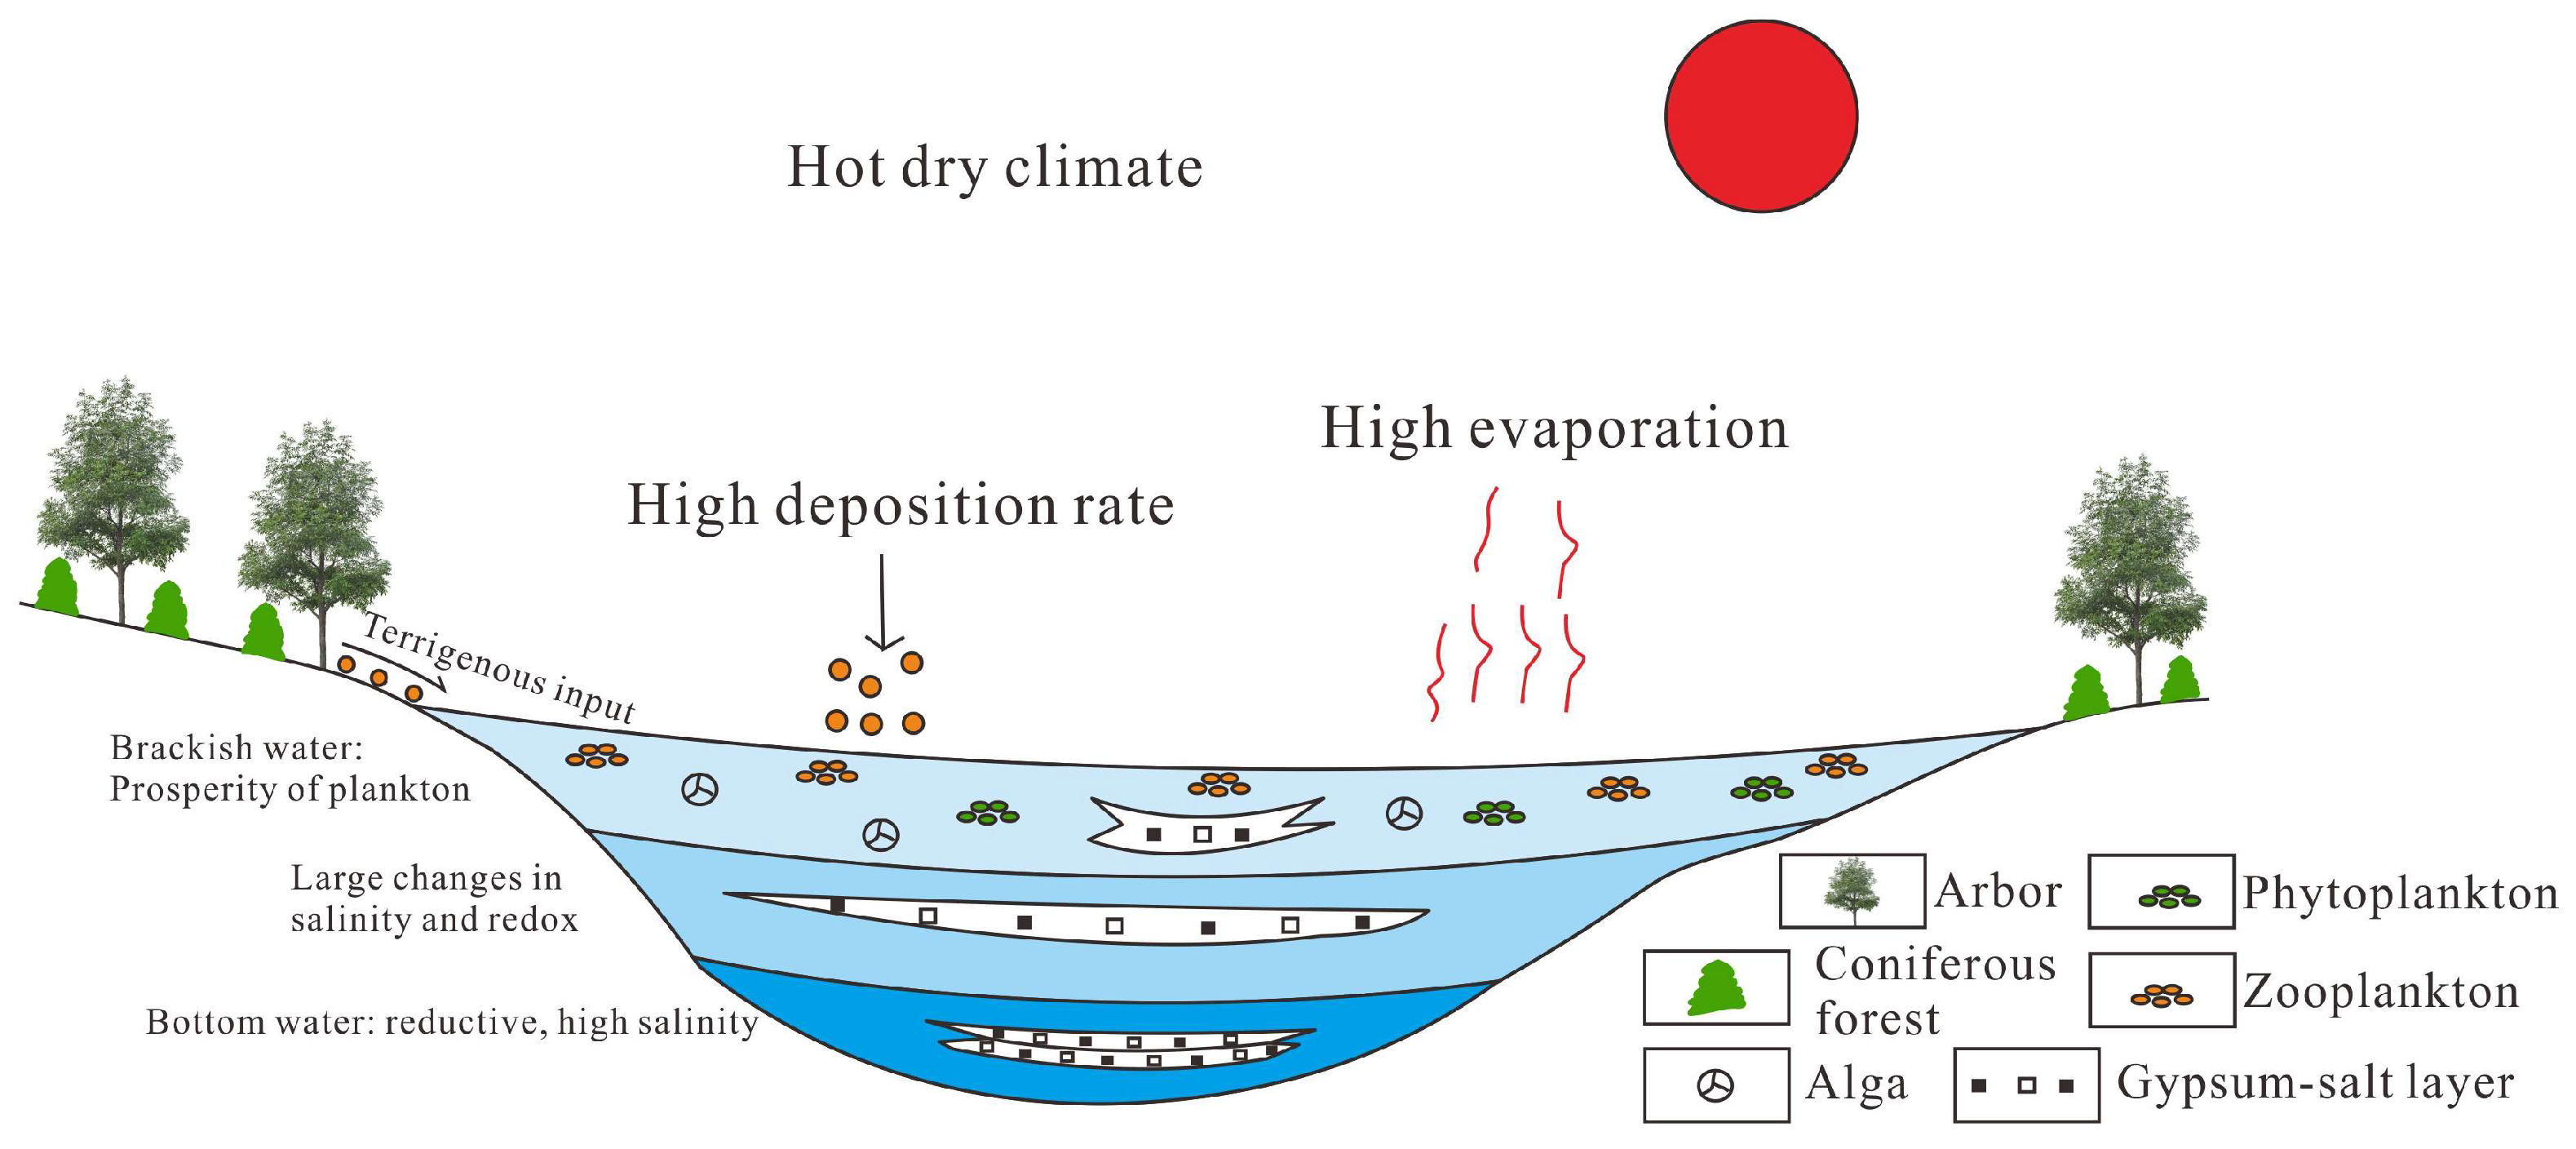
5.7. Enrichment Model
6. Conclusions
- The correlation between Al2O3 and TiO2 and TOC shows that terrestrial input is used as a diluent to reduce OM content, which is not conducive to enrichment. The effect of terrestrial input on mudstone dilution is greater than that of gypsum mudstone.
- Pr/Ph, Pr/nC17, Ph/nC18, δU, V/(V + Ni), Ce/La, UEF and MoEF represent redox. The source rocks of E3l were in a reduced environment, and there were weak changes in oxidation-reduction in the vertical direction. The more reducing the environment, the more conducive OM enrichment.
- GI, Sr/Ba, CaO/(CaO + Fe) and MgO/Al2O3 × 100 are used to qualitatively characterize paleosalinity, and B is used for quantitative calculation. Analysis results show that E3l was in a saline water environment, and there was water stratification on the profile. Paleosalinity promotes OM enrichment, which has a greater impact on gypsum mudstone.
- The paleoclimatic parameters of Sr/Cu, Mg/Ca, Rb/Sr, CIA and C indicate that the E3l was in a cold and dry environment, and the arid environment promotes the enrichment of OM, especially for mudstone.
- Paleoproductivity, water restriction and deposition rate are weakly correlated with TOC, and the water body is deeper.
Author Contributions
Funding
Data Availability Statement
Acknowledgments
Conflicts of Interest
References
- Rabbani, A.R.; Kotarba, M.J.; Baniasad, A.R.; Hosseiny, E.; Wieclaw, D. Geochemical characteristics and genetic types of the crude oils from the Iranian sector of the Persian Gulf. Org. Geochem. 2014, 70, 29–43. [Google Scholar] [CrossRef]
- Mashhadi, Z.S.; Rabbani, A.R. Organic geochemistry of crude oils and Cretaceous source rocks in the Iranian sector of the Persian Gulf: An oil–oil and oil–source rock correlation study. Int. J. Coal Geol. 2015, 146, 118–144. [Google Scholar] [CrossRef]
- Wang, Q.F.; Jiang, F.J.; Ji, H.C.; Jiang, S.; Liu, X.H.; Zhao, Z.; Wu, Y.Q.; Xiong, H.; Li, Y.; Wang, Z. Effects of paleosedimentary environment on organic matter enrichment in a saline lacustrine rift basin–A case study of Paleogene source rock in the Dongpu Depression, Bohai Bay Basin. J. Pet. Sci. Eng. 2020, 195, 107658. [Google Scholar] [CrossRef]
- Hennhoefer, D.; Zell, P.; Stinnesbeck, W. Environmental changes across the Jurassic–Cretaceous boundary in the western proto-Gulf of Mexico—Chemo- and biostratigraphic correlation of NE Mexican sections. Palaeogeogr. Palaeoclimatol. Palaeoecol. 2022, 587, 110794. [Google Scholar] [CrossRef]
- Copetti, D.; Guyennon, N.; Buzzi, F. Generation and dispersion of chemical and biological gradients in a large-deep multi-basin lake (Lake Como, north Italy): The joint effect of external drivers and internal wave motions. Sci. Total Environ. 2020, 749, 141587. [Google Scholar] [CrossRef]
- Liu, Y.; Yao, S.P.; Cao, J.; Xu, C.; Ma, X.X.; Zhang, B.L. Bio-environmental interactions and associated hydrocarbon generation in a saline lake basin: A case study of the Palaeogene interval in the Dongpu Sag, eastern China. J. Asian Earth Sci. 2022, 241, 105465. [Google Scholar] [CrossRef]
- Kifumbi, C.; Schere, C.M.S.; Ros, L.F.D.; Rocha, E.C.D.; Silva, T.F.S.; Angonese, B.S.; Michel, R.D.L. A Pennsylvanian saline-alkaline lake in Gondwana mid-latitude: Evidence from the Piauí Formation chert deposits, Parnaíba Basin, Brazil. Palaeogeogr. Palaeoclimatol. Palaeoecol. 2022, 603, 111192. [Google Scholar] [CrossRef]
- Amils, R.; Ellis-Evans, C. Hinghofer-Szalkay, H. Life in Extreme Environments. Nature 2007, 409, 1092. [Google Scholar]
- Warren, J.K. Evaporites: A Geological Compendium; Springer: New York, NY, USA, 2016. [Google Scholar]
- He, X.; Lu, J.G.; Li, W.Y.; Zhu, S.B.; Zhao, L.P.; Ma, Z.W.; Zhu, J.; Han, M.M.; Chen, S.J. Geochemical features of source rocks and oil in saline and freshwater lake environments: A case study in the southwest Qaidam Basin. J. Pet. Sci. Eng. 2022, 218, 110948. [Google Scholar] [CrossRef]
- Milleson, M.; Myers, T.S.; Tabor, N.J. Permo-carboniferous paleoclimate of the Congo Basin: Evidence from lithostratigraphy, clay mineralogy, and stable isotope geochemistry. Palaeogeogr. Palaeoclimatol. Palaeoecol. 2016, 441, 226–240. [Google Scholar] [CrossRef]
- Wang, Z.X.; Tang, Y.J.; Wang, Y.L.; Zheng, Y.H.; Chen, F.L.; Wu, S.Q.; Fu, D.L. Kinetics of shale oil generation from kerogen in saline basin and its exploration significance: An example from the Eocene Qianjiang Formation, Jianghan Basin, China. J. Anal. Appl. Pyrolysis 2020, 150, 104885. [Google Scholar] [CrossRef]
- Demaison, G.J.; Moore, G.T. Anoxic environments and oil source bed genesis. AAPG Bull. 1980, 64, 1179–1209. [Google Scholar] [CrossRef]
- Powell, T.G. Petroleum geochemistry and depositional setting of lacustrine source rocks. Mar. Pet. Geol. 1986, 3, 119–200. [Google Scholar] [CrossRef]
- Katz, B.J. Controls on distribution of lacustrine source rocks through time. AAPG Mem. 1990, 50, 132–139. [Google Scholar]
- Adegoke, A.K.; Abdullah, W.H.; Hakimi, M.H.; Sarki Yandoka, B.M. Geochemical characterisation and organic matter enrichment of Upper Cretaceous Gongila shales from Chad (Bornu) Basin, northeastern Nigeria. Bioprod. Versus Anoxia Cond. 2015, 135, 73–87. [Google Scholar] [CrossRef]
- Khaled, A.; Li, R.X.; Xi, S.L.; Zhao, B.S.; Wu, X.L.; Yu, Q.; Zhang, Y.; Li, D.L. Paleoenvironmental conditions and organic matter enrichment of the Late Paleoproterozoic Cuizhuang Formation dark shale in the Yuncheng Basin, North China. J. Pet. Sci. Eng. 2021, 208, 109627. [Google Scholar] [CrossRef]
- Murphy, A.E.; Sageman, B.B.; Hollander, D.J.; Lyons, T.W.; Brett, C.E.E. Black shale deposition and faunal overturn in the Devonian Appa-lachian Basin: Clastic starvation, seasonal water-column mixing, and efficient biolimiting nutrient recycling. Paleoceanography 2000, 15, 280–291. [Google Scholar] [CrossRef]
- Mort, H.; Jacquat, O.; Adatte, T.; Steinmann, P.; Follmi, K.; Matera, V.; Berner, Z.; Stuben, D. The Cenomanian/Turonian anoxic event at the Bonarelli Level in Italy and Spain: Enhanced productivity and/or better preservation? Cretac. Res. 2007, 28, 597–612. [Google Scholar] [CrossRef] [Green Version]
- Compton, J.S. Degree of supersaturation and precipitation of organogenic dolomite. Geology 1988, 16, 318–321. [Google Scholar] [CrossRef]
- Moradi, A.V.; Sari, A.; Akkaya, P. Geochemistry of the Miocene oil shale (Hancili Formation) in the Cankiri-Corum Basin, Central Turkey: Implications for Paleoclimate coditions, source-area wethering, provenance and tectonic setting. Sediment. Geol. 2016, 341, 289–303. [Google Scholar] [CrossRef]
- Longman, J.; Palmer, M.R.; Gernon, T.M.; Manners, H.R. The role of tephra in enhancing organic carbon preservation in marine sediments. Earth-Sci. Rev. 2019, 192, 480–490. [Google Scholar] [CrossRef]
- Kata, B.; Lin, F. Lacustrine basin unconventional resource plays: Key differences. Mar. Petrol. Geol. 2014, 56, 255–265. [Google Scholar] [CrossRef]
- Gradstein, F.M.; Ogg, J.G.; Smith, A.G.; Lourens, L.W.B. New Geological Time Scale, with Special Reference to Precambrian and Neogene. Episodes 2004, 27, 83–100. [Google Scholar] [CrossRef] [Green Version]
- Meng, Q.T.; Liu, Z.J.; Hu, F.; Sun, P.C.; Zhou, R.J.; Zhen, Z. Productivity of Eocene Ancient Lake and Enrichment Mechanism of Organic Matter in Huadian Basin. J. China Univ. Pet. 2012, 36, 38–44. (In Chinese) [Google Scholar]
- Tenger, T.; Liu, W.H.; Xu, Y.C. Comprehensive geochemical identification of highly evolved marine hydrocarbon source rocks: Organic matter, palaeoenvironment and development of effective hydrocarbon source rocks. Chin. J. Geochem. 2006, 25, 332–339. [Google Scholar] [CrossRef]
- Li, C.X.; Liu, Z.; Wang, S.C.; Xu, Z.Y.; Chen, S.G.; You, X.L.; Wang, B. Prediction of major source rocks distribution in the transition from depressed to rifted basin using seismic and geological data: The Guyang to Linhe Formations in the Linhe Depression, Hetao Basin, China. J. Pet. Sci. Eng. 2022, 214, 110472. [Google Scholar] [CrossRef]
- Zhang, R.F.; Lu, J.G.; Shi, Y.L.; Chen, S.G.; Zhou, R.R.; Zhao, R.Q.; Yuan, M.; Zhou, Y.X. Hydrocarbon potential and sedimentary environment of organic matter in source rocks of Linhe and Guyang Formations in Linhe depression, Hetao Basin. Arab. J. Geosci. 2022, 15, 1866–7511. [Google Scholar] [CrossRef]
- Zhao, R.Q.; Chen, S.J.; Fu, X.Y.; He, Z.T. Classification and source of crude oil in the Linhe Depression, Hetao Basin. Arab. J. Geosci. 2022, 15, 14. [Google Scholar] [CrossRef]
- Fu, S.T.; Fu, J.H.; Yu, J.; Yao, J.L.; Zhang, C.L.; Ma, Z.R.; Yang, Y.J.; Zhang, Y. Petroleum geological features and exploration prospect of Linhe Depression in Hetao Basin, China. Pet. Explor. Dev. 2018, 45, 803–817. [Google Scholar] [CrossRef]
- Yin, Y.Y.; Guo, Q.; Li, W.; Liang, P.G. Structural features and favourable areas of the Linhe depression in Hetao Basin, inner Mongolia. Miner. Explor. 2020, 11, 427–432. (In Chinese) [Google Scholar]
- Kong, Q.F.; Li, J.F.M.; Li, M.C.; Wu, K.; Sun, L. Geochemical Characteristics of Gas Source Rock and Generation-Evolution Model of Biogenic Gas in Hetao Basin. Nat. Gas Geosci. 2008, 19, 238–243, (In Chinese with English abstract). [Google Scholar]
- Zhang, R.F.; He, H.Q.; Chen, S.G.; Li, G.X.; Liu, X.H.; Guo, X.J.; Wang, S.C.; Fan, T.Z.; Wang, H.L.; Liu, J.; et al. New understandings of petroleum geology and great discovery in the Linhe depression, Hetao Basin. China Pet. Explor. 2020, 25, 1–12, (In Chinese with English abstract). [Google Scholar]
- Du, X.Y.; Ding, W.L.; Jiao, B.C.; Zhou, Z.C.; Xue, M.W.; Liu, T.S. Characteristics of hydrocarbon migration and accumulation in the Linhe-Jilantai area, Hetao Basin, China. Pet. Sci. Technol. 2019, 37, 2182–2189. [Google Scholar] [CrossRef]
- Ran, Y.K.; Zhang, P.Z.; Chen, L.C. Late Quaternary history of paleoseismicactivity along the Hohhot segment ofthe Daqingshan piedmont fault in Hetao depression zone. North China Ann. DI Geofis. 2003, 46, 1053–1069. [Google Scholar] [CrossRef]
- Xiao, Z.L.; Chen, S.J.; Liu, C.W.; Lu, Z.X.; Zhu, J.; Han, M.M. Lake basin evolution from early to Middle Permian and origin of Triassic Baikouquan oil in the western margin of Mahu Sag, Junggar Basin, China: Evidence from geochemistry. J. Pet. Sci. Eng. 2021, 203, 108612. [Google Scholar] [CrossRef]
- Su, K.M.; Chen, S.J.; Hou, Y.T.; Zhang, H.F.; Zhang, W.X.; Liu, G.L.; Hu, C.; Han, M.M. Geochemical characteristics, origin of the Chang 8 oil and natural gas in the southwestern Ordos Basin, China. J. Pet. Sci. Eng. 2021, 200, 108406. [Google Scholar] [CrossRef]
- Wang, Z.W.; Shen, L.J.; Wang, J.; Fu, X.G.; Xiao, Y.; Song, C.Y.; Zhan, W.Z. Organic matter enrichment of the Late Triassic Bagong Formation (Qiangtang Basin, Tibet) driven by paleoenvironment: Insights from elemental geochemistry and mineralogy. J. Asian Earth Sci. 2022, 236, 105329. [Google Scholar] [CrossRef]
- Sageman, B.B.; Murphy, A.E.; Werne, J.P.; Ver, C.A.; Straeten, D.J.; Hollander, T.W. Lyons A tale of shales: The relative roles of production, decomposition, and dilution in the accumulation of organic-rich strata, Middle–Upper Devonian, Appalachian basin. Chem. Geol. 2003, 195, 229–273. [Google Scholar] [CrossRef]
- Peters, K.; Cassa, M. Applied source rock geochemistry. In AAPG Memoir 60, the Petroleum System—From Source to Trap; Magoon, L., Dow, W., Eds.; AAPG: Tulsa, OK, USA, 1994; pp. 93–120. [Google Scholar]
- Singh, A.K.; Chakraborty, P.P. Geochemistry and hydrocarbon source rock potential of shales from the Palaeo-Mesoproterozoic Vindhyan Supergroup, central India. Energy Geosci. 2021, 4, 100073. [Google Scholar] [CrossRef]
- Ehsan, D. Geochemistry and origins of Sarvak oils in Abadan plain: Oil-oil correlation and migration studies. Energy Sources Part A Recovery Util. Environ. Eff. 2019, 43, 716–726. [Google Scholar] [CrossRef]
- Tissot, B.P.; Welte, D.G. Petroleum Formation and Occurrence, 2nd ed.; Springer: Berlin, Germany, 1984; p. 699. [Google Scholar]
- Tribovillard, N.; Algeo, T.W.; Lyons, T.; Riboulleau, A. Trace metals as paleoredox and paleoproductivity proxies: An update. Chem. Geol. 2006, 232, 12–32. [Google Scholar] [CrossRef]
- Algeo, T.J.; Tribovillard, N. Environmental analysis of paleoceanographic systems based on molybdenum–uranium covariation. Chem. Geol. 2009, 268, 211–225. [Google Scholar] [CrossRef]
- McLennan, S.M. Relationship between the trace element composition of sedimentary rocks and upper continental crust. G-cubed 2001, 2, 203–236. [Google Scholar] [CrossRef]
- Pourmand, A.; Dauphas, N.; Ireland, T.J. A novel extraction chromatography and MC-ICP-MS technique for rapid analysis of REE, Sc and Y: Revising CI-chondrite and Post-Archean Australian Shale (PAAS) abundances. Chem. Geol. 2012, 291, 38–54. [Google Scholar] [CrossRef]
- Zeng, J.H.; Lan, X.D.; Liu, H.; Wei, Y.S. Genesis and mechanisms of organic matter enrichment of the Hongshuizhuang Formation in the Zhoukoudian area of Jingxi sag, North China. J. Palaeogeogr. 2022, 11, 653–677. [Google Scholar] [CrossRef]
- Cheng, D.W.; Zhou, C.M.; Zhang, Z.J.; Yuan, X.J.; Liu, Y.H.; Chen, X.Y. Paleo-Environment Reconstruction of the Middle Permian Lucaogou Formation, Southeastern Junggar Basin, NW China: Implications for the Mechanism of Organic Matter. J. Earth Sci. 2022, 33, 963–976. [Google Scholar] [CrossRef]
- Hatch, J.R.; Leventhal, J.S. Relationship between inferred redox potential of the depositional environment and geochemistry of the Upper Pennsylvanian (Missourian) Stark Shale Member of the Dennis Limestone, Wabaunsee County, Kansas, USA. Chem. Geol. 1992, 99, 65–82. [Google Scholar] [CrossRef]
- Bom, M.H.H.; Ceolin, D.; Kochhann, K.G.D.; Krahl, G.; Fauth, G.; Bergue, C.T.; Savian, J.F.; Strohschoen Junior, O.; Simões, M.G.; Assine, M.L. Paleoenvironmental evolution of the Aptian Romualdo Formation, Araripe Basin, Northeastern Brazil. Global Planet. Change 2021, 203, 103528. [Google Scholar] [CrossRef]
- Mukhopadhyay, P.K.; Goodarzi, F.; Crandlemire, A.L. Comparison of coal composition and elemental distribution in selected seams of the Sydney and Stellarton Basins, Nova Scotia, Eastern Canada. Int. J. Coal Geol. 1998, 37, 113–141. [Google Scholar] [CrossRef]
- Lerman, A. Lakes: Chemistry, Geology, Physics; Springer: New York, NY, USA, 1978; p. 363. [Google Scholar]
- Nesbitt, H.; Young, G.M. Early Proterozoic climates and plate motions inferred from major element chemistry of lutites. Nature 1982, 299, 715–717. [Google Scholar] [CrossRef]
- Harris, N.B.; McMillan, J.M.; Knapp, L.J.; Mastalerz, M. Organic matter accumulation in the Upper Devonian Duvernay Formation, Western Canada Sedimentary Basin, from sequence stratigraphic analysis and geochemical proxies. Sediment. Geol. 2018, 376, 185–203. [Google Scholar] [CrossRef]
- Froelich, P.N.; Klinkhammer, G.; Bender, M.L. Early oxidation of organic matter in pelagic sediments of the eastern equatorial Atlantic: Suboxic diagenesis. Geochim. Cosmochim. Acta 1979, 43, 1075–1090. [Google Scholar] [CrossRef]
- Shanmugam, G. Significance of coniferous rain forests and related organic matter in generating commercial quantities of oil, Gippsland Basin, Australia. AAPG Bull. 1985, 69, 1241–1254. [Google Scholar] [CrossRef]
- Ten Haven, H.L.; de Leeuw, J.W.; Rullkötter, J.; Sinninghe Damsté, J.S. Restricted utility of the pristane/phytane ration as a palaeoenvironmental indicator. Nature 1987, 330, 641–643. [Google Scholar] [CrossRef] [Green Version]
- Summons, R.E.; Hope, J.M.; Swart, R.; Walter, M.R. Origin of Nama basin bitumen seeps: Petroleum derived from a Permian lacustrine source rock traversing southwestern Gondwana. Org. Geochem. 2008, 39, 589–607. [Google Scholar] [CrossRef]
- Sinninghe Damsté, J.S.; Kenig, F.; Koopmans, M.P.; Köster, J.; Schouten, S.; Hayes, J.M.; de Leeuw, J.W. Evidence for gammacerane as an indicator of water column stratification. Geochim. Cosmochim. Acta 1995, 59, 1895–1900. [Google Scholar] [CrossRef] [Green Version]
- Tribovillard, N.; Algeo, T.J.; Baudin, F.; Ribouleau, A. Analysis of marine environmental conditions based onmolybdenum–uranium covariation—Applications to Mesozoic paleoceanography. Chem. Geol. 2012, 324–325, 46–58. [Google Scholar] [CrossRef]
- Walker, C.T.; Price, N.B. Departure Curves for Computing Paleosalinity Boron in lilies and Shales. AAPG Bull. 1963, 47, 833–841. [Google Scholar] [CrossRef]
- Wei, W.; Algeo, T.J. Elemental Proxies for Paleosalinity Analysis of Ancient Shales and Mudrocks. Geochim. Cosmochim. Acta 2020, 287, 341–366. [Google Scholar] [CrossRef]
- Li, J.L.; Chen, D.J. A review of quantitative research methods of paleosalinity. Pet. Geol. Recovery Effic. 2003, 5, 1–3. (In Chinese) [Google Scholar]
- Dymond, J.; Suess, E.; Lyle, M. We used sediment traps to define the higher barium contents in the intermediate and combined our particle flux data with existing water linkages to ocean productivity and the degree of Paleoceanography. Palaeogeogr. Palaeoclimatol. Palaeoecol. 1992, 7, 163–181. [Google Scholar] [CrossRef] [Green Version]
- Algeo, T.J.; Ingall, E. Sedimentary Corg: P ratios, paleocean ventilation, and phanerozoic atmospheric pO2. Palaeogeogr. Palaeoclimatol. Palaeoecol. 2007, 256, 130–155. [Google Scholar] [CrossRef]
- Wu, Z.P.; Zhou, Y.Q. Using the characteristic elements from meteoritic must in strata to calculate sedimentation rate. Acta Sedimentol. Sin. 2000, 8, 395–399. (In Chinese) [Google Scholar]
- Li, C.; Chen, S.J.; Liao, J.B.; Hou, Y.T.; Yu, J.; Liu, G.L.; Xu, K.; Wu, X.T. Geochemical characteristics of the Chang 7 Member in the southwestern Ordos Basin, China: The influence of sedimentary environment on the organic matter enrichment. Palaeoworld 2022, 32, 429–441. [Google Scholar] [CrossRef]


| Well | Lithology | Depth (m) | Pr/Ph | Pr/nC17 | Ph/nC18 | GI | S1 (mg/g) | S2 (mg/g) | Tmax (°C) | TOC (%) | HI (mg HC/g TOC) |
|---|---|---|---|---|---|---|---|---|---|---|---|
| H1 | mudstone | 3340 | 0.23 | 0.31 | 3.79 | 1.22 | 0.31 | 2.13 | 424 | 0.79 | 269.62 |
| H1 | mudstone | 3362 | 0.26 | 0.13 | 1.52 | 0.84 | 0.75 | 14.63 | 416 | 2.97 | 492.59 |
| H1 | mudstone | 3365 | 0.30 | 0.45 | 1.38 | 1.36 | 0.75 | 12.10 | 418 | 1.20 | 1008.33 |
| H1 | mudstone | 3369 | 0.14 | 0.82 | 6.28 | 1.27 | 0.38 | 10.01 | 420 | 1.90 | 526.84 |
| H1 | mudstone | 3371 | 0.19 | 0.50 | 3.38 | 1.35 | 0.28 | 1.82 | 427 | 0.74 | 245.95 |
| H1 | mudstone | 3472 | 0.34 | 0.48 | 1.50 | 1.82 | 0.61 | 1.52 | 427 | 0.80 | 190.00 |
| H1 | gypsum mudstone | 3450 | 0.23 | 0.69 | 4.63 | 1.01 | 0.16 | 1.05 | 424 | 1.52 | 68.90 |
| H1 | gypsum mudstone | 3462 | 0.38 | 0.49 | 2.86 | 0.95 | 0.09 | 0.51 | 416 | 1.98 | 25.76 |
| H1 | gypsum mudstone | 3580 | 0.20 | 0.41 | 4.29 | 1.10 | 1.00 | 0.86 | 426 | 0.63 | 136.51 |
| H1 | gypsum mudstone | 3710 | 0.23 | 0.43 | 4.18 | 0.99 | 0.13 | 1.26 | 428 | 0.64 | 196.88 |
| H2 | mudstone | 3635 | 0.20 | 0.26 | 5.19 | 0.59 | 0.10 | 0.97 | 419 | 0.51 | 189.51 |
| H2 | mudstone | 3758 | 0.20 | 0.26 | 4.80 | 0.87 | 0.17 | 2.66 | 423 | 0.81 | 328.65 |
| H2 | mudstone | 3855 | 0.30 | 0.53 | 2.78 | 0.91 | 0.36 | 4.25 | 419 | 1.18 | 360.25 |
| H2 | gypsum mudstone | 3930 | 0.25 | 0.43 | 3.05 | 0.90 | 0.17 | 2.08 | 429 | 0.69 | 301.74 |
| H2 | gypsum mudstone | 4015 | 0.27 | 0.65 | 3.18 | 1.14 | 0.17 | 1.71 | 425 | 0.55 | 311.67 |
| H2 | gypsum mudstone | 4130 | 0.34 | 0.53 | 2.38 | 0.93 | 0.20 | 1.98 | 428 | 1.58 | 125.41 |
| H3 | mudstone | 4197 | 0.31 | 0.32 | 1.96 | 0.57 | 0.08 | 0.26 | 422 | 0.11 | 232.61 |
| H3 | mudstone | 4215 | 0.21 | 0.27 | 3.50 | 0.54 | 0.13 | 0.92 | 424 | 0.44 | 206.31 |
| H3 | mudstone | 4236 | 0.66 | 0.39 | 1.68 | 0.29 | 0.04 | 0.11 | 432 | 0.22 | 51.06 |
| H3 | mudstone | 4238.2 | 0.87 | 0.66 | 1.43 | 0.60 | 0.08 | 1.64 | 435 | 0.61 | 269.38 |
| H3 | gypsum mudstone | 4238.4 | 0.52 | 0.32 | 0.52 | 0.28 | 0.10 | 0.86 | 417 | 0.44 | 196.99 |
| H3 | gypsum mudstone | 4238.8 | 0.42 | 0.42 | 1.42 | 0.16 | 0.11 | 0.27 | 412 | 0.23 | 119.39 |
| H3 | gypsum mudstone | 4242.9 | 0.26 | 0.35 | 0.89 | 1.07 | 0.27 | 0.32 | 421 | 0.14 | 228.43 |
| H3 | gypsum mudstone | 4243 | 0.46 | 0.28 | 0.56 | 0.55 | 0.21 | 1.20 | 426 | 0.49 | 243.46 |
| H3 | gypsum mudstone | 4328 | 0.45 | 0.35 | 0.81 | 0.23 | 0.53 | 4.62 | 424 | 1.43 | 323.35 |
| H3 | mudstone | 4380 | 0.37 | 0.50 | 1.42 | 0.91 | 0.73 | 3.91 | 421 | 1.65 | 236.93 |
| H3 | mudstone | 4470 | 0.38 | 0.66 | 1.81 | 0.94 | 0.27 | 1.33 | 418 | 0.69 | 191.62 |
| H3 | mudstone | 4535 | 0.38 | 0.54 | 1.51 | 1.86 | 0.19 | 0.60 | 417 | 0.35 | 172.31 |
| H3 | mudstone | 4600 | 0.48 | 0.73 | 1.60 | 1.51 | 0.15 | 0.68 | 418 | 0.46 | 147.83 |
| H3 | mudstone | 4670 | 0.47 | 0.66 | 1.40 | 1.08 | 0.17 | 0.78 | 419 | 0.48 | 162.50 |
| H4 | mudstone | 4455 | 0.64 | 0.42 | 0.94 | 0.30 | 0.08 | 0.38 | 422 | 0.61 | 61.37 |
| H4 | mudstone | 4580 | 0.50 | 0.50 | 1.28 | 0.33 | 0.11 | 0.48 | 421 | 0.52 | 91.87 |
| H4 | gypsum mudstone | 4655 | 0.42 | 0.75 | 2.04 | 0.57 | 1.35 | 13.24 | 434 | 3.02 | 438.30 |
| H4 | gypsum mudstone | 4750 | 0.34 | 0.39 | 1.11 | 1.23 | 1.25 | 9.20 | 432 | 1.29 | 712.97 |
| H4 | gypsum mudstone | 4815 | 0.59 | 0.84 | 1.48 | 0.73 | 0.09 | 1.24 | 434 | 0.56 | 222.97 |
| H5 | mudstone | 4027 | 0.31 | 0.24 | 2.35 | 0.71 | 0.89 | 18.76 | 431 | 2.91 | 644.54 |
| H5 | mudstone | 4272 | 0.32 | 0.46 | 2.98 | 0.63 | 0.16 | 2.39 | 427 | 0.88 | 270.77 |
| H5 | gypsum mudstone | 4397 | 0.31 | 0.65 | 2.38 | 0.67 | 0.52 | 10.29 | 429 | 2.08 | 494.61 |
| H5 | gypsum mudstone | 4445 | 0.23 | 0.64 | 2.66 | 0.80 | 0.14 | 1.19 | 425 | 0.67 | 178.89 |
| H5 | gypsum mudstone | 4497 | 0.41 | 0.69 | 1.94 | 0.90 | 0.07 | 0.55 | 427 | 0.42 | 131.81 |
| H5 | gypsum mudstone | 4553 | 0.35 | 0.70 | 2.00 | 0.88 | 0.10 | 1.26 | 427 | 0.64 | 197.21 |
| H5 | mudstone | 4650 | 0.43 | 0.75 | 1.82 | 1.24 | 0.11 | 1.00 | 418 | 0.53 | 187.18 |
| Number of samples | Depth (m) | Lithology | TOC (%) | SiO2 (%) | Al2O3 (%) | CaO (%) | MgO (%) | TFe2O 3(%) | K2O (%) | Na2O (%) | TiO2 (%) | P2O5 (%) | Al2O3 + K2O + Na2O (%) |
|---|---|---|---|---|---|---|---|---|---|---|---|---|---|
| LH-1 | 4999.8 | mudstone | 0.219 | 51.38 | 15.12 | 7.26 | 3.72 | 5.41 | 3.45 | 1.60 | 0.67 | 0.35 | 20.17 |
| LH-2 | 5000.33 | mudstone | 0.186 | 56.23 | 15.54 | 5.50 | 2.84 | 5.25 | 3.52 | 1.66 | 0.71 | 0.14 | 20.72 |
| LH-3 | 5000.8 | mudstone | 0.21 | 53.67 | 15.10 | 5.99 | 2.66 | 6.21 | 3.28 | 1.94 | 0.68 | 0.14 | 20.32 |
| LH-4 | 5001.13 | mudstone | 0.17 | 53.97 | 16.48 | 4.89 | 2.86 | 6.05 | 3.67 | 1.92 | 0.69 | 0.14 | 22.07 |
| LH-5 | 5001.87 | mudstone | 0.18 | 38.47 | 11.59 | 10.90 | 7.96 | 4.93 | 2.58 | 1.62 | 0.47 | 0.15 | 15.79 |
| LH-6 | 5002.5 | mudstone | 0.95 | 33.90 | 10.32 | 13.40 | 9.05 | 4.47 | 2.36 | 1.34 | 0.40 | 0.23 | 14.02 |
| LH-7 | 5002.9 | mudstone | 1.81 | 43.21 | 12.86 | 11.60 | 3.93 | 5.22 | 2.82 | 1.86 | 0.53 | 0.14 | 17.54 |
| LH-8 | 5003.57 | mudstone | 0.583 | 13.33 | 3.40 | 27.0 | 8.81 | 1.71 | 0.73 | 0.65 | 0.14 | 0.09 | 4.78 |
| LH-9 | 5004.15 | sandstone | 62.21 | 4.89 | 11.00 | 0.38 | 1.24 | 1.66 | 1.42 | 0.08 | 0.01 | 7.97 | |
| LH-10 | 5004.68 | sandstone | 77.29 | 6.77 | 2.70 | 0.74 | 2.04 | 1.99 | 2.16 | 0.23 | 0.02 | 10.92 | |
| LH-11 | 5005.35 | sandstone | 78.69 | 7.01 | 2.53 | 1.23 | 1.88 | 1.99 | 2.25 | 0.23 | 0.02 | 11.25 | |
| LH-12 | 5006.25 | sandstone | 79.47 | 6.92 | 2.10 | 1.09 | 2.13 | 2.07 | 2.29 | 0.20 | 0.02 | 11.28 | |
| LH-13 | 5233.06 | gypsum-bearing argillaceous siltstone | 2.36 | 46.33 | 13.21 | 6.37 | 4.77 | 5.70 | 3.07 | 1.43 | 0.54 | 0.17 | 17.71 |
| LH-14 | 5233.2 | gypsum-bearing argillaceous siltstone | 1.86 | 29.54 | 8.51 | 13.65 | 11.50 | 3.61 | 2.00 | 0.95 | 0.36 | 0.11 | 11.46 |
| LH-15 | 5233.6 | gypsum-bearing argillaceous siltstone | 0.213 | 37.53 | 8.24 | 16.35 | 3.60 | 3.29 | 1.78 | 1.36 | 0.42 | 0.10 | 11.38 |
| LH-16 | 5234.1 | gypsum mudstone | 0.166 | 54.80 | 18.29 | 1.25 | 4.31 | 6.81 | 4.76 | 1.24 | 0.71 | 0.12 | 24.29 |
| LH-17 | 5234.5 | gypsum mudstone | 2.01 | 52.64 | 16.96 | 2.45 | 5.31 | 6.62 | 3.88 | 1.35 | 0.70 | 0.18 | 22.19 |
| LH-18 | 5234.8 | gypsum mudstone | 0.151 | 45.81 | 14.68 | 5.74 | 6.16 | 6.55 | 3.49 | 1.18 | 0.61 | 0.16 | 19.35 |
| LH-19 | 5235.5 | sandstone | 61.60 | 4.78 | 9.48 | 4.02 | 1.52 | 1.34 | 1.44 | 0.11 | 0.02 | 7.56 | |
| LH-20 | 5236.17 | gypsum mudstone | 0.228 | 17.64 | 5.66 | 13.65 | 19.05 | 3.29 | 1.30 | 0.57 | 0.22 | 0.09 | 7.53 |
| LH-21 | 5236.73 | gypsum mudstone | 0.161 | 49.58 | 17.14 | 3.48 | 5.29 | 6.92 | 3.96 | 1.28 | 0.67 | 0.16 | 22.38 |
| LH-22 | 5237.2 | gypsum mudstone | 0.169 | 34.07 | 11.35 | 14.75 | 4.63 | 4.29 | 2.63 | 0.89 | 0.48 | 0.11 | 14.87 |
| LH-23 | 5237.82 | gypsum mudstone | 0.0763 | 46.18 | 15.04 | 5.86 | 7.09 | 5.89 | 3.46 | 1.20 | 0.59 | 0.16 | 19.70 |
| LH-24 | 5238.1 | gypsum mudstone | 0.111 | 46.60 | 15.97 | 4.77 | 6.17 | 6.41 | 3.69 | 1.21 | 0.64 | 0.16 | 20.87 |
| LH-25 | 5238.55 | gypsum mudstone | 0.0895 | 49.01 | 16.45 | 4.05 | 5.88 | 6.00 | 3.91 | 1.16 | 0.65 | 0.15 | 21.52 |
| LH-26 | 5239.1 | gypsum mudstone | 0.119 | 45.54 | 15.19 | 6.52 | 6.17 | 5.53 | 3.53 | 1.11 | 0.60 | 0.15 | 19.83 |
| LH-27 | 5239.48 | gypsum mudstone | 0.254 | 43.06 | 13.51 | 9.06 | 6.39 | 5.28 | 3.08 | 1.10 | 0.57 | 0.14 | 17.69 |
| LH-28 | 5239.9 | sandstone | 35.03 | 10.61 | 14.15 | 6.73 | 4.44 | 2.39 | 0.87 | 0.44 | 0.12 | 13.87 | |
| LH-29 | 5240.45 | sandstone | 65.40 | 6.52 | 7.69 | 2.18 | 1.55 | 1.48 | 1.70 | 0.25 | 0.03 | 9.70 | |
| LH-30 | 5241.19 | gypsum mudstone | 3.97 | 23.78 | 7.38 | 18.60 | 11.80 | 3.07 | 1.76 | 0.64 | 0.30 | 0.09 | 9.78 |
| LH-31 | 5241.6 | sandstone | 52.43 | 5.10 | 13.15 | 3.16 | 1.59 | 1.55 | 1.16 | 0.22 | 0.03 | 7.81 | |
| LH-32 | 5242.37 | sandy mudstone | 2.98 | 63.16 | 10.03 | 4.39 | 4.70 | 3.43 | 2.36 | 1.71 | 0.46 | 0.10 | 14.10 |
| LH-33 | 5243.5 | mudstone | 1.47 | 35.82 | 11.56 | 10.80 | 9.42 | 4.54 | 2.89 | 0.99 | 0.46 | 0.10 | 15.44 |
| LH-34 | 5244.1 | sandstone | 77.15 | 5.18 | 4.40 | 0.23 | 1.67 | 1.87 | 1.33 | 0.41 | 0.02 | 8.38 | |
| LH-35 | 5244.5 | sandstone | 72.28 | 6.91 | 4.45 | 3.16 | 1.78 | 2.24 | 1.68 | 0.21 | 0.03 | 10.83 | |
| LH-36 | 5246.1 | sandstone | 77.02 | 7.89 | 2.19 | 1.14 | 2.08 | 2.56 | 1.89 | 0.26 | 0.03 | 12.34 | |
| UCC | 66.00 | 15.20 | 4.20 | 2.20 | 5.08 | 3.40 | 3.90 | 0.65 | 0.15 | 22.50 |
| Number of samples | Lithology | Depth (m) | V | Cr | Co | Ni | Cu | Sr | Mo | Th | U | Ba | Al | Mg | Fe | P | Rb | Ca | Mn | K | Na | Ti |
|---|---|---|---|---|---|---|---|---|---|---|---|---|---|---|---|---|---|---|---|---|---|---|
| μg/g | μg/g | μg/g | μg/g | μg/g | μg/g | μg/g | μg/g | μg/g | μg/g | % | % | % | μg/g | μg/g | % | μg/g | % | % | % | |||
| LH-1 | mudstone | 4999.8 | 112 | 78 | 16.20 | 39.20 | 29.80 | 222 | 0.96 | 13.65 | 3.50 | 540 | 7.53 | 2.13 | 3.78 | 1530 | 130.50 | 5.20 | 899 | 2.91 | 1.18 | 0.37 |
| LH-2 | mudstone | 5000.33 | 102 | 75 | 17.60 | 39.50 | 36.00 | 184 | 0.42 | 13.35 | 2.30 | 400 | 7.54 | 1.58 | 3.51 | 580 | 125.00 | 3.85 | 444 | 2.88 | 1.19 | 0.39 |
| LH-3 | mudstone | 5000.8 | 106 | 76 | 18.30 | 42.70 | 38.90 | 193 | 1.23 | 13.35 | 2.80 | 420 | 7.52 | 1.50 | 4.29 | 610 | 123.00 | 4.30 | 443 | 2.74 | 1.39 | 0.38 |
| LH-4 | mudstone | 5001.13 | 114 | 78 | 18.40 | 43.00 | 42.00 | 166 | 0.73 | 13.35 | 2.50 | 400 | 7.91 | 1.55 | 4.04 | 590 | 124.50 | 3.42 | 386 | 3.01 | 1.36 | 0.37 |
| LH-5 | mudstone | 5001.87 | 102 | 60 | 15.00 | 31.00 | 37.50 | 349 | 10.75 | 9.93 | 9.20 | 370 | 5.74 | 4.66 | 3.38 | 670 | 99.50 | 7.72 | 668 | 2.17 | 1.17 | 0.27 |
| LH-6 | mudstone | 5002.5 | 103 | 57 | 14.40 | 33.90 | 36.40 | 267 | 33.40 | 9.23 | 11.00 | 600 | 5.34 | 5.50 | 3.17 | 1050 | 95.20 | 9.53 | 759 | 2.06 | 1.01 | 0.23 |
| LH-7 | mudstone | 5002.9 | 106 | 65 | 17.10 | 40.40 | 53.70 | 641 | 14.15 | 11.55 | 12.20 | 570 | 6.51 | 2.27 | 3.67 | 600 | 115.50 | 8.27 | 582 | 2.40 | 1.39 | 0.30 |
| LH-8 | mudstone | 5003.57 | 30 | 27 | 4.60 | 10.20 | 10.80 | 1000 | 7.27 | 2.78 | 6.60 | 300 | 1.78 | 5.29 | 1.25 | 410 | 28.80 | 19.35 | 535 | 0.63 | 0.53 | 0.08 |
| LH-9 | sandstone | 5004.15 | 8 | 10 | 1.40 | 3.30 | 4.00 | 1360 | 5.16 | 1.42 | 0.60 | 440 | 2.50 | 0.22 | 0.86 | 40 | 46.90 | 8.17 | 87 | 1.41 | 1.07 | 0.05 |
| LH-10 | sandstone | 5004.68 | 18 | 31 | 2.60 | 6.90 | 6.00 | 335 | 1.51 | 2.48 | 0.80 | 660 | 3.42 | 0.41 | 1.50 | 100 | 54.30 | 2.03 | 213 | 1.67 | 1.61 | 0.13 |
| LH-11 | sandstone | 5005.35 | 19 | 24 | 2.50 | 6.30 | 6.00 | 229 | 0.81 | 2.63 | 0.90 | 630 | 3.52 | 0.71 | 1.27 | 100 | 53.30 | 1.90 | 259 | 1.67 | 1.70 | 0.13 |
| LH-12 | sandstone | 5006.25 | 17 | 24 | 2.30 | 6.10 | 6.20 | 205 | 0.73 | 2.39 | 0.70 | 730 | 3.46 | 0.63 | 1.46 | 70 | 55.60 | 1.55 | 238 | 1.71 | 1.68 | 0.12 |
| LH-13 | gypsum-bearing argillaceous siltstone | 5233.06 | 150 | 73 | 21.00 | 46.50 | 53.80 | 820 | 48.80 | 10.20 | 22.90 | 860 | 6.63 | 2.76 | 3.98 | 690 | 118.00 | 4.62 | 436 | 2.57 | 1.06 | 0.30 |
| LH-14 | gypsum-bearing argillaceous siltstone | 5233.2 | 64 | 41 | 10.00 | 24.40 | 20.00 | 1345 | 2.73 | 7.26 | 4.10 | 390 | 4.34 | 6.93 | 2.56 | 480 | 76.30 | 9.71 | 515 | 1.71 | 0.71 | 0.21 |
| LH-15 | gypsum-bearing argillaceous siltstone | 5233.6 | 52 | 41 | 8.70 | 21.30 | 17.00 | 1300 | 3.73 | 7.56 | 2.90 | 290 | 4.18 | 2.04 | 2.28 | 440 | 63.10 | 11.40 | 426 | 1.49 | 1.02 | 0.23 |
| LH-16 | gypsum mudstone | 5234.1 | 118 | 80 | 18.60 | 45.50 | 36.50 | 168 | 1.06 | 13.65 | 2.30 | 360 | 9.11 | 2.48 | 4.66 | 520 | 158.50 | 0.92 | 282 | 3.92 | 0.92 | 0.39 |
| LH-17 | gypsum mudstone | 5234.5 | 121 | 77 | 18.10 | 44.50 | 36.80 | 305 | 1.16 | 14.45 | 2.30 | 460 | 8.63 | 3.14 | 4.65 | 770 | 139.00 | 1.82 | 471 | 3.31 | 1.00 | 0.39 |
| LH-18 | gypsum mudstone | 5234.8 | 116 | 65 | 25.00 | 48.00 | 37.60 | 937 | 11.90 | 12.80 | 9.40 | 520 | 7.55 | 3.69 | 4.58 | 730 | 134.00 | 4.21 | 540 | 2.99 | 0.90 | 0.35 |
| LH-19 | sandstone | 5235.5 | 11 | 16 | 1.70 | 4.30 | 4.80 | 1610 | 0.99 | 1.60 | 0.70 | 840 | 2.45 | 2.34 | 1.01 | 80 | 37.00 | 6.82 | 341 | 1.13 | 1.09 | 0.07 |
| LH-20 | gypsum mudstone | 5236.17 | 61 | 30 | 8.10 | 18.80 | 18.40 | 1260 | 18.60 | 4.88 | 10.80 | 600 | 2.91 | 11.45 | 2.27 | 360 | 48.50 | 9.53 | 889 | 1.11 | 0.42 | 0.13 |
| LH-21 | gypsum mudstone | 5236.73 | 118 | 70 | 16.20 | 41.40 | 32.70 | 227 | 1.03 | 14.15 | 2.30 | 340 | 8.41 | 3.01 | 4.70 | 700 | 140.00 | 2.46 | 439 | 3.22 | 0.92 | 0.37 |
| LH-22 | gypsum mudstone | 5237.2 | 81 | 52 | 14.10 | 30.90 | 29.70 | 1030 | 0.93 | 9.17 | 2.20 | 560 | 5.64 | 2.64 | 2.95 | 480 | 92.60 | 10.20 | 456 | 2.18 | 0.68 | 0.27 |
| LH-23 | gypsum mudstone | 5237.82 | 105 | 65 | 15.10 | 37.50 | 29.20 | 201 | 1.65 | 12.20 | 3.30 | 300 | 7.48 | 4.14 | 4.07 | 670 | 124.00 | 4.19 | 727 | 2.88 | 0.87 | 0.33 |
| LH-24 | gypsum mudstone | 5238.1 | 113 | 70 | 21.70 | 47.90 | 36.10 | 299 | 1.24 | 14.05 | 3.30 | 400 | 7.99 | 3.60 | 4.43 | 660 | 135.50 | 3.42 | 546 | 3.07 | 0.89 | 0.36 |
| LH-25 | gypsum mudstone | 5238.55 | 118 | 71 | 16.40 | 42.50 | 32.50 | 240 | 3.76 | 13.80 | 3.90 | 370 | 8.25 | 3.46 | 4.15 | 660 | 140.50 | 2.92 | 484 | 3.20 | 0.88 | 0.37 |
| LH-26 | gypsum mudstone | 5239.1 | 110 | 62 | 15.80 | 37.30 | 32.60 | 374 | 6.43 | 12.70 | 5.10 | 350 | 7.57 | 3.60 | 3.85 | 630 | 128.00 | 4.66 | 531 | 2.94 | 0.81 | 0.34 |
| LH-27 | gypsum mudstone | 5239.48 | 97 | 54 | 12.20 | 30.90 | 20.10 | 904 | 0.57 | 11.15 | 1.70 | 660 | 6.85 | 3.77 | 3.69 | 620 | 114.00 | 6.55 | 519 | 2.61 | 0.85 | 0.32 |
| LH-28 | sandstone | 5239.9 | 77 | 43 | 10.60 | 26.90 | 22.20 | 1060 | 2.12 | 9.00 | 2.40 | 390 | 5.31 | 3.97 | 3.11 | 510 | 83.80 | 10.00 | 660 | 2.01 | 0.65 | 0.25 |
| LH-29 | sandstone | 5240.45 | 18 | 17 | 3.10 | 6.60 | 6.60 | 1395 | 1.03 | 3.68 | 0.80 | 360 | 3.17 | 1.22 | 1.01 | 150 | 43.20 | 5.41 | 198 | 1.19 | 1.23 | 0.14 |
| LH-30 | gypsum mudstone | 5241.19 | 58 | 38 | 9.60 | 23.30 | 23.40 | 1200 | 8.78 | 6.71 | 9.20 | 350 | 3.74 | 7.05 | 2.03 | 410 | 68.40 | 12.65 | 542 | 1.46 | 0.50 | 0.17 |
| LH-31 | sandstone | 5241.6 | 16 | 21 | 2.90 | 6.50 | 6.80 | 5420 | 0.95 | 3.33 | 0.90 | 100 | 2.56 | 1.80 | 1.03 | 140 | 47.60 | 9.18 | 325 | 1.27 | 0.87 | 0.12 |
| LH-32 | sandy mudstone | 5242.37 | 53 | 46 | 9.00 | 23.70 | 20.80 | 1090 | 1.26 | 7.99 | 1.90 | 800 | 4.99 | 2.79 | 2.27 | 460 | 80.50 | 3.12 | 372 | 1.96 | 1.27 | 0.26 |
| LH-33 | mudstone | 5243.5 | 100 | 62 | 17.40 | 42.20 | 38.50 | 356 | 32.90 | 9.73 | 12.20 | 660 | 5.81 | 5.72 | 3.00 | 450 | 112.00 | 7.57 | 492 | 2.40 | 0.73 | 0.27 |
| LH-34 | sandstone | 5244.1 | 12 | 18 | 2.50 | 4.50 | 8.10 | 971 | 2.78 | 3.13 | 2.60 | 500 | 2.57 | 0.13 | 1.09 | 70 | 51.00 | 3.20 | 127 | 1.53 | 0.99 | 0.22 |
| LH-35 | sandstone | 5244.5 | 18 | 17 | 3.00 | 6.90 | 8.40 | 199 | 1.16 | 2.98 | 1.00 | 680 | 3.37 | 1.80 | 1.16 | 120 | 63.00 | 3.15 | 305 | 1.84 | 1.22 | 0.12 |
| LH-36 | sandstone | 5246.1 | 20 | 23 | 3.40 | 8.40 | 7.50 | 443 | 1.21 | 3.95 | 0.80 | 1120 | 3.85 | 0.65 | 1.42 | 150 | 71.00 | 1.60 | 203 | 2.09 | 1.38 | 0.15 |
| UCC | 107 | 83 | 17.00 | 44.00 | 25.00 | 350 | 1.50 | 10.70 | 2.80 | 550 | 8.04 | 1.33 | 3.50 | 700 | 112.00 | 3.00 | 600 | 2.80 | 2.89 | 0.41 |
| Number of Samples | Lithology | Depth m | La μg/g | Ce μg/g | Pr μg/g | Nd μg/g | Sm μg/g | Eu μg/g | Gd μg/g | Tb μg/g | Dy μg/g | Ho μg/g | Er μg/g | Tm μg/g | Yb μg/g | Lu μg/g | ∑REE | ∑LREE | ∑HREE | ∑ LREE/∑ HREE | (La/Yb)N |
|---|---|---|---|---|---|---|---|---|---|---|---|---|---|---|---|---|---|---|---|---|---|
| LH-1 | mudstone | 4999.8 | 33.10 | 67.10 | 7.86 | 29.70 | 5.83 | 1.17 | 4.39 | 0.67 | 3.98 | 0.74 | 2.25 | 0.31 | 1.98 | 0.32 | 159.40 | 144.76 | 14.64 | 9.89 | 1.23 |
| LH-2 | mudstone | 5000.33 | 35.70 | 74.10 | 8.27 | 31.20 | 6.28 | 1.25 | 4.67 | 0.69 | 3.91 | 0.75 | 2.10 | 0.31 | 1.90 | 0.31 | 171.44 | 156.80 | 14.64 | 10.71 | 1.38 |
| LH-3 | mudstone | 5000.8 | 37.10 | 72.10 | 8.32 | 30.90 | 6.19 | 1.24 | 4.69 | 0.71 | 3.93 | 0.76 | 2.13 | 0.31 | 1.94 | 0.32 | 170.64 | 155.85 | 14.79 | 10.54 | 1.40 |
| LH-4 | mudstone | 5001.13 | 33.40 | 70.30 | 8.22 | 31.40 | 5.98 | 1.20 | 4.46 | 0.66 | 3.80 | 0.72 | 2.03 | 0.30 | 1.87 | 0.30 | 164.64 | 150.50 | 14.14 | 10.64 | 1.31 |
| LH-5 | mudstone | 5001.87 | 26.60 | 53.90 | 6.07 | 23.20 | 4.52 | 0.87 | 3.34 | 0.51 | 2.94 | 0.57 | 1.61 | 0.24 | 1.54 | 0.25 | 126.16 | 115.16 | 11.00 | 10.47 | 1.27 |
| LH-6 | mudstone | 5002.5 | 27.10 | 52.60 | 6.11 | 23.50 | 4.64 | 0.90 | 3.45 | 0.53 | 3.05 | 0.59 | 1.68 | 0.24 | 1.52 | 0.26 | 126.17 | 114.85 | 11.32 | 10.15 | 1.31 |
| LH-7 | mudstone | 5002.9 | 33.20 | 66.70 | 7.49 | 28.40 | 5.64 | 1.08 | 4.12 | 0.63 | 3.55 | 0.71 | 2.07 | 0.29 | 1.84 | 0.30 | 156.02 | 142.51 | 13.51 | 10.55 | 1.32 |
| LH-8 | mudstone | 5003.57 | 9.30 | 18.95 | 2.25 | 8.60 | 1.66 | 0.33 | 1.28 | 0.19 | 1.16 | 0.22 | 0.63 | 0.09 | 0.55 | 0.09 | 45.30 | 41.09 | 4.21 | 9.76 | 1.24 |
| LH-9 | sandstone | 5004.15 | 4.70 | 8.77 | 1.10 | 4.10 | 0.74 | 0.23 | 0.52 | 0.07 | 0.49 | 0.10 | 0.30 | 0.04 | 0.28 | 0.05 | 21.49 | 19.64 | 1.85 | 10.62 | 1.23 |
| LH-10 | sandstone | 5004.68 | 8.30 | 16.35 | 2.04 | 7.60 | 1.50 | 0.39 | 1.12 | 0.16 | 1.02 | 0.21 | 0.59 | 0.09 | 0.65 | 0.10 | 40.12 | 36.18 | 3.94 | 9.18 | 0.94 |
| LH-11 | sandstone | 5005.35 | 8.60 | 17.00 | 2.11 | 8.00 | 1.57 | 0.42 | 1.24 | 0.18 | 1.12 | 0.22 | 0.67 | 0.10 | 0.64 | 0.11 | 41.98 | 37.70 | 4.28 | 8.81 | 0.99 |
| LH-12 | sandstone | 5006.25 | 8.00 | 15.80 | 1.94 | 7.10 | 1.30 | 0.35 | 0.96 | 0.14 | 1.28 | 0.19 | 0.57 | 0.08 | 0.59 | 0.09 | 38.39 | 34.49 | 3.90 | 8.84 | 0.99 |
| LH-13 | gypsum-bearing argillaceous siltstone | 5233.06 | 29.70 | 61.30 | 7.12 | 26.70 | 5.36 | 1.08 | 3.97 | 0.60 | 3.39 | 0.66 | 1.85 | 0.27 | 1.68 | 0.28 | 143.96 | 131.26 | 12.70 | 10.34 | 1.30 |
| LH-14 | gypsum-bearing argillaceous siltstone | 5233.2 | 21.30 | 42.50 | 5.05 | 19.10 | 3.79 | 0.72 | 2.85 | 0.41 | 2.46 | 0.48 | 1.36 | 0.20 | 1.28 | 0.21 | 101.71 | 92.46 | 9.25 | 10.00 | 1.22 |
| LH-15 | gypsum-bearing argillaceous siltstone | 5233.6 | 21.10 | 43.70 | 5.11 | 19.60 | 3.81 | 0.73 | 2.69 | 0.40 | 2.40 | 0.45 | 1.24 | 0.18 | 1.19 | 0.19 | 102.79 | 94.05 | 8.74 | 10.76 | 1.30 |
| LH-16 | gypsum mudstone | 5234.1 | 38.00 | 78.20 | 8.71 | 33.40 | 6.52 | 1.31 | 4.86 | 0.74 | 4.19 | 0.83 | 2.29 | 0.34 | 2.11 | 0.34 | 181.84 | 166.14 | 15.70 | 10.58 | 1.32 |
| LH-17 | gypsum mudstone | 5234.5 | 40.90 | 83.40 | 9.38 | 35.20 | 6.95 | 1.42 | 5.42 | 0.77 | 4.40 | 0.86 | 2.38 | 0.34 | 2.11 | 0.36 | 193.89 | 177.25 | 16.64 | 10.65 | 1.42 |
| LH-18 | gypsum mudstone | 5234.8 | 36.10 | 73.10 | 8.24 | 31.20 | 6.22 | 1.23 | 4.62 | 0.72 | 4.24 | 0.83 | 2.39 | 0.37 | 2.30 | 0.38 | 171.94 | 156.09 | 15.85 | 9.85 | 1.15 |
| LH-19 | sandstone | 5235.5 | 6.70 | 12.15 | 1.53 | 5.70 | 1.12 | 0.34 | 0.92 | 0.14 | 0.85 | 0.17 | 0.50 | 0.08 | 0.48 | 0.08 | 30.76 | 27.54 | 3.22 | 8.55 | 1.02 |
| LH-20 | gypsum mudstone | 5236.17 | 15.20 | 30.70 | 3.60 | 13.90 | 2.74 | 0.52 | 1.98 | 0.29 | 1.74 | 0.34 | 0.95 | 0.14 | 0.86 | 0.14 | 73.10 | 66.66 | 6.44 | 10.35 | 1.30 |
| LH-21 | gypsum mudstone | 5236.73 | 40.60 | 84.10 | 9.39 | 35.60 | 6.85 | 1.39 | 5.23 | 0.79 | 4.45 | 0.86 | 2.47 | 0.35 | 2.26 | 0.37 | 194.71 | 177.93 | 16.78 | 10.60 | 1.32 |
| LH-22 | gypsum mudstone | 5237.2 | 26.40 | 55.00 | 6.18 | 24.10 | 4.59 | 0.91 | 3.21 | 0.47 | 2.66 | 0.50 | 1.40 | 0.21 | 1.22 | 0.20 | 127.05 | 117.18 | 9.87 | 11.87 | 1.59 |
| LH-23 | gypsum mudstone | 5237.82 | 35.70 | 74.60 | 8.35 | 31.60 | 6.01 | 1.21 | 4.56 | 0.69 | 3.88 | 0.76 | 2.27 | 0.32 | 2.03 | 0.32 | 172.30 | 157.47 | 14.83 | 10.62 | 1.29 |
| LH-24 | gypsum mudstone | 5238.1 | 38.30 | 80.20 | 8.80 | 33.40 | 6.38 | 1.30 | 4.93 | 0.74 | 4.13 | 0.83 | 2.27 | 0.34 | 2.04 | 0.34 | 184.00 | 168.38 | 15.62 | 10.78 | 1.38 |
| LH-25 | gypsum mudstone | 5238.55 | 37.90 | 78.70 | 8.98 | 33.50 | 6.49 | 1.33 | 5.10 | 0.76 | 4.28 | 0.85 | 2.36 | 0.35 | 2.22 | 0.39 | 183.21 | 166.90 | 16.31 | 10.23 | 1.25 |
| LH-26 | gypsum mudstone | 5239.1 | 35.00 | 71.20 | 8.11 | 30.90 | 5.94 | 1.16 | 4.44 | 0.67 | 3.88 | 0.76 | 2.14 | 0.32 | 1.96 | 0.32 | 166.80 | 152.31 | 14.49 | 10.51 | 1.31 |
| LH-27 | gypsum mudstone | 5239.48 | 34.00 | 69.30 | 7.77 | 29.20 | 5.61 | 1.09 | 4.17 | 0.63 | 3.42 | 0.68 | 1.88 | 0.27 | 1.70 | 0.28 | 160.00 | 146.97 | 13.03 | 11.28 | 1.47 |
| LH-28 | sandstone | 5239.9 | 24.40 | 50.10 | 5.46 | 21.20 | 4.20 | 0.84 | 3.20 | 0.47 | 2.71 | 0.55 | 1.51 | 0.22 | 1.60 | 0.23 | 116.69 | 106.20 | 10.49 | 10.12 | 1.12 |
| LH-29 | sandstone | 5240.45 | 8.00 | 19.60 | 2.50 | 9.60 | 1.78 | 0.39 | 1.28 | 0.19 | 1.01 | 0.20 | 0.58 | 0.09 | 0.57 | 0.10 | 45.89 | 41.87 | 4.02 | 10.42 | 1.03 |
| LH-30 | gypsum mudstone | 5241.19 | 16.20 | 36.50 | 4.27 | 15.80 | 2.95 | 0.52 | 2.12 | 0.32 | 1.73 | 0.35 | 1.02 | 0.14 | 0.91 | 0.15 | 82.98 | 76.24 | 6.74 | 11.31 | 1.31 |
| LH-31 | sandstone | 5241.6 | 6.70 | 17.95 | 2.34 | 9.10 | 1.83 | 0.37 | 1.38 | 0.21 | 1.14 | 0.22 | 0.67 | 0.10 | 0.59 | 0.09 | 42.69 | 38.29 | 4.40 | 8.70 | 0.83 |
| LH-32 | sandy mudstone | 5242.37 | 22.10 | 46.40 | 5.73 | 22.00 | 4.15 | 0.76 | 3.23 | 0.48 | 2.59 | 0.50 | 1.52 | 0.21 | 1.34 | 0.22 | 111.23 | 101.14 | 10.09 | 10.02 | 1.21 |
| LH-33 | mudstone | 5243.5 | 22.80 | 49.80 | 5.84 | 21.50 | 4.17 | 0.69 | 3.05 | 0.46 | 2.58 | 0.51 | 1.53 | 0.22 | 1.42 | 0.23 | 114.80 | 104.80 | 10.00 | 10.48 | 1.18 |
| LH-34 | sandstone | 5244.1 | 7.20 | 17.60 | 2.27 | 8.60 | 1.44 | 0.31 | 1.01 | 0.15 | 0.90 | 0.18 | 0.61 | 0.09 | 0.63 | 0.09 | 41.08 | 37.42 | 3.66 | 10.22 | 0.84 |
| LH-35 | sandstone | 5244.5 | 8.20 | 18.55 | 2.39 | 8.80 | 1.74 | 0.47 | 1.40 | 0.22 | 1.20 | 0.23 | 0.69 | 0.10 | 0.64 | 0.10 | 44.73 | 40.15 | 4.58 | 8.77 | 0.94 |
| LH-36 | sandstone | 5246.1 | 12.40 | 25.90 | 3.21 | 11.80 | 2.12 | 0.44 | 1.46 | 0.21 | 1.39 | 0.23 | 0.66 | 0.10 | 0.65 | 0.10 | 60.67 | 55.87 | 4.80 | 11.64 | 1.40 |
| UCC | 30.00 | 64.00 | 7.10 | 26.00 | 4.50 | 0.88 | 3.80 | 0.64 | 3.50 | 0.80 | 2.30 | 0.33 | 2.20 | 0.32 | 146.37 | 132.48 | 13.89 | 9.54 | 1.40 |
| Number of Samples | Depth (m) | Lithology | TOC (%) | Terrigenous Input | Redox | Paleosalinity | |||||||||
| Al2O3 (%) | TiO2 (%) | δU | V/(V+Ni) | Ce/La | U-EF | Mo-EF | Sr/Ba | CaO/(CaO+Fe) | MgO/Al2O3 × 100 | B(μg/g) | S(‰) | ||||
| LH-1 | 4999.8 | mudstone | 0.22 | 15.12 | 0.67 | 0.87 | 0.74 | 2.03 | 1.33 | 0.68 | 0.41 | 0.66 | 24.60 | 248 | 32.55 |
| LH-2 | 5000.33 | mudstone | 0.19 | 15.54 | 0.71 | 0.68 | 0.72 | 2.08 | 0.88 | 0.30 | 0.46 | 0.61 | 18.28 | 242 | 29.43 |
| LH-3 | 5000.8 | mudstone | 0.21 | 15.10 | 0.68 | 0.77 | 0.71 | 1.94 | 1.07 | 0.88 | 0.46 | 0.58 | 17.62 | 235 | 26.08 |
| LH-4 | 5001.13 | mudstone | 0.17 | 16.48 | 0.69 | 0.72 | 0.73 | 2.10 | 0.91 | 0.49 | 0.41 | 0.55 | 17.35 | 213 | 17.40 |
| LH-5 | 5001.87 | mudstone | 0.18 | 11.59 | 0.47 | 1.47 | 0.77 | 2.03 | 4.60 | 10.04 | 0.94 | 0.76 | 68.68 | 209 | 16.09 |
| LH-6 | 5002.5 | mudstone | 0.95 | 10.32 | 0.40 | 1.56 | 0.75 | 1.94 | 5.91 | 33.53 | 0.45 | 0.81 | 87.69 | 218 | 19.14 |
| LH-7 | 5002.9 | mudstone | 1.81 | 12.86 | 0.53 | 1.52 | 0.72 | 2.01 | 5.38 | 11.65 | 1.12 | 0.76 | 30.56 | 243 | 29.93 |
| LH-8 | 5003.57 | mudstone | 0.58 | 3.40 | 0.14 | 1.75 | 0.75 | 2.04 | 10.65 | 21.89 | 3.30 | 0.96 | 259.12 | 233 | 25.18 |
| LH-9 | 5004.15 | sandstone | 4.89 | 0.08 | 1.12 | 0.71 | 1.87 | 0.69 | 11.06 | 3.09 | 0.93 | 7.77 | |||
| LH-10 | 5004.68 | sandstone | 6.77 | 0.23 | 0.98 | 0.72 | 1.97 | 0.67 | 2.37 | 0.51 | 0.64 | 10.93 | |||
| LH-11 | 5005.35 | sandstone | 7.01 | 0.23 | 1.01 | 0.75 | 1.98 | 0.73 | 1.23 | 0.36 | 0.67 | 17.55 | |||
| LH-12 | 5006.25 | sandstone | 6.92 | 0.20 | 0.94 | 0.74 | 1.98 | 1.30 | 2.14 | 0.28 | 0.59 | 15.75 | |||
| LH-13 | 5233.06 | gypsum-bearing argillaceous siltstone | 2.36 | 13.21 | 0.54 | 1.74 | 0.76 | 2.06 | 0.72 | 1.74 | 0.95 | 0.62 | 36.11 | 258 | 38.31 |
| LH-14 | 5233.2 | gypsum-bearing argillaceous siltstone | 1.86 | 8.51 | 0.36 | 1.26 | 0.72 | 2.00 | 1.01 | 1.99 | 3.45 | 0.84 | 135.14 | 246 | 31.48 |
| LH-15 | 5233.6 | gypsum-bearing argillaceous siltstone | 0.21 | 8.24 | 0.42 | 1.07 | 0.71 | 2.07 | 2.90 | 5.80 | 4.48 | 0.88 | 43.69 | 226 | 22.20 |
| LH-16 | 5234.1 | gypsum mudstone | 0.17 | 18.29 | 0.71 | 0.67 | 0.72 | 2.06 | 0.85 | 1.84 | 0.47 | 0.21 | 23.56 | 207 | 15.46 |
| LH-17 | 5234.5 | gypsum mudstone | 2.01 | 16.96 | 0.70 | 1.26 | 0.73 | 2.04 | 0.60 | 1.68 | 0.66 | 0.35 | 31.31 | 225 | 21.80 |
| LH-18 | 5234.8 | gypsum mudstone | 0.15 | 14.68 | 0.61 | 1.38 | 0.71 | 2.02 | 0.58 | 1.13 | 1.80 | 0.56 | 41.96 | 215 | 18.08 |
| LH-19 | 5235.5 | sandstone | 4.78 | 0.11 | 1.14 | 0.72 | 1.81 | 9.92 | 39.45 | 1.92 | 0.90 | 84.10 | |||
| LH-20 | 5236.17 | gypsum mudstone | 0.23 | 5.66 | 0.22 | 1.23 | 0.76 | 2.02 | 2.71 | 3.37 | 2.10 | 0.86 | 336.57 | 217 | 18.78 |
| LH-21 | 5236.73 | gypsum mudstone | 0.16 | 17.14 | 0.67 | 0.66 | 0.74 | 2.07 | 1.99 | 4.78 | 0.67 | 0.43 | 30.86 | 210 | 16.41 |
| LH-22 | 5237.2 | gypsum mudstone | 0.17 | 11.35 | 0.48 | 0.84 | 0.72 | 2.08 | 0.72 | 0.62 | 1.84 | 0.83 | 40.79 | 223 | 21.01 |
| LH-23 | 5237.82 | gypsum mudstone | 0.08 | 15.04 | 0.59 | 0.90 | 0.74 | 2.09 | 0.77 | 0.72 | 0.67 | 0.59 | 47.14 | 224 | 21.40 |
| LH-24 | 5238.1 | gypsum mudstone | 0.11 | 15.97 | 0.64 | 0.83 | 0.70 | 2.09 | 3.58 | 8.45 | 0.75 | 0.52 | 38.63 | 216 | 18.43 |
| LH-25 | 5238.55 | gypsum mudstone | 0.09 | 16.45 | 0.65 | 0.92 | 0.74 | 2.08 | 0.82 | 2.17 | 0.65 | 0.49 | 35.74 | 215 | 18.08 |
| LH-26 | 5239.1 | gypsum mudstone | 0.12 | 15.19 | 0.60 | 1.09 | 0.75 | 2.03 | 10.66 | 34.26 | 1.07 | 0.63 | 40.62 | 223 | 21.01 |
| LH-27 | 5239.48 | gypsum mudstone | 0.25 | 13.51 | 0.57 | 0.63 | 0.76 | 2.04 | 0.79 | 0.66 | 1.37 | 0.71 | 47.30 | 220 | 19.87 |
| LH-28 | 5239.9 | sandstone | 10.61 | 0.44 | 0.89 | 0.74 | 2.05 | 1.12 | 0.88 | 2.72 | 0.82 | 63.43 | |||
| LH-29 | 5240.45 | sandstone | 6.52 | 0.25 | 0.79 | 0.73 | 2.45 | 1.27 | 1.18 | 3.88 | 0.88 | 33.44 | |||
| LH-30 | 5241.19 | gypsum mudstone | 3.97 | 7.38 | 0.30 | 1.61 | 0.71 | 2.25 | 1.19 | 0.83 | 3.43 | 0.90 | 159.89 | 256 | 37.10 |
| LH-31 | 5241.6 | sandstone | 5.10 | 0.22 | 0.90 | 0.71 | 2.68 | 1.36 | 2.44 | 54.20 | 0.93 | 61.96 | |||
| LH-32 | 5242.37 | sandy mudstone | 2.98 | 10.03 | 0.46 | 0.83 | 0.69 | 2.10 | 1.93 | 4.55 | 1.36 | 0.66 | 46.86 | ||
| LH-33 | 5243.5 | mudstone | 1.47 | 11.56 | 0.46 | 1.58 | 0.70 | 2.18 | 0.71 | 0.45 | 0.54 | 0.78 | 81.49 | ||
| LH-34 | 5244.1 | sandstone | 5.18 | 0.41 | 1.43 | 0.73 | 2.44 | 7.06 | 12.58 | 1.94 | 0.80 | 4.44 | |||
| LH-35 | 5244.5 | sandstone | 6.91 | 0.21 | 1.00 | 0.72 | 2.26 | 1.09 | 1.35 | 0.29 | 0.79 | 45.73 | |||
| LH-36 | 5246.1 | sandstone | 7.89 | 0.26 | 0.76 | 0.70 | 2.09 | 6.03 | 30.35 | 0.40 | 0.61 | 14.45 | |||
| Number of Samples | Depth (m) | Lithology | TOC (%) | Paleoclimate | Paleoproductivity | Sedimentation Rate and Paleowater depth | |||||||||
| Sr/Cu | CIA | Mg/Ca | Rb/Sr | C | Ni/Al | P/Ti | P/Al | Vs | H(m) | ||||||
| LH-1 | 4999.8 | mudstone | 0.22 | 7.45 | 55.33 | 0.41 | 0.59 | 1.34 | 5.21 | 4146.34 | 203.19 | 535.57 | 24.61 | ||
| LH-2 | 5000.33 | mudstone | 0.19 | 5.11 | 59.36 | 0.41 | 0.68 | 0.98 | 5.24 | 1506.49 | 76.92 | 491.38 | 28.00 | ||
| LH-3 | 5000.8 | mudstone | 0.21 | 4.96 | 57.48 | 0.35 | 0.64 | 0.94 | 5.68 | 1618.04 | 81.12 | 472.47 | 29.70 | ||
| LH-4 | 5001.13 | mudstone | 0.17 | 3.94 | 61.22 | 0.45 | 0.75 | 0.93 | 5.44 | 1577.54 | 74.59 | 449.18 | 32.04 | ||
| LH-5 | 5001.87 | mudstone | 0.18 | 9.31 | 43.50 | 0.60 | 0.29 | 1.07 | 5.40 | 2518.80 | 116.72 | 546.24 | 23.89 | ||
| LH-6 | 5002.5 | mudstone | 0.95 | 7.34 | 37.73 | 0.58 | 0.36 | 0.99 | 6.35 | 4487.18 | 196.63 | 582.03 | 21.72 | ||
| LH-7 | 5002.9 | mudstone | 1.81 | 11.94 | 44.20 | 0.27 | 0.18 | 0.59 | 6.21 | 2033.90 | 92.17 | 496.37 | 27.58 | ||
| LH-8 | 5003.57 | mudstone | 0.58 | 9.26 | 10.71 | 0.27 | 0.00 | 0.06 | 5.73 | 5256.41 | 230.34 | 1877.35 | 3.75 | ||
| LH-9 | 5004.15 | sandstone | 340.00 | 25.78 | 0.03 | 0.03 | 0.06 | 1.32 | 784.31 | 16.00 | |||||
| LH-10 | 5004.68 | sandstone | 55.83 | 49.73 | 0.20 | 0.16 | 0.26 | 2.02 | 757.58 | 29.24 | |||||
| LH-11 | 5005.35 | sandstone | 38.17 | 50.89 | 0.37 | 0.23 | 0.34 | 1.79 | 757.58 | 28.41 | |||||
| LH-12 | 5006.25 | sandstone | 33.06 | 51.74 | 0.41 | 0.27 | 0.29 | 1.76 | 608.70 | 20.23 | |||||
| LH-13 | 5233.06 | gypsum-bearing argillaceous siltstone | 2.36 | 15.24 | 54.98 | 0.60 | 0.14 | 0.36 | 7.01 | 2300.00 | 104.07 | 363.28 | 44.05 | ||
| LH-14 | 5233.2 | gypsum-bearing argillaceous siltstone | 1.86 | 67.25 | 33.94 | 0.71 | 0.06 | 0.34 | 5.62 | 2296.65 | 110.60 | 884.38 | 11.60 | ||
| LH-15 | 5233.6 | gypsum-bearing argillaceous siltstone | 0.21 | 76.47 | 29.75 | 0.18 | 0.05 | 0.31 | 5.10 | 1938.33 | 105.26 | 1088.02 | 8.50 | ||
| LH-16 | 5234.1 | gypsum mudstone | 0.17 | 4.60 | 71.71 | 2.70 | 0.94 | 0.81 | 4.99 | 1326.53 | 57.08 | 466.45 | 30.28 | ||
| LH-17 | 5234.5 | gypsum mudstone | 2.01 | 8.29 | 68.98 | 1.73 | 0.46 | 0.80 | 5.16 | 1984.54 | 89.22 | 503.13 | 27.03 | ||
| LH-18 | 5234.8 | gypsum mudstone | 0.15 | 24.92 | 58.62 | 0.88 | 0.14 | 0.47 | 6.36 | 2091.69 | 96.69 | 306.90 | 56.73 | ||
| LH-19 | 5235.5 | sandstone | 335.42 | 28.06 | 0.34 | 0.02 | 0.15 | 1.76 | 1230.77 | 32.65 | |||||
| LH-20 | 5236.17 | gypsum mudstone | 0.23 | 68.48 | 26.76 | 1.20 | 0.04 | 0.51 | 6.46 | 2769.23 | 123.71 | 1033.54 | 9.18 | ||
| LH-21 | 5236.73 | gypsum mudstone | 0.16 | 6.94 | 66.40 | 1.22 | 0.62 | 0.99 | 4.92 | 1902.17 | 83.23 | 595.79 | 20.97 | ||
| LH-22 | 5237.2 | gypsum mudstone | 0.17 | 34.68 | 38.36 | 0.26 | 0.09 | 0.35 | 5.48 | 1804.51 | 85.11 | 593.21 | 21.11 | ||
| LH-23 | 5237.82 | gypsum mudstone | 0.08 | 6.88 | 58.95 | 0.99 | 0.62 | 1.66 | 5.01 | 2030.30 | 89.57 | 617.89 | 19.86 | ||
| LH-24 | 5238.1 | gypsum mudstone | 0.11 | 8.28 | 62.40 | 1.05 | 0.45 | 0.98 | 5.99 | 1848.74 | 82.60 | 376.93 | 41.68 | ||
| LH-25 | 5238.55 | gypsum mudstone | 0.09 | 7.38 | 64.45 | 1.18 | 0.59 | 1.00 | 5.15 | 1803.28 | 80.00 | 561.89 | 22.90 | ||
| LH-26 | 5239.1 | gypsum mudstone | 0.12 | 11.47 | 57.75 | 0.77 | 0.34 | 0.89 | 4.93 | 1863.91 | 83.22 | 570.55 | 22.38 | ||
| LH-27 | 5239.48 | gypsum mudstone | 0.25 | 44.98 | 50.58 | 0.58 | 0.13 | 0.39 | 4.51 | 1937.50 | 90.51 | 849.00 | 12.33 | ||
| LH-28 | 5239.9 | sandstone | 47.75 | 37.91 | 0.40 | 0.08 | 0.51 | 5.07 | 2056.45 | 96.05 | |||||
| LH-29 | 5240.45 | sandstone | 211.36 | 37.51 | 0.23 | 0.03 | 0.13 | 2.08 | 1102.94 | 47.32 | |||||
| LH-30 | 5241.19 | gypsum mudstone | 3.97 | 51.28 | 26.03 | 1.23 | 0.06 | 0.40 | 6.23 | 2356.32 | 109.63 | 838.65 | 12.56 | ||
| LH-31 | 5241.6 | sandstone | 797.06 | 24.34 | 0.20 | 0.01 | 0.06 | 2.54 | 1176.47 | 54.69 | |||||
| LH-32 | 5242.37 | sandy mudstone | 2.98 | 5.24 | 54.33 | 0.89 | 0.07 | 0.24 | 4.75 | 1755.73 | 92.18 | 1059.39 | 8.85 | ||
| LH-33 | 5243.5 | mudstone | 1.47 | 9.25 | 44.11 | 0.76 | 0.31 | 0.61 | 7.26 | 1679.10 | 77.45 | 429.86 | 34.22 | ||
| LH-34 | 5244.1 | sandstone | 119.88 | 40.55 | 0.04 | 0.05 | 0.11 | 1.75 | 324.07 | 27.24 | |||||
| LH-35 | 5244.5 | sandstone | 23.63 | 45.25 | 0.57 | 0.32 | 0.38 | 2.05 | 1043.48 | 35.61 | |||||
| LH-36 | 5246.1 | sandstone | 59.07 | 54.34 | 0.41 | 0.16 | 0.15 | 2.18 | 1027.40 | 38.96 | |||||
| Meaning of Indication | Parameter | Content | References | ||
|---|---|---|---|---|---|
| Terrigenous input | Al2O3 | The greater the ratio, the greater the terrestrial input | [27,44] | ||
| TiO2 | |||||
| Oxidation | Weak oxidation | Reducing | References | ||
| Redox | δU | <1 | >1 | [33] | |
| V/(V + Ni) | <0.46 | 0.46–0.57 | >0.57 | [50] | |
| Pr/Ph | >3 | 1–3 | <1 | [40] | |
| Fresh water | Brackish water | Salt water | References | ||
| Paleosalinity | Sr/Ba | <0.5 | 0.5–1.0 | >1.0 | [51] |
| CaO/(CaO + Fe) | <0.2 | 0.2–0.5 | >0.5 | [52] | |
| MgO/Al2O3 × 100 | <1 | 1~10 | >10 | [30] | |
| Paleoclimate | Warm and humid | Cold and dry | |||
| Sr/Cu | 1.3~5.0 | >5 | [53] | ||
| Mg/Ca | High values indicate dry and low values indicate moist | [46] | |||
| Rb/Sr | High values indicate moist, low values indicate dry | ||||
| Cold and dry | Warm and humid | Hot humid | |||
| CIA | 50~70 | 70~80 | 80~100 | [54] | |
| Arid climate | Semi-arid to semi-moist climate | Hot humid | |||
| C | <0.2 | 0.2~0.8 | >0.8 | [24] | |
| Paleoproductivity | Ni/Al | The greater the ratio, the greater the ancient productivity | [3,12] | ||
| P/Ti | |||||
| P/Al | |||||
Disclaimer/Publisher’s Note: The statements, opinions and data contained in all publications are solely those of the individual author(s) and contributor(s) and not of MDPI and/or the editor(s). MDPI and/or the editor(s) disclaim responsibility for any injury to people or property resulting from any ideas, methods, instructions or products referred to in the content. |
© 2023 by the authors. Licensee MDPI, Basel, Switzerland. This article is an open access article distributed under the terms and conditions of the Creative Commons Attribution (CC BY) license (https://creativecommons.org/licenses/by/4.0/).
Share and Cite
Fu, X.; Lu, J.; Shi, Y.; Zhou, R.; Chen, S.; Yuan, M. Sedimentary Environment and Organic Matter Enrichment Model of Saline Lake Source Rock in the Linhe Depression, Hetao Basin, China. Processes 2023, 11, 2114. https://doi.org/10.3390/pr11072114
Fu X, Lu J, Shi Y, Zhou R, Chen S, Yuan M. Sedimentary Environment and Organic Matter Enrichment Model of Saline Lake Source Rock in the Linhe Depression, Hetao Basin, China. Processes. 2023; 11(7):2114. https://doi.org/10.3390/pr11072114
Chicago/Turabian StyleFu, Xiaoyan, Jungang Lu, Yulei Shi, Ranran Zhou, Shijia Chen, and Man Yuan. 2023. "Sedimentary Environment and Organic Matter Enrichment Model of Saline Lake Source Rock in the Linhe Depression, Hetao Basin, China" Processes 11, no. 7: 2114. https://doi.org/10.3390/pr11072114