Article

Mathematical Modeling and Computational Simulation Applied to the Study of Glycerol and/or Molasses Anaerobic Co-Digestion Processes

by
Carolina Machado Ferreira
1,
Rafael Akira Akisue
2 and
Ruy de Sousa Júnior
1,3,*
1
Graduate Program in Chemical Engineering, Campus São Carlos, Federal University of São Carlos, Rod. Washington Luís km 235, São Carlos 13565-905, Brazil
2
Department of Industrial Chemistry, Campus Suzano, Federal Institute of São Paulo, Av. Mogi da Cruzes, 1501, Suzano 08673-010, Brazil
3
Department of Chemical Engineering, Campus São Carlos, Federal University of São Carlos, Rod. Washington Luís km 235, São Carlos 13565-905, Brazil
*
Author to whom correspondence should be addressed.
Processes 2023, 11(7), 2121; https://doi.org/10.3390/pr11072121
Submission received: 7 June 2023 / Revised: 8 July 2023 / Accepted: 14 July 2023 / Published: 16 July 2023

Abstract

:
An attractive application of crude glycerol is in the generation of biomethane by means of anaerobic co-digestion. Thus, the objective of this work was to evaluate the potential of neural networks and fuzzy logic to predict the production of biomethane from the anaerobic co-digestion of glycerol and/or sugarcane molasses. Firstly, a reactor model was implemented using Scilab (v. 6.1.1), considering the Monod two-substrate with an intermediate (M2SI) kinetic model proposed by Rakmak et al. (Rakmak, N.; Noynoo, L.; Jijai, S.; Siripatana, C. Lecture Notes in Applied Mathematics and Applied Science in Engineering. Melaka, Malaysia, p. 11–20, 2019), to generate a database for subsequent fitting and evaluation of neural and fuzzy models. The neural network package of Matlab was used. Fuzzy modeling was applied using the Takagi–Sugeno approach available in the ANFIS package of Matlab. The biomethane production data simulated using Scilab were considered in neural network modeling and validation, firstly employing a “generic” network applicable to all eight scenarios, providing a very good fit (R2 > 0.99). Excellent performance was also observed for specific artificial neural networks (one for each condition, again by using validation data generated by the M2SI model). The parameters of the M2SI model for the eight different conditions were also mapped using a neural network, as a function of the organic material composition, providing a fit with R2 > 0.99 when using 25 neurons. In the case of fuzzy logic, an RMSE (Root Mean Squared Error) of 18.88 mL of methane was obtained with 216 rules, which was a value lower than 0.5% of the order of magnitude of the accumulated methane. It could be concluded from the results that fuzzy logic and artificial neural networks offer excellent ability to predict methane production, as well as to parameterize the M2SI kinetic model (using neural networks).

1. Introduction

Since the Stockholm Conference in Sweden, in 1972, many efforts have been made and public policies created aiming to minimize the impacts of anthropogenic activities on the environment [1]. The use of biofuels is a clean energy option that can replace fossil fuels and contribute to reducing greenhouse gas emissions. Biofuels are usually produced from renewable sources of plant origin but can also be obtained from byproducts and domestic and agro-industrial wastes. This makes them highly appropriate in the circular economy and provides a use for materials that would otherwise be improperly discarded in the environment.
Brazil can be highlighted in the global policy of production and marketing of bio-fuels, since the country was a pioneer in the production of ethanol. In 2004, the Federal Government published a National Policy for the Use and Production of Biodiesel, stipulating the increasing incorporation of biodiesel in diesel, reaching 15% in 2023 [2]. Most of Brazilian biodiesel production uses soybean oil, although waste frying oil and animal fat may also be used [3,4]. In 2018, the Federal Government established a National Biofuels Policy, with de-carbonization targets to be met by 2030, linked to incentivizing the production of ethanol and biodiesel. Hence, it is expected that the production of these biofuels in the country will increase during the next ten years [5]. One consequence of increased biodiesel production is the large quantity of glycerol generated. However, the market demand for this product has not grown at the same rate, which has led to depreciation of the glycerol price. Furthermore, the glycerol formed in the process contains many impurities, so it needs to be purified before it can be sold. Due to the low glycerol price, its treatment has not been economically feasible, especially for small and medium-sized biodiesel producers. Glycerol has a high polluting potential, so it should not be discharged into the environment in effluents. As an alternative, one emerging use for crude glycerol is as a substrate in anaerobic digestion for the production of biogas and application in energy processes [6].
Anaerobic digestion consists of the degradation of organic matter by bacteria and archaea, in the absence of oxygen. However, maintaining the metabolic processes of these microorganisms requires nutrients (such as nitrogen, phosphorus, potassium, sodium, and iron, among others) and favorable environmental conditions [7]. Glycerol is a compound rich in carbon, so it can provide a source of energy for the process. However, it does not contain the macro- and micronutrients required to support fermentation. Therefore, to make the process feasible, it is necessary to add synthetic nutrients or a co-substrate that contains the main nutrients in its composition. Sugarcane molasses, a byproduct from the crystallization step of sugar production, contains nutrients (including calcium, nitrogen, phosphorus, iron, and sulfur) that can assist microbial growth [8]. Predictions for the Brazilian sugar and ethanol sector indicate the continued generation of molasses on a large scale, with widespread availability and low prices [9].
The literature contains many experimental studies, such as those by Costa [10], Paranhos and Silva [11], Freitas [12], and Pereyra et al. [13], aimed at exploring the energy potentials of these two substrates (glycerol and sugarcane molasses) and finding optimal conditions for the production of hydrogen, methane, and value-added metabolites. Anaerobic digestion is a complex process requiring the evaluation of many different parameters (such as temperature, organic load, pH, alkalinity, and retention time, among others), with kinetic studies being essential for maximizing bioenergy production and optimizing the variables. One approach is to use the Monod two-substrate with an intermediate kinetic model, proposed by Rakmak et al. [14], which allows calculation of the accumulated methane production in anaerobic co-digestion. In addition, when a database is available, an attractive approach is to use artificial intelligence [15] for rapid, precise, and inexpensive prediction of the behavior of the process.
Co-digestion refers to processes where the organic matter consists of two or more different substrates, such as glycerol and sugarcane molasses. The use of different substrates can take advantage of their characteristics [16,17,18,19,20,21], enhance fermentation, and increase biogas yield if the combination is successfully performed. Co-digestion can assist in regulating pH, improving carbon/nitrogen and carbon/phosphorus ratios, and increasing the availability of micro- and macronutrients required for the metabolism of the microbial community. Preliminary batch studies of the co-digestion of glycerol and a second substrate were performed by Aguilar et al. [22] using swine waste, with the results showing that biogas production and COD removal were favored by co-digestion.
Four stages are described for the anaerobic fermentation aiming at biogas production [7]: hydrolysis; acidogenesis; acetogenesis; and methanogenesis. Controlled fermentation processes can be performed in different types of reactors, which may be operated continuously or in batch mode [7]. In particular, when the digestion process is carried out in two separate bioreactors, acidogenesis and acetogenesis are also known as primary fermentation, while methanogenesis is secondary fermentation. In the presence of nitrate or sulfate, the hydrogen formed in the acidogenesis step acts as an electron donor for the reducing bacteria, producing sulfides and ammonia [7].
Temperature is an important factor in the digestion process. Microorganisms are unable to regulate their internal temperature, which is therefore determined by the environment [7]. The production of methane can occur in a wide temperature range up to 97 °C, while hydrogen formation occurs from 15 to 85 °C, and it is not possible to produce H2 under psychrophilic conditions [7,23]. According to Chernicharo [7], the best temperatures for microbial growth and biogas production are in the mesophilic (30–35 °C) and thermophilic (50–55 °C) ranges, with thermophilic conditions generally providing higher hydrogen and methane production rates. Operating at around 55 °C requires the continuous heating of the biodigester, which can make the process economically unfeasible. Therefore, most anaerobic digesters are operated under mesophilic conditions, which are easy to provide in tropical countries, such as Brazil [7,23].
Artificial intelligence uses mathematical approaches based on the way that humans think and learn. The main methods involve the use of artificial neural networks and fuzzy logic. Previous applications of neural networks and fuzzy logic in biogas production can be seen in [24,25,26,27,28,29], which indicate very good perspectives. As the name suggests, artificial neural networks were inspired by biological neural networks and are structured in layers, with the results of mathematical calculations flowing from one layer to another, simulating nerve synapses [15]. Fuzzy logic, on the other hand, is based on the relative and nebulous way of human thinking when quantifying situations, with the solving of problems using a series of rules elaborated using non-numerical variables [15,30].
The aim of the present work was to evaluate the potential of artificial neural networks and fuzzy logic to predict methane production for co-digestion of glycerol and sugarcane molasses in wastewater. For generation of a database of biomethane production from the co-digestion of wastewaters containing glycerol or molasses, the Monod two-substrate with an intermediate (M2SI) kinetic model proposed by Rakmak et al. [14] was considered, with some of its parameter values as reported in Phayungphan et al. [31]. In the present work, the generation of a database by considering the M2SI model has methodological importance only: to assess computational intelligence models (the objective is not to assess the M2SI model).

2. Materials and Methods

Specific objectives of this work include:
  • Train neural networks to predict methane production based on the database created;
  • Train a neural network to provide the kinetic parameters of the M2SI model;
  • Evaluate the quality of the results provided by artificial neural networks;
  • Specify a membership function type for fuzzy logic;
  • Define ranges of linguistic values for the linguistic variables of the fuzzy system;
  • Apply a neuro–fuzzy methodology for parameterization of the fuzzy model;
  • Evaluate the effectiveness of the fuzzy logic approach;
  • Compare the results obtained using artificial neural network and fuzzy logic approaches.
To improve understanding of the methodology, a block diagram with a qualitative description of the steps taken can be seen in Appendix A (Figure A1).

2.1. Monod Two-Substrate with an Intermediate (M2SI) Kinetic Simulation Model

The M2SI model [14,31] adopts the following hypotheses:
  • Endogenous metabolism is present in the process.
  • An intermediate substrate (Si) is added to the hydrolysis step. This substrate is obtained from slow degradation (Ss).
  • There are two groups of microorganisms: Xe (degrades Se and Si) and Xs (grows on Ss).
Assuming these hypotheses, the M2SI model was produced using the ordinary differential equations shown below, where X is the concentration of microorganisms, S is the concentration of substrate, and P is methane production. The subscripts “e”, “s”, and “i” indicate substrates with fast degradation (Se), slow degradation (Ss), and intermediate (Si); µ and µm are the specific and maximum microbial growth rates, respectively; kd is the specific microbial death rate; K is the saturation constant; YX is the yield of microorganisms; and YP is the methane production yield from each substrate. The factors fSsX and fisX correspond to the conversion of X to Ss and of Ss to Si, respectively.
d X e d t = X e μ e + μ i k d e ,   μ e = μ m e S e K e + S e
d X s d t = X s μ s k d s ,   μ s = g ( P ) μ m s S s K s + S s
d S e d t = μ e X e Y X e S e
d S i d t = f i s X μ s X s 1 Y X s S s Y X s S s μ i X e Y X e S i ,   μ i = μ m i S i K i + S i
d S s d t = f S s X k d e X e + k d s X s μ s X s Y X s S s
d P d t = μ e X e Y P S e Y X e S e + μ i X e Y P S i Y X e S i
The function g(P) is a commutation or preference function, given by Equation (7). The variables α, Pc, fc, and fSs are the amplification factor, critical concentration, critical factor, and fraction of Ss in the initial substrate concentration (S0), respectively.
g P = 1 π t a n 1 α P P c + π 2 ,                     P c = S 0 Y P S e f c ( 1 f S s )
Equations (1)–(7) were implemented in Scilab (v. 6.1.1), using the “ode” function to solve the system of ODEs and obtain the methane concentrations for the conditions shown in Table 1. The final concentrations were compared with the values reported by Phayungphan et al. [31]. The results that showed good agreement were saved as .csv files.

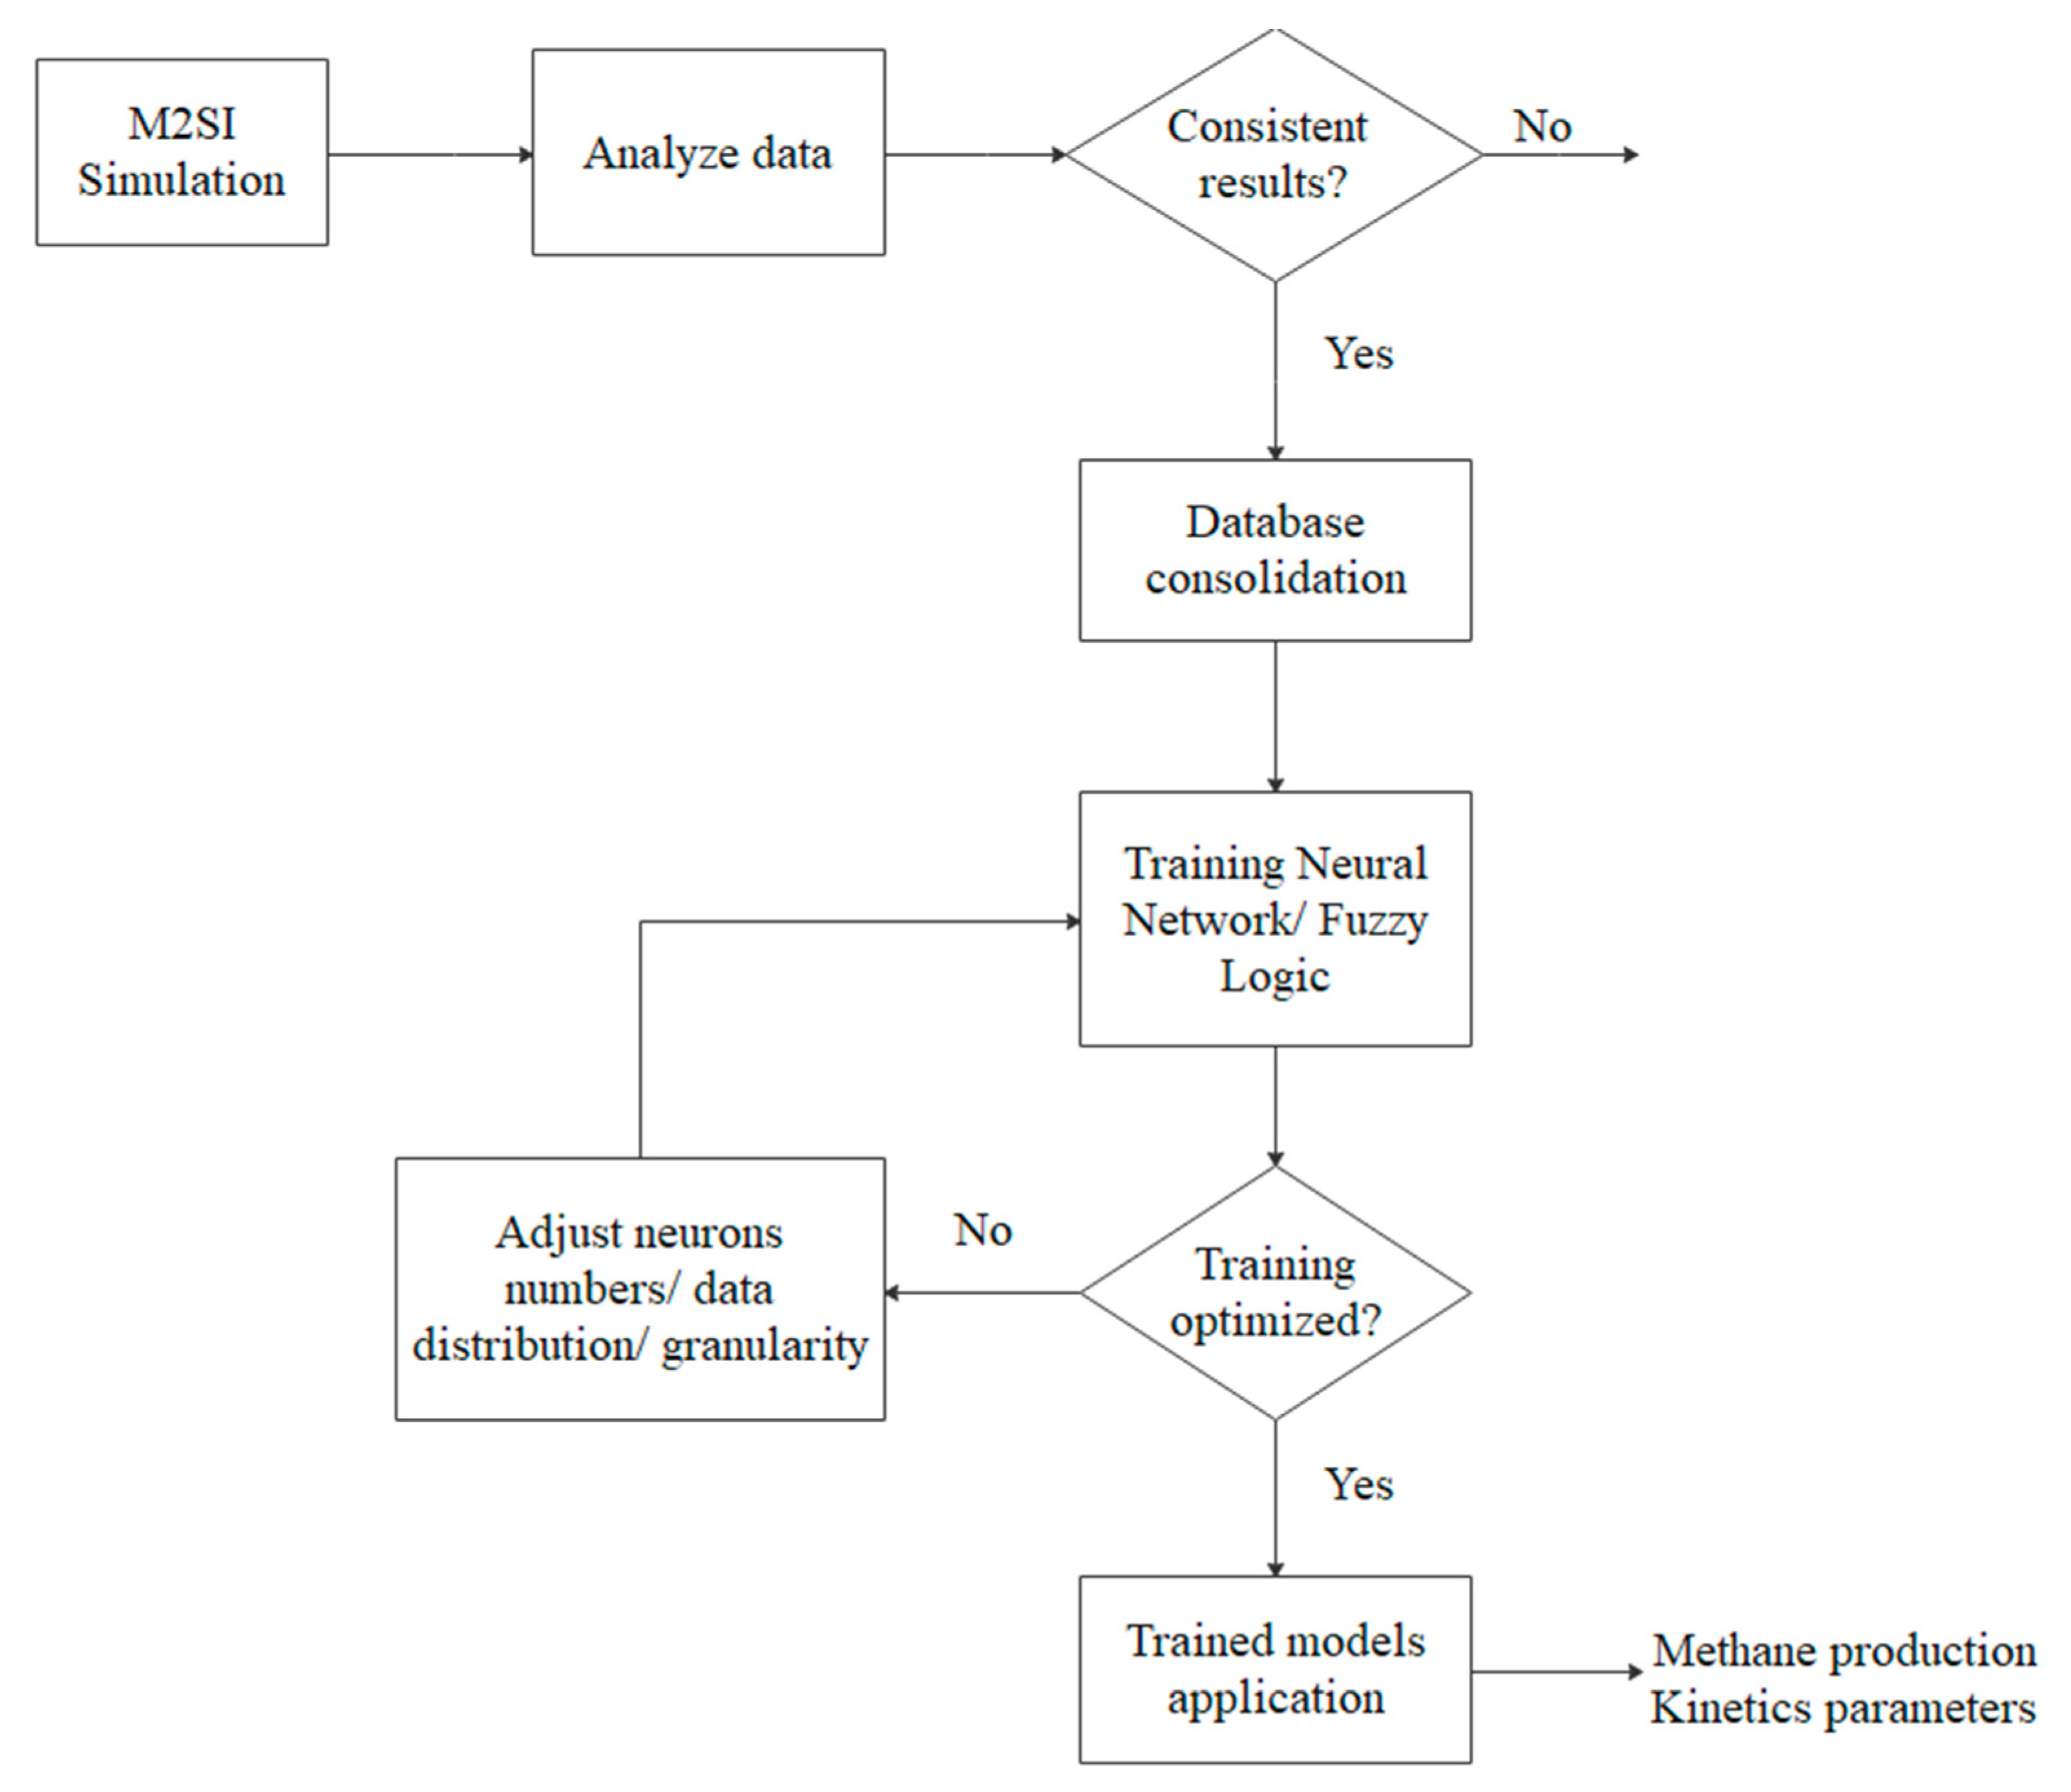
2.2. Application of the Neural Networks

Different artificial neural network architectures are described in the literature, although the most common is the multilayer perceptron (MLP). The general structure of an MLP network can be described by Equation (8). There are “n” inputs (x), with each input being accompanied by a weighting (wij) that is a network adjustment parameter. In addition, there is a bias (wi0) that provides a further degree of freedom for fitting the network response to experimental data, which can be considered an independent weighting (not associated with any input variable). All these parameters comprise the “m” neurons of the hidden layer. The hidden layer neurons are usually composed of sigmoid (ϕi) logistic (Equation (9)) and hyperbolic tangent (Equation (10)) functions. These neurons are arranged in parallel and send signals to the neurons of the next layer, until reaching the output layer (in practice, one or two hidden layers are sufficient). In the output layer, the neurons are usually composed of linear functions (a linear combination) for adjusting the amplitude and the point of operation [15].
y = i = 0 m w i φ i j = 0 n w i j x j ,   φ 0 = 1   a n d   x 0 = 1
By making u = j = 0 n w i j x j :
L o g i s t i c   f u n c t i o n : φ i u = 1 1 + e x p ( u )
H y p e r b o l i c   t a n g e n t : φ i u = exp u e x p ( u ) e x p ( u ) + e x p ( u ) = 1 e x p ( 2 u ) 1 + e x p ( 2 u )
Implementation of the neural networks was performed using the neural network package of Matlab v. R2018a, based on the review by Beale et al. [32]. Firstly, network training was performed, with simulations to predict the production of methane according to time, considering different substrate compositions, followed by network training to predict the Monod parameters as a function of substrate composition.
All the training employed the Levenberg–Marquardt backpropagation algorithm.

2.2.1. Training of the Neural Network for Obtaining Biomethane

In elaboration of the training of a “generic” neural network (a single network incorporating all the different substrate composition conditions), four inputs were considered, constituting a matrix of 4 × 688 elements. The first row of the matrix corresponds to the time variable (0 to 45 days), the second row to the normalized percentage of distillery wastewater (DW) in the substrate (95 to 100%, i.e., 0.95 to 1), the third row to the normalized percentage of molasses (ML) in the substrate composition (0 to 5%, i.e., 0 to 0.05), and the fourth line to the normalized percentage of crude glycerol (CG) in the substrate (0 and 5%, i.e., 0 to 0.05), as shown in Figure 1.
The output data of the generic neural network consisted of a 1 × 688 matrix, with a single line containing the methane production values (in mL) for each day and specific substrate composition. Hence, the network had four inputs and one output. The effect of the quantity of neurons in the hidden layer was tested until the minimum value that led to a good fit was obtained.
For simulation of specific neural networks (one for each composition condition), only the time variable was considered as an input for each condition, with a 1 × 25 matrix for the 100% DW condition and 1 × 45 matrices for the other conditions. The output of each specific neural network was the methane production (in mL) for that condition, according to time. The network structure consisted of one input and one output, and 10 neurons were used in the hidden layer.
For both types of networks (generic and specific), the distribution of the data was 70% for training, 15% for validation, and 15% for testing.

2.2.2. Network Training for Prediction of the Monod Parameters

In agreement with the work of Phayungphan et al. [31], the Monod parameters were as follows:
1.
Maximum microbial growth rate of Xeme);
2.
Maximum microbial growth rate of Xsms);
3.
Methane production yield from consumption of Se (YPSe);
4.
Fraction of Ss in the total substrate composition (fSs);
5.
Amplification factor (α).
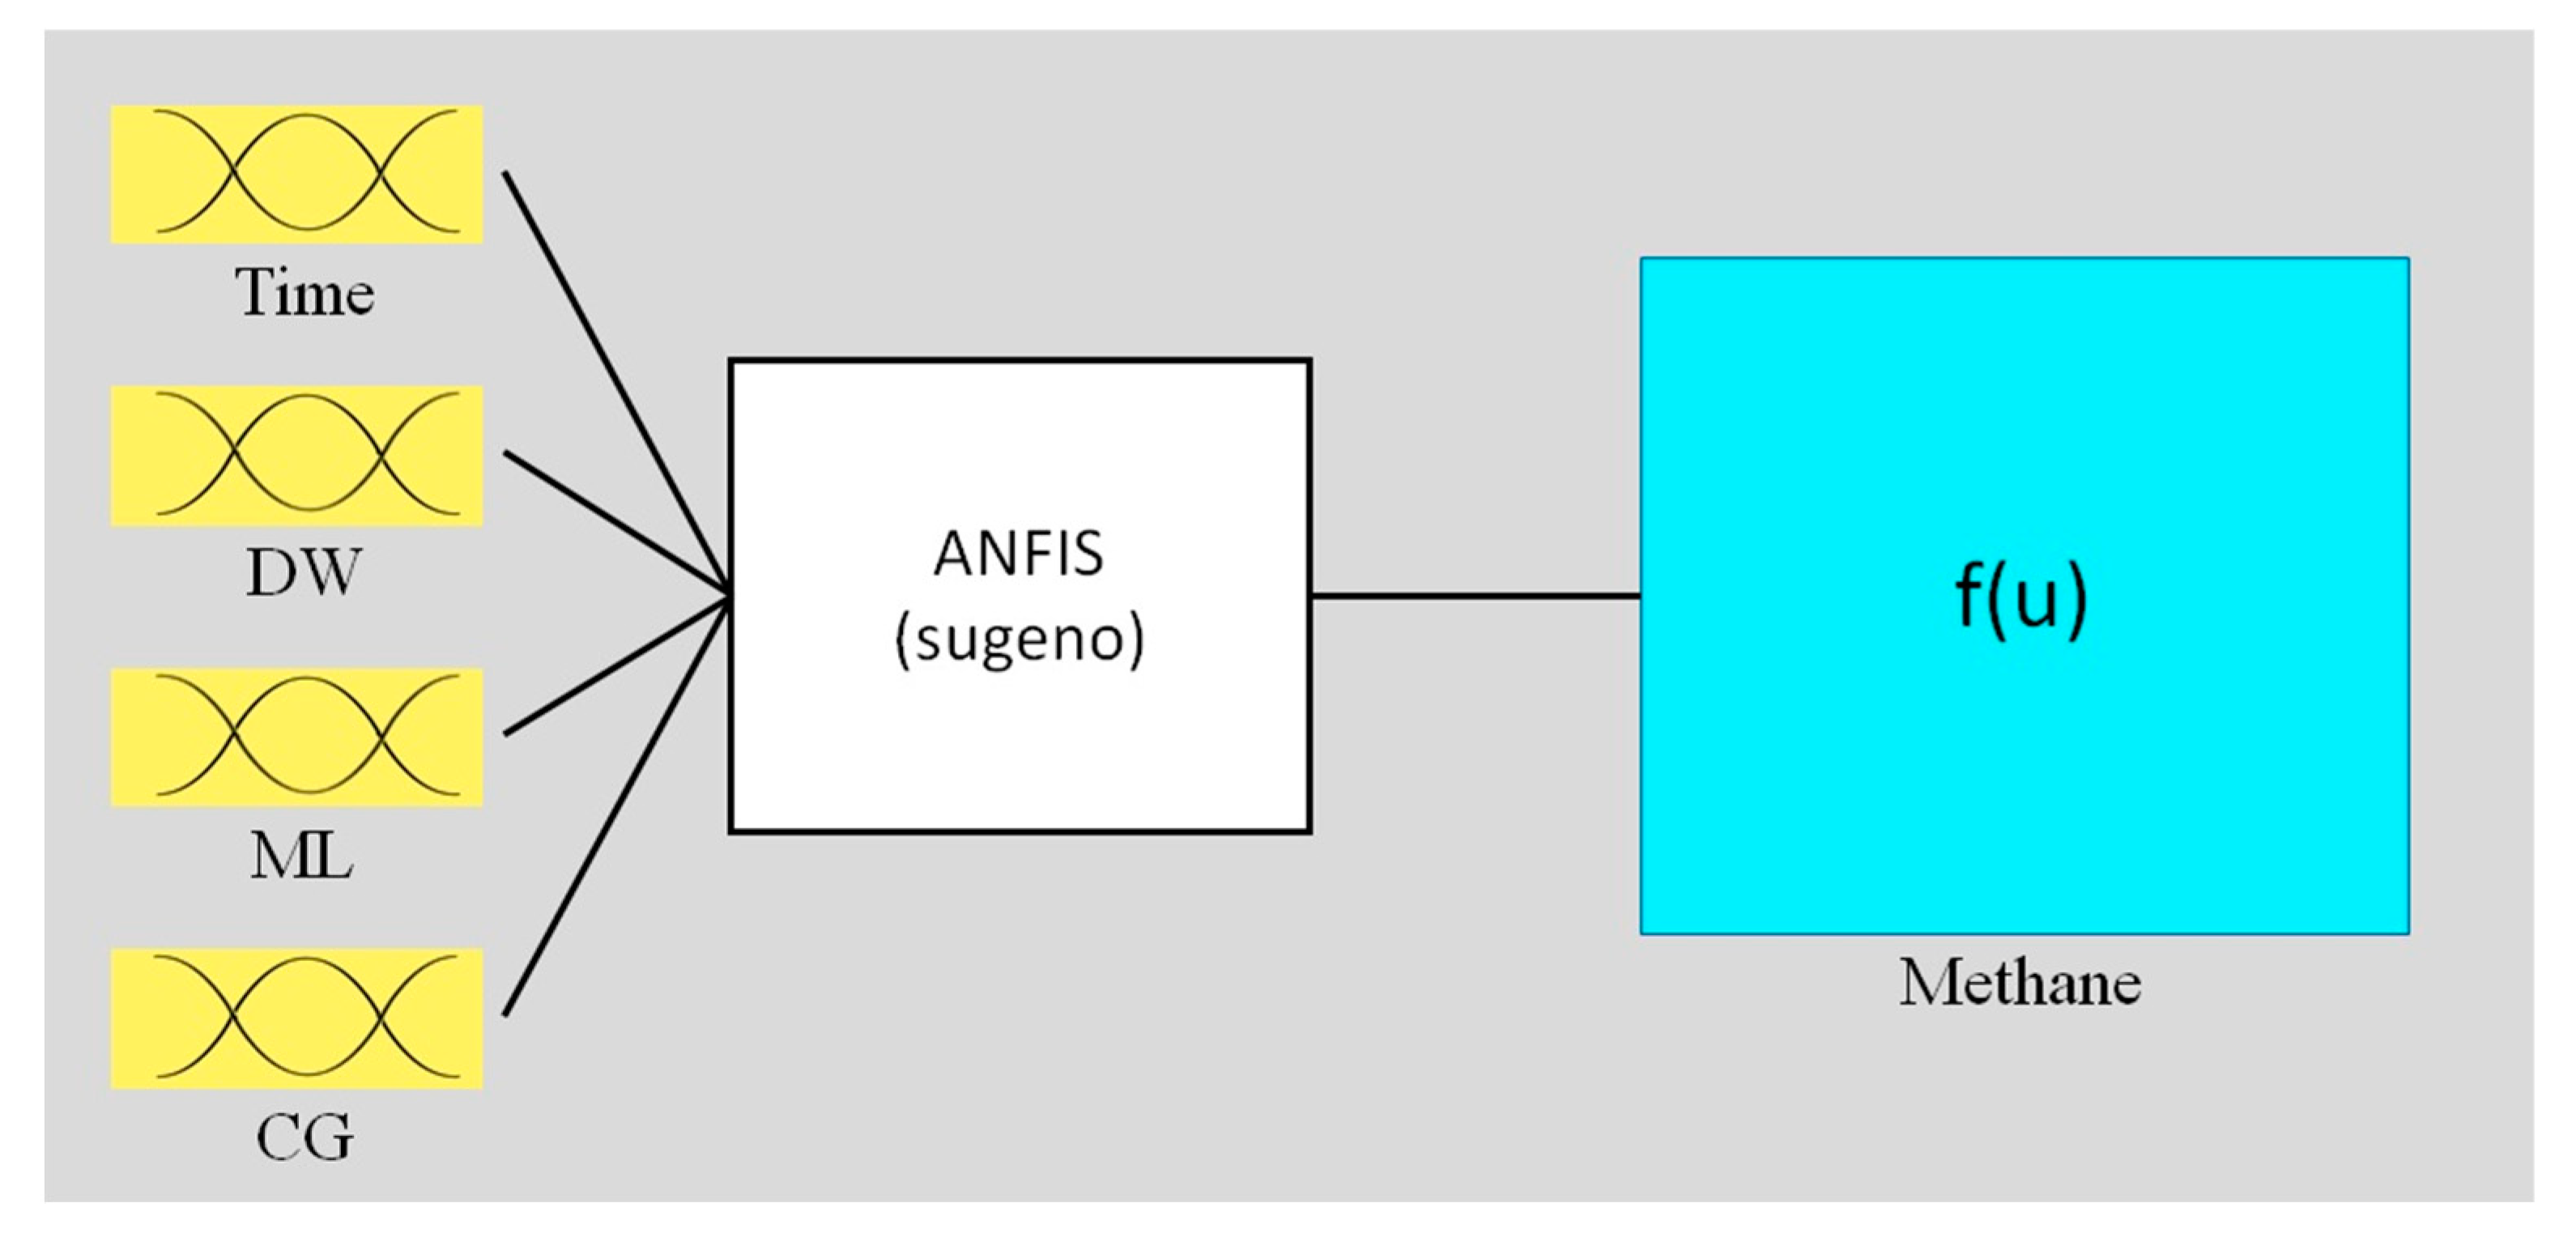
These parameters constituted the 5 outputs of the network, associated with a 5 × 8 matrix (since there were 8 substrate composition conditions). The input matrix was 3 × 8, where the 3 inputs were the percentages of distillery wastewater, molasses, and glycerol in the substrate composition for the 8 different configurations.

2.3. Fuzzy Logic

The main concepts on which fuzzy logic is based are briefly presented below.
  • Linguistic variable and linguistic value
In fuzzy logic, linguistic variables are non-numerical, being represented qualitatively by linguistic values (high, medium, and low).
  • Membership functions
In fuzzy logic, membership functions (MF) describe the linguistic value intervals and the degree of belonging (degree of membership) of an element to these values. A linguistic variable can have more than one linguistic value, with each linguistic value having its own function.
  • Heuristic rules
Based on the behavior of human thought, the heuristic rules of fuzzy logic are formulated according to the concept of cause and effect: “IF” there is a given input condition, “THEN” there is a consequent specific response. The number of rules is a combination of the inputs and depends on the granularity (degree of detail) of the linguistic variables. In particular, the Takagi–Sugeno approach uses linguistic variables for the input and numerical variables for the output. In the Takagi–Sugeno approach, the numerical variables are normally calculated using a linear function.
  • Logical operators
In cases of more than one linguistic variable in the antecedent of the rules, these variables are combined using logical operators, typically “AND” and “OR”. Each operator performs specific calculations combining the degrees of membership of the linguistic variables in the antecedent. This combination is called the degree of rule fulfillment, or the triggering force of the rule, reflecting how well a created premise reflects the specific input value. After calculation of the degree of compliance with the rule, evaluation is made of the consequent of the rule. Use of a single rule is normally ineffective in solving the problem; therefore, it is necessary to evaluate the implication of the consequent for each rule, after which all the consequents are accumulated [15,30]. In particular, in the Takagi¬–Sugeno approach, the combination of all the consequents provides the final result (output variable) of the problem.
An excellent strategy that has increased the possible applications of fuzzy logic is its combination with neurocomputing and/or genetic algorithms. The ANFIS (Adaptive-Network-Based Fuzzy Inference System) methodology functions in a similar way to artificial neural networks. It involves defining the parameters of the Takagi–Sugeno model, which enables the inference system to perform a mapping of the relationship between the inputs and the outputs using implication rules. The parameters are adjusted using the backpropagation algorithm in combination with a statistical least squares method [30].
The fuzzy logic was implemented using the ANFIS package of Matlab R2018a and the database generated in the M2SI simulation.
The data were divided into 628 points for training and 60 points for testing. The files were converted to text, with the data arranged in columns, where the last column corresponded to the output and the other columns corresponded to the input variables, as shown in Figure 2 (noting that Figure 2 is not the same as Figure 1). The text file was loaded into the ANFIS program.
In the generation of the FIS, evaluation was made of the granularity of the input variables in order to find the one that produced the lowest root mean square error. The Gaussian membership function (gaussmf) was employed (Equation (11)), which uses the standard deviation (σ) and mean x ¯ of the input values (x) [30]. This function was chosen based on the positive results observed in earlier tests.
F P x = exp x x ¯ 2 2 σ 2
The ANFIS generated a Takagi–Sugeno type FIS, with four fuzzified input variables and an output variable calculated using a linear function (Figure 3), with parameter adjustment based on neural network concepts. A hybrid training algorithm was selected, combining backpropagation and the least squares method.

3. Results and Discussion

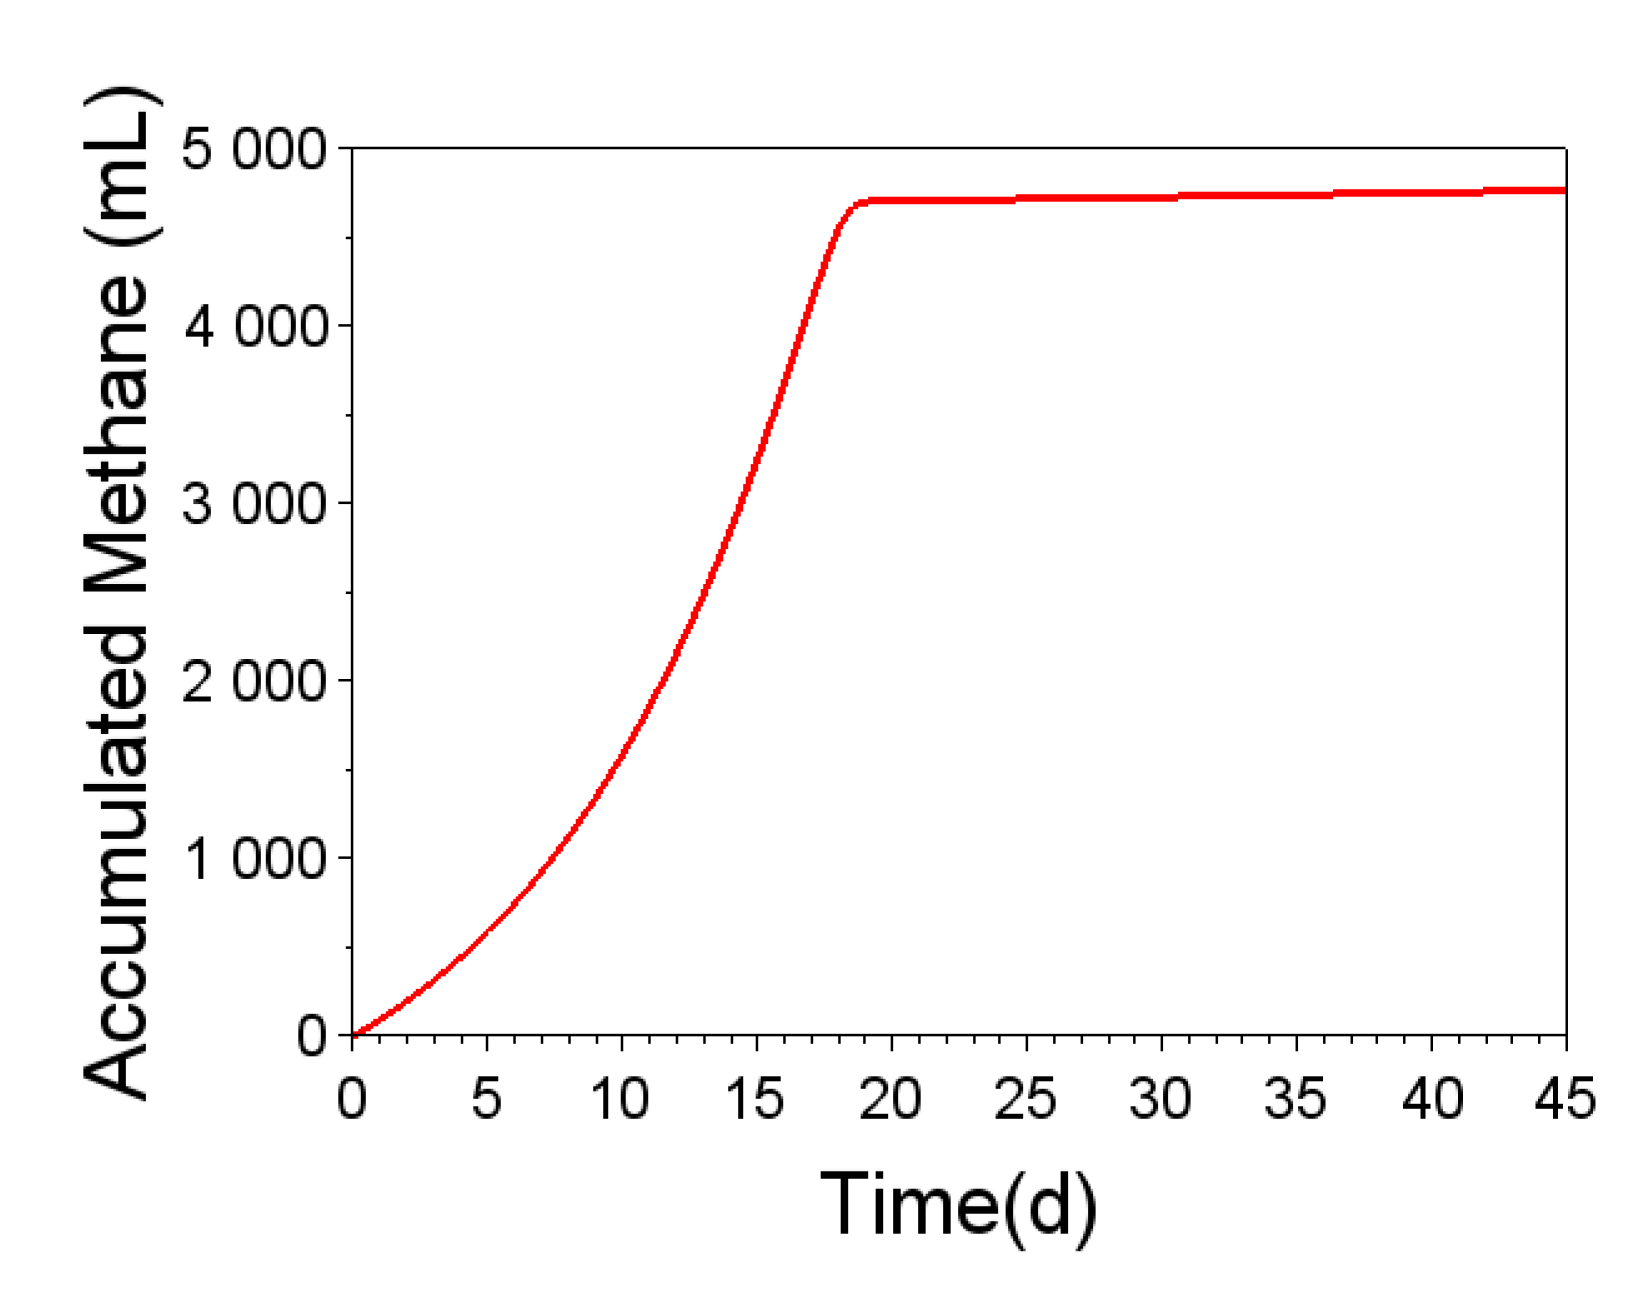
3.1. Biomethane Production Considering Monod Kinetics

Based on the values and ranges for the Monod kinetic parameters published by Phayungphan et al. [31] and the M2SI model proposed by Rakmak et al. [14], the accumulation of methane over time was estimated for the co-digestion of molasses (ML) or crude glycerol (CG) and distillery wastewater (DW). Comparison of our simulation results (of the reactor with M2SI kinetics) with some experimental results reported by Phayungphan et al. [31] indicated very satisfactory agreement, with low divergence for compositions containing 100% DW, 99% DW/1% ML, 98% DW/2% ML, 97% DW/3% ML, 96% DW/4% ML, 95% DW/5% ML, 99% DW/1% CG, and 95% DW/5% CG, which comprised the database directly used to train the neural networks and the fuzzy model. Methane production rates were similar to those presented by Phayungphan et al. [31]. The majority of the substrate degradation occurred in the first 10 days, after which there was a substantial decrease in methane production, indicative of possible inhibition of microbial activity. Total accumulated methane at the end of each batch is summarized in Table 2. In general, it was evident that the addition of glycerol to the distillery wastewater led to greater production of methane compared to the addition of molasses.
The region of compositions containing about 98% DW/2% CG and 97% DW/3% CG, in turn, was posteriorly considered for additional assessment of the predictive capability of a hybrid M2SI–Neural Network model (as will be seen in Section 3.5.1.) and analysis of the response surface generated by the fuzzy model (as will be seen in Section 3.6.1.).

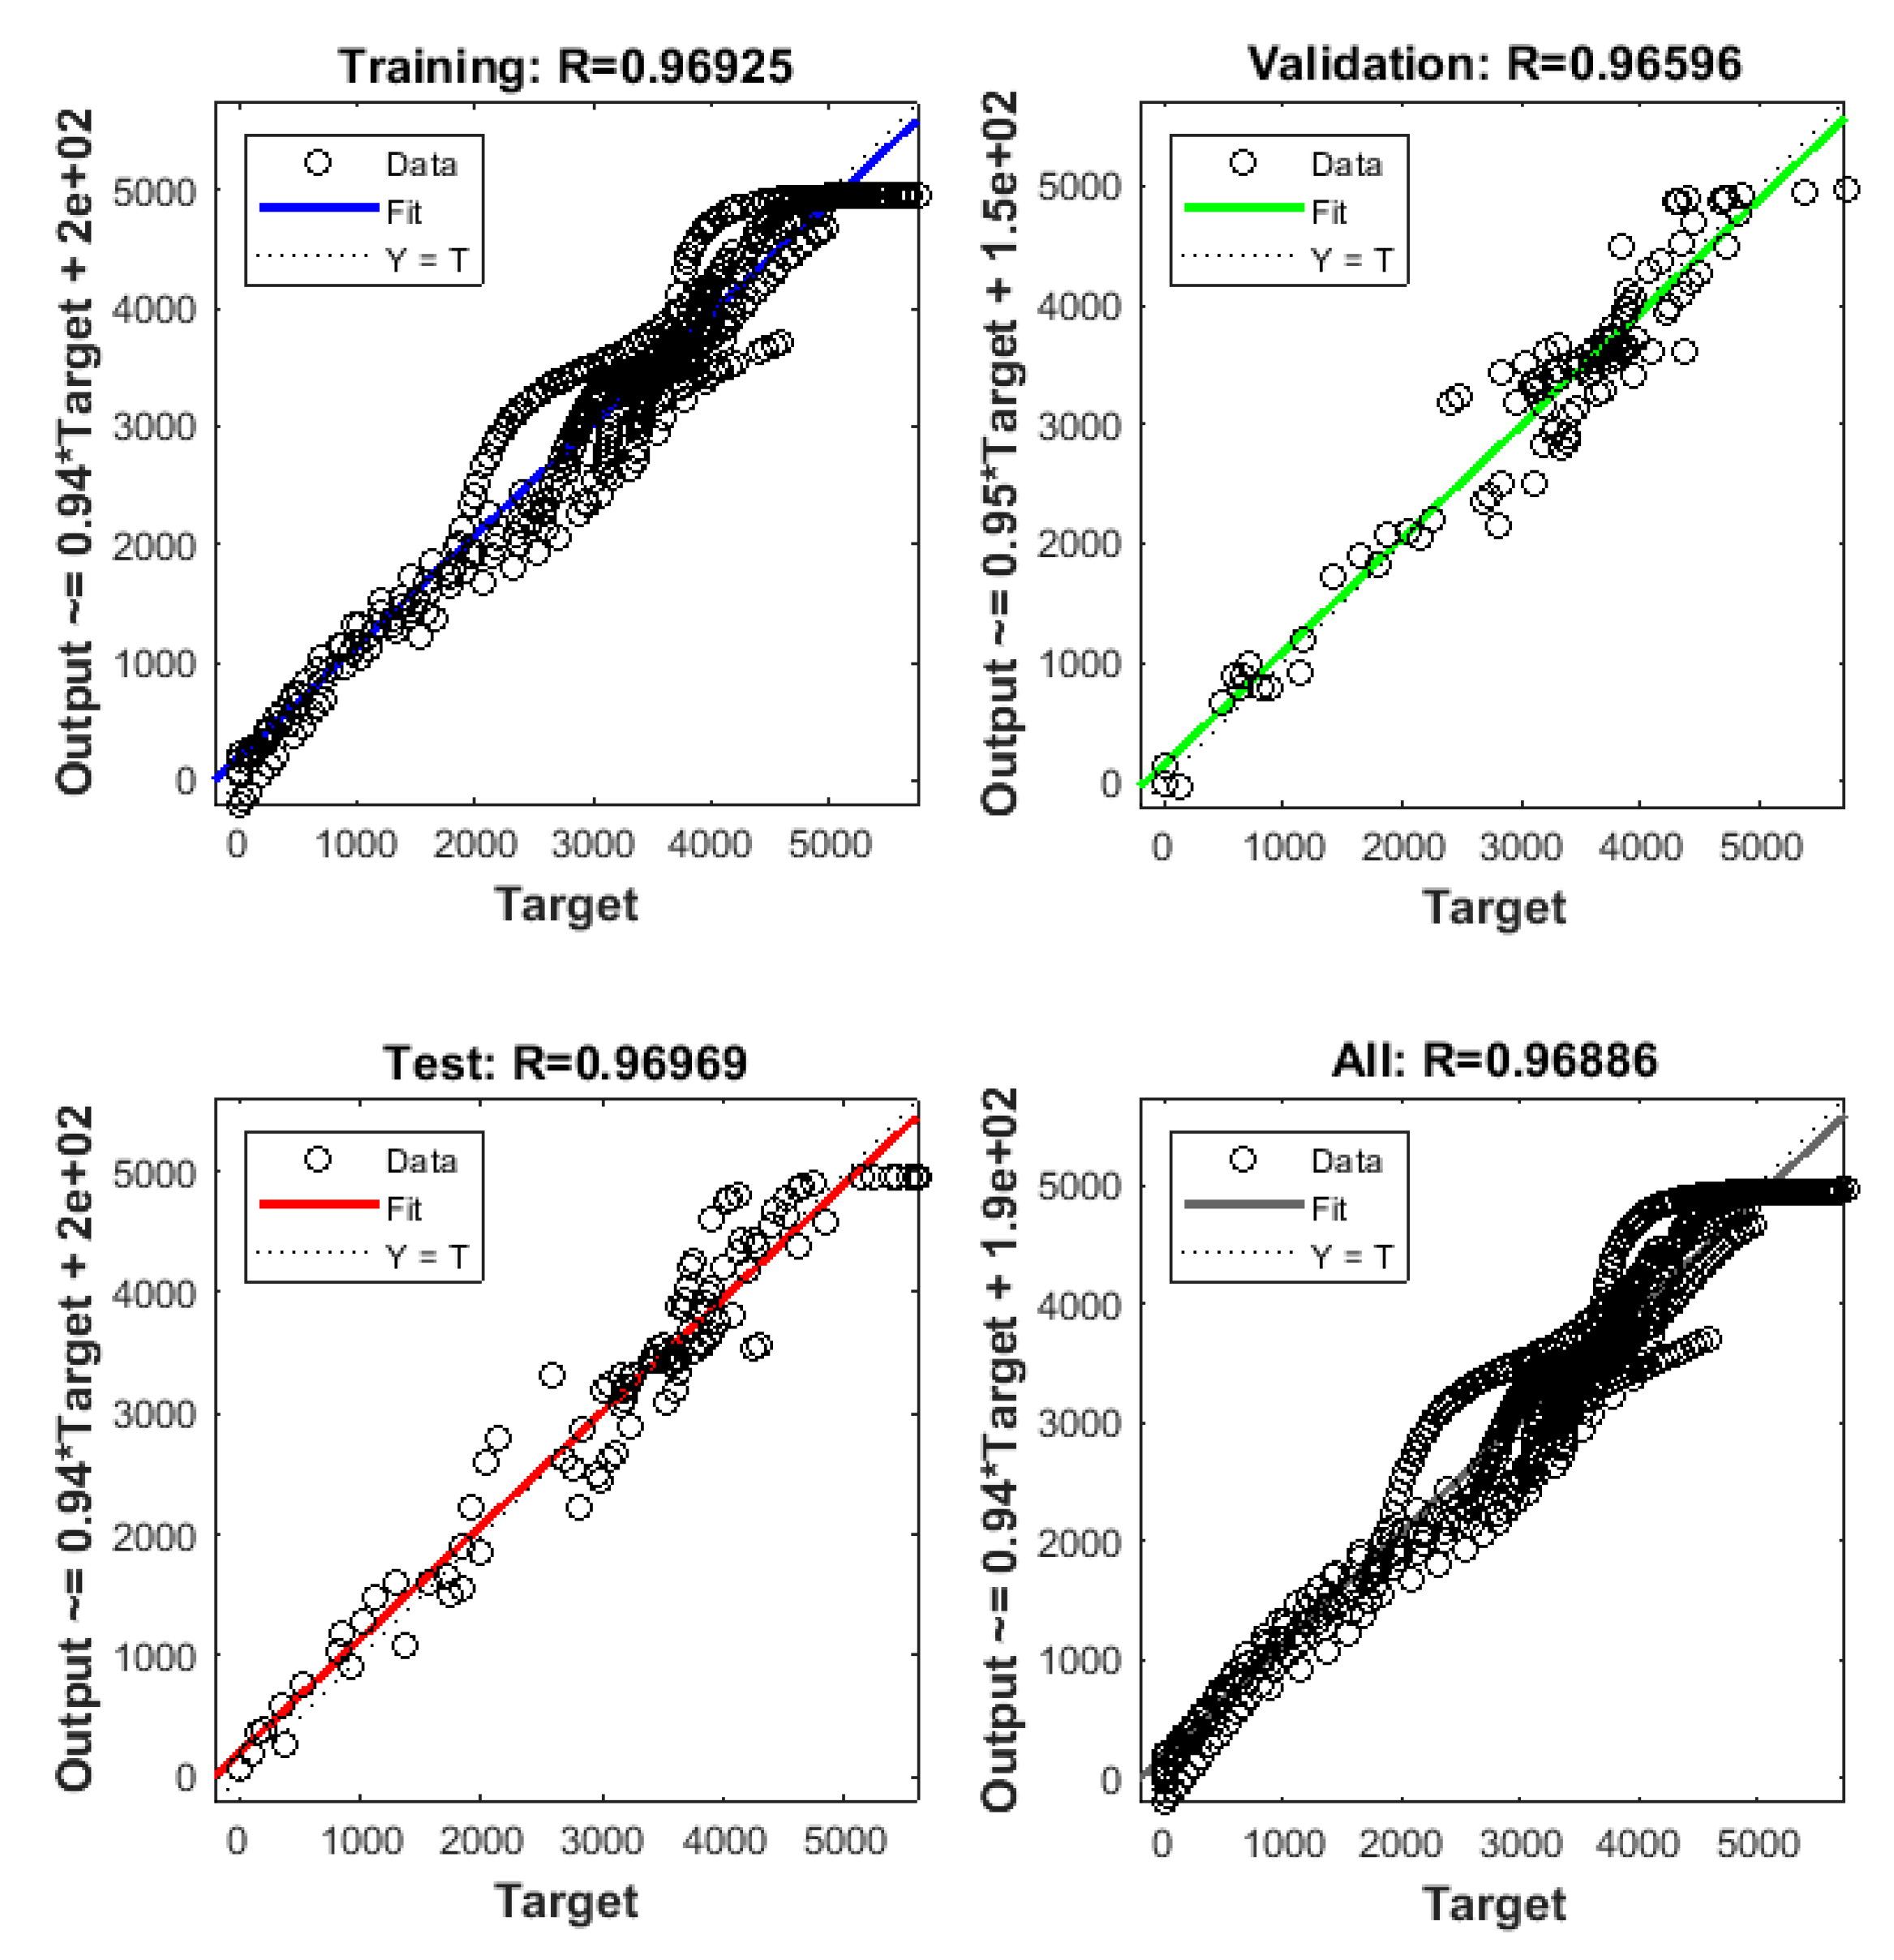
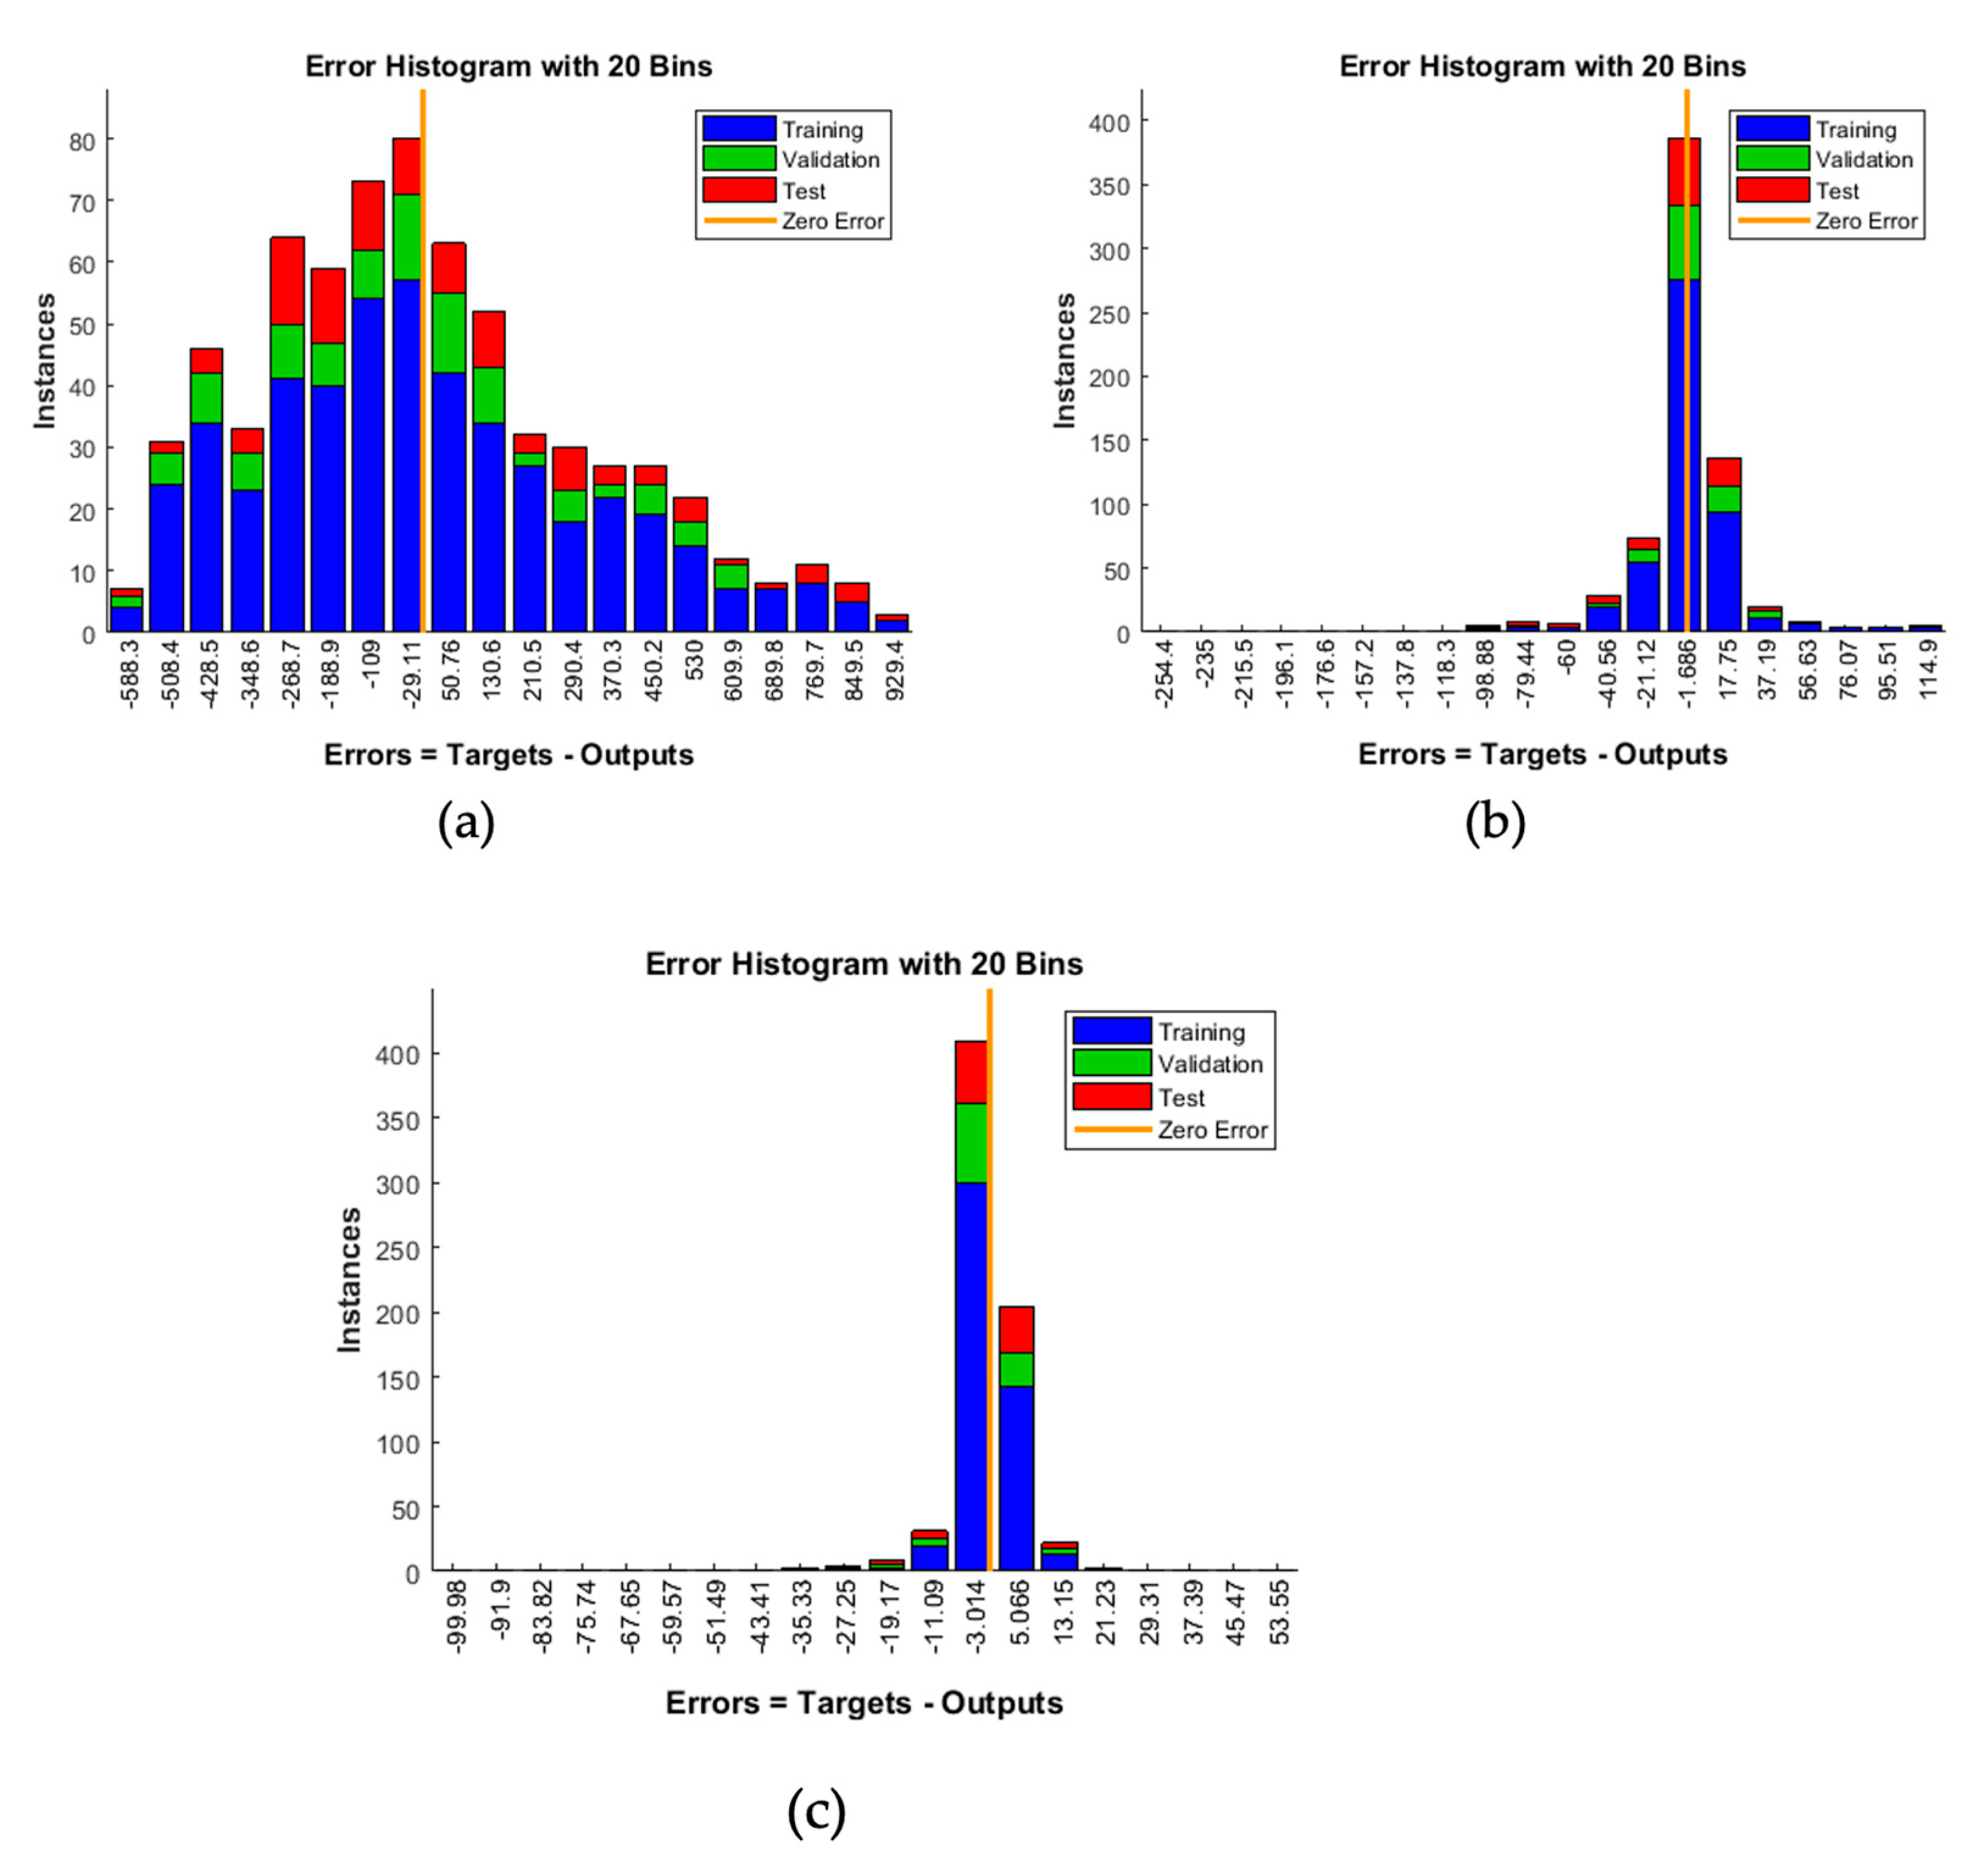
3.2. Training of the Neural Network for Biomethane Production

The training of the artificial neural network for methane production according to time, varying the substrate composition (Section 2.2.1), was accomplished by testing various quantities of neurons to find the minimum quantity of neurons in the hidden layer that provided a good fit between the intended output value and the value provided by the neural network. A lower number of neurons means that there is a lower number of “synapses” to be incorporated, resulting in faster processing of information by the network. The results obtained for “n” of 2, 14, and 60 are shown in Figure 4, Figure 5, Figure 6 and Figure 7. It is straightforward to see that two neurons are not enough, with low R2 values. The minimum number of neurons in the hidden layer required to obtain satisfactory results was 14.
As can be seen in Figure 4, Figure 5, Figure 6 and Figure 7, the fitting improved substantially when the number of neurons was increased from 2 to 14 neurons, while further increase to 60 neurons had a more subtle effect. Hence, increasing the number of neurons progressively improved the fit of the model, although the improvement was not significant after 60 neurons, so further testing was unnecessary. The computation times to obtain the results in Figure 4, Figure 5 and Figure 6 were, respectively, instantaneous (2 neurons), 1s (14 neurons) and 11s (60 neurons).
No previous studies were found in the literature that used neural networks for the prediction of methane production from the co-digestion of molasses and glycerol. Yetilmezsoy et al. [33] used neural networks in an investigation of the production of biogas and methane from the digestion of molasses wastewater in a UASB reactor under mesophilic conditions. The input variables considered in the simulation were the organic loading, influent and effluent pH and alkalinity, temperature, volatile acids concentration, and COD. Three hidden layers with sigmoid tangent functions were applied, with optimal numbers of nine and twelve neurons obtained for the production of biogas and methane, respectively. Eleven types of network training algorithms were evaluated, with the best results obtained using the SCG (scaled conjugate gradient) algorithm, which provided coefficients of determination in the testing stage of 0.935 for biogas and 0.924 for methane. The fit of the model for methane production was poorer than found in the present work (R2 = 0.99983 for 14 neurons), but it was considered satisfactory by the authors, considering the greater complexity of the system that was modeled by them.

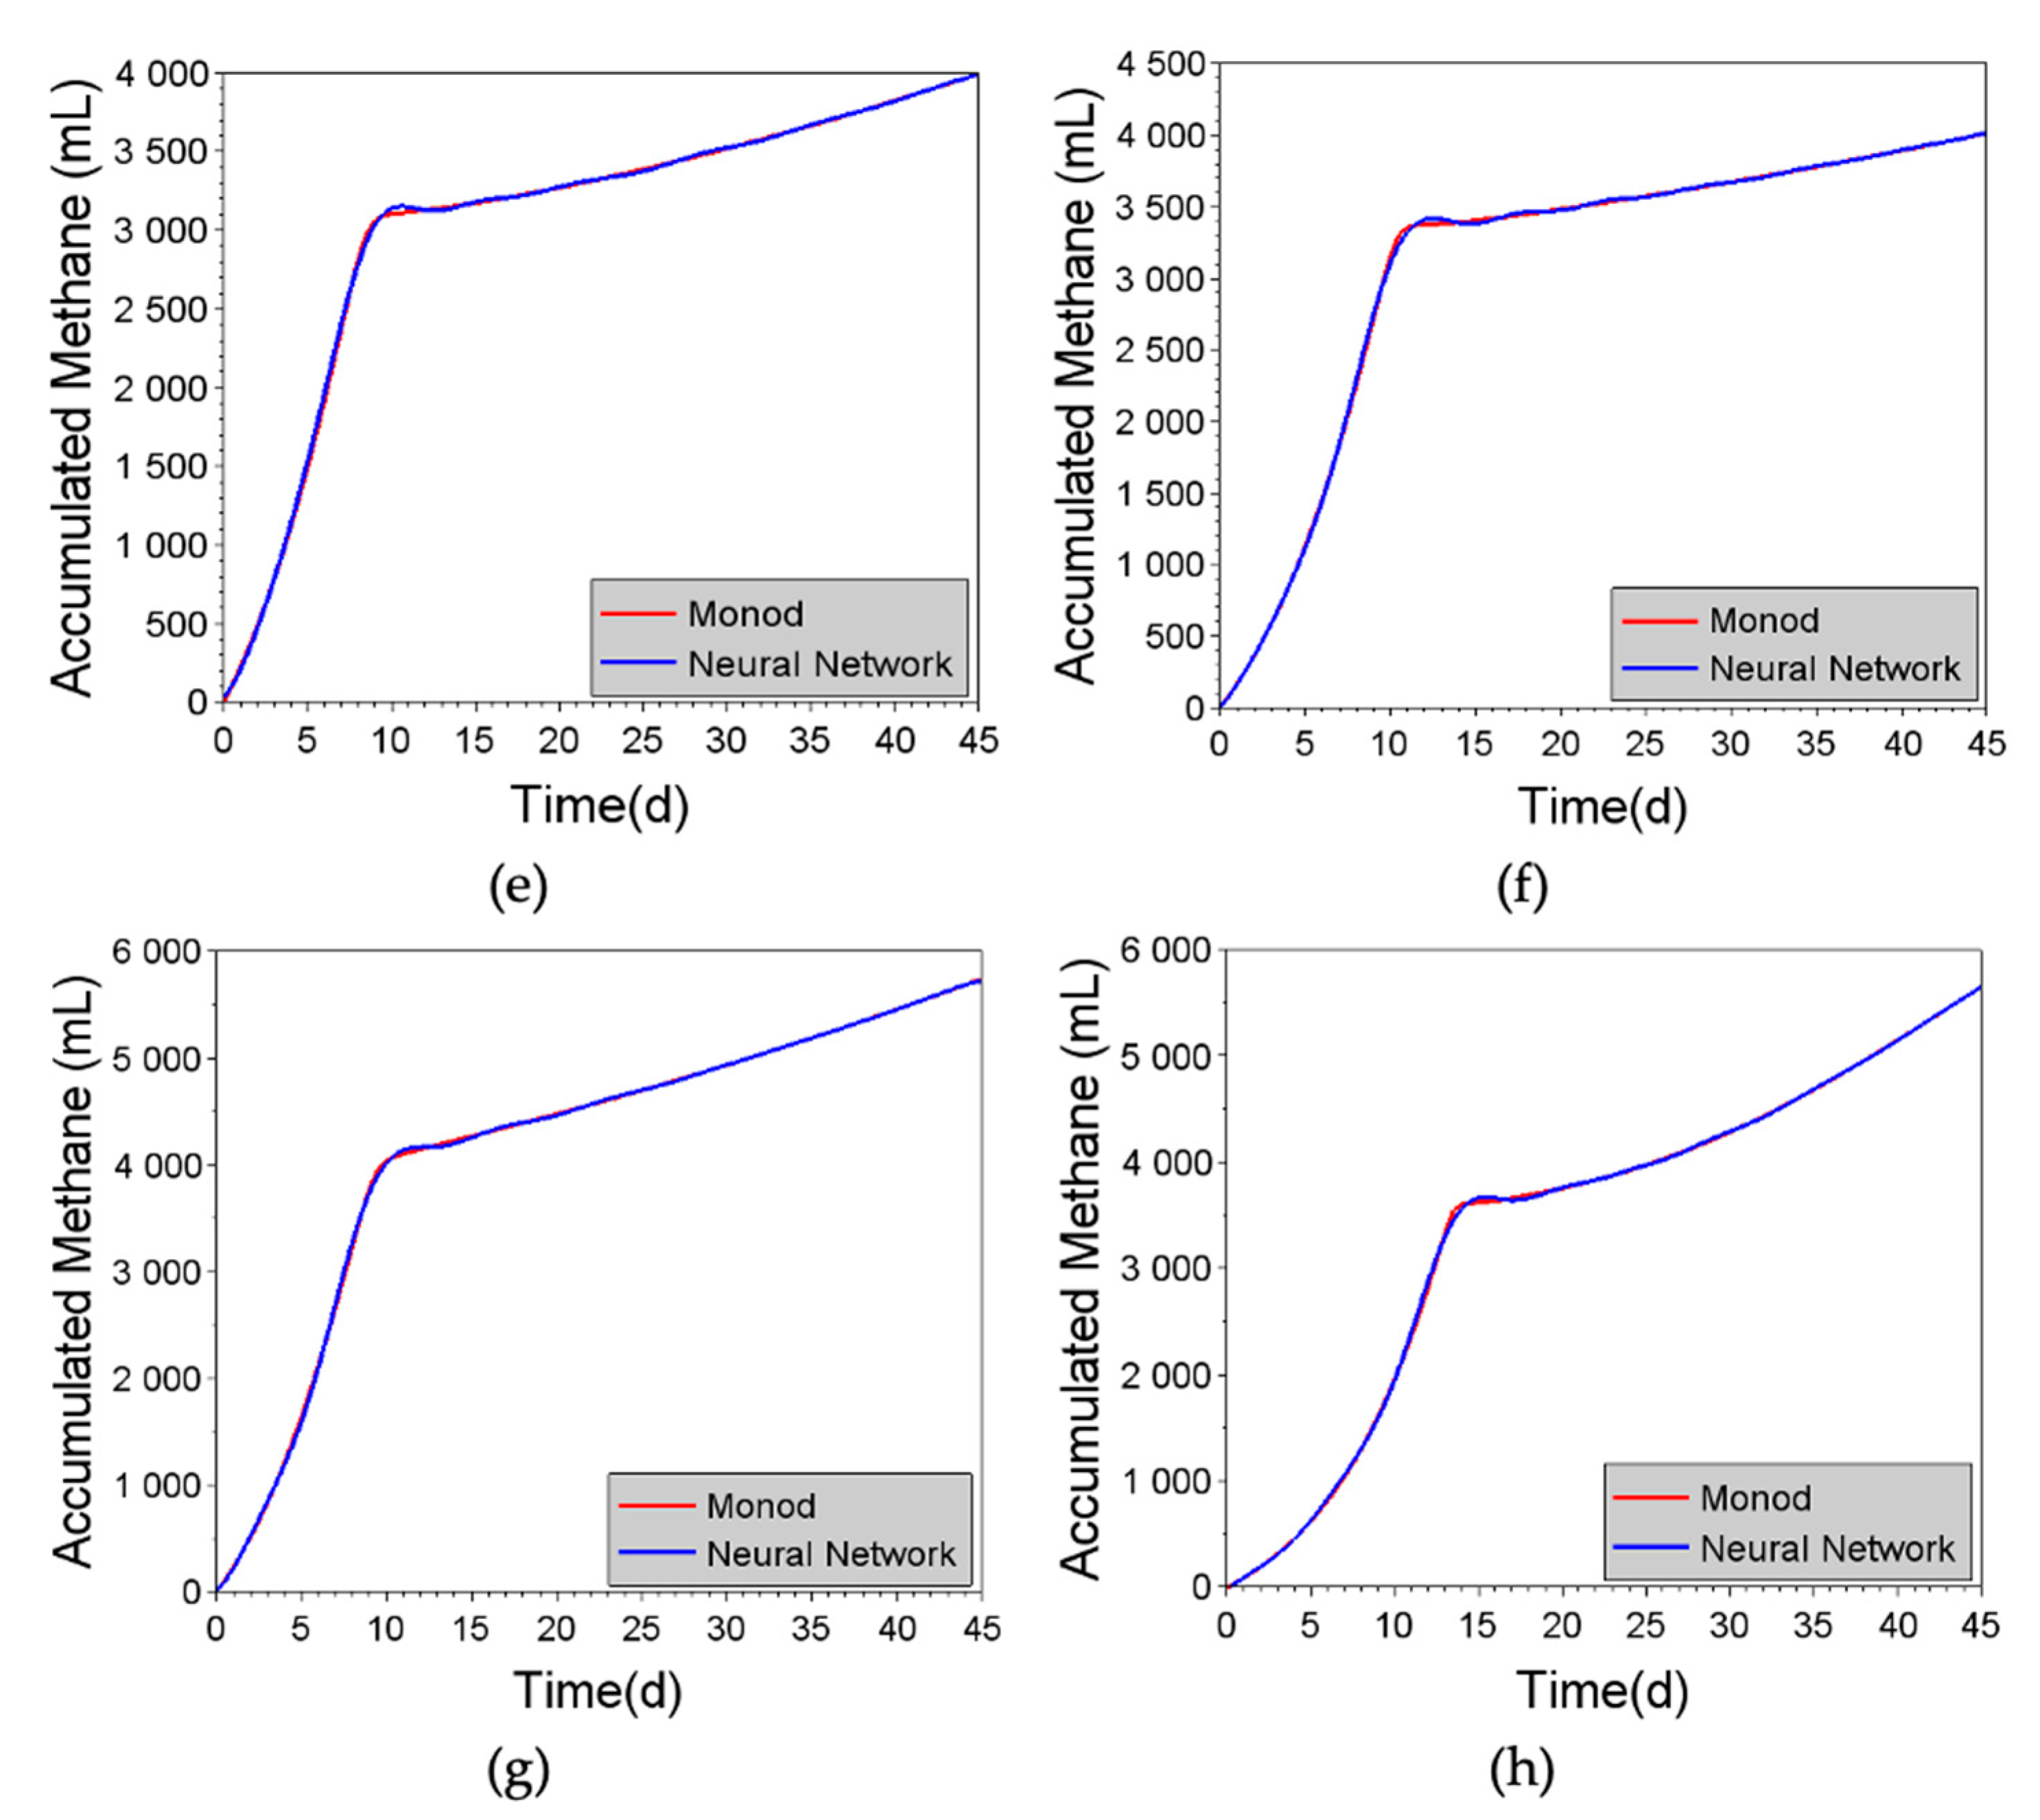
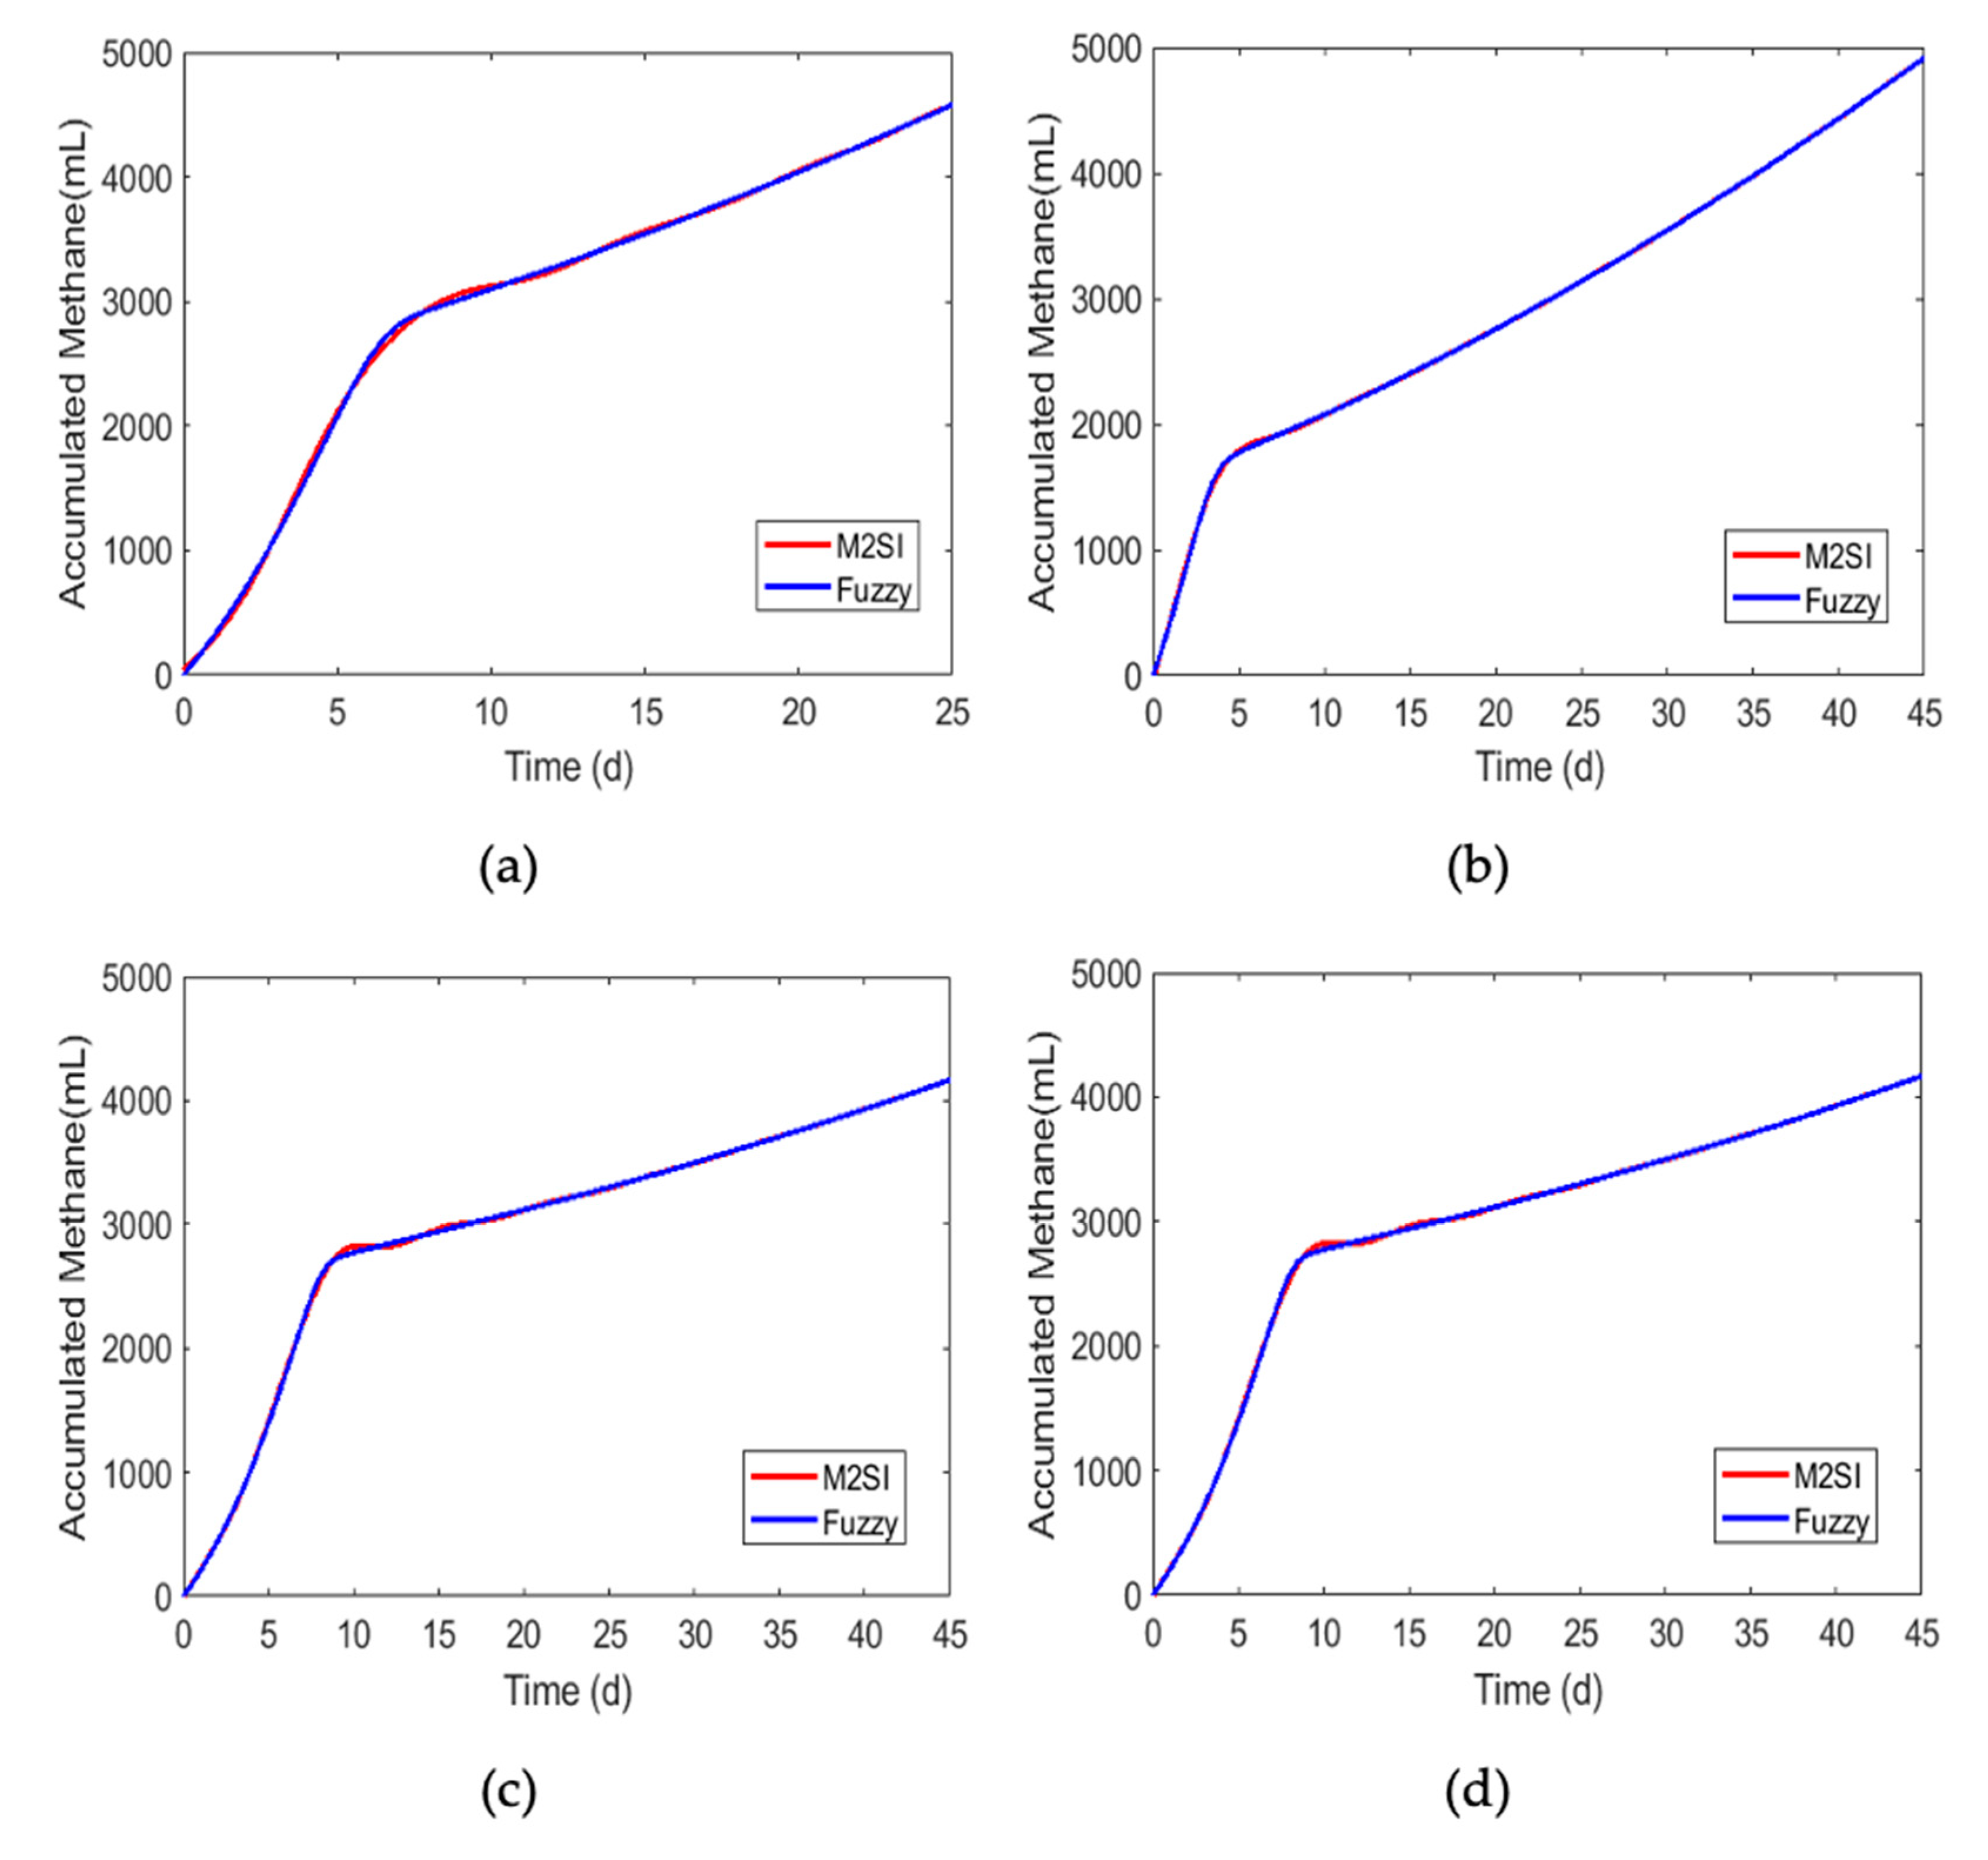
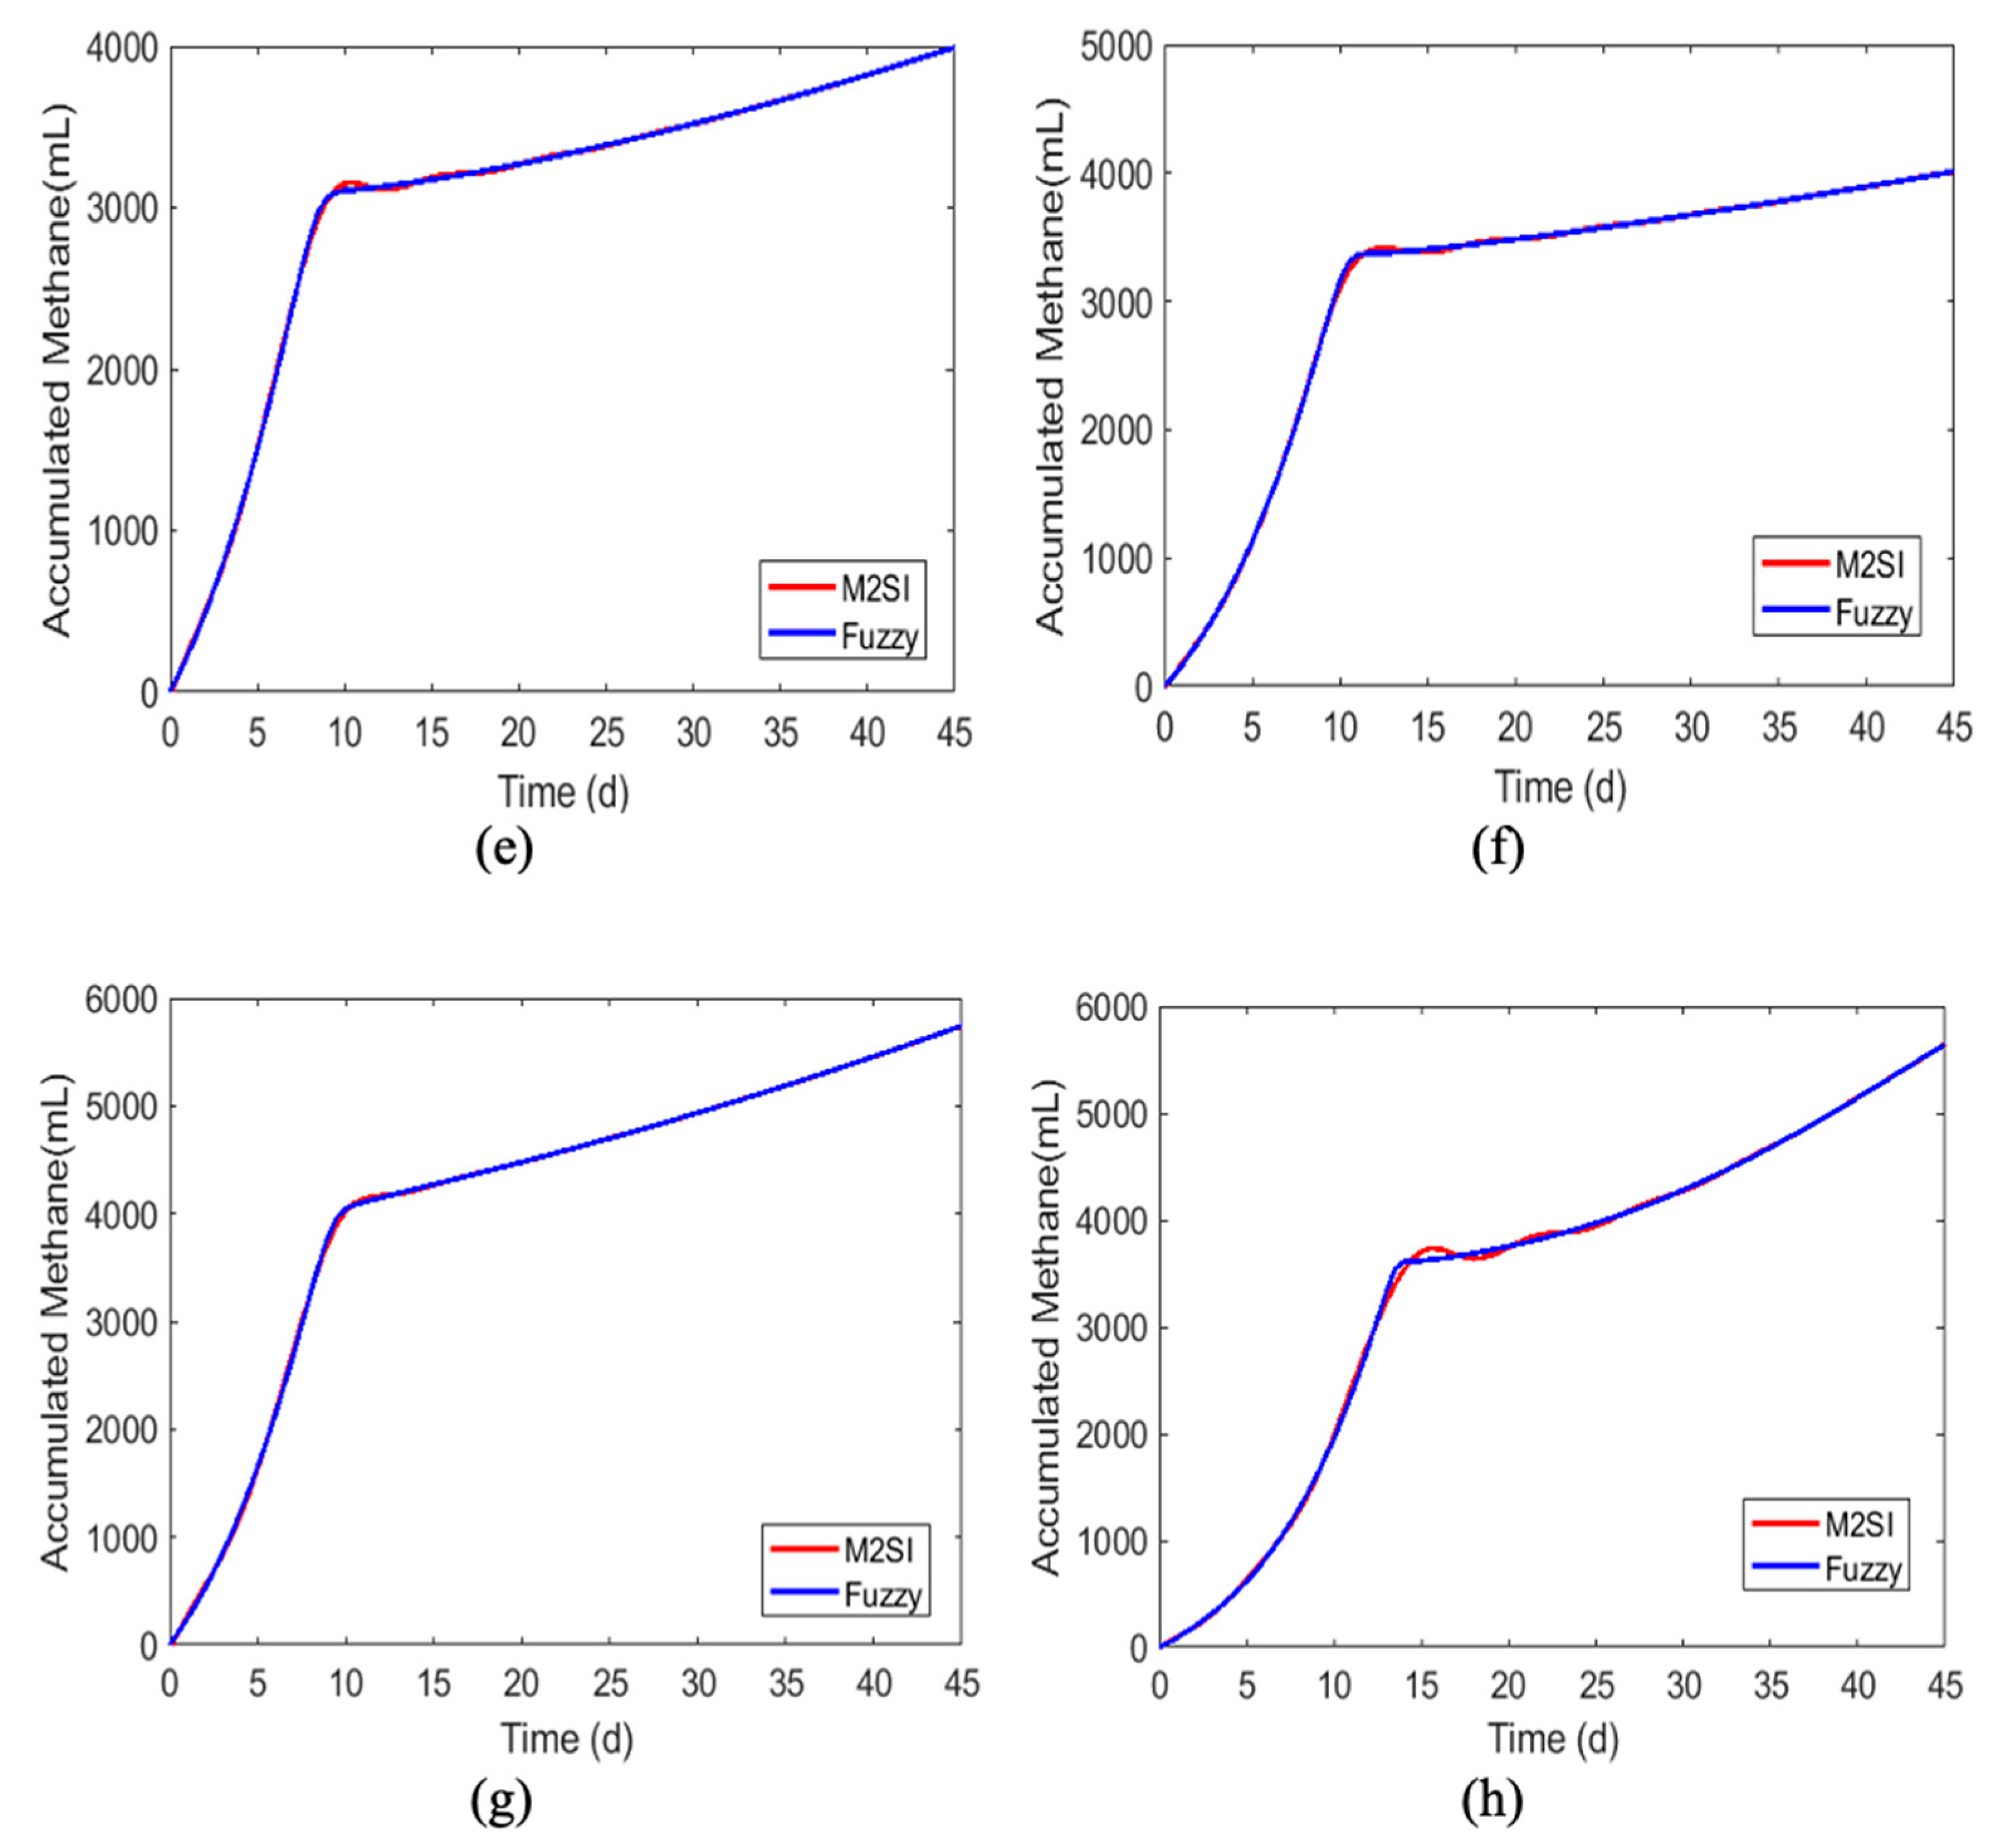
3.3. Comparison of Prediction of Methane Production Considering the M2SI Model and the Generic Neural Network

After training the neural network, a comparison was made of the predicted methane production obtained considering the M2SI model and the artificial neural network (Figure 8).
As shown in Figure 8, good agreement was obtained between the predicted biomethane production curves for the M2SI model and the generic neural network for the different conditions. Nonetheless, it should be noted that the predictions could be improved further by increasing the number of neurons in the hidden layer (to 60, for example), without risk of overfitting (see Figure 9).

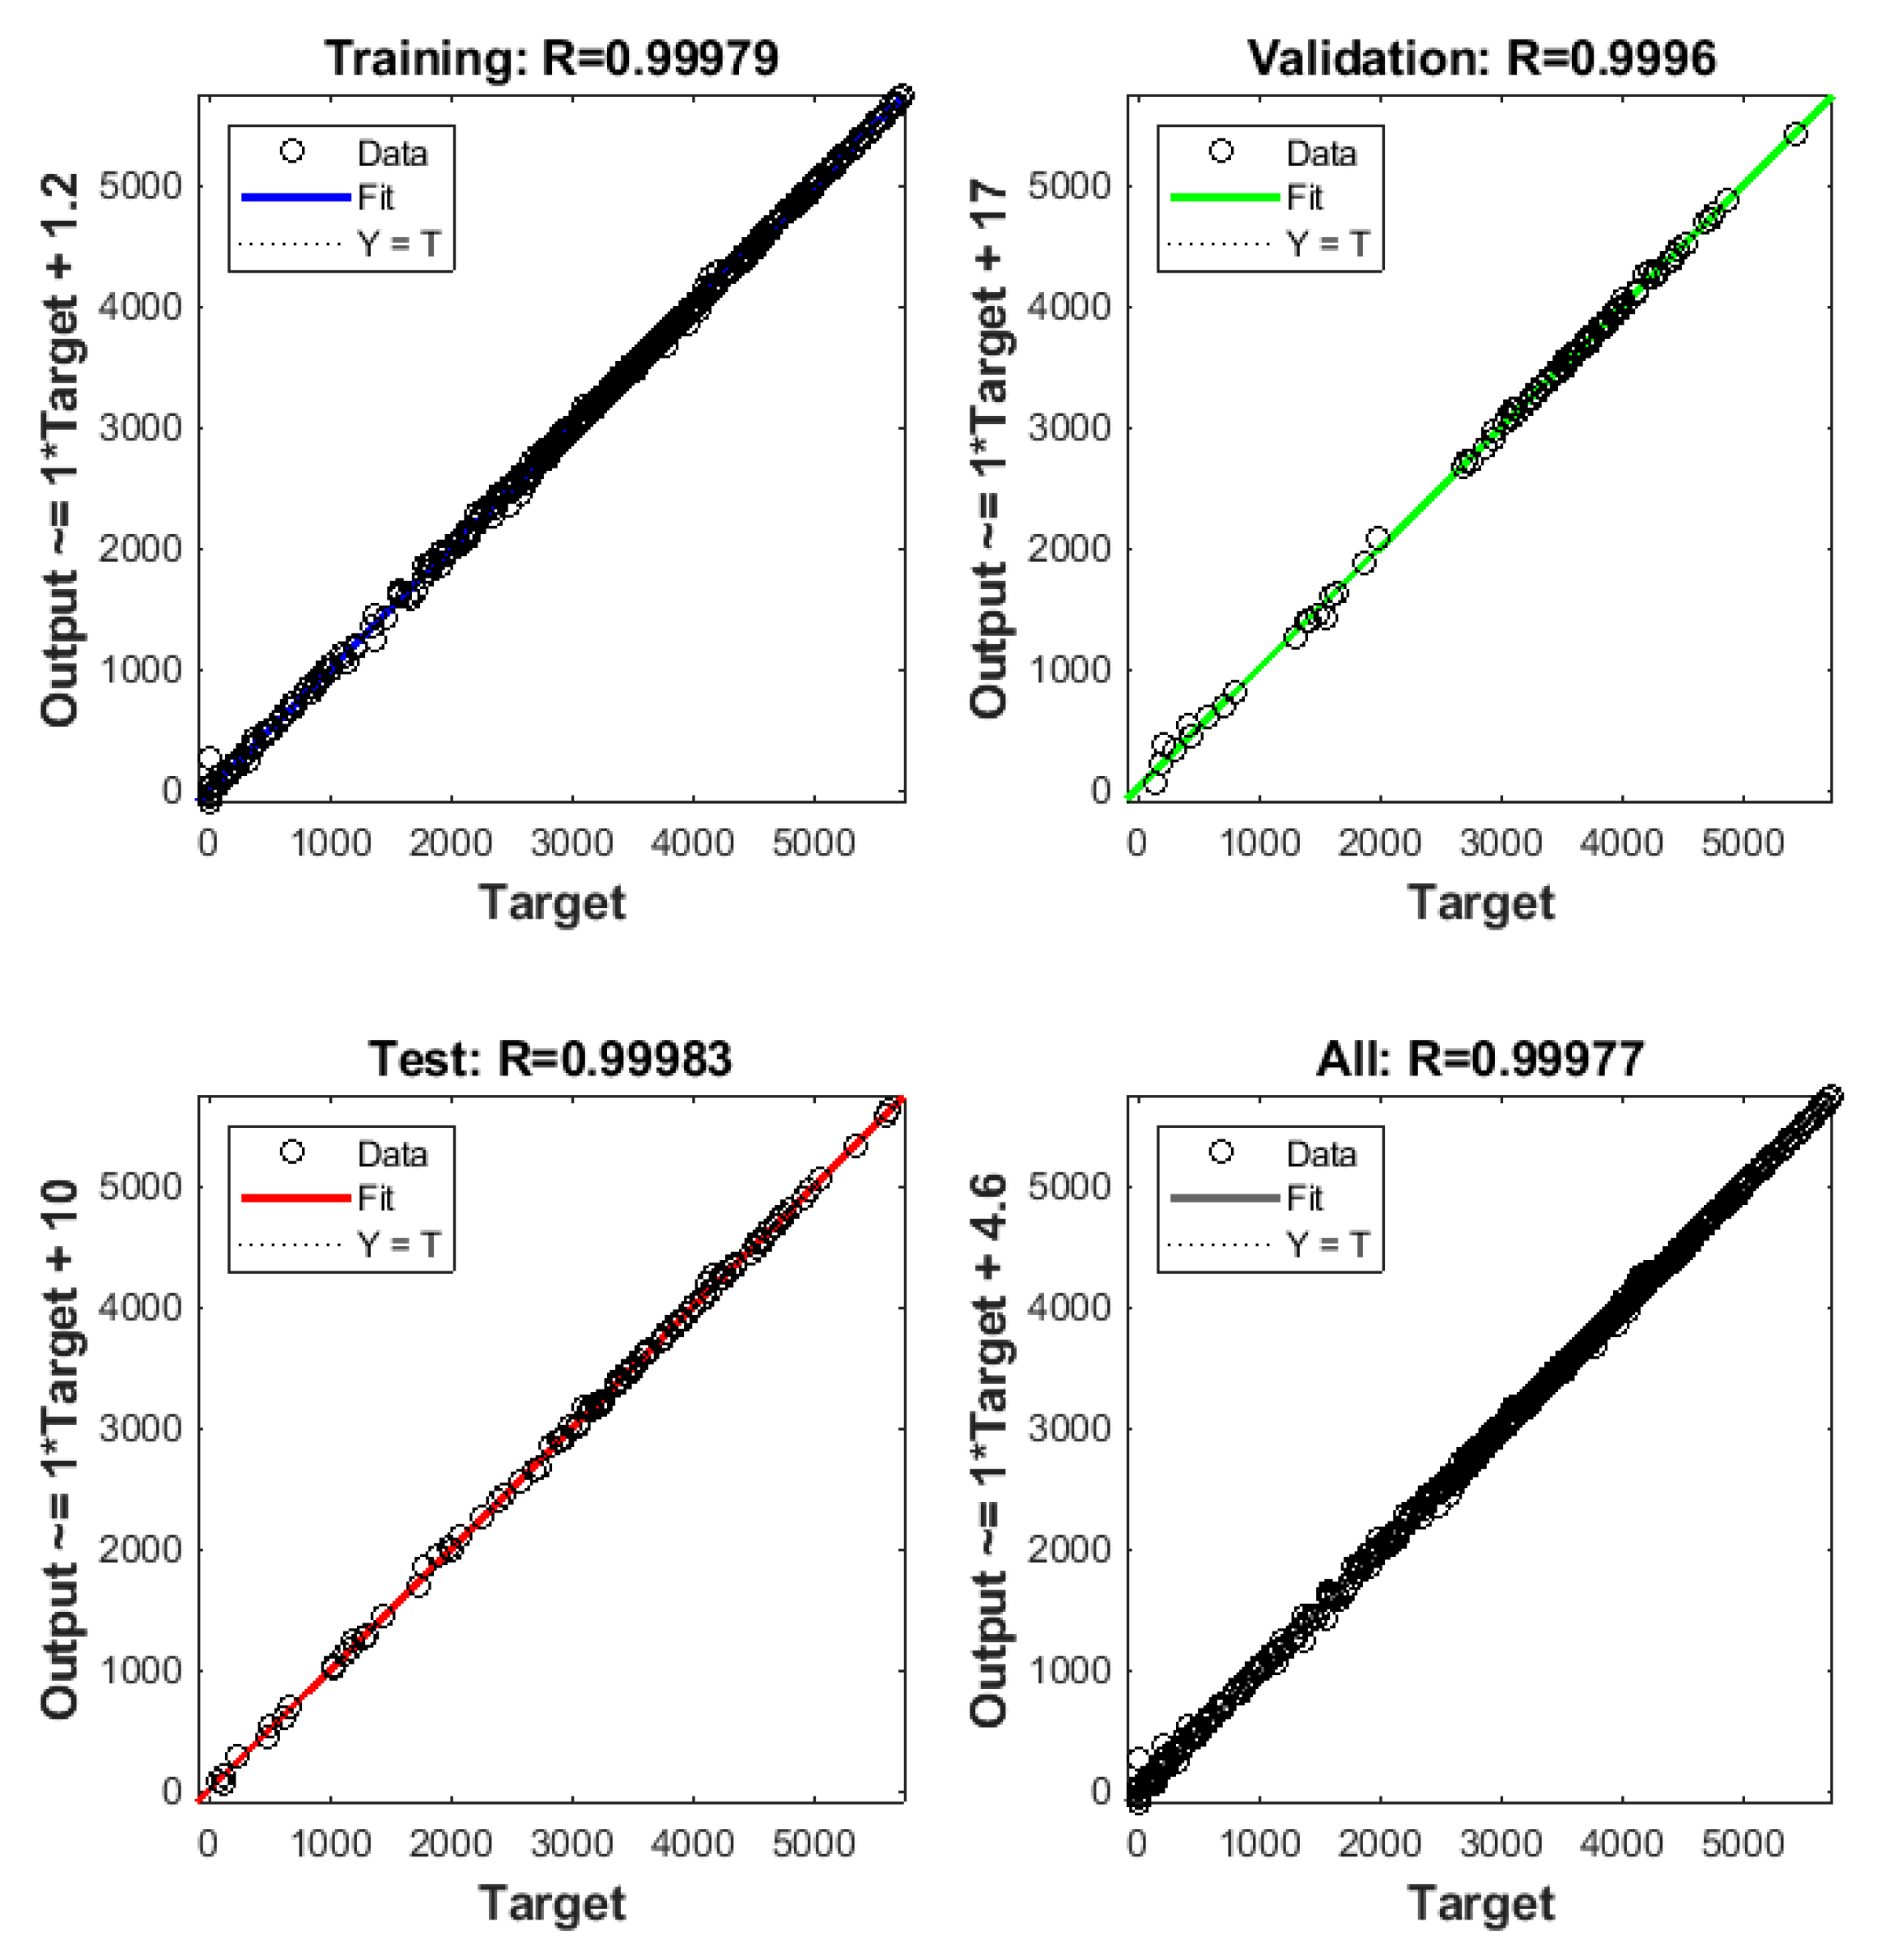
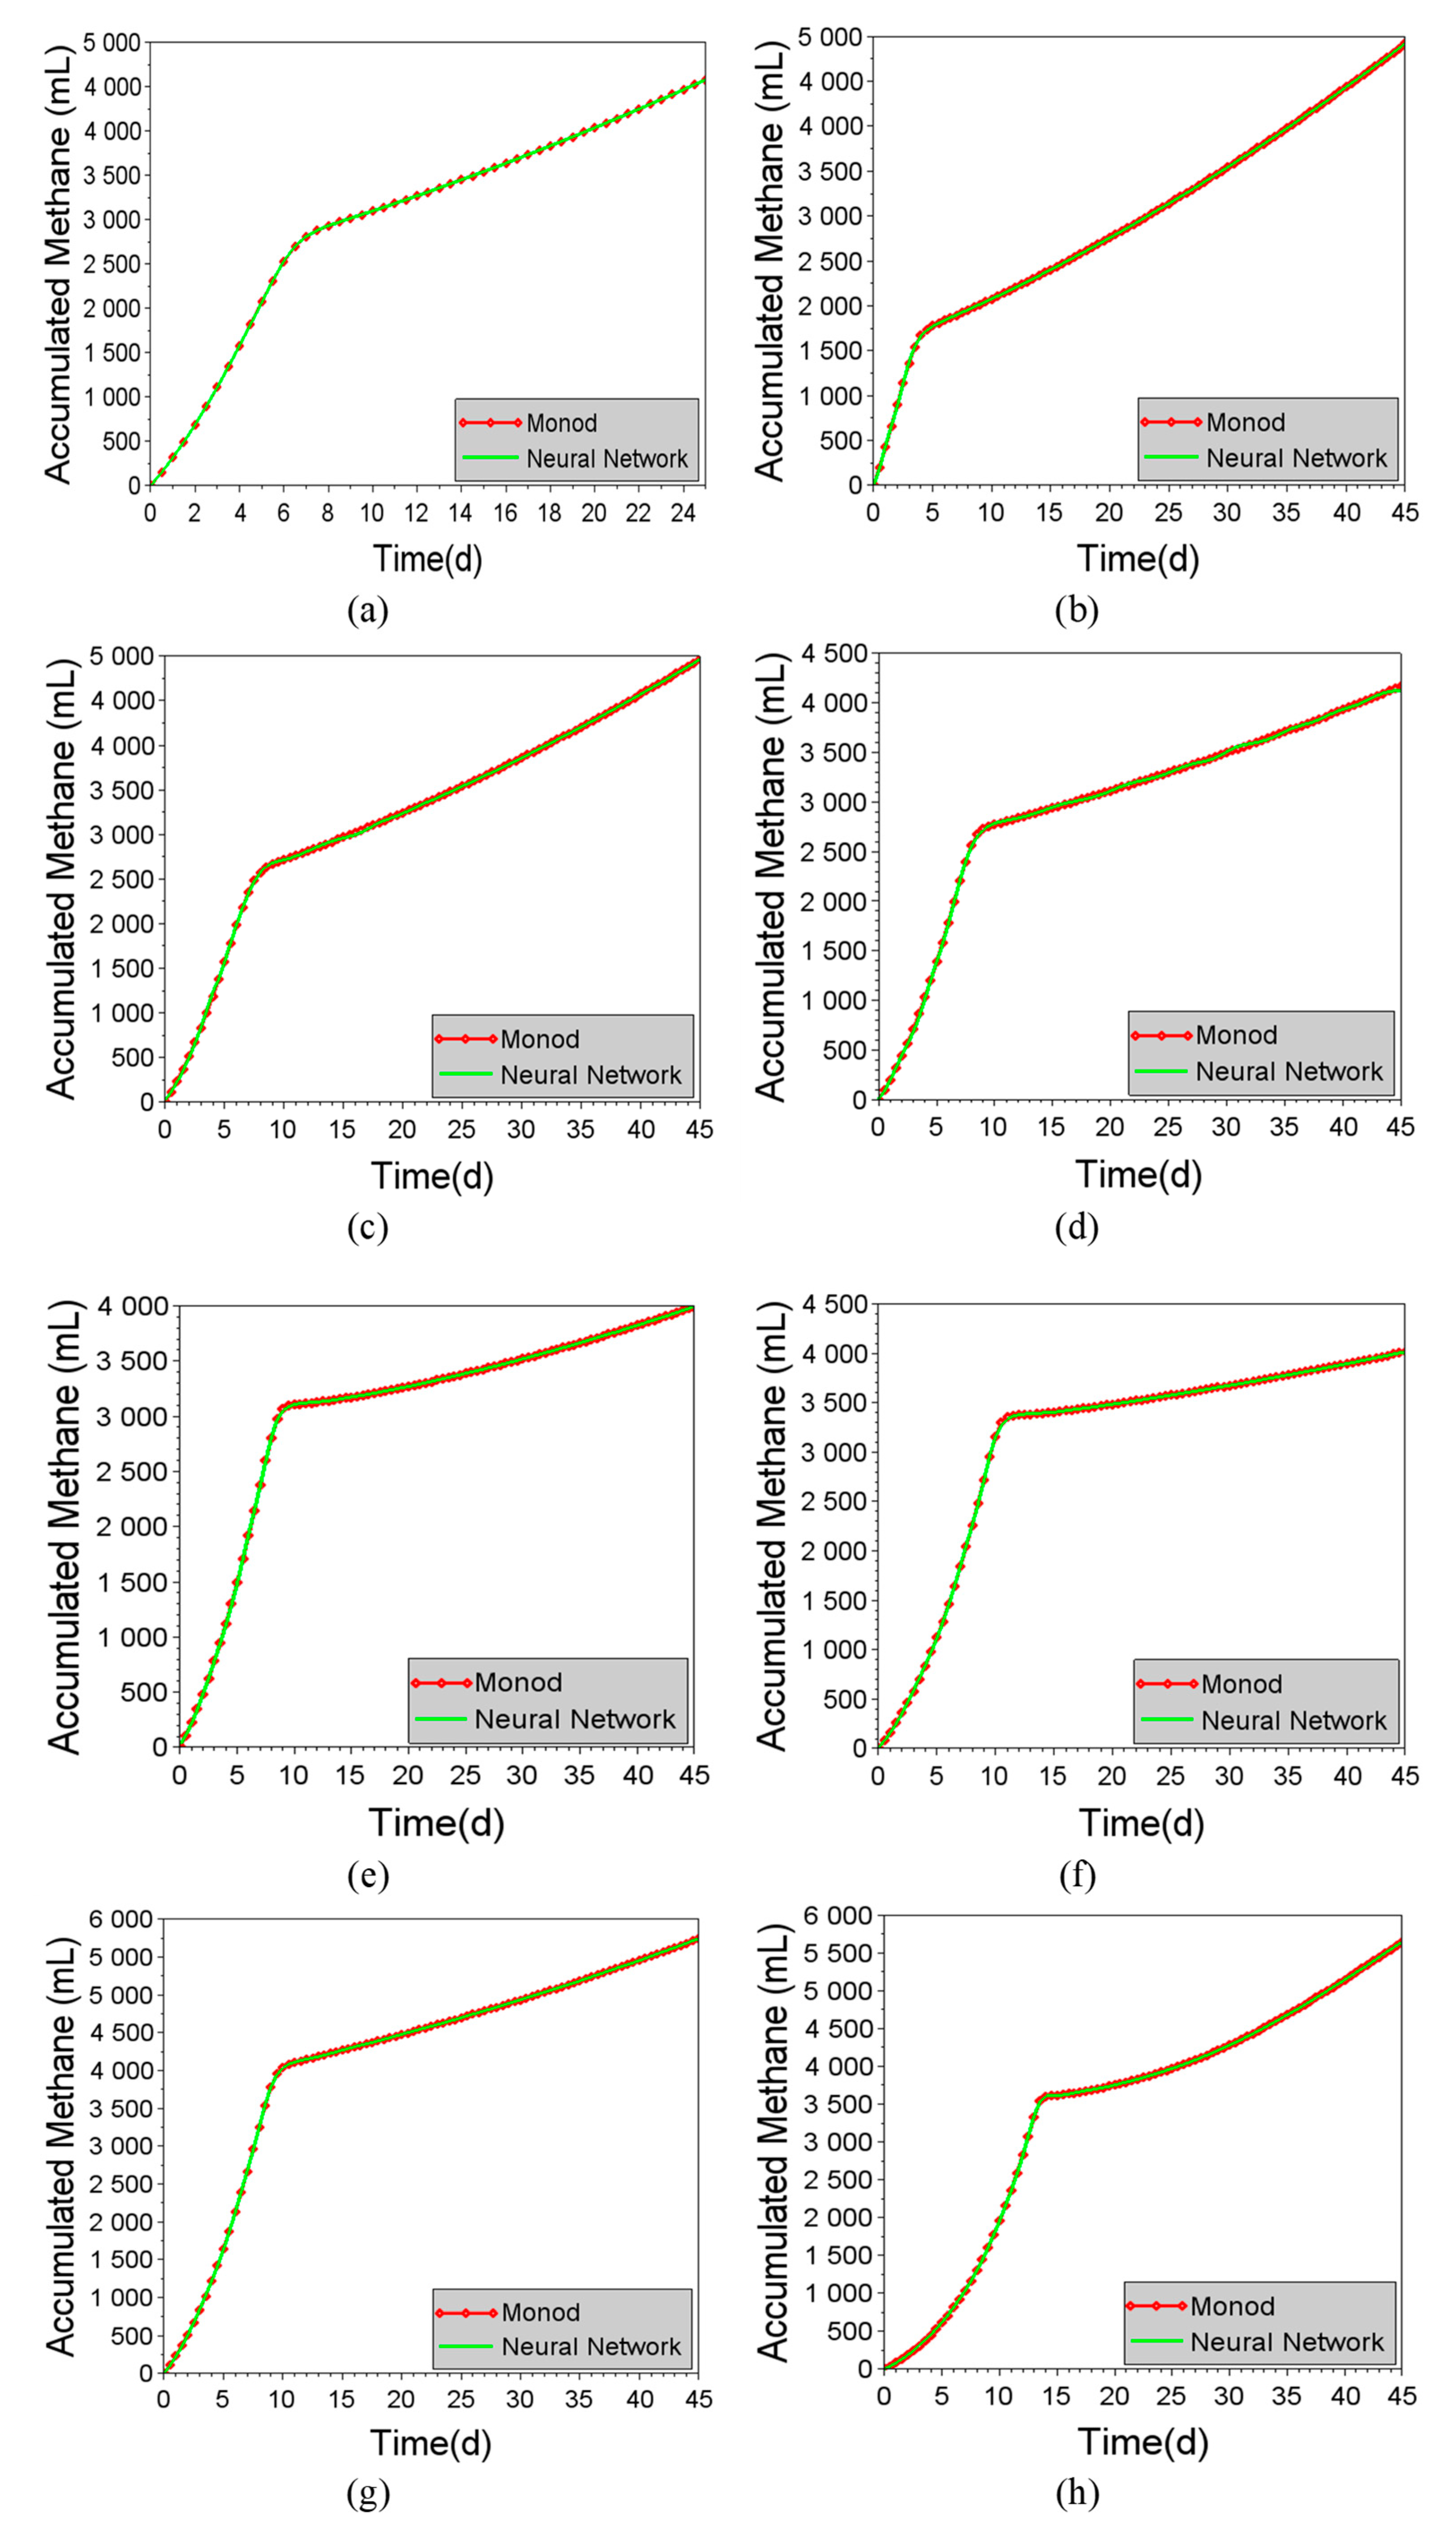
3.4. Prediction of Methane Production Using Specific Neural Networks

Figure 10 shows a comparison of the predicted methane production considering the M2SI model and specific artificial neural networks. The results demonstrated the excellent predictive capacity of these artificial neural networks, which could therefore be used as an alternative strategy. In comparison with generic networks, the latter allow the use of interpolations of different values for the substrate composition, as well as the testing of hypothetical scenarios for methane production, which can generate an optimized combination using a single network. However, it is possible to create a set of specific neural networks, where their combination in a committee would also allow interpolations of different values for the substrate composition. In a similar way, Horta et al. [34] proposed a committee of neural networks for identifying Streptococcus pneumoniae growth phases, used for on-line state inference.

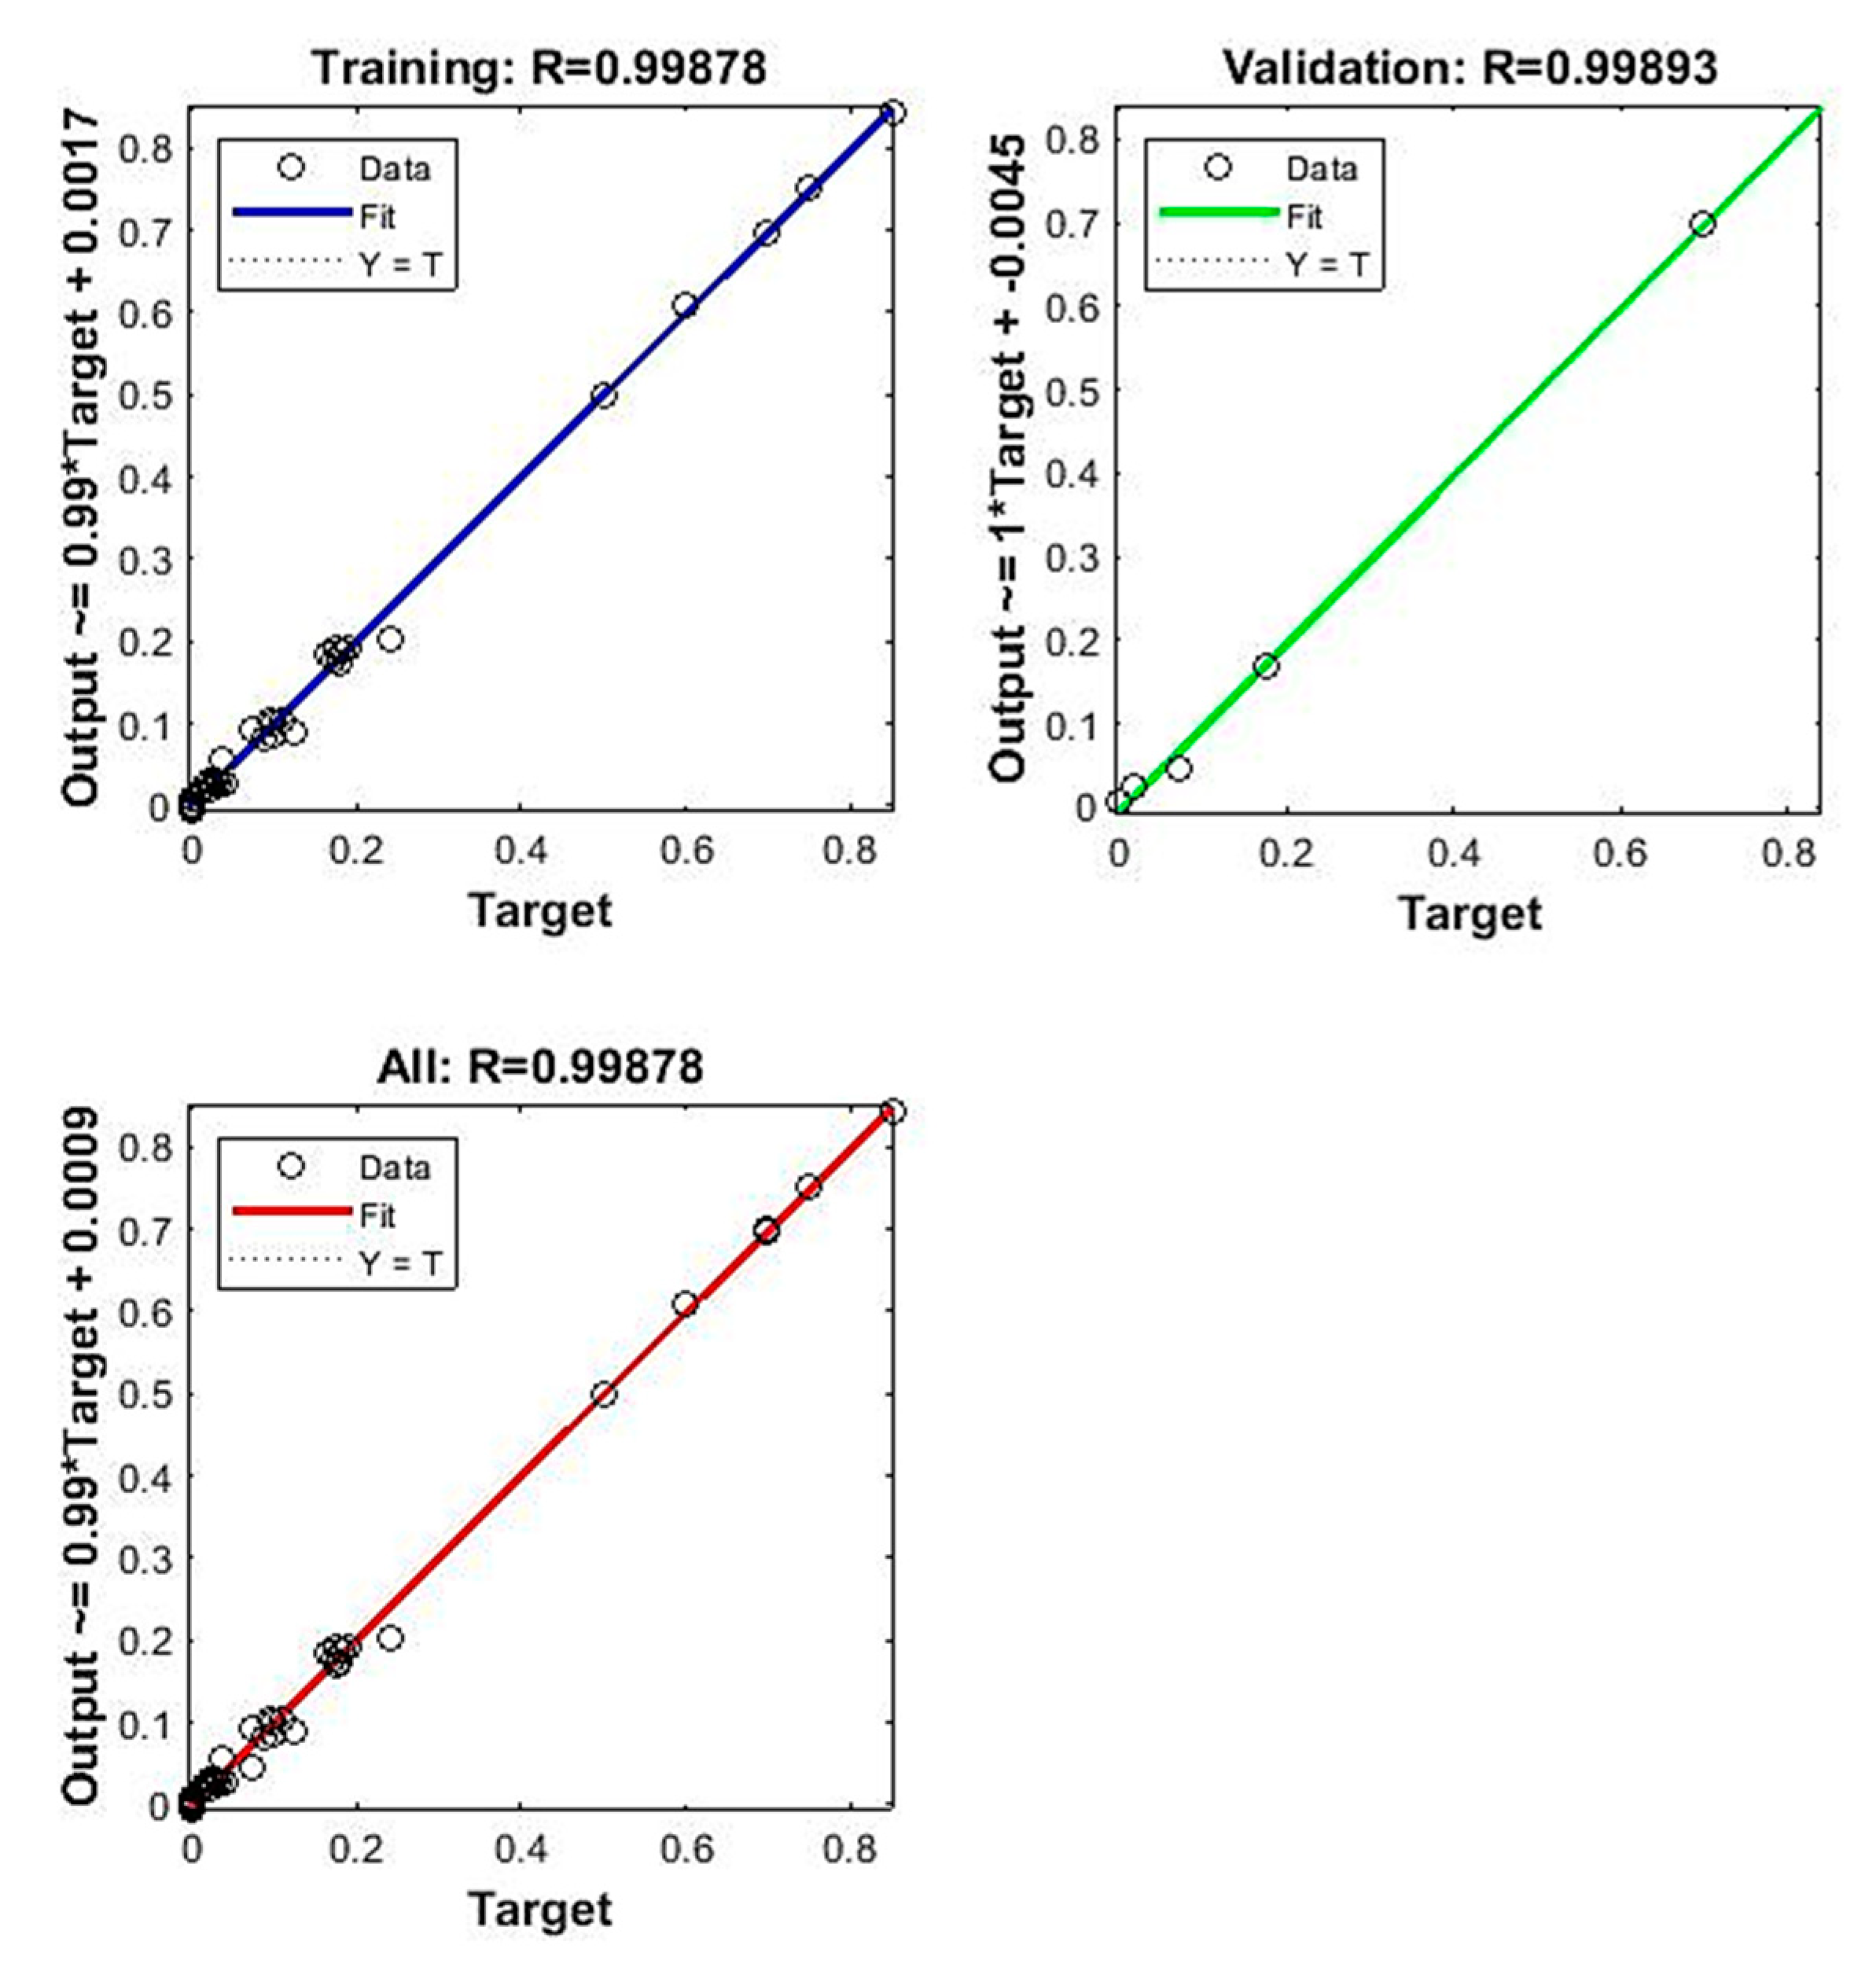
3.5. Neural Network Training to Predict Monod Kinetic Parameters

A neural network was trained to provide the kinetic parameters of the M2SI model, with the best fit obtained using 25 neurons (Figure 11). In order to achieve satisfactory prediction of the data, the testing step was eliminated, with 90% of the data being used in the training step and 10% in the validation step. This enabled consistent results to be obtained in the simulations, with fits presenting R2 values higher than 0.99. Therefore, the neural network could be used in a hybrid M2SI–neural network approach. This enabled simulation of alternative compositions, obtaining the kinetic parameters for application in the M2SI model considered for the prediction of methane production.

3.5.1. Assessment of the Predictive Capability of a Hybrid M2SI–Neural Network Approach

By applying the neural network to predict Monod’s parameters at a 97% DW—3% CG condition, it was possible to evaluate the predictive capability of the hybrid model. Experimental data from Phayungphan et al. [31] were considered for comparison purposes. The predicted methane production reached 4766.39 mL of accumulated CH4 (as shown in Figure 12) compared to the experimental value of 4464.64 mL of CH4, which represents a minor divergence of 6.7%.
In the training phase, no data on this composition were presented to the neural network. Despite that, the hybrid M2SI–neural network predicted a downward trend in accumulated methane with a substrate containing 97% DW and 3% CG, which is in agreement with the experimental behavior.

3.6. Application of Fuzzy Logic

The simulations were performed with alteration of the granularity of the fuzzy system. As a standard procedure, Matlab R2018a recommends dividing the variables into three ranges of linguistic values. However, since the time variable had a greater range (0 to 45 days), it was initially divided into five linguistic values, while the other variables (concentrations of distillery wastewater, molasses, and glycerol) were divided into three values. Using this granularity, the model generated 135 “IF”…“THEN” rules and provided a root mean square error of 43.10 mL. When the granularity was changed to six linguistic values for the time variable, while keeping the other variables at three linguistic values, 162 rules were obtained, with a root mean square error of 36.33 mL. Finally, when eight linguistic values were defined for time, while keeping the other variables at three values, a root mean square error of 18.88 mL was obtained, with 216 rules. Considering that the order of magnitude of the accumulated methane was around 5 × 10³, the error was very small (less than 0.5%). This could be considered a very satisfactory result. Increasing granularity progressively improved the capacity of the model, although granularity higher than eight for the time variable resulted in improvements that were less significant. Therefore, higher values were considered unnecessary. Moreover, it is possible to point out here that concerns (in analyzing and validating models) are not only based on R2 value. Furthermore, granularity higher than eight for the time variable would lead to greater difficulty in labeling its linguistic values, or even the loss of practical meaning for the labels applied.
Table 3 lists the parameters of the membership functions fitted using the ANFIS model.
The effectiveness of the neuro–fuzzy training was evidenced by the good agreement between the responses of the fuzzy model and the data from the M2SI model, as shown in Figure 13.
Turkdogan-Aydinol and Yetilmezsoy [35] investigated the production of methane from anaerobic digestion of molasses wastewater under mesophilic conditions, applying the Mamdani fuzzy logic approach. This resulted in generation of 134 “IF”…“THEN” rules, with five input variables (organic load, COD removal, alkalinity, and influent and effluent pH) divided into eight linguistic values. A trapezoidal-type curve was selected for generation of the membership functions. Their fuzzy model provided satisfactory results, with R2 of 0.96, and also demonstrated the effectiveness of using a simple method, without complex mathematical equations, for accurate prediction of methane production.

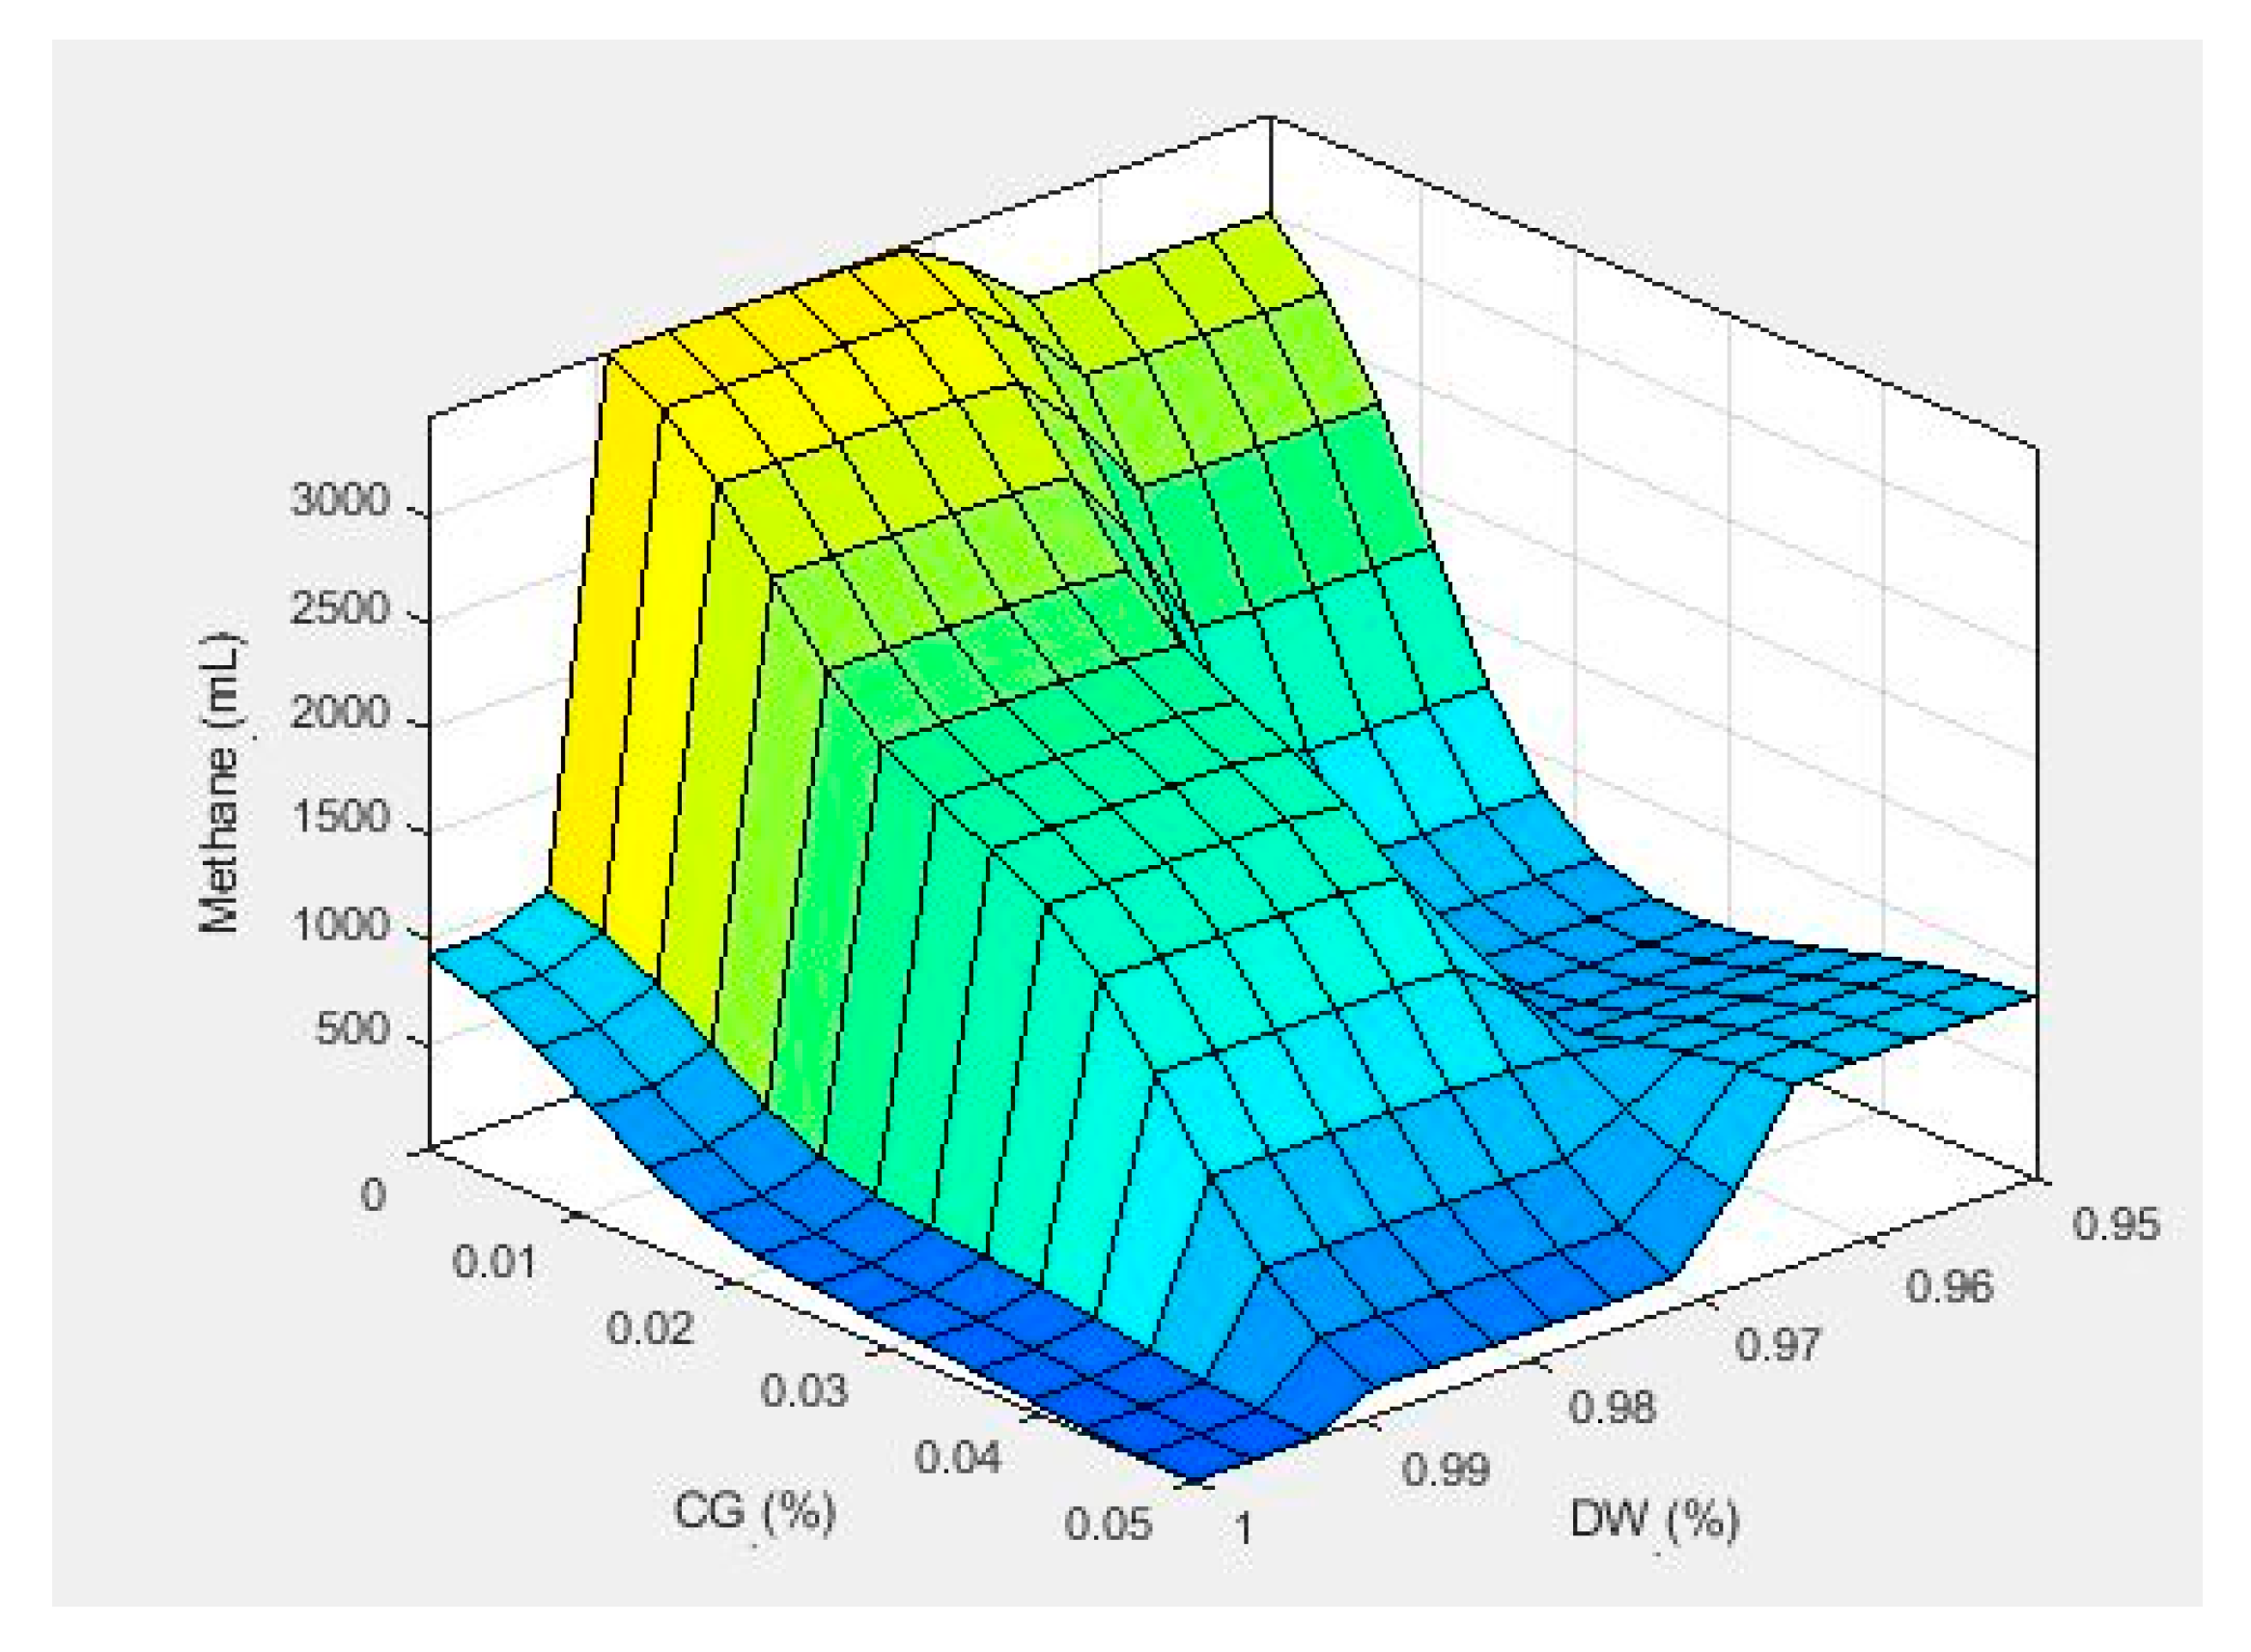
3.6.1. Analysis of the Response Surface Generated by the Fuzzy Model

From the fuzzy modeling, it was possible to build a response surface and evaluate the global effect of the composition of distillery wastewater, glycerol, and molasses on methane production. The time was set at 25 days, as this was the maximum time for which information was available for the specific case of 100% distillery wastewater composition. Sugarcane molasses was fixed at 2.5%. Glycerol ranged from 0 to 5% and distillery wastewater from 95 to 100%.
In the scenario presented in Figure 14, the region with an amount of distillery wastewater greater than 97.5% is a non-feasible region (even with 0% glycerol), since the composition of the substrates would exceed 100%. The same reasoning applies to the case of a glycerol amount greater than 2.5% (even with 95% still water).
Still, in Figure 14, it is possible to note the accuracy of the results, since for 0% glycerol, the volume of accumulated methane is around 3000 mL, which is consistent with the predictions for the compositions containing 2 and 3% molasses (and 98 and 97% distillery wastewater, respectively). In addition, the volume of accumulated methane followed the expected behavior for glycerol, with a downward trend in methane production for glycerol composition increasing from zero to about 2.5% (95% distillery wastewater), as discussed in an analogous way in the application of hybrid M2SI–neural modeling. In fact, this was an important objective here: to apply simple methodologies that can assist in solving problems that are complicated to model, predicting outcomes such as methane production as a function of mixing ratios of substrates in a more simplified way. Of course, it is assumed that the individual substrates maintain, on average, their own basic characteristics.

4. Conclusions

From the results of the modeling and simulation using artificial neural networks, a good fit was obtained in the network training step (R2 > 0.99). A minimum of 14 neurons were required in the hidden layer of the generic neural network for prediction of methane production. Good agreement was obtained between the methane production curves generated by the M2SI model and the generic neural network under various conditions. Additionally, a hybrid model provided satisfactory prediction of the kinetic parameters for the M2SI model. The number of neurons in the hidden layer of the neural network for prediction of the kinetic parameters of the M2SI model was 25.
The training of the fuzzy model with 216 rules had a mean square error of 18.88 mL of methane, which was less than 0.5% of the order of magnitude of the accumulated methane. Good agreement was obtained between the M2SI model methane production points and those of the fuzzy model simulation.
It is not considered a weakness that training and validation of neural and fuzzy models have been accomplished by comparison with the trend of the accumulated biomethane given by a good and well-accepted Monod equation. Ideally, experimental data would be considered to train and validate neural and fuzzy models, but this work is able to present some relevant insights into the possibility of applying artificial intelligence models to map relationships among co-digestion process variables, which was the main objective here.
From a wider perspective, the neural and fuzzy models presented here can be expanded to also account for the compositing of the resulting digestate. Anaerobic digestion is not only a technology to produce bioenergy but also to handle and convert waste and/or subproducts, which is the case regarding glycerol and molasses. If composition of the resulting digestate is monitored experimentally, aside from the formation of gas, it could also be included as an output for neural and fuzzy mapping (in particular, the presence of glycerol has shown the potential to generate propionic acid and 1,3 propanediol, among other compounds [36]).
Even after phenomenological models (and some of them much more complex than M2SI) have been created to clarify the digestion process, their drawbacks have compelled many researchers to develop simplified alternatives. In this way, artificial intelligence approaches can be used to solve engineering problems, such as modeling, prediction, and optimization of co-digestion based on artificial neural networks and fuzzy modeling (as presented in this work, which, of course, can be extended to the study of co-digestion from other substrates).

Author Contributions

Conceptualization, C.M.F. and R.d.S.J.; formal analysis, C.M.F. and R.d.S.J.; funding acquisition, R.d.S.J.; investigation, C.M.F.; methodology, C.M.F., R.A.A. and R.d.S.J.; project administration, R.d.S.J.; resources, R.d.S.J.; software, C.M.F., R.A.A. and R.d.S.J.; validation, C.M.F. and R.d.S.J.; visualization, C.M.F. and R.A.A.; writing—original draft, C.M.F. and R.d.S.J.; writing—review and editing, R.d.S.J. All authors have read and agreed to the published version of the manuscript.

Funding

This study was financed in part by the Coordenação de Aperfeiçoamento de Pessoal de Nível Superior—Brasil (CAPES)—Finance Code 001, and Conselho Nacional de Desenvolvimento Científico e Tecnológico—CNPq.

Data Availability Statement

Not applicable.

Conflicts of Interest

The authors declare no conflict of interest.

Abbreviations

The following abbreviations are used in this manuscript.
DW Distillery wastewater
ANFIS Adaptive-Network-Based Fuzzy Inference System
ANP Agência Nacional de Petróleo, Gás Natural e Biocombustíveis
CH4 Methane
CH3COOH Acetate
CO2 Carbon dioxide
COD Chemical oxygen demand
FIS Fuzzy inference system
MF Membership function
ML Molasses
CG Crude glycerol
MD Membership degree
H2 Hydrogen gas
H2O Water
M2SI Monod two-substrate with an intermediate model
MLP Multilayer perceptron
pH Hydrogen ion potential
RMSE Root mean squared error
R2 Coefficient of determination
SCG Scaled conjugate gradient
UASB Upflow anaerobic sludge blanket

Appendix A

Figure A1. Block diagram with a qualitative description of the steps taken.
Processes 11 02121 g0a1

References

  1. UN—United Nations. United Nations Conference in the Human Environment, 5–16 June 1972, Stockholm. Available online: https://www.un.org/en/conferences/environment/stockholm1972 (accessed on 13 April 2022).
  2. ANP—Agência Nacional de Petróleo, Gás Natural e Biocombustíveis. Biodiesel. Available online: https://www.gov.br/anp/pt-br/assuntos/producao-e-fornecimento-de-biocombustiveis/biodiesel (accessed on 14 April 2022).
  3. ANP—Agência Nacional de Petróleo, Gás Natural e Biocombustíveis. Painel Dinâmico de Produtores de Biodiesel. Available online: https://www.gov.br/anp/pt-br/centrais-de-conteudo/paineis-dinamicos-da-anp/paineis-e-mapa-dinamicos-de-produtores-de-combustiveis-e-derivados/painel-dinamico-de-produtores-de-biodiesel (accessed on 14 April 2022).
  4. Leung, D.Y.C.; Wu, X.; Leung, M.K.H. A review on biodiesel production using catalyzed transesterification. Appl. Energy 2010, 87, 1083–1095. [Google Scholar] [CrossRef]
  5. ANP—Agência Nacional de Petróleo, Gás Natural e Biocombustíveis. RenovaBio. Available online: https://www.gov.br/anp/pt-br/assuntos/renovabio (accessed on 14 April 2022).
  6. Quispe, C.A.G.; Coronado, C.J.R.; Carvalho, J.A. Glycerol: Production, consumption, prices, characterization and new trends in combustion. Renew. Sustain. Energy Rev. 2013, 27, 475–493. [Google Scholar] [CrossRef]
  7. Chernicharo, C.A.L. Anaerobic Reactors; Volume 4—Biological Wastewater Treatment; IWA Publishing: London, UK, 2007. [Google Scholar]
  8. Gabra, F.A.; Abd-Alla, M.H.; Danial, A.W.; Abdel-Basset, R.; Abdel-Wahab, A.M. Production of biofuel from sugarcane molasses by diazotrophic Bacillus and recycle of spent bacterial biomass as biofertilizer inoculants for oil crops. Biocatal. Agric. Biotechnol. 2019, 19, 101112. [Google Scholar] [CrossRef]
  9. UN—United Nations. FAO: América Latina e Caribe Vão Responder Por Mais de 25% das Exportações Agrícolas Globais Até 2028. Available online: https://brasil.un.org/pt-br/83643-fao-america-latina-e-caribe-vao-responder-por-mais-de-25-das-exportacoes-agricolas-globais (accessed on 13 April 2022).
  10. Costa, T.B. Produção de Hidrogênio e Metano a Partir de Glicerol Bruto e Cultura Mista em Reatores Anaeróbios de Leito Fluidizado Termofílicos. Master’s Thesis, Federal University of São Carlos, São Carlos, Brazil, 2017. [Google Scholar]
  11. Paranhos, A.G.O.; Silva, E.L. Optimized 1,3-propanediol production from crude glycerol using mixed cultures in batch and continuous reactors. Bioprocess Biosyst. Eng. 2018, 41, 1807–1816. [Google Scholar] [CrossRef] [PubMed]
  12. Freitas, I.B.F. Produção de Hidrogênio e Metabólitos Com Valor Biotecnológico a Partir de Melaço da Cana-de-Açucar Utilizando Reatores de Leito Granular Expandido Mesofílicos. Master’s Thesis, University of São Paulo—São Carlos School of Engineering, São Carlos, Brazil, 2018. [Google Scholar]
  13. Pereyra, D.A.D.; Rueger, I.B.; Barbosa, P.A.M.A.; Peiter, F.S.; Freitas, D.M.S.; Amorim, E.L.C. Co-fermentation of glycerol and molasses for obtaining biofuels and value-added products. Braz. J. Chem. Eng. 2020, 37, 653–660. [Google Scholar] [CrossRef]
  14. Rakmak, N.; Noynoo, L.; Jijai, S.; Siripatana, C. Monod-Type Two-Substrate Models for Batch Anaerobic Co-Digestion. In Lecture Notes in Applied Mathematics and Applied Science in Engineering; Malaysia Technical Scientist Association: Melaka, Malaysia, 2019; pp. 11–20. [Google Scholar]
  15. Nelles, O. Nonlinear System Identification: From Classical Approaches to Neural Networks and Fuzzy Models; Springer: New York, NY, USA, 2001; p. 785. [Google Scholar]
  16. Viana, M.B.; Freitas, A.V.; Leitão, R.C.; Pinto, G.A.S.; Santaella, S.T. Anaerobic digestion of crude glycerol: A review. Environ. Technol. Rev. 2012, 1, 81–92. [Google Scholar] [CrossRef]
  17. Ayoub, M.; Abdullah, A.Z. Critical review on the current scenario and significance of crude glycerol resulting from biodiesel industry towards more sustainable renewable energy industry. Renew. Sustain. Energy Rev. 2012, 16, 2671–2686. [Google Scholar] [CrossRef]
  18. Santibáñez, C.; Vernero, M.T.; Bustamante, M. Residual glycerol from biodiesel manufacturing, waste or potential source of bioenergy: A review. Chil. J. Agric. Res. 2011, 71, 469–475. [Google Scholar] [CrossRef]
  19. Rezania, S.; Oryani, B.; Park, J.; Hashemi, B.; Yadav, K.K.; Kwon, E.E.; Hur, J.; Cho, J. Review on transesterification of non-edible sources for biodiesel production with a focus on economic aspects, fuel properties and by-product applications. Energy Convers. Manag. 2019, 201, 112–155. [Google Scholar] [CrossRef]
  20. Abiquim—Associação Brasileira da Indústria Química. Report of Dynamic System of Statistical Information; Abiquim: São Paulo, Brazil, 2008; p. 36. [Google Scholar]
  21. Oliveira, C.A.; Fuess, L.T.; Soares, L.A.; Damianovic, M.H.R.Z. Thermophilic biomethanation of sugarcane molasses comparing single and two-stage systems: Process performance and energetic potential. Bioresour. Technol. Rep. 2020, 12, 100590. [Google Scholar] [CrossRef]
  22. Aguilar, F.A.A.; Nelson, D.L.; Pantoja, L.D.A.; dos Santos, A.S. Study of anaerobic co-digestion of crude glycerol and swine manure for the production of biogas. Rev. Virtual De Quim. 2017, 9, 2384–2403. [Google Scholar] [CrossRef]
  23. de Menezes, C.A.; de Oliveira Paranhos, A.G.; Simões, A.N.; da Costa, T.B.; Silva, E.L. Biohydrogen Production in Fluidized Bed Reactors: An Environmental Approach. In Fluidized Bed Reactors: Principles and Applications, 1st ed.; Nova Science Publishers: New York, NY, USA, 2020; pp. 1–39. [Google Scholar]
  24. Jaroenpoj, S.; Yu, Q.J.; Ness, J. Development of Artificial Neural Network Models for Biogas Production from Co-Digestion of Leachate and Pineapple Peel. Glob. Environ. Eng. 2014, 1, 42–47. [Google Scholar] [CrossRef] [Green Version]
  25. Ghatak, M.; Ghatak, A. Artificial neural network model to predict behavior of biogas production curve from mixed lignocellulosic co-substrates. Fuel 2018, 232, 178–189. [Google Scholar] [CrossRef]
  26. Özarslan, S.; Abut, S.; Atelge, M.R.; Kaya, M.; Unalan, S. Modeling and simulation of co-digestion performance with artificial neural network for prediction of methane production from tea factory waste with co-substrate of spent tea waste. Fuel 2021, 306, 121715. [Google Scholar] [CrossRef]
  27. Gonçalves Neto, J.; Ozorio, L.V.; Abreu, T.C.C.; Santos, B.F.; Pradelle, F. Modeling of biogas production from food, fruits and vegetables wastes using artificial neural network (ANN). Fuel 2021, 285, 119081. [Google Scholar] [CrossRef]
  28. Khayum, N.; Rout, A.; Deepak, B.B.V.L.; Anbarasu, S.; Murugan, S. Application of Fuzzy Regression Analysis in Predicting the Performance of the Anaerobic Reactor Co-digesting Spent Tea Waste with Cow Manure. Waste Biomass Valorization 2019, 11, 5665–5678. [Google Scholar] [CrossRef]
  29. Heydari, B.; Sharghi, E.A.; Rafiee, S.; Mohtasebi, S.S. Use of artificial neural network and adaptive neuro-fuzzy inference system for prediction of biogas production from spearmint essential oil wastewater treatment in up-flow anaerobic sludge blanket reactor. Fuel 2021, 306, 121734. [Google Scholar] [CrossRef]
  30. MathWorks. Fuzzy Logic ToolboxTM User’s Guide R2018a; MathWorks: Natick, MA, USA, 2018. [Google Scholar]
  31. Phayungphan, K.; Rakmak, N.; Promraksa, A. Application of monod two-substrate kinetics with an intermediate for anaerobic co-digestion of distillery wastewater and molasses/glycerol waste in batch experiments. Water Pract. Technol. 2020, 15, 1068–1082. [Google Scholar] [CrossRef]
  32. Beale, M.H.; Hagan, M.T.; Demuth, H.B. Neural Network Toolbox: User’s Guide, 7th ed.; MathWorks: Natick, MA, USA, 2010. [Google Scholar]
  33. Yetilmezsoy, K.; Turkdogan, F.I.; Temizel, I.; Gunay, A. Development of Ann-Based Models to Predict Biogas and Methane Productions in Anaerobic Treatment of Molasses Wastewater. Int. J. Green Energy 2013, 10, 885–907. [Google Scholar] [CrossRef]
  34. Horta, A.C.L.; Zangirolami, T.C.; Nicoletti, M.C.; Montera, L.; Carmo, T.S.; Gonçalves, V.M. An Empirical Investigation of the Use of a Neural Network Committee for Identifying the Streptococcus pneumoniae Growth Phases in Batch Cultivations. Lect. Notes Comput. Sci. 2008, 5027, 215–224. [Google Scholar]
  35. Turkdogan-Aydinol, F.I.; Yetilmezsoy, K. A fuzzy-logic-based model to predict biogas and methane production rates in a pilot-scale mesophilic UASB reactor treating molasses wastewater. J. Hazard. Mater. 2010, 182, 460–471. [Google Scholar] [CrossRef] [PubMed]
  36. Lovato, G.; Ferreira, C.M.; Amui, M.M.; Devens, K.U.; Augusto, I.M.G.; Ribeiro, A.R.; Rodrigues, J.A.D.; Silva, E.L. Recovery of Value-Added Products from Industrial Wastewaters: A Review to Potential Feedstocks. In Handbook of Waste Biorefinery; Jacob-Lopes, E., Queiroz Zepka, L., Costa Deprá, M., Eds.; Springer: Cham, Germany, 2022; Volume 1, pp. 201–283. [Google Scholar] [CrossRef]
Figure 1. Representation of the database for training of the generic neural network: (a) input variables and (b) output variable.
Processes 11 02121 g001
Figure 2. Representation of the database for training of the FIS.
Processes 11 02121 g002
Figure 3. Representation of the fuzzy model structure.
Processes 11 02121 g003
Figure 4. Linear regression fits of the network output values for two neurons.
Processes 11 02121 g004
Figure 5. Linear regression fits of the network output values for 14 neurons.
Processes 11 02121 g005
Figure 6. Linear regression fits of the network output values for 60 neurons.
Processes 11 02121 g006
Figure 7. Differences between the expected and network output values for (a) 2 neurons, (b) 14 neurons, and (c) 60 neurons.
Processes 11 02121 g007
Figure 8. Comparison of cumulative methane production predicted considering the Monod kinetic model and the generic neural network (with 14 neurons) for the different substrates: (a) 100% DW, (b) 99% DW and 1% ML, (c) 98% DW and 2% ML, (d) 97% DW and 3% ML, (e) 96% DW and 4% ML, (f) 95% DW and 5% ML, (g) 99% DW and 1% CG, and (h) 95% DW and 5% CG.
Processes 11 02121 g008
Figure 9. Comparison of cumulative methane production predicted considering the Monod kinetic model and the generic neural network (with 60 neurons) for the different substrates: (a) 100% DW, (b) 99% DW and 1% ML, (c) 98% DW and 2% ML, (d) 97% DW and 3% ML, (e) 96% DW and 4% ML, (f) 95% DW and 5% ML, (g) 99% DW and 1% CG, and (h) 95% DW and 5% CG.
Processes 11 02121 g009aProcesses 11 02121 g009b
Figure 10. Comparison of cumulative methane production predicted considering the Monod kinetic model and specific neural networks for the different substrates: (a) 100% DW, (b) 99% DW and 1% ML, (c) 98% DW and 2% ML, (d) 97% DW and 3% ML, (e) 96% DW and 4% ML, (f) 95% DW and 5% ML, (g) 99% DW and 1% CG, and (h) 95% DW and 5% CG.
Processes 11 02121 g010
Figure 11. Linear regression fits of the output values obtained using the neural network with 25 neurons.
Processes 11 02121 g011
Figure 12. Prediction of a hybrid M2SI–neural approach at a 97% DW−3% CG condition.
Processes 11 02121 g012
Figure 13. Comparison of the responses of the fuzzy model and the M2SI model for the different substrates: (a) 100% DW, (b) 99% DW and 1% ML, (c) 98% DW and 2% ML, (d) 97% DW and 3% ML, (e) 96% DW and 4% ML, (f) 95% DW and 5% ML, (g) 99% DW and 1% CG, and (h) 95% DW and 5% CG.
Processes 11 02121 g013aProcesses 11 02121 g013b
Figure 14. Response surface with 2.5% ML and time set at 25 days (percentage values of CG and DW were normalized to a range between 0 and 1).
Processes 11 02121 g014
Table 1. Percentage composition (by volume) of the substrate.
AssayDistillery Wastewater (%)Molasses (%)Glycerol (%)
110000
29910
39820
49730
59640
69550
79901
89802
99703
109604
119505
Table 2. Accumulated methane for each composition of the substrate.
Assay 1Composition (%)Accumulated Methane (mL)
1100 DW4580.44
299 DW + 1 ML4918.50
398 DW + 2 ML4963.33
497 DW + 3 ML4168.67
596 DW + 4 ML3992.97
695 DW + 5 ML4014.97
799 DW + 1 CG5744.64
895 DW + 5 CG5647.33
1 total digestion time of 45 days, except for Assay 1, whose digestion time was 25 days.
Table 3. Parameters of the membership functions fitted using the ANFIS model.
Linguistic VariableLinguistic ValueStandard Deviation (σ) Input   Mean   ( x ¯ )
TimeInitial2.7310.00077
Very short2.7306.428
Short2.73012.860
Low medium2.73119.280
Medium2.73025.710
High medium2.73032.140
Long2.73038.570
Very long2.73045.000
DWLow0.00730.9483
Medium0.00340.9768
High0.00291.0040
MLLow0.0091−0.0016
Medium0.01450.0250
High0.01630.0480
CGLow0.0094−0.0013
Medium0.01160.0238
High0.01060.0500
Disclaimer/Publisher’s Note: The statements, opinions and data contained in all publications are solely those of the individual author(s) and contributor(s) and not of MDPI and/or the editor(s). MDPI and/or the editor(s) disclaim responsibility for any injury to people or property resulting from any ideas, methods, instructions or products referred to in the content.

