Abstract
Skin lesion detection is crucial in diagnosing and managing dermatological conditions. In this study, we developed and demonstrated the potential applicability of a novel mixed-scale dense convolution, self-attention mechanism, hierarchical feature fusion, and attention-based contextual information technique (MSHA) model for skin lesion detection using digital skin images of chickenpox and shingles lesions. The model adopts a combination of unique architectural designs, such as a mixed-scale dense convolution layer, self-attention mechanism, hierarchical feature fusion, and attention-based contextual information, enabling the MSHA model to capture and extract relevant features more effectively for chickenpox and shingles lesion classification. We also implemented an effective training strategy to enhance a better capacity to learn and represent the relevant features in the skin lesion images. We evaluated the performance of the novel model in comparison to state-of-the-art models, including ResNet50, VGG16, VGG19, InceptionV3, and ViT. The results indicated that the MSHA model outperformed the other models with accuracy and loss of 95.0% and 0.104, respectively. Furthermore, it exhibited superior performance in terms of true-positive and true-negative rates while maintaining low-false positive and false-negative rates. The MSHA model’s success can be attributed to its unique architectural design, effective training strategy, and better capacity to learn and represent the relevant features in skin lesion images. The study underscores the potential of the MSHA model as a valuable tool for the accurate and reliable detection of chickenpox and shingles lesions, which can aid in timely diagnosis and appropriate treatment planning for dermatological conditions.
1. Introduction
Deep learning has experienced remarkable growth, progress, and development in skin lesion detection and diagnosis, revolutionizing clinical practices and holding great clinical significance [1,2,3,4]. With its ability to process vast amounts of data, deep learning algorithms have shown immense potential in improving diagnostic accuracy, aiding treatment decisions, and enhancing patient care [5]. Traditional methods often rely on visual inspection, which can be subjective and prone to human error. Deep learning algorithms, on the other hand, can analyze digital images of skin lesions with high precision, overcoming limitations associated with human interpretation and reducing the reliance on subjective visual examination, providing consistent and objective assessments, and enhancing diagnostic accuracy [6]. Deep learning algorithms trained on large datasets can learn to accurately identify these specific lesions, enabling swift and accurate diagnosis. Additionally, they can expedite the diagnosis process, potentially leading to earlier interventions and improved patient outcomes [7]. Furthermore, the integration of deep learning algorithms in skin lesion detection and classification has the potential to extend its reach beyond traditional clinical settings. Telemedicine and remote health care can significantly benefit from deep learning-powered diagnostic tools. By leveraging deep learning algorithms, health-care providers can remotely analyze digital images of skin lesions, enabling accurate diagnoses without requiring in-person consultations. This will not only enhance accessibility to expert care, particularly in underserved areas, but also reduce the burden on health-care systems and resources.
Chickenpox and shingles are two diseases that clinically manifest as characteristic vesicular skin lesions on the skin of humans [8]. They belong to the varicella zoster virus (VZV), a highly contagious virus that belongs to the herpesvirus family. Chickenpox and shingles exhibit distinct optical image characteristics that aid in their identification. Chickenpox lesions typically appear as small, red spots that progress to fluid-filled blisters [8]. The color of these lesions can vary, ranging from pink to red. Chickenpox lesions are generally small, often less than half an inch in diameter. Due to the presence of fluid-filled blisters, these lesions may have a rough or bumpy surface. Additionally, chickenpox lesions are often distributed and appear to scatter across the body, including the face, trunk, and extremities [8]. Shingles, on the other hand, appears as red patches that progress to painful, fluid-filled blisters [9]. The color of shingles lesions is typically red, but they may also have a purplish hue. Unlike chickenpox, shingles lesions have a distinctive pattern and arrangement. They often appear in a localized and linear pattern, following the path of specific nerves known as dermatomes [9]. This linear arrangement is a key optical characteristic of shingles. Additionally, shingles lesions tend to be larger and more raised compared to chickenpox lesions, although this is dependent on the stage of the lesion. They may also develop crusts as they heal.
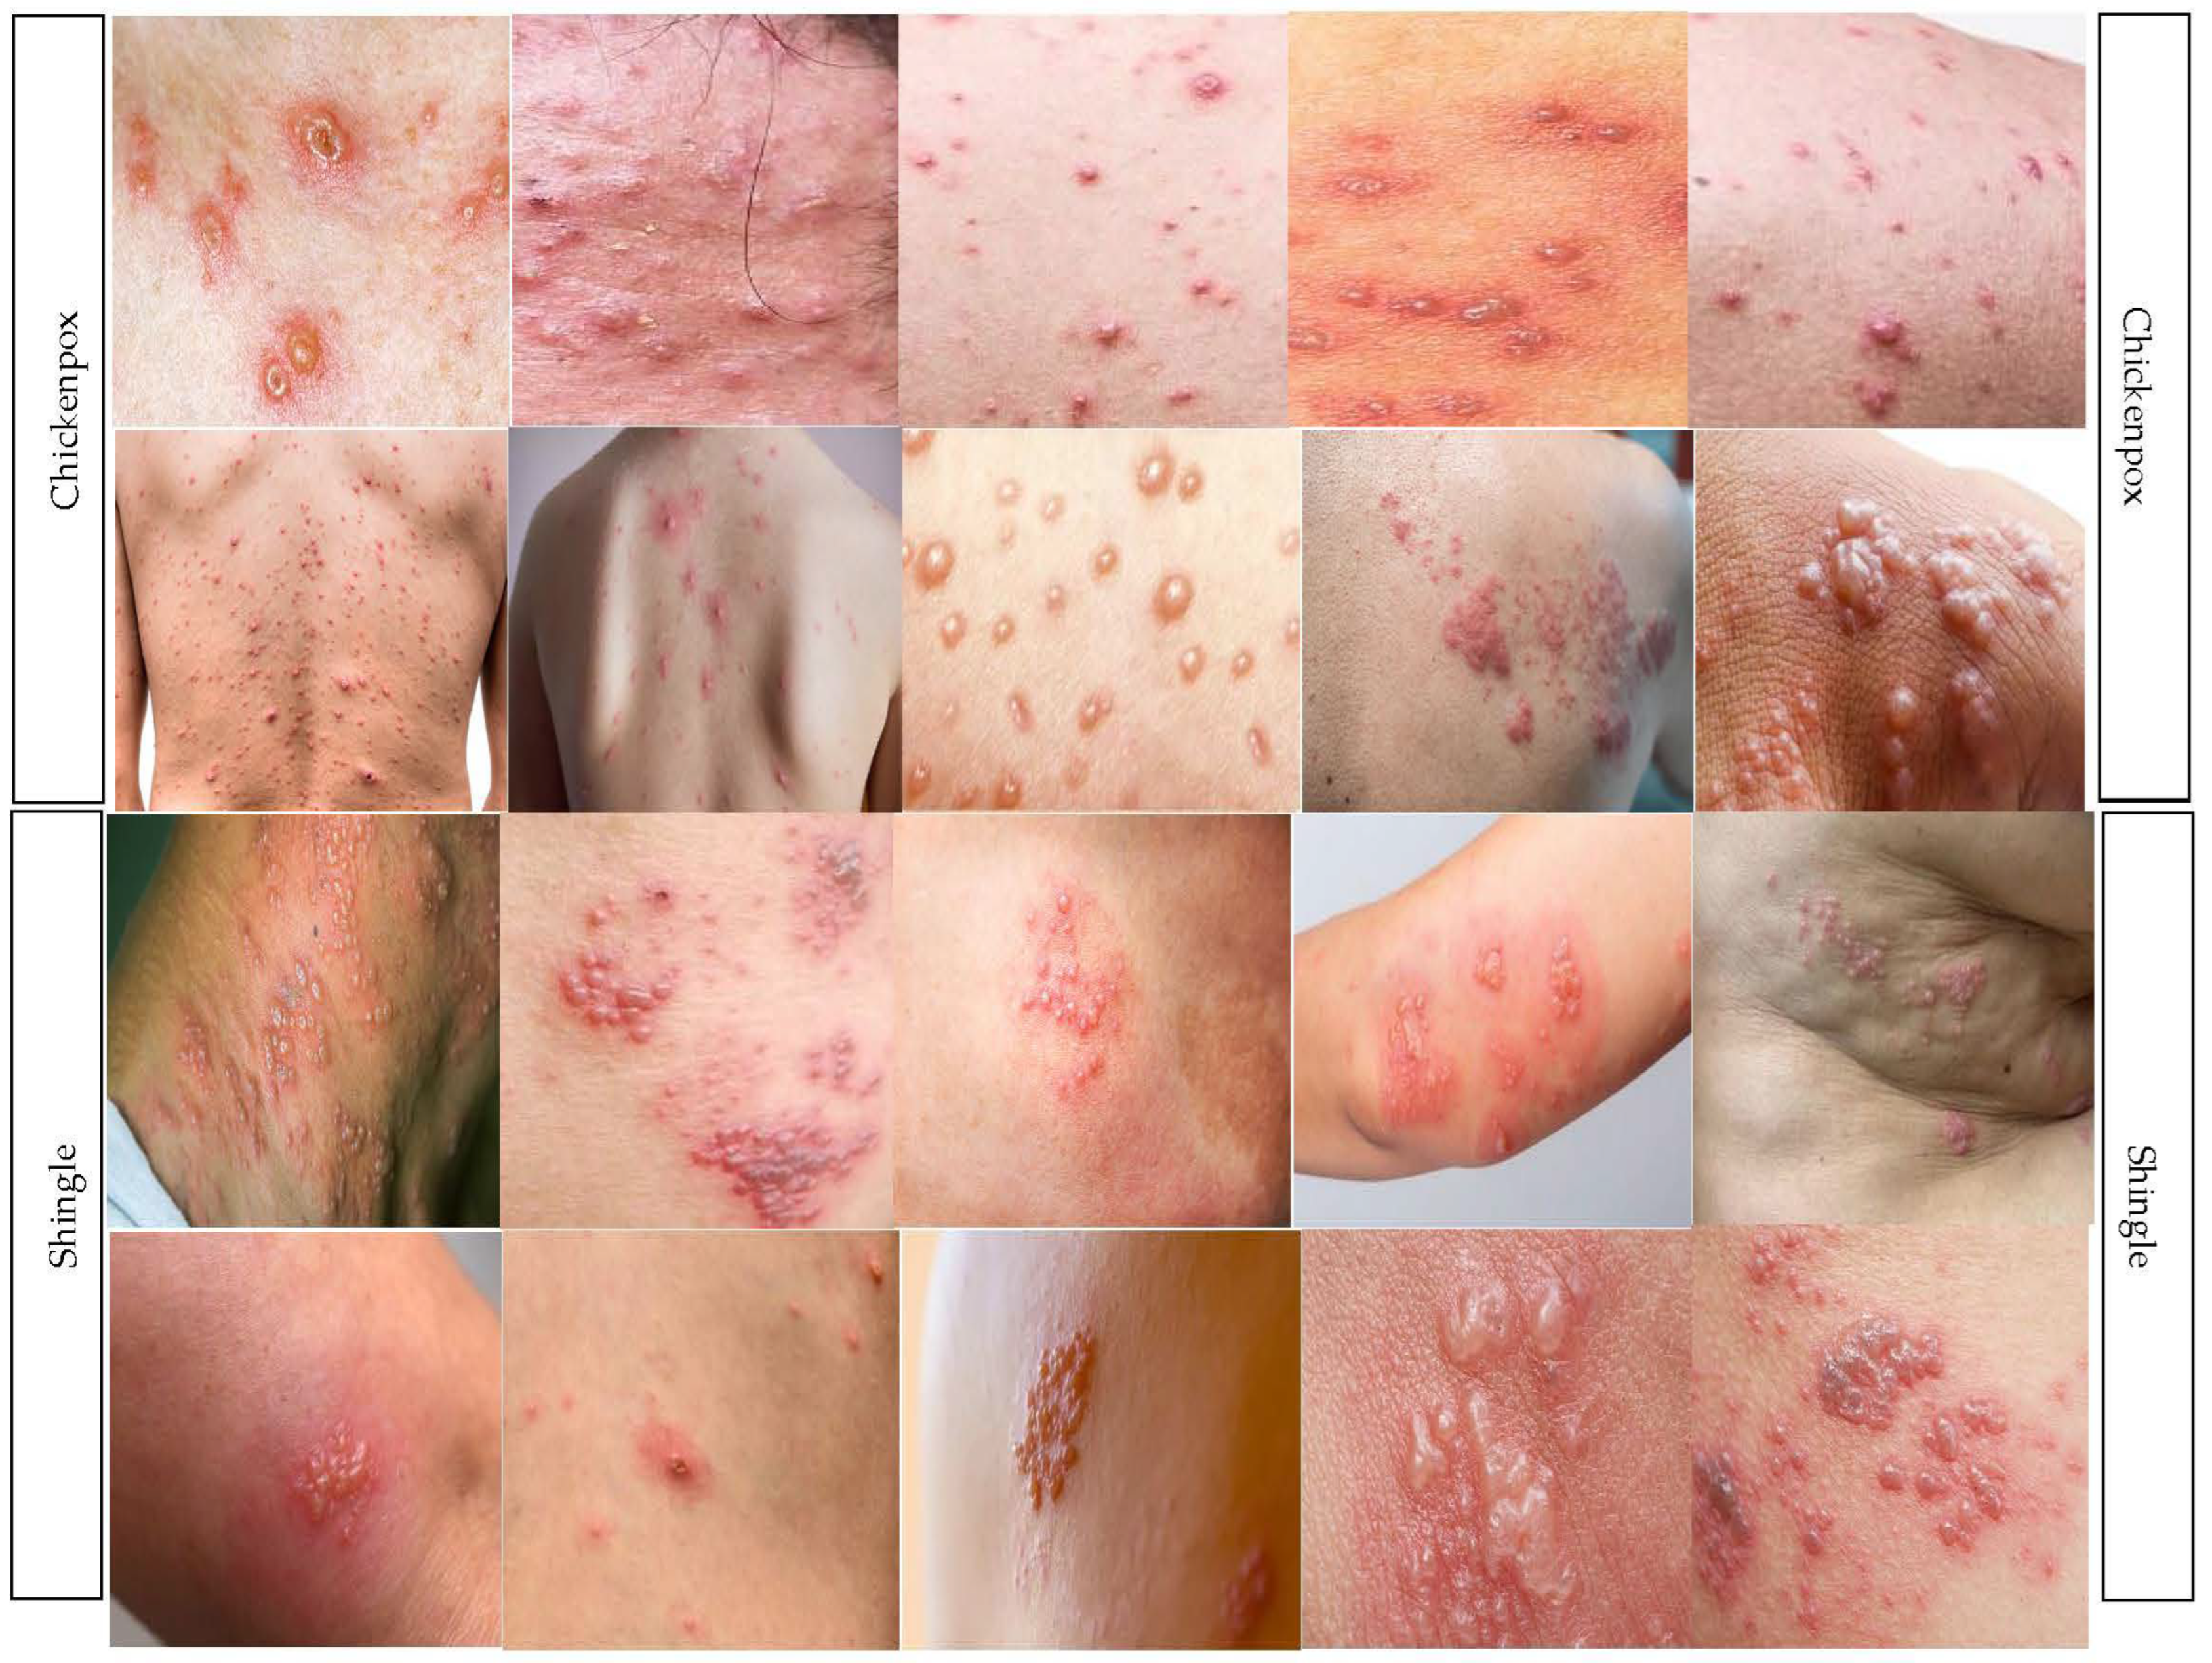
However, there exist obvious similarities that can make prompt diagnosis challenging, as shown in Figure 1, resulting in misdiagnosis and delayed or inappropriate treatment, seriously affecting the patient’s health and well-being. These similarities include their initial appearance as red patches or spots on the skin, the development of fluid-filled blisters, and the characteristic rash they cause [9,10]. Additionally, both diseases can be contagious and involve stages of lesion evolution, including the progression from red patches/spots to blisters and subsequent healing [9,10]. These similarities may prove difficult for prompt diagnosis. Hence, early detection of VZV-related skin lesions is vital to the patient’s survival. While shingles is generally a self-limited disease, it can lead to severe pain, discomfort, and long-term complications such as postherpetic neuralgia [9]. Early treatment with antiviral medication can help reduce symptoms’ severity and prevent these complications [11].
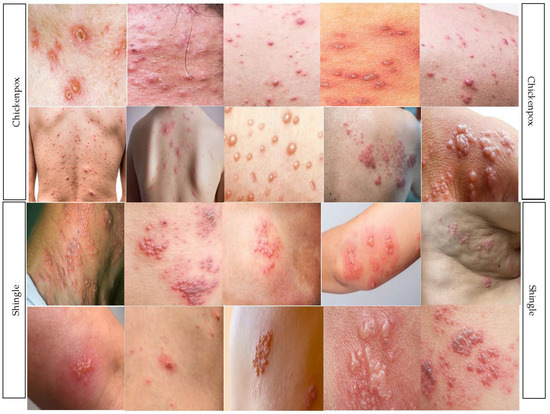
Figure 1.
Digital images of chickenpox [4] and shingles [12].
In this study, we propose implementing a novel multi-modal contextual fusion convolutional neural network (CNN) model named MSHA to detect, classify and diagnose chickenpox and shingles lesions using digital images of skin lesions. We further evaluated the performance of our novel model with sophisticated state-of-the-art transfer learning techniques, including ResNet50, vgg16, vgg19, inceptionV3, and vision transformer (ViT). The outcome of this study will be useful in the improved accuracy and early detection of skin lesions related to the two conditions, particularly for physicians and aid workers in endemic regions. This ultimately will help curb future outbreaks of this disease.
2. Related Studies
Several studies have been conducted on the detection and classification of several skin lesions. While the majority of the studies focus on chickenpox and monkeypox, others are specific to chickenpox and shingles. These studies have contributed to the understanding and advancement of diagnostic techniques for these viral diseases.
Mejía Lara and Arias Velásquez [13] conducted a study to discuss the development of a new framework using convolutional neural networks (CNNs) for early detection of the herpes zoster virus (HZV) or varicella zoster virus (VZV), which primarily affects the trigeminal nerve. The method was tested on 1000 images, achieving 89.6% accuracy in detecting the early stage of HZV with low-cost image analysis. Different algorithms were compared using preprocessing, segmentation, extraction, and classification steps. The effectiveness of the detection system was 98.1% within eight days, with minimal information, although there were 33% false positives during the training process. The research contributes to understanding data management, deep learning, and technology for successful classification in early HZ detection. Lanera et al. [14] used textual data from the Italian pediatric primary care database Pedianet to train recurrent neural network (RNN) models for automatic identification of varicella zoster virus (VZV) infection in children. The models achieved a maximum area under the ROC curve (AUC-ROC) of 95.30% and demonstrated potential for clinical outcome predictive modeling using electronic health records (EHRs). This study’s findings supported the implementation of high-performance systems in various medical domains.
To overcome delays in confirming chickenpox data using traditional methods, Lee et al. [15] proposed a deep learning model that leverages real-time web data. By capturing nonlinear relationships and incorporating outbreak-related keywords, the LSTM prediction model achieved high accuracy (correlation coefficient of 0.97114) and outperformed linear regression models (root mean square error of 341.01547). Uzun Ozsahin et al. [4] conducted a study that integrated a well-trained deep learning (DL) algorithm for the early detection and classification of chickenpox and monkeypox using digital skin lesions images in human subjects. Using two open-sourced digital skin image datasets, a two-dimensional convolutional neural network (CNN) with four convolutional layers and three max-pooling layers was applied. The proposed CNN model demonstrated superior performance compared to other DL models, achieving a test accuracy of 99.60% and a weighted average precision, recall, and F1 score of 99.00%. The findings indicate the potential of the proposed model, aided by unique features and image augmentation techniques, in rapidly and accurately detecting monkeypox through digital skin images.
Early detection of herpes zoster virus (HZV) affecting the trigeminal nerve is crucial to prevent eye damage. Arias and Mejia [16] developed a new methodology utilizing convolutional neural networks (CNNs) and deep learning for early detection of HZV. The methodology involved preprocessing, segmentation, extraction, and classification stages. The study identified limitations, device, and software failures in developing an early HZ detection system. The classification process is a key factor, incorporating such techniques as k-nearest neighbor (KNN), neural networks, and logistic regression. On average, the proposed paradigm achieves 97% effectiveness in early detection with minimal information. Wang et al. [17] carried out a study to predict the development of postherpetic neuralgia (PHN) in patients with acute herpetic neuralgia, aiding clinicians in decision-making. Risk factors were identified through machine learning algorithms, with age, NRS score, rash site, CCI score, antiviral therapy, and immunosuppression being significant. The random forest algorithm achieved an accuracy of 96.24% in predicting PHN, demonstrating its potential in developing predictive models for future cases.
Using Super Learner, a statistical machine learning method, Gilbert and Luedtke [18] evaluated the varicella zoster virus-specific glycoprotein-based enzyme-linked immunosorbent assay (gpELISA) antibody titer as an individual-level indicator of herpes zoster (HZ) risk. Gender and pre- and postvaccination gpELISA titers demonstrated moderate predictive ability for HZ occurrence in 50–59-year-olds, with similar accuracy for vaccine and placebo recipients. The findings supported the hypothesis that gpELISA titer is a statistical, rather than mechanistic, correlate of protection against HZ.
3. Methodology
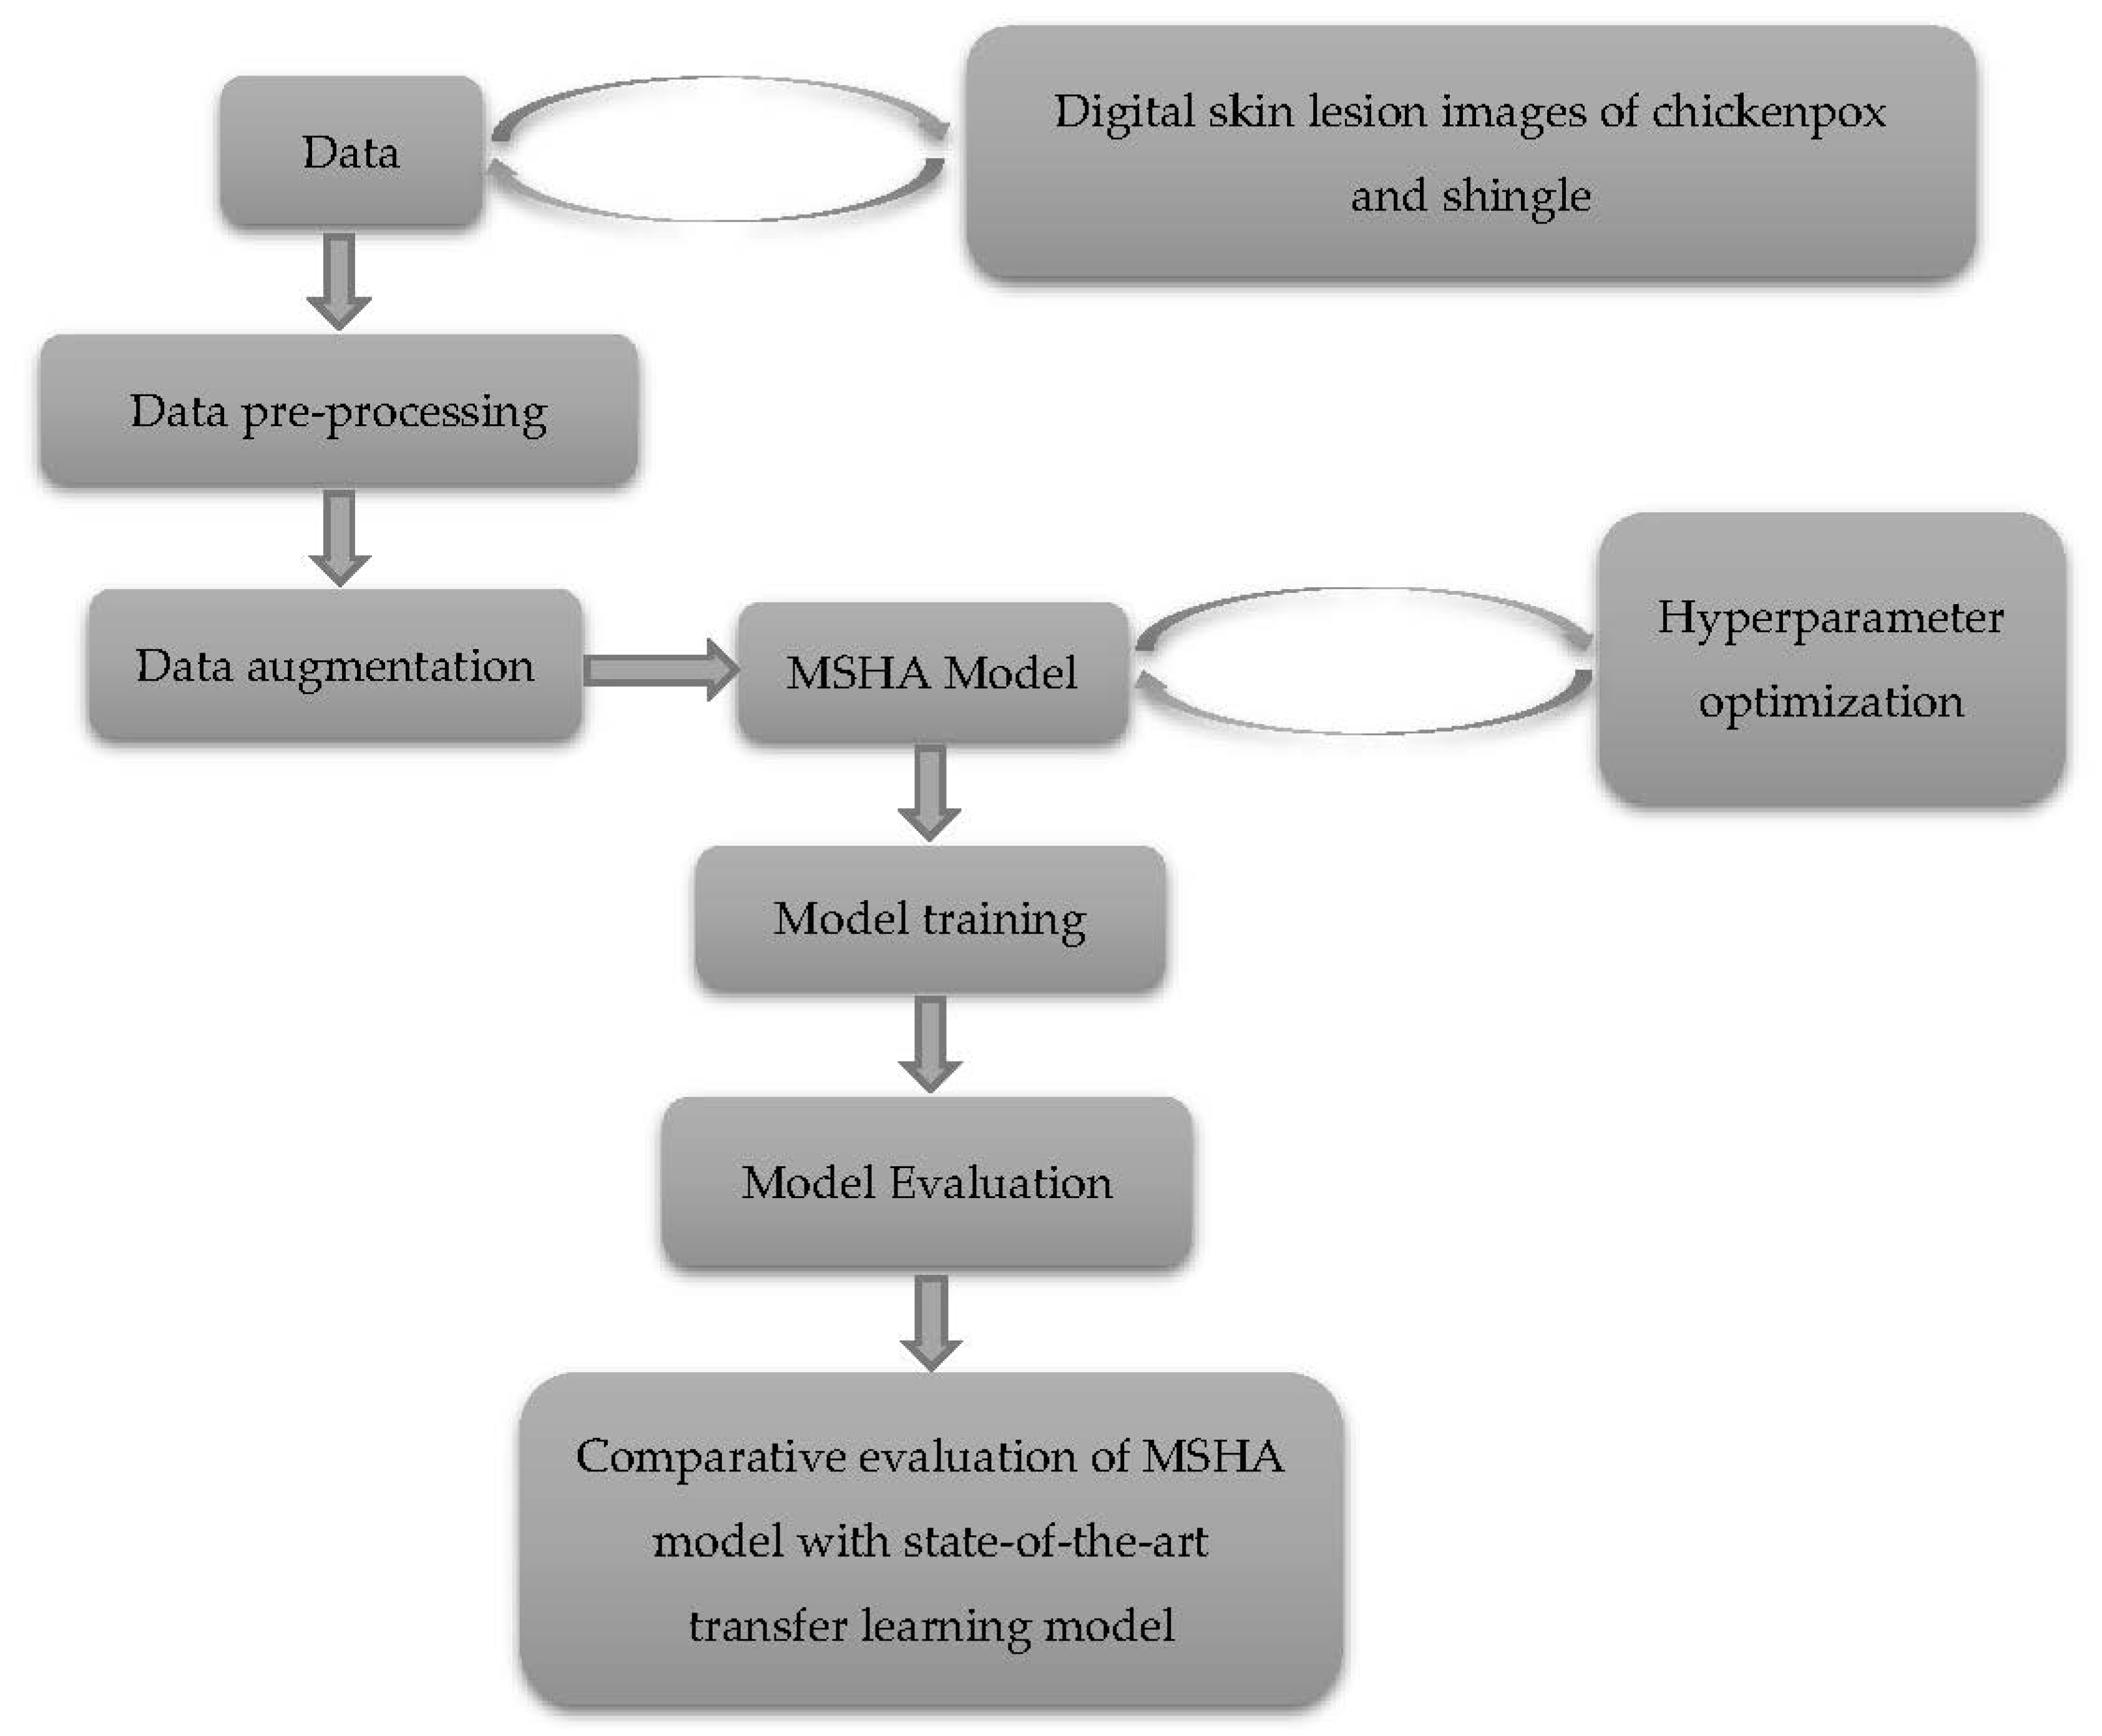
This section highlights the data and methodology adopted in this study. Figure 2 presents the roadmap implemented throughout the study.

Figure 2.
A complete methodology of the study.
3.1. Data Collection and Description
This study employed digital imaging datasets comprising two classes: chickenpox and shingles lesions. The chickenpox dataset consisted of 640 original images obtained through web scraping, as previously used in other studies as shown in Table 1. To ensure image quality, a rigorous screening process was conducted, eliminating blurry, low-detail, and subpar images. Only unique and visually clear images were retained. The shingles dataset was obtained by manually searching publicly available case reports on the internet. Low-resolution and low-quality images were excluded, focusing on higher-resolution images that provided better visual information and clarity. Preference was given to images with minimal compression artifacts, as optimized compression artifacts can adversely affect image quality and subsequent analysis. Images without a distinctive label of chickenpox were discarded. All low-resolution and low-quality images were removed, leaving us with only higher-resolution images that provided clearer visual information, better detail, and clarity. Furthermore, we selected only the images with minimal compression artifacts whenever possible. The presence of optimized compression artifacts can degrade image quality and affect subsequent analysis. Additionally, images with no distinctive label of chickenpox were discarded. All images were resized while maintaining their aspect ratio and cropped to the region of interest. Identifying features were removed from chickenpox and shingle-cropped images to protect patient privacy. By considering these additional processes and characteristics, we were able to enhance the quality and usability of the scraped images, ensuring that the obtained skin lesion images of chickenpox and shingles consisted of optimal images for the intended purposes.

Table 1.
Distribution of data.
3.2. Data Preprocessing and Augmentation
Image preprocessing enhances fine details and improves key features by removing unwanted variations [19]. Properly preprocessed images improve segmentation and classification, as all algorithms are susceptible to noise. Image preprocessing techniques can be classified based on their target pixel region size. These techniques operate on neighboring pixels of the sub-image to eliminate distortion and noise and improve images. The poor quality of cameras, environmental factors, and limited user interface can prevent digital skin images from becoming distorted, resulting in a loss of visual information and processing difficulties [20]. In this study, image contrast enhancement was used to improve the display of the region of interest in two datasets. The original chickenpox and shingles datasets were augmented using the Python Imaging Library (PIL) version 9.2.0 and Scikit-image library version 0.19.3 to increase the number of images and add variability to the data. This resulted in 10,000 augmented images each for chickenpox and shingles lesions, while 50 images each were reserved as test data without any augmentation. These un-augmented images were used to evaluate the model’s performance on new skin lesion images, preventing overfitting and knowledge leakage.
Table 2 shows the augmentation techniques used in this study, including positional and color augmentation techniques to maintain the originality of the data, with ranges chosen based on previous experience augmenting data. The techniques included shear range, zoom range, rotation, zero-phase component analysis (ZCA) whitening, image shift, and flipping. These techniques were used to improve model prediction accuracy, prevent overfitting, and create variability and flexibility in the training data [21]. However, there are limitations to the technique, including the need for evaluation systems for quality checks and the difficulty of creating new synthetic data using advanced techniques such as generative adversarial networks (GANs) [22].
Table 2.
Image augmentation settings.
The encoder and decoder of deep neural networks process and reconstruct the image. Image denoising is also an essential process to remove noise from images, which can cause a loss of information. To address this, a deep CNN auto-encoder was adopted to reconstruct the input image by learning useful features and data representations through an unsupervised learning process.
3.3. Hyperparameter Optimization
Optimizing hyperparameters is crucial for our novel model, as it directly influences its performance and generalization. Hyperparameters are configurations set by the researcher that significantly impact the model’s behavior, convergence speed, regularization, and capacity. While we kept the hyperparameters of established models unchanged, we employed the grid-search optimization technique to optimize our novel model’s hyperparameters. Grid-search optimization involves exhaustively searching through predefined hyperparameter combinations to identify the best configuration that maximizes performance. We explored four key hyperparameters: batch size, epochs, optimizer choice, and learning rate. The batch size determines the number of samples processed before weight updates, ranging from 10 to 100. The number of epochs defines the passes through the dataset, varying from 30 to 100.
To explore different optimization algorithms, we considered seven optimizers: SGD, RMSProp, Adagrad, Adadelta, Adam, Adamax, and Nadam. The learning rate, tested at values of 0.0001, 0.001, 0.01, 0.1, and 0.2, was also varied. Through grid-search optimization, we found that a batch size of 32, 50 epochs, Adam optimizer, and learning rate of 0.0001 yielded optimal performance for our MSHA model. These hyperparameter settings were determined based on their ability to maximize performance for our specific task while avoiding such issues as overfitting or slow convergence. The grid-search technique systematically explored the hyperparameter space and allowed us to evaluate multiple combinations, ensuring the selection of the best configuration for our novel model.
By employing this approach, we optimized our model’s hyperparameters and obtained the optimal set of configurations, enhancing its performance and suitability for our specific problem.
3.4. MSHA Model
The MSHA is a novel multi-modal contextual fusion CNN model. It got its name by combining mixed-scale dense convolution, self-attention mechanism, hierarchical feature fusion, and attention-based contextual information techniques in a single architecture. The MSHA model was employed in this study to showcase the capabilities of a CNN model that was developed from scratch, incorporating unique modifications tailored to the specific data and problem at hand to achieve optimal performance. The model was carefully designed, starting with a simple CNN architecture and gradually enhancing it by adding convolution, pooling, and dense layers, while also fine-tuning the hyperparameters. Throughout the hyperparameter tuning process, precautions were taken to prevent overfitting and underfitting, ensuring the model’s ability to generalize well to unseen data. This is evident in the model’s performance when compared to a state-of-the-art pre-trained model evaluated in this study.
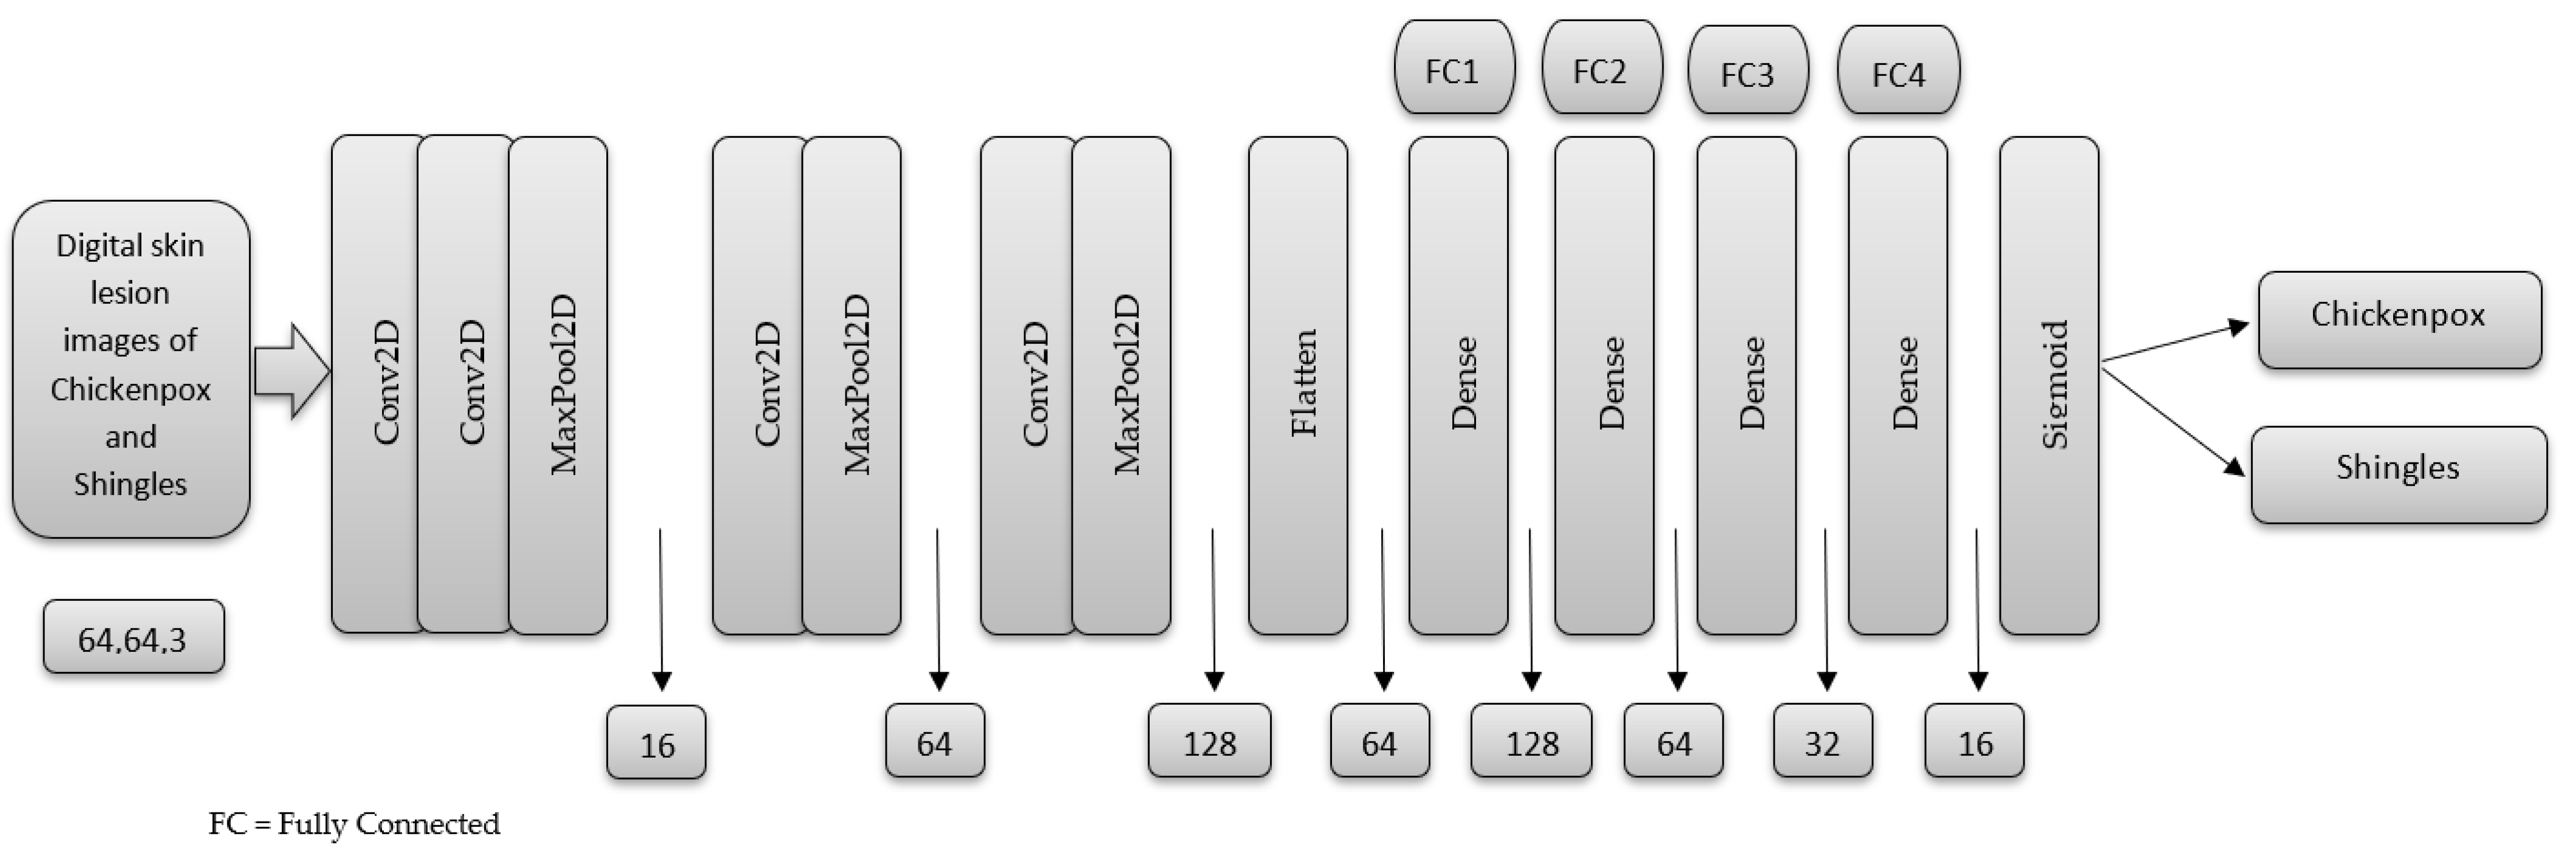
The MSHA model is specifically designed to handle both image classification and object detection tasks. It consists of dedicated components for feature extraction, object detection using the region proposal network (RPN), and final classification. The detection method of classification, which derives output information from a single image, was adopted using a 2-dimensional (2-D) CNN architecture. The network comprises four convolutional and three max-pooling layers applied at specific points within the architecture as shown in Figure 3. The kernel sizes of these layers are 3 × 3 and 2 × 2, respectively. Following the convolutional layers, a series of 5 fully connected layers with different units (128, 64, 32, 16, and 1) are utilized to enable high-level reasoning before reaching the final sigmoid classifier layer.
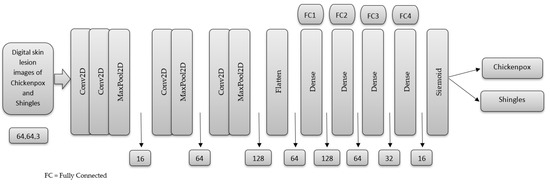
Figure 3.
The basic architecture of the MSHA model.
During the training process, the Adam optimizer, a gradient-based stochastic optimizer, was employed with a batch size of 32. Dropout regularization was applied at a rate of 25% on the convolutional and fully connected layers to prevent overfitting. The binary cross-entropy loss function was used to compare the predicted probabilities with the actual class outputs (0 or 1). The rectified linear activation function (ReLU) was selected as the activation function throughout the network before the final sigmoid activation function. To prevent overfitting, a validation dataset extracted from the training set was used to monitor the model’s performance, and early stopping was implemented to halt training if no improvement was observed. Additionally, dropout regularization was applied after the third max-pooling layer and in the dense layer to simplify and regularize the neural network, reducing overfitting.
By providing these comprehensive details, we ensure transparency and demonstrate the rigor of our approach in developing and training the MSHA model.
Our model stands out as a unique and novel approach in several respects. Firstly, it incorporates additional features, such as batch normalization layers, dropout layers, residual connections, and attention mechanisms. These additions contribute to improved training stability, regularization against overfitting, enhanced gradient flow, and the ability to capture long-range dependencies. Secondly, our model is designed to handle both image classification and object detection tasks within a single unified framework. It consists of components dedicated to feature extraction, object detection using the region proposal network (RPN), and final classification. This multi-purpose architecture offers versatility and efficiency, eliminating the need for separate models for different tasks. Moreover, the attention mechanism in our model allows for capturing dependencies across spatial locations, enabling the model to focus on relevant image regions and understand contextual relationships. This attention mechanism enhances performance in both image classification and object detection tasks. Additionally, combining convolutional layers and residual connections empowers the model to learn complex image features and structures effectively. The convolutional layers capture hierarchical features, while residual connections facilitate gradient flow and enable the training of deeper models. Lastly, our model’s flexibility and modifiability make it a valuable tool for researchers and practitioners.
4. Result and Discussion
This study conducted the model training and evaluation using the Keras package and Python programming language in the Jupyter Notebook environment. The preprocessed data were divided into training and test sets and fed into the novel MSHA model. The model was validated using a subset of the training data and trained using 50 epochs. Two callbacks, EarlyStopping and ReduceLROnPlateau, were implemented to improve the training process, optimize model performance, and prevent overfitting. EarlyStopping monitors the validation loss and stops the training process early if the loss does not improve for a certain number of epochs [23]. In our case, we selected the validation loss. The ReduceLROnPlateau callback reduces the learning rate when the validation loss does not improve for a certain number of epochs [24]. In this case, patience = 3.
It is crucial to determine whether the modifications introduced are indeed tailored to the problem at hand. To ensure this, we carefully explored the dataset’s characteristics, including the total number of images, class distribution, image resolutions, and color spaces. Additionally, to ensure robust model performance, we applied rigorous data preprocessing techniques, such as image resizing, normalization, and data augmentation, to handle variations in image quality and content. Moreover, we conducted a class-specific analysis to identify the unique challenges presented by chickenpox and shingles detection, which guided the integration of specialized techniques into our model architecture. Through this analysis, we gained critical insights into the dataset’s properties and intricacies, leading to the tailored combination and optimization of elements such as batch normalization layers, dropout layers, residual connections, and attention mechanisms. Our model’s architecture was systematically fine-tuned to accommodate these unique challenges, resulting in improved performance and robustness. By tailoring the model to the specific dataset, we ensured that it can effectively generalize to unseen data and maintain high accuracy across diverse conditions.
During the hyperparameter tuning process, we evaluated the performance of the MSHA model in classification tasks, as we are currently conducting another study on its effectiveness for object detection tasks. Our experimental results unequivocally demonstrate that the integration of image classification and object detection components in the unified framework does not compromise the model’s performance. This finding highlights the effectiveness and efficiency of our unified approach, eliminating the need for separate models and reducing computational overhead while maintaining high accuracy and localization capabilities. By carefully fine-tuning the model’s components and incorporating adaptive learning rates, we ensured that the model effectively learns discriminative features for image classification while retaining its precise object localization capabilities for detection.
4.1. Performance Evaluation Metrics
Performance evaluation metrics are crucial in developing, testing, and deploying machine learning models, allowing for more accurate and effective AI solutions [25]. They provide a way to quantitatively measure accuracy, precision, sensitivity, specificity, and other aspects of the model’s performance. With performance evaluation metrics, it is possible to determine how well a model performs or compare different models’ performance. The use of performance evaluation metrics also helps to improve the transparency and interpretability of machine learning models, which is essential for building trust in these systems [26].
In this study, the performance of the novel MSHA model was evaluated using performance evaluation metrics. The results indicated that the MSHA model was highly accurate in classifying digital images of skin lesions of chickenpox and shingles disease, with a precision of 96% for chickenpox and 94% for shingles, as shown in Table 3. The model’s high precision score indicates it could correctly identify the target class for most cases. Moreover, the sensitivity score of 94% for chickenpox and 96% for shingles show that the model can correctly identify all positive cases. This indicates a highly sensitive model with promising clinical significance in accurately detecting chickenpox and shingles disease in skin lesions. Subsequently, the specificity scores of 98% for chickenpox and 94% for shingles showed that the model can correctly identify all negative cases. This indicates that the model is highly specific and can accurately detect when the disease is absent. The F1 score of 95% for chickenpox and shingles indicates the model’s potential to balance precision and sensitivity efficiently. This means the model can identify the positive cases (chickenpox and shingles lesions) while correctly minimizing the false positives. Finally, the accuracy score of 95% indicates that the model can correctly classify the skin lesions of chickenpox and shingles with a high degree of accuracy.
Table 3.
Performance evaluation metrics for the MSHA model.
The high performance of the MSHA model in classifying these skin diseases has significant clinical implications in providing rapid and accurate diagnosis, particularly in regions with limited access to specialized medical care and facilities. The model can aid dermatologists and health-care providers in the early detection and diagnosis of these skin diseases, leading to better treatment outcomes and improved patient care.
4.2. Confusion Metrics
A confusion matrix is a statistical tool commonly used to evaluate the performance of machine learning models. We implemented it to help determine how well our model can classify all the images into the two classes. The matrix presents the number of true-positive (TP), true-negative (TN), false-positive (FP), and false-negative (FN) predictions made by the model. A confusion matrix is essential for evaluating the accuracy and effectiveness of models, as it provides a clear visual representation of the model’s performance. By examining the matrix, the strengths and weaknesses of the model can be identified, and adequate improvements can be made to ensure more accurate and reliable diagnoses [27].
The MSHA model produced excellent results, as evidenced by the confusion matrix. The model correctly predicted all 42 instances (TP) for chickenpox, with only 8 images misclassified as shingles (FP), as shown in Figure 4. This result indicates that the model is highly accurate and reliable for diagnosing chickenpox. Additionally, the model correctly classified 46 instances (TN) for shingles, but misclassifies 4 shingles lesion images (FN). The confusion matrix results for the MSHA model in classifying digital skin images of human subjects into the two classes are highly significant for medical diagnosis.
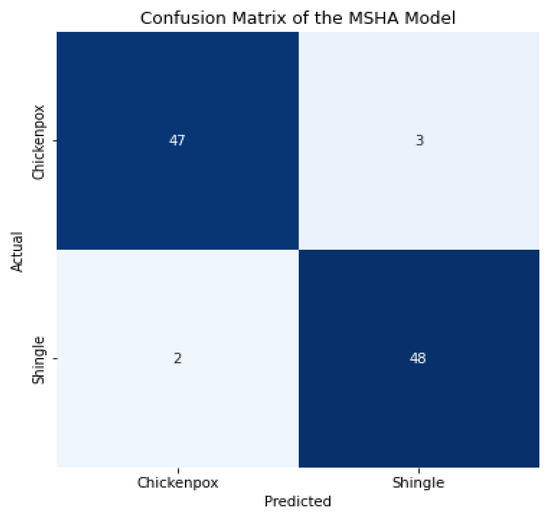
Figure 4.
The confusion matrix of the MSHA model.
4.3. Learning Curve
Model accuracy and model loss learning curves are important tools for evaluating the performance of deep learning models. They provide information about the accuracy and loss of a model over time during the training process, which can help identify potential issues with the model’s performance and guide improvements to the model [28]. The model accuracy learning curve shows the model’s accuracy on the training and validation datasets over time. It can reveal whether the model is overfitting or underfitting the training data [29]. An overfit model will have high accuracy on the training data but low accuracy on the validation data, indicating that it needs to generalize better to new and unseen data [30]. An underfit model will have low accuracy on both the training and validation data, indicating that it needs to learn the patterns in the data better [31]. Monitoring the model accuracy learning curve makes it possible to identify the optimal number of epochs to train the model and ensure that it is not overfitting or underfitting.
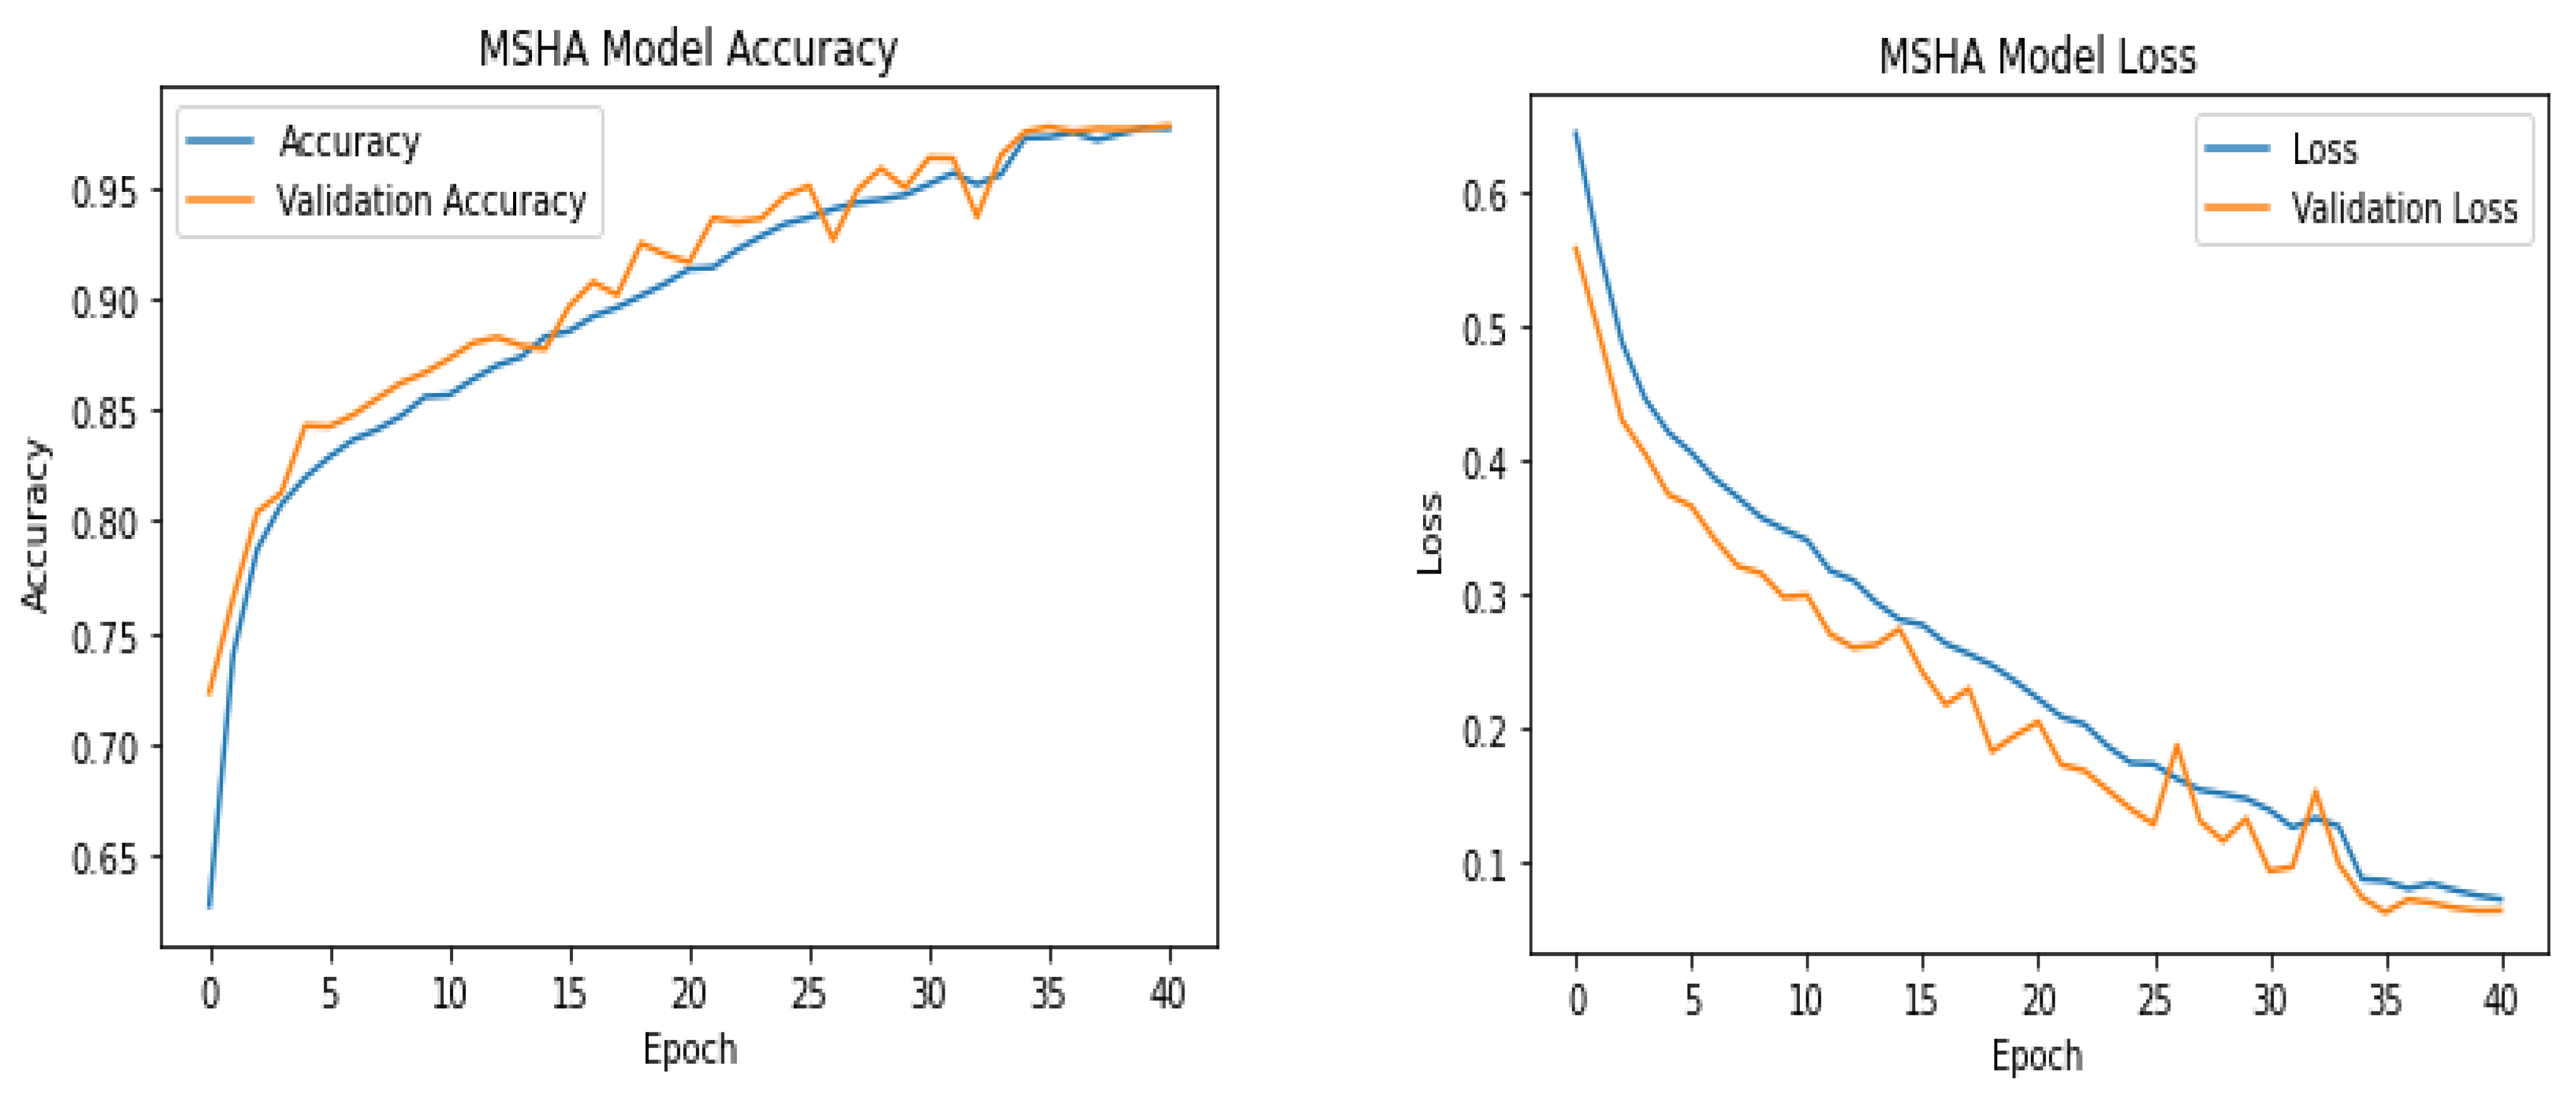
The MSHA model produced a good fit and was able to learn the underlying patterns in the data without overfitting or underfitting. The increased training accuracy over the epochs indicated that the model was learning and improving. As shown in Figure 5, the training started slowly between epochs 0 to 3 before an upward and steady increase to produce an accuracy of 0.80 to 0.95 between epochs 4–32. There was a slightly irregular decrease at epoch 33 before a continuous upward trend up to a training accuracy of 0.96. As important as the training accuracy is, it is important to evaluate the model’s performance on the validation data, which represents new, unseen data, to ensure that the model is balanced with the training data. Similarly, to the training accuracy, the validation accuracy started slowly and showed an irregular increase until it plateaued at a validation accuracy of 0.96 at epoch 35, indicating that further training may not improve the model’s performance on new data. This temporal irregularity experienced at epoch 33 can be attributed to overfitting, which was eventually addressed by measures such as regularization, early stopping, and data augmentation. Another reason will be the impact of dataset variations. The specific samples in the validation set at epoch 33 may have introduced challenges or discrepancies that were not adequately captured during training, resulting in a temporary increase in validation loss. It is also worth considering the impact of learning rate decay. The learning rate decayed too rapidly or aggressively at epoch 33, making the model fail to achieve sufficient weight updates, causing a disruption in the learning curve. Preventing deviations in a learning curve does not indicate total stoppage of deviation, as no learning curve is without deviation. Rather, the goal is often to minimize deviations and improve the overall performance and stability of the trained model.
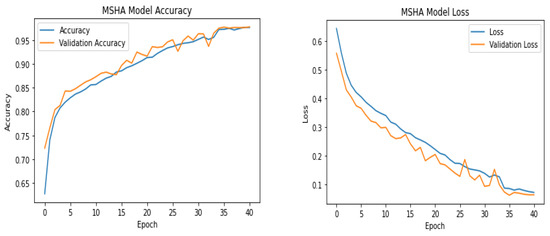
Figure 5.
MSHA model accuracy and loss.
The model loss learning curve shows the change in the loss function of a model as it trains over multiple epochs. The training loss decreases over time as the model learns to fit the data better, which is a good sign. The training loss started at 0.64 at epoch 1 and gradually decreased in a uniform manner to 0.07 at epoch 41. This indicates that the model improves its ability to predict the correct output with less error. On the other hand, the validation loss initially decreased from epoch 1 to 11 with consistent fluctuation between epoch 14–34 before stabilizing at epoch 35 and maintaining a uniform decrease. The validation loss measures the difference between the predicted and actual outputs on a data set that the model has not seen during training. Thus, it estimates the model’s performance on new data. A good fit is achieved when the model’s low training and validation losses have stabilized over several epochs. Low training and high validation loss indicate overfitting, while high values of both losses may suggest underfitting [24]. Therefore, analyzing the model accuracy and model loss learning curves is crucial in evaluating a model’s performance and deciding how to improve it.
4.4. Receiver-Operating Characteristic (ROC) Curve
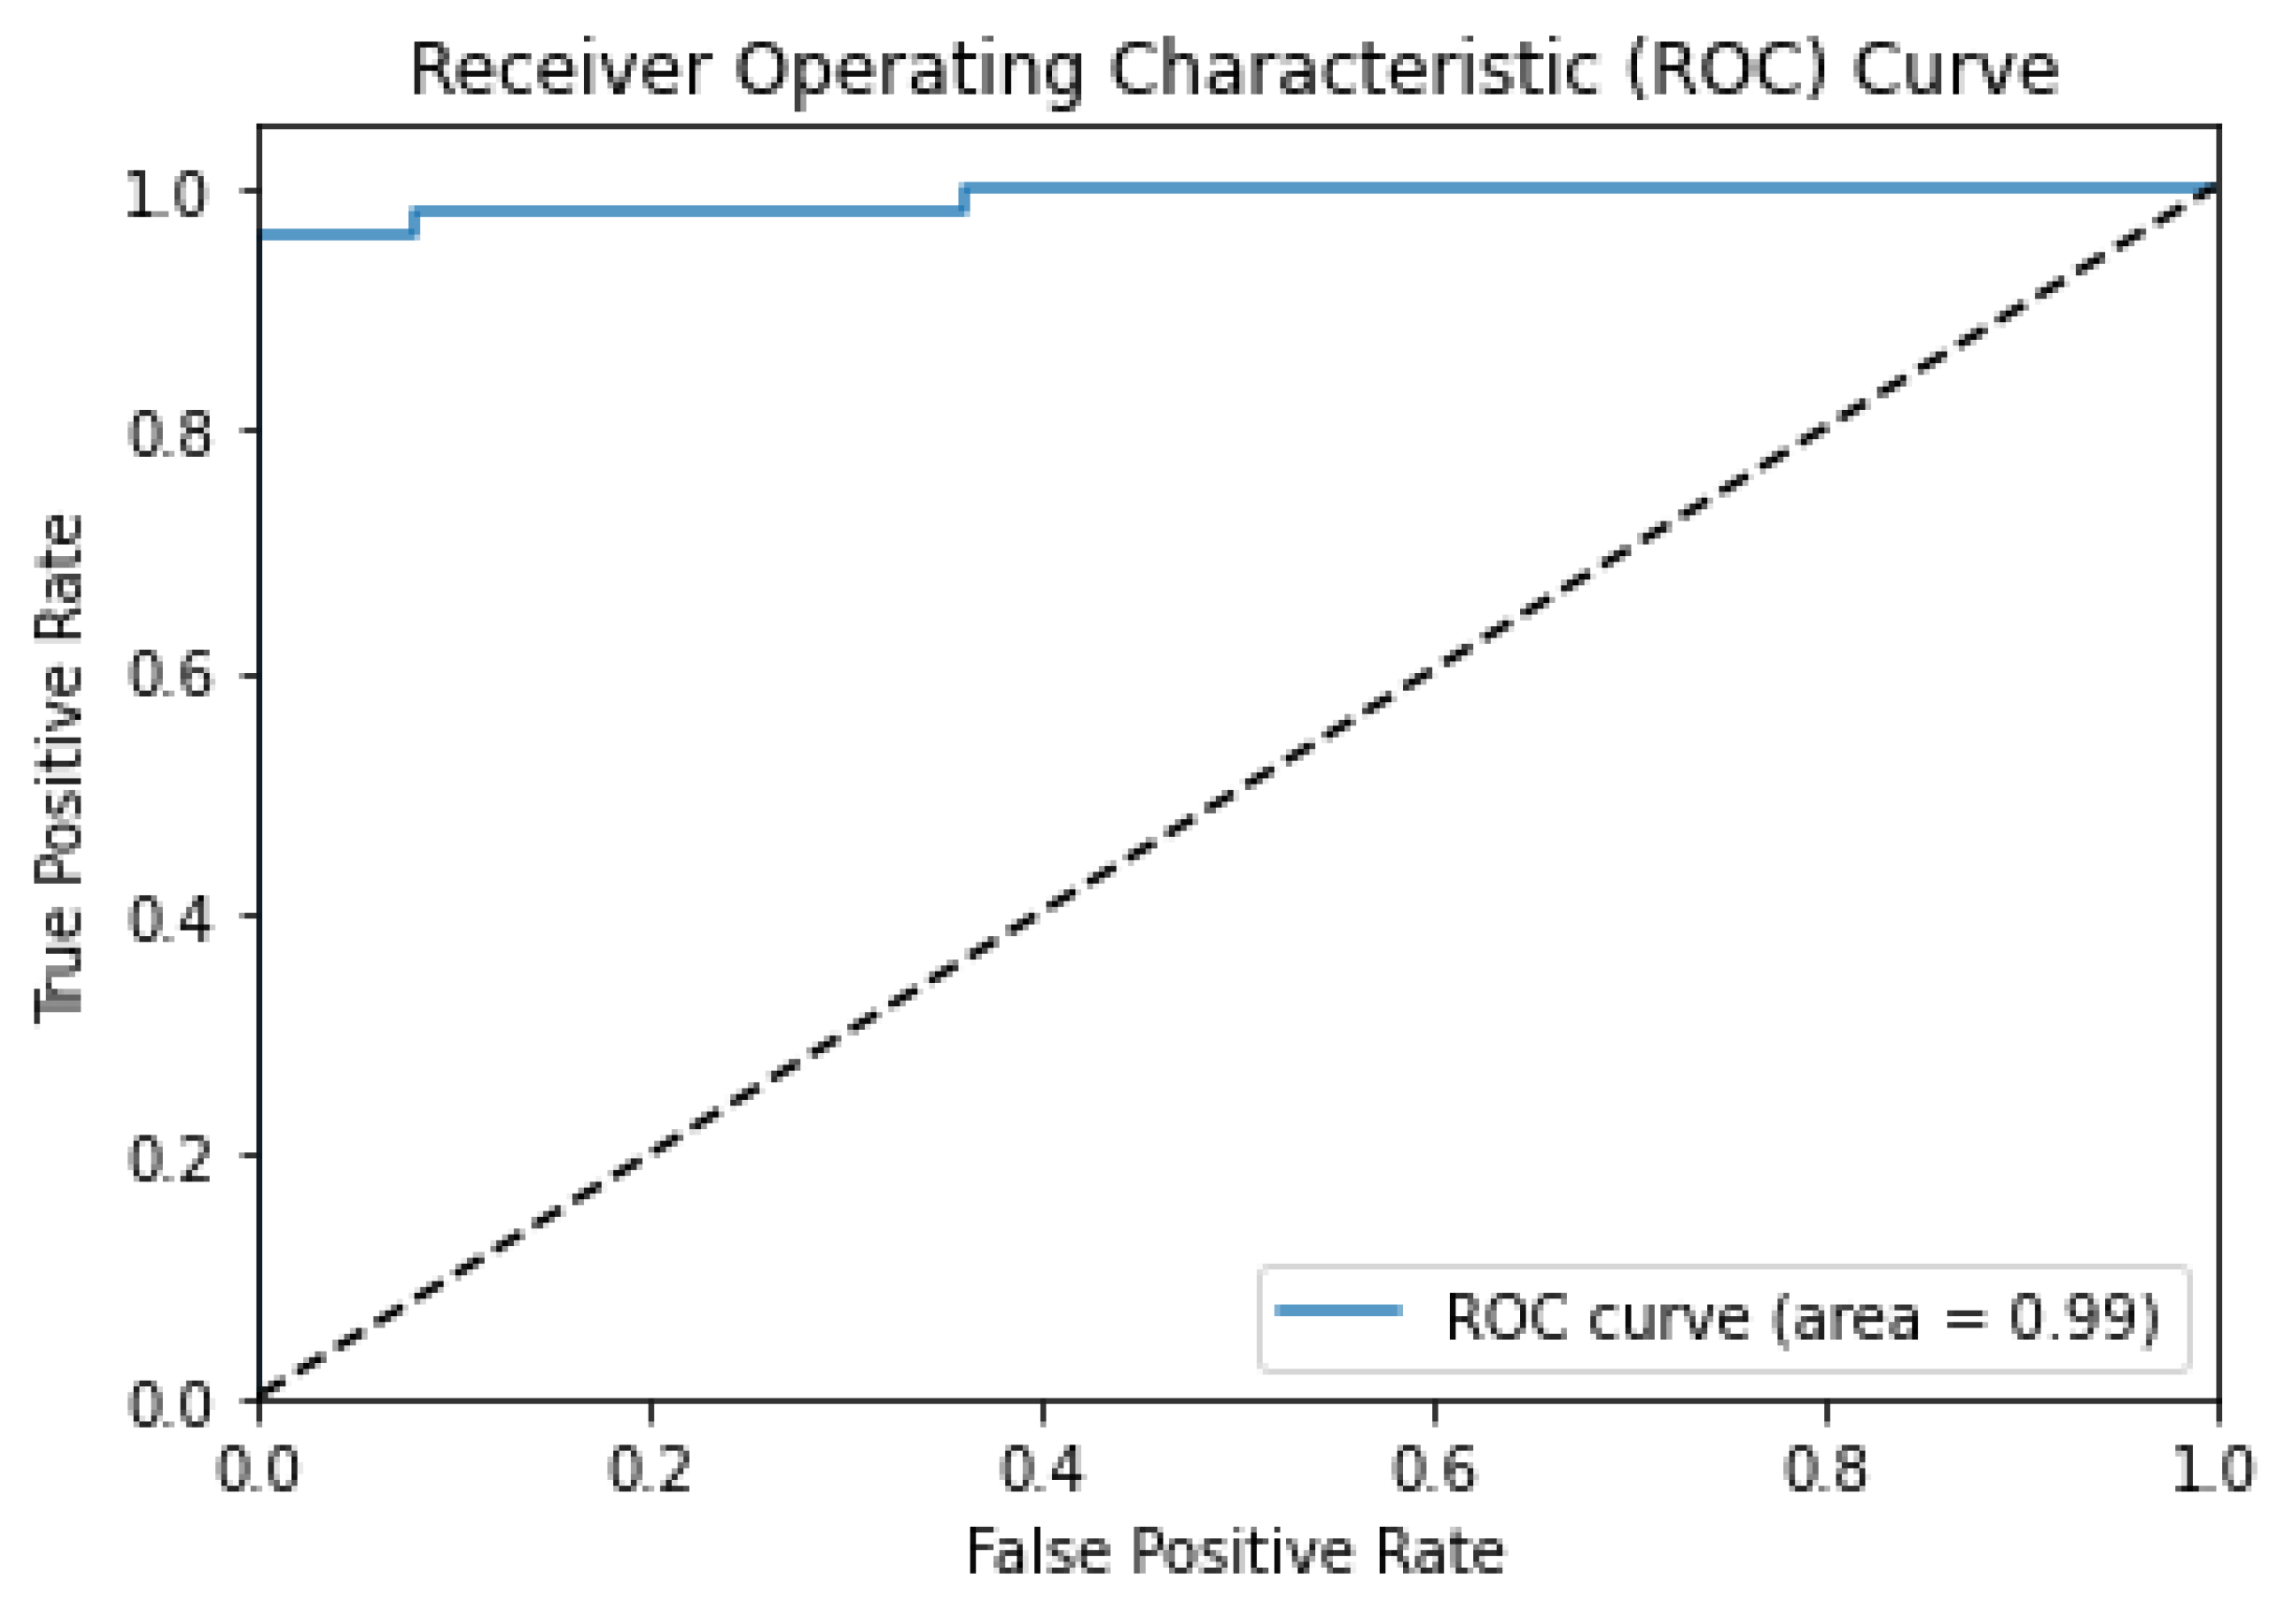
The area under the ROC curve (AUC ROC) is an important supervised learning metric, especially in binary classification problems that provide a graphical representation of the diagnostic performance of a classification model [32]. This metric comprehensively measures a classifier’s performance across all possible classification thresholds. The AUC ROC considers the true-positive rate (sensitivity) and the true-negative rate (specificity). It provides a single scalar value that summarizes the classifier’s ability to discriminate between chickenpox and shingles lesions. This ensures that a higher AUC ROC implies better model performance. While the AUC and ROC curves are closely related, they represent different concepts. The ROC is a curve plot that represents the performance of a binary classification model as its discrimination threshold is varied [33]. The AUC, on the other hand, is a numerical value that quantifies the overall performance of a binary classification model based on its ROC curve [34]. The AUC value quantifies the overall discriminatory power of the model, with a value of 1 representing perfect classification and 0.5 indicating random chance.
A ROC curve with an AUC of 0.99, as shown in Figure 6, suggests that the MSHA (model for skin lesion analysis) has an extremely high discriminatory capacity for differentiating between chickenpox and shingles lesions. This implies that the model can effectively separate true-positive cases (correctly identified lesions) from false-positive cases (incorrectly identified lesions) with a very high level of accuracy. Such a high AUC value indicates that the model has exceptional performance in correctly classifying the skin lesions associated with chickenpox and shingles. This signifies that the MSHA model has the potential to provide reliable and accurate diagnostic support for dermatologists and other healthcare professionals, especially at the initial point of diagnosis in distinguishing between chickenpox and shingles lesions. This high discriminatory power can aid in making precise diagnoses, guiding appropriate treatment decisions, and potentially reducing misdiagnoses or unnecessary procedures [34].
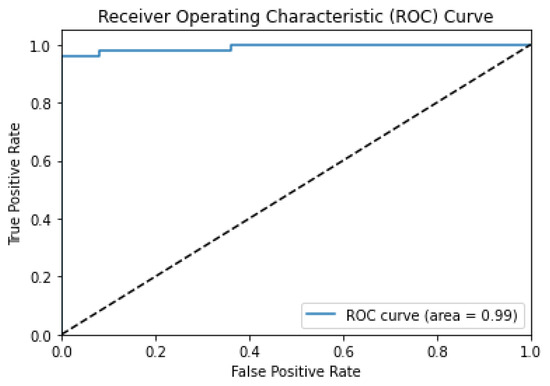
Figure 6.
ROC curve of the MSHA model.
4.5. Comparative Evaluation with State-of-Art Transfer Learning Techniques
Comparing our model with other state-of-the-art transfer learning techniques such as ResNet50, VGG16, VGG19, InceptonV3, and ViT (Vision Transformer) provides a benchmark for evaluation, assesses generalizability, contributes to advancements in the field, and aids decision-making for practical applications. Furthermore, these models are well-known and widely used transfer learning techniques in computer vision with remarkable performance and significant contributions to image recognition tasks. By comparing the MSHA model with these well-established models, we can effectively assess its performance, competitiveness, and potential superiority. This comparison will help position the novel MSHA model within the context of existing state-of-the-art approaches and establish its credibility and relevance in computer vision.
Similarly, to the implementation of the MSHA model, all the state-of-art transfer learning techniques used were implemented on the Jupyter Notebook. The last layers were frozen during the fine-tuning process to preserve learned representations and prevent them from being modified or overwritten, allowing the model to focus on adapting its parameters to the new task at hand and reducing the number of parameters that need to be updated, making the training process faster and more efficient. Three dense layers with the ReLu activation function were adopted before the final output layer with the sigmoid activation function. Finally, the model was trained using 50 epochs, while callbacks were adopted to prevent overfitting.
The ResNet50 is a convolutional neural network (CNN) architecture known for its deep residual learning framework. It addresses the problem of vanishing gradients in very deep networks, allowing for the training of extremely deep models. It has succeeded in various image classification challenges and is renowned for capturing intricate features from images [35]. VGG16 and VGG19 are deep CNN architectures developed by the Visual Geometry Group (VGG) at the University of Oxford. These models are characterized by their uniform architecture, consisting of multiple stacked convolutional and fully connected layers. VGG16 and VGG19 are known for their excellent performance on large-scale image classification tasks, exhibiting high accuracy due to their deep and fine-grained feature extraction capabilities [36]. The InceptionV3, also known as GoogleNet, introduced the concept of inception modules, efficiently capturing multi-scale features by employing parallel convolutions at different spatial resolutions. This architecture reduces the computational complexity while maintaining high accuracy. InceptionV3 has been widely used in various image recognition tasks and has demonstrated excellent object recognition and localization performance [37]. Finally, the ViT (Vision Transformer) represents a recent breakthrough in computer vision by applying transformer architectures, originally designed for natural language processing, to image classification. ViT models use self-attention mechanisms to capture global and local relationships within an image. This approach eliminates the need for handcrafted feature extraction and demonstrates impressive performance on various image classification benchmarks.
The comparative analysis of the novel MSHA model with state-of-the-art models reveals significant variation in performance and provides differing clinical implications. The novel MSHA model significantly outperformed other models with improved performance. Even though the MSHA model achieves identical levels of accuracy, precision, sensitivity, and F1 score as the InceptionV3 model, at 95.0%, as shown in Table 4, it exhibits a higher level of specificity at 96.0% compared to InceptionV3’s 95.2%. This suggests that the MSHA model performs slightly better in correctly identifying shingles lesions, which is valuable in minimizing false-positive results. This is important to help avoid unnecessary interventions or treatments for individuals without shingles lesions. The MSHA model also demonstrated a good balance of high true positives, true negatives, and low false positives and false negatives, contributing to its superior overall performance. The lowest loss value of 0.104 achieved by the MSHA model indicates that the model minimized the discrepancy between predicted and actual values during training, resulting in a better understanding of the patterns in the data and improved performance. The ResNet50 model had the highest loss value of 0.537, suggesting that it had a higher level of uncertainty and made less accurate predictions. Additionally, the higher loss indicates the model’s struggle to capture the intricate patterns and features associated with chickenpox and shingles lesions. The loss metric quantitatively measures the model’s ability to minimize errors and accurately predict the presence or absence of chickenpox and shingles skin lesions. Models with lower loss values are generally more reliable and can provide valuable support to dermatologists in effectively diagnosing chickenpox and shingles.
Table 4.
Comparative analysis of the novel MSHA and other state-of-the-art models.
The superior performance of the novel MSHA model can be attributed to several factors, such as its unique architectural design, effective training strategy, and better capacity to learn and represent the relevant features in the skin lesion images. The incorporation of specific design choices, such as the mixed-scale dense convolution layer, self-attention mechanism, hierarchical feature fusion, and attention-based contextual information, enabled the MSHA model to capture and extract relevant features more effectively for skin lesion classification. The MSHA model’s architecture seems better suited to learning and representing the intricate patterns and structures in the skin lesion images associated with chickenpox and shingles. Additionally, the MSHA model was trained using optimized configuration and effective training strategies by carefully selecting hyperparameters such as learning rate, batch size, and regularization techniques. These configurations will facilitate faster convergence and help the model find a more optimal solution.
Despite ResNet50 being a sophisticated model known for its deep architecture and skip connections, it exhibited the poorest performance compared to other models. The lower precision of 73.0% and F1 score of 72.0% suggest that ResNet50 had a higher rate of false positives and false negatives, resulting in suboptimal predictions. This could result from the unique characteristics of the data used and the architectural complexity of the ResNet50 model, which may not be ideal for detecting digital skin lesions associated with chickenpox and shingles. The VGG19 model, designed as a more sophisticated version of VGG16, achieved slightly lower performance, with a precision of 86.0% and an F1 score of 86.0% compared to VGG16′s 89.0% and 88.0%, respectively. This difference can also be attributed to factors such as increased model complexity in the case of the VGG19 model leading to insufficient representation of the specific features relevant to the classification task.
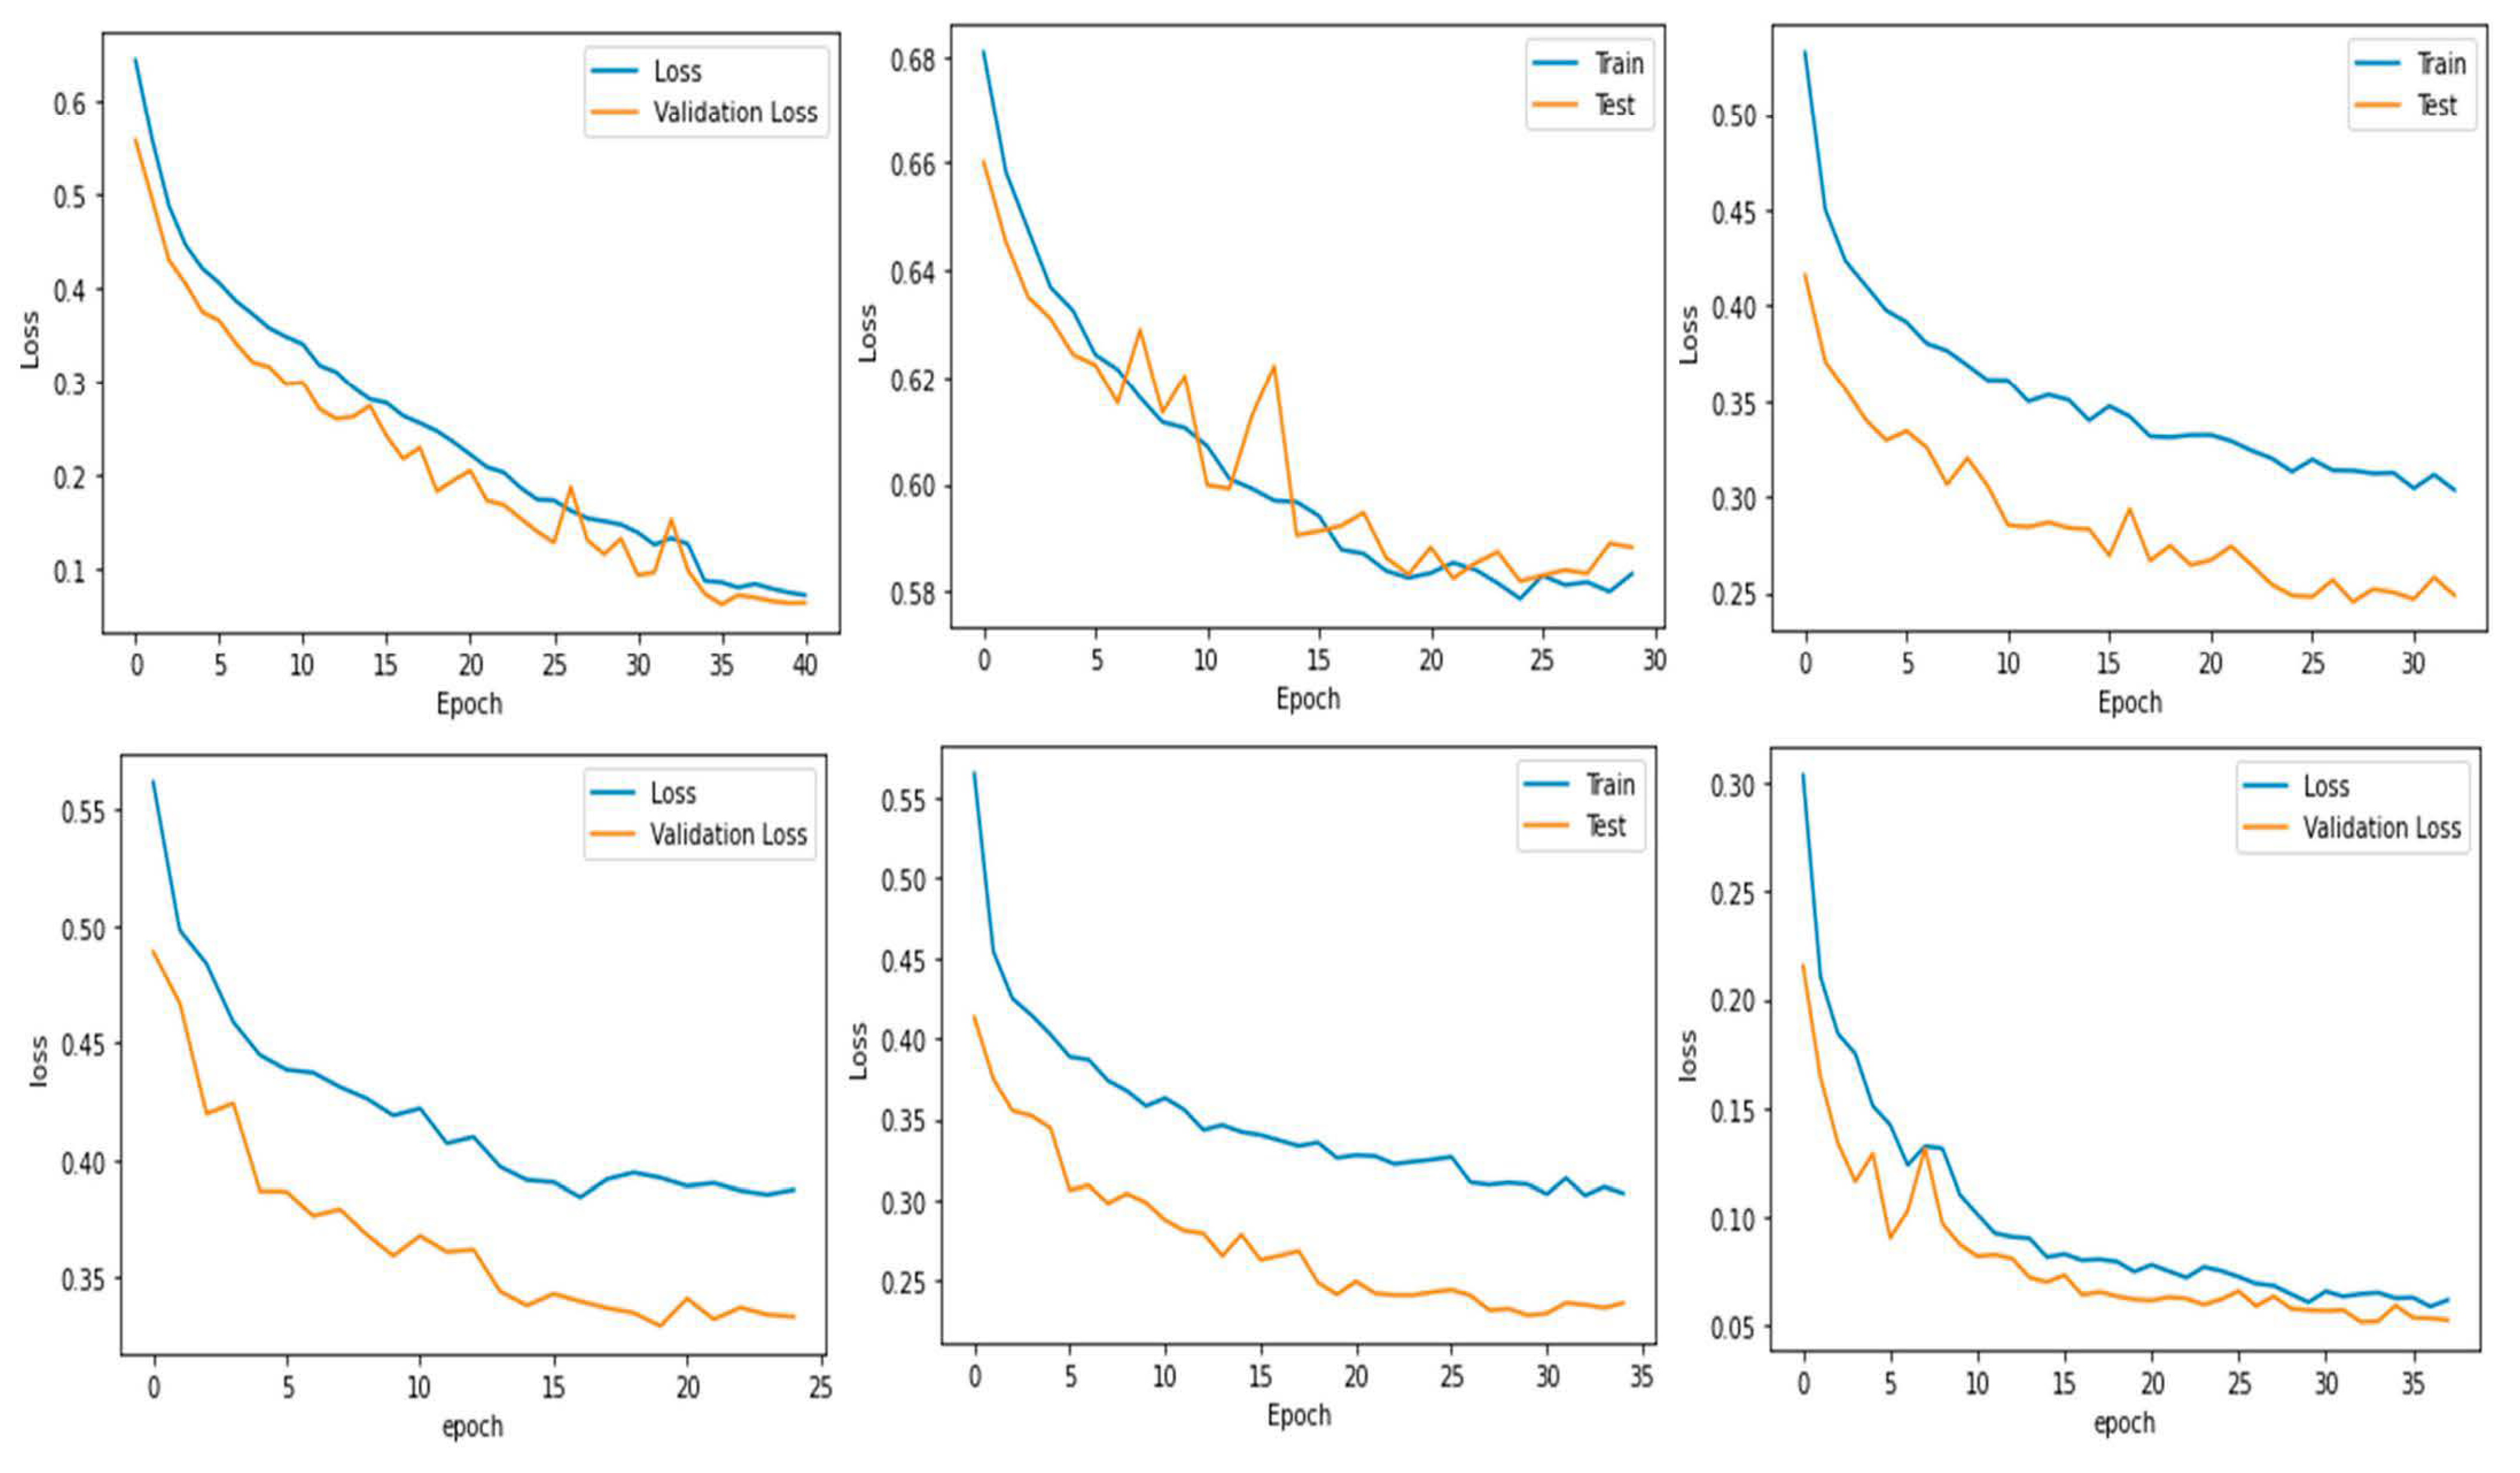
After extensive evaluation, our findings revealed that the integration of batch normalization layers, dropout layers, residual connections, and attention mechanisms in the MSHA model resulted in several key advantages. Firstly, the combination led to improved training stability, as evidenced by faster convergence and reduced training loss fluctuations, as shown in Figure 7. Secondly, the regularization effects of the integrated techniques effectively mitigated overfitting, enhancing the model’s generalization capabilities on unseen data. Furthermore, the incorporation of attention mechanisms significantly contributed to capturing long-range dependencies within the images, allowing the model to focus on relevant regions critical for accurate detection. This attention mechanism is particularly beneficial in detecting subtle and localized patterns associated with chickenpox and shingles. Comparing the MSHA model’s performance with existing models, we observed a substantial improvement in accuracy, achieving state-of-the-art results in image classification tasks. These improvements demonstrate that the careful and unique combination of techniques in our model does indeed yield genuinely novel outcomes, setting it apart from conventional approaches in the field.
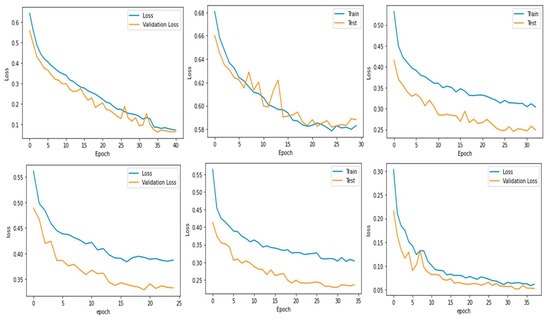
Figure 7.
Training loss of the models. From top left to right, MSHA, ResNet50, VGG16, VGG19, InceptionV3, and ViT.
5. Conclusions
This study introduced the MSHA model for detecting, classifying, and diagnosing chickenpox and shingles lesions. The model demonstrated impressive performance, as indicated by its learning curves, ROC curve, and comparative evaluation with state-of-the-art transfer learning techniques. The MSHA model holds promise as a valuable diagnostic support tool for dermatologists and health-care professionals, aiding in precise diagnoses and treatment decisions and potentially reducing misdiagnoses or unnecessary procedures in identifying chickenpox and shingles skin lesions.
Author Contributions
Conceptualization, M.T.M., M.C.E. and C.T.E.; methodology, M.T.M., M.C.E. and C.T.E.; software, M.T.M., M.C.E. and C.T.E.; validation, M.T.M., M.C.E. and C.T.E.; formal analysis, M.T.M., M.C.E. and C.T.E.; investigation, M.T.M., M.C.E. and C.T.E.; resources, M.T.M., M.C.E., L.E.V., T.T. and C.T.E.; data curation, M.T.M. and D.U.O.; writing—original draft preparation, M.T.M., M.C.E. and C.T.E.; writing—review and editing, D.U.O. and M.T.M., L.E.V., T.T. and C.T.E.; visualization, M.T.M.; supervision, M.T.M., M.C.E., D.U.O., L.E.V. and C.T.E.; project administration, D.U.O., L.E.V. and T.T. All authors have read and agreed to the published version of the manuscript.
Funding
This research received no external funding.
Data Availability Statement
The data used for this study will be provided upon request.
Conflicts of Interest
The authors declare no conflict of interest.
References
- Choy, S.-P.; Paolino, A.; Kim, B.J.; Lim, S.M.L.; Seo, J.; Tan, S.P.; Tan, W.R.; Corbett, M.S.; Barker, J.; Lynch, M.D.; et al. BT19: Applications of artificial intelligence and machine learning image analyses in dermatology: A systematic review. Br. J. Dermatol. 2022, 187, 129. [Google Scholar]
- Abhishek, K.; Kawahara, J.; Hamarneh, G. Predicting the Clinical Management of Skin Lesions Using Deep Learning. Sci. Rep. 2021, 11, 7769. [Google Scholar]
- Yap, J.; Yolland, W.; Tschandl, P. Multimodal skin lesion classification using Deep Learning. Exp. Dermatol. 2018, 27, 1261–1267. [Google Scholar]
- Uzun Ozsahin, D.; Mustapha, M.T.; Uzun, B.; Duwa, B.; Ozsahin, I. Computer-aided detection and classification of Monkeypox and chickenpox lesion in human subjects using Deep Learning Framework. Diagnostics 2023, 13, 292. [Google Scholar]
- Chen, Y.-W.; Jain, L.C. Deep Learning in Healthcare: Paradigms and Applications; Springer: Berlin/Heidelberg, Germany, 2020. [Google Scholar]
- Kassem, M.A.; Hosny, K.M.; Damaševičius, R.; Eltoukhy, M.M. Machine learning and deep learning methods for skin lesion classification and diagnosis: A systematic review. Diagnostics 2021, 11, 1390. [Google Scholar]
- Aggarwal, R.; Sounderajah, V.; Martin, G.; Ting, D.S.; Karthikesalingam, A.; King, D.; Ashrafian, H.; Darzi, A. Diagnostic accuracy of deep learning in Medical Imaging: A systematic review and meta-analysis. NPJ Digit. Med. 2021, 4, 65. [Google Scholar]
- Centers for Disease Control and Prevention. Chickenpox (Varicella). Centers for Disease Control and Prevention. Available online: https://www.cdc.gov/chickenpox/index.html (accessed on 28 April 2023).
- Sampathkumar, P.; Drage, L.A.; Martin, D.P. Herpes zoster (shingles) and postherpetic neuralgia. Mayo Clin. Proc. 2009, 84, 274–280. [Google Scholar]
- Mayo Foundation for Medical Education and Research. Chickenpox. Mayo Clinic. Available online: https://www.mayoclinic.org/diseases-conditions/chickenpox/symptoms-causes/syc-20351282 (accessed on 28 April 2023).
- Opstelten, W.; Eekhof, J.; Neven, A.K.; Verheij, T. Treatment of herpes zoster. Can. Fam. Physician 2008, 54, 373–377. [Google Scholar]
- Chanunpha, A. Woman Leg Skin Background with Rash from Herpes Zoster or Shingles… iStock. Available online: https://www.istockphoto.com/pt/foto/woman-leg-skin-background-with-rash-from-herpes-zoster-or-shingles-disease-gm1151504282-312099549 (accessed on 28 April 2023).
- Mejía Lara, J.V.; Arias Velásquez, R.M. Low-cost image analysis with Convolutional Neural Network for herpes zoster. Biomed. Signal Process. Control 2022, 71, 103250. [Google Scholar]
- Lanera, C.; Baldi, I.; Francavilla, A.; Barbieri, E.; Tramontan, L.; Scamarcia, A.; Cantarutti, L.; Giaquinto, C.; Gregori, D. A deep learning approach to estimate the incidence of infectious disease cases for routinely collected ambulatory records: The example of varicella-zoster. Int. J. Environ. Res. Public Health 2022, 19, 5959. [Google Scholar]
- Lee, M.; Kim, J.W.; Jang, B. Chicken pox prediction using Deep learning model. Trans. Korean Inst. Electr. Eng. 2020, 69, 127–137. [Google Scholar]
- Arias, R.; Mejia, J. Varicella-zoster early detection with deep learning. In Proceedings of the 2020 IEEE Engineering International Research Conference (EIRCON), Lima, Peru, 21–23 October 2020. [Google Scholar]
- Wang, X.-X.; Zhang, Y.; Fan, B.-F. Predicting postherpetic neuralgia in patients with Herpes Zoster by machine learning: A retrospective study. Pain Ther. 2020, 9, 627–635. [Google Scholar]
- Gilbert, P.B.; Luedtke, A.R. Statistical learning methods to determine immune correlates of herpes zoster in vaccine efficacy trials. J. Infect. Dis. 2018, 218, S99–S101. [Google Scholar]
- Subashini, M.; Sahoo, S.; Sunil, V.; Easwaran, S. A Non-Invasive Methodology for the Grade Identification of Astrocytoma Using Image Processing and Artificial Intelligence Techniques. Expert Syst. Appl. 2016, 43, 186–196. [Google Scholar]
- Wang, S.; Hamian, M. Skin Cancer Detection Based on Extreme Learning Machine and a Developed Version of Thermal Exchange Optimization. Comput. Intell. Neurosci. 2021, 2021, 9528664. [Google Scholar]
- Shorten, C.; Khoshgoftaar, T.M. A survey on image data augmentation for Deep Learning. J. Big Data 2019, 6, 60. [Google Scholar]
- Soni, P. Data Augmentation: Techniques, Benefits, and Applications, Analytics Steps. Available online: https://www.analyticssteps.com/blogs/data-augmentation-techniques-benefits-and-applications (accessed on 28 April 2023).
- Brownlee, J. Use Early Stopping to Halt the Training of Neural Networks at the Right Time. MachineLearningMastery.com. Available online: https://machinelearningmastery.com/how-to-stop-training-deep-neural-networks-at-the-right-time-using-early-stopping/ (accessed on 28 April 2023).
- Tensorflow Callbacks - How to Monitor Neural Network Training Like a Pro. Better Data Science. (n.d.). Available online: https://betterdatascience.com/tensorflow-callbacks-how-to-monitor-neural-network-training/#:~:text=If%20a%20value%20of%20the%20evaluation%20metric%20doesn%E2%80%99t,old%20learning%20rate%20multiplied%20by%20a%20user-defined%20factor (accessed on 28 April 2023).
- Mustapha, M.T.; Ozsahin, D.U.; Ozsahin, I.; Uzun, B. Breast cancer screening based on supervised learning and multi-criteria decision-making. Diagnostics 2022, 12, 1326. [Google Scholar]
- Uzun Ozsahin, D.; Mustapha, M.T.; Bartholomew Duwa, B.; Ozsahin, I. Evaluating the performance of deep learning frameworks for malaria parasite detection using microscopic images of peripheral blood smears. Diagnostics 2022, 12, 2702. [Google Scholar]
- Seyer Cagatan, A.; Taiwo Mustapha, M.; Bagkur, C.; Sanlidag, T.; Ozsahin, D.U. An alternative diagnostic method for C. Neoformans: Preliminary results of deep-learning based detection model. Diagnostics 2022, 13, 81. [Google Scholar]
- Uzun Ozsahin, D.; Onakpojeruo, E.P.; Uzun, B.; Mustapha, M.T.; Ozsahin, I. Mathematical assessment of machine learning models used for brain tumor diagnosis. Diagnostics 2023, 13, 618. [Google Scholar]
- Muralidhar, K.S.V. Learning Curve to Identify Overfitting and Underfitting in Machine Learning. Medium. Available online: https://towardsdatascience.com/learning-curve-to-identify-overfitting-underfitting-problems-133177f38df5 (accessed on 21 February 2023).
- Montesinos López, O.A.; Montesinos López, A.; Crossa, J. Overfitting, model tuning, and evaluation of prediction performance. In Multivariate Statistical Machine Learning Methods for Genomic Prediction; Springer International Publishing: Cham, Switzerland, 2022; pp. 109–139. [Google Scholar]
- Wolfe, C.R. Using Transformers for Computer Vision. Medium. Available online: https://towardsdatascience.com/using-transformers-for-computer-vision-6f764c5a078b (accessed on 25 April 2023).
- Trevisan, V. Interpreting ROC Curve and ROC AUC for Classification Evaluation. Medium. Available online: https://towardsdatascience.com/interpreting-roc-curve-and-roc-auc-for-classification-evaluation-28ec3983f077 (accessed on 25 March 2022).
- Brownlee, J. ROC Curves and Precision-Recall Curves for Imbalanced Classification. MachineLearningMastery.com. Available online: https://machinelearningmastery.com/roc-curves-and-precision-recall-curves-for-imbalanced-classification/ (accessed on 28 April 2023).
- Sabin, J.A. Tackling implicit bias in health care. N. Engl. J. Med. 2022, 387, 105–107. [Google Scholar] [CrossRef]
- Mukherjee, S. The Annotated Resnet-50. Medium. Available online: https://towardsdatascience.com/the-annotated-resnet-50-a6c536034758 (accessed on 28 April 2023).
- Understanding VGG16: Concepts, Architecture, and Performance. Datagen. (22 May 2023). Available online: https://datagen.tech/guides/computer-vision/vgg16/ (accessed on 28 April 2023).
- Alake, R. Deep Learning: Understand the Inception Module. Medium. Available online: https://towardsdatascience.com/deep-learning-understand-the-inception-module-56146866e652 (accessed on 28 April 2023).

Disclaimer/Publisher’s Note: The statements, opinions and data contained in all publications are solely those of the individual author(s) and contributor(s) and not of MDPI and/or the editor(s). MDPI and/or the editor(s) disclaim responsibility for any injury to people or property resulting from any ideas, methods, instructions or products referred to in the content. |
© 2023 by the authors. Licensee MDPI, Basel, Switzerland. This article is an open access article distributed under the terms and conditions of the Creative Commons Attribution (CC BY) license (https://creativecommons.org/licenses/by/4.0/).