Article

Prediction of Physical Properties and Phase Characteristics of Ethane and Ethane Mixture in the Ethane Pipeline

1
Research Institute of Natural Gas Technology, PetroChina Southwest Oil & Gasfield Company, Chengdu 610213, China
2
Petroleum Engineering School, Southwest Petroleum University, Chengdu 610500, China
3
School of Petroleum Engineering, Chongqing University of Science and Technology, Chongqing 401331, China
*
Author to whom correspondence should be addressed.
Processes 2023, 11(8), 2283; https://doi.org/10.3390/pr11082283
Submission received: 21 June 2023 / Revised: 12 July 2023 / Accepted: 17 July 2023 / Published: 29 July 2023

Abstract

:
In order to realize the safe transportation of liquefied ethane pipeline in the Oilfield of China, it is necessary to fully study the process of pipeline replacement, operation and shutdown. The accurate calculation of physical property parameters and critical parameters is the basis of studying the gas-liquid two-phase flow and heat and mass transfer process of liquefied ethane in the pipeline. In this paper, different equations of states (EOSs) were used to predict the physical properties (such as density, dew point and dynamic viscosity) of ethane or ethane mixture, and the predicted results were compared with the corresponding experimental data from the literature. The prediction performance of different EOSs were evaluated by using two evaluation indicators, including average absolute deviation (AAD) and average relative deviation (ARD). The results showed that the PR-Peneloux EOS has the best performance for predicting the density of CH4-C2H6-N2 mixture with an ARD value of 4.46%; for predicting the dew point, the BWRS EOS exhibits the superior performance with an ARD value of 0.58%; and for predicting dynamic viscosity, the SuperTRAPP formula has the smallest calculation error, with an ARD value of 1.33%. Considering the comparison results of the calculation accuracy of density, dew point and dynamic viscosity of ethane or ethane mixture by using different EOSs, PR-Peneloux EOS was recommended to calculate the phase characteristics in the process of ethane pipeline replacement operation. The phase characteristics of ethane for pipeline transport in the oilfield of China were obtained. The critical temperature is 32.79℃ and the critical pressure is 4.97 MPa.

1. Introduction

Ethane (C2H6) is used as a raw material to produce ethylene, which is the most important basic raw material for the petrochemical industry [1,2,3,4]. It can be used to produce almost all chemical products with a critical pressure and critical temperature of 4.88 MPa and 32.25 ℃, respectively, which can be transported by a liquid phase or gas phase in pipelines. Compared with the gas phase ethane transportation method, the liquid phase ethane transportation method has the advantages of large transportation capacity and high economy [5,6,7]. Liquid phase ethane pipelines have been built in some countries [8,9,10]. In China, Petrochina Company proposes to transport ethane by means of liquefaction, and plans to build a long-distance ethane pipeline. Since the liquefied ethane is a saturated liquid in the pipeline, it is easy to vaporize due to external temperature disturbance or internal pressure fluctuation, forming a two-phase flow in the pipeline, which is obviously different from the conventional crude oil and natural gas pipelines [11,12]. In addition, this can cause some transportation problems such as pipeline vibration, ultra-pressure and equipment damage. At present, the production process and methods for natural gas, refined oil, liquefied petroleum gas and other media cannot solve the technical problems of the liquid phase ethane transportation pipeline.
In order to realize the safe transportation of liquefied ethane pipelines, it is necessary to fully study the process of pipeline replacement, operation and shutdown. Pressure and temperature are the basis for the safe transportation of liquefied ethane pipelines. When the transportation pressure of liquefied ethane is lower than the critical pressure of commercial ethane or the temperature is higher than its critical temperature, vaporization of liquefied ethane in the pipeline will occur, which will endanger the safe transportation of the pipeline. The accurate calculation of ethane physical property parameters is the key factor to accurately predict the flow parameters of liquefied ethane pipelines, such as temperature, pressure and flow rate.
Commonly, the equation of state (EOS) is used to obtain the physical properties of pure gas or a mixture of gases. For example, PR EOS and GERG-2008 EOS were employed to calculate the bubble point of pure ethane, and the PR EOS showed a superior performance with an average deviation of 0.41% [13]. Later, GERG-2008 EOS was used to calculate the density of the mixture of propane and hydrogen with different mixed ratios, and the results also showed that the GERG-2008 EOS can effectively predict the density of the mixture gas [14]. In addition, Vitali et al. [15] employed GERG-2008 EOS to predict the vapor-liquid equilibrium and density of the CO2-rich mixture. A quantitative estimation was conducted, and the results showed that the GERG-2008 EOS was more accurate in the description of both vapor-liquid equilibrium and density when compared with cubic EOS. Except for the prediction of the bubble point, density and vapor-liquid equilibrium of the above gases, Seo et al. [16] used extended Redlich-Kwong-Peng-Robinson (eRK-PR) EOS to predict the thermodynamic properties of JP-10, which is an important fuel in the petroleum and aviation industries. The results showed that the eRK-PR EOS predicts the thermodynamic properties of JP-10 more accurately than the other EOSs. The above results show that EOS can be used to calculate the key physical parameters with good accuracy. However, the prediction performance of EOSs for the physical properties and phase characteristics of ethane mixture are still unclear. The accurate calculation of physical property parameters depends on the applicability of the EOS to the calculation of ethane parameters. In addition, the EOS is also the basis of the study of ethane phase characteristics, which determines the accuracy of the calculation of critical pressure and critical temperature of ethane, and further affects the safe replacement of the liquefied ethane pipeline into production, operation and shutdown.
This paper conducted relevant research to address the issues of inaccurate prediction accuracy of physical property parameters in CH4-C2H6-N2 mixture and unclear phase state change law during the replacement process of liquid-phase ethane pipeline. For the first time, seven EOSs (PR, PR-Peneloux and SRK) were evaluated based on experimental data for predicting density and dew point of CH4-C2H6-N2 mixture. In addition, LBC, Pedersen and Super TRAPP equations were also evaluated for predicting viscosity. Furthermore, utilizing the preferred equation of state, we were able to predict the physical property parameters of the mixture under varying concentration ratios, pressures and temperatures during the operation of the liquid ethane pipeline. Finally, the key physical property parameters of liquid ethane in relevant oil fields and the phase transition rules during pipeline operation are presented. The research findings provide a theoretical foundation for safe displacement operations of liquid-phase ethane pipelines and subsequent technical standards formulation for easily vaporized substance pipelines.

2. PVT EOSs Based on Thermodynamics

2.1. Cubic-Type PVT EOS

For the cubic-type PVT EOS, if the incompressibility of the liquid is considered, as V approaches some parameter b, P goes to infinity, and then the general cubic form of P is:
P = R T V b θ V η V 2 + δ V + ε
The parameters such as b , θ , η , δ and ε in Equation (1) can be constants including zero, or they can vary with temperature or composition. The values of common cubic-type PVT equation of state parameters are listed in Table 1 and Table 2.

2.2. Non-Cubic PVT EOS

(1)
BWRS EOS
Based on a large number of experimental data, Starling et al. [21] modified the BWR equation and proposed a BWRS equation with higher accuracy for predicting the thermodynamic parameters of various hydrocarbon mixtures, which is expressed as follows
P = ρ R T + A 0 R T B 0 C 0 T 2 + D 0 T 3 E 0 T 4 ρ 2 + b R T a d T ρ 3 + α α + d T ρ 6 + c ρ 3 T 2 1 + γ ρ 2 exp γ ρ 2
where P is pressure, Pa; T is pressure, K; ρ is density kg/m3; and R is the gas constant, 8.314 J/(mol·k). A0, B0, C0, D0, E0, a, b, c, d, α, γ are state parameters.
(2)
LKP EOS
On the basis of the multi-parameter BWRS EOS, LKP EOS was proposed [22], which can simultaneously calculate the fugacity coefficients of vapor-liquid two-phase
Z = Z 0 + ω ω r Z r Z 0
Z = p r V r T r = 1 + B V r + C V r 2 + D V r 5 + c 4 T r 3 V r 2 β + γ V r 2 exp γ V r 2
where z is compression factor; T is eccentricity factor; p r is pressure ratio; V r is molar volume ratio; T r is temperature ratio; the superscript “0” is a simple fluid parameter; and the superscript “R” is the reference fluid parameter.
(3)
GERG-2008 EOS
The GERG-2008 EOS is also used as a standard to calculate the thermodynamic properties of natural gas. GERG-2008 EOS is generally expressed by Helmholtz free energy, which are given by [23]
α ρ , T , X ¯ = α 0 ρ , T , X ¯ + α r ρ , T , X ¯
α 0 ( ρ , T , X ¯ ) = i = 1 N X i α 0 i 0 ( ρ , T ) + L n ( X i )
α r ( δ , τ , X ¯ ) = α 0 r ( δ , τ , X ¯ ) + Δ α r ( δ , τ , X ¯ )
where X ¯ is the molar fraction of each component in the mixture, %; δ is density variable; and τ is temperature variable.
The above EOS adopts the Van der Waals mixing rule when analyzing and calculating the physical properties of the gas mixture. Considering that non-polar molecules (such as, water) are involved in the process of replacing N2 with ethane in the liquid phase, the whole system is in a non-polar system. Therefore, the Van der Waals mixing rule can be used for correlation analysis and the calculation of the physical properties of the mixed gas. For hydrocarbon mixture systems, Van der Waals mixing rules are generally used to calculate the gravitational parameters and volume terms, which are given by [24]:
a m = i = 1 n j = 1 n z i z j ( a i a j ) 0.5 ( 1 k i j )
b m = i = 1 n z i b i
The RK equation can obtain a certain degree of accuracy when calculating the heat capacity of pure components and mixtures, but the accuracy of the RK equation is often not ideal when considering the calculation of multi-component gas-liquid equilibrium. In addition, the American Gas Association (AGA) proposed the AgA8-92DC equation to calculate the compressibility coefficient of natural gas (namely, AGA8 equation), but this equation is mainly applicable to the calculation condition of methane content being not less than 70% and the temperature being higher than −10 ℃. Therefore, RK equation and AGA8 equation are not considered in the calculation of this paper. The CPA equation of state is also often used to complete the physical property calculation, but is no different from the SRK equation of state in the calculation of non-polar molecules such as CH4, C2H6 and N2, so it is not considered separately.
In summary, it is preliminarily concluded that SRK, PR, BWRS, LKP and GREG2008 EOS can be used to calculate the phase characteristics of C2H6 and C2H6-N2 mixed component gases. Next, the applicability and accuracy of each equation of state for mixed gases will be further explored, thus laying a foundation for the next phase characteristics research.

3. EOS Evaluation for Predicting Physical Properties

To evaluate the calculation accuracy of each EOS on the physical properties of liquid ethane, it is necessary to calculate the data of different physical properties, such as density and viscosity, dew point, etc. and compared with the corresponding experimental data, so as to select the most accurate equation of state and lay the foundation for the subsequent research on the phase characteristic of ethane. Based on the above considerations, in order to quantitatively analyze the prediction accuracy of each equation of state, some commonly used model evaluation parameters, such as average absolute deviation (AAD) and average relative deviation (ARD), are defined as follows
A A D = 1 N i = 1 N y i cal y i exp        
A R D = 1 N i = 1 N y i cal y i exp y i exp × 100 %    
where N is the total number of the data samples; y i cal and y i exp represent the calculated value and experimental data, respectively. The smaller the calculated values of AAD and ARD, the better the prediction performance of the EOSs.

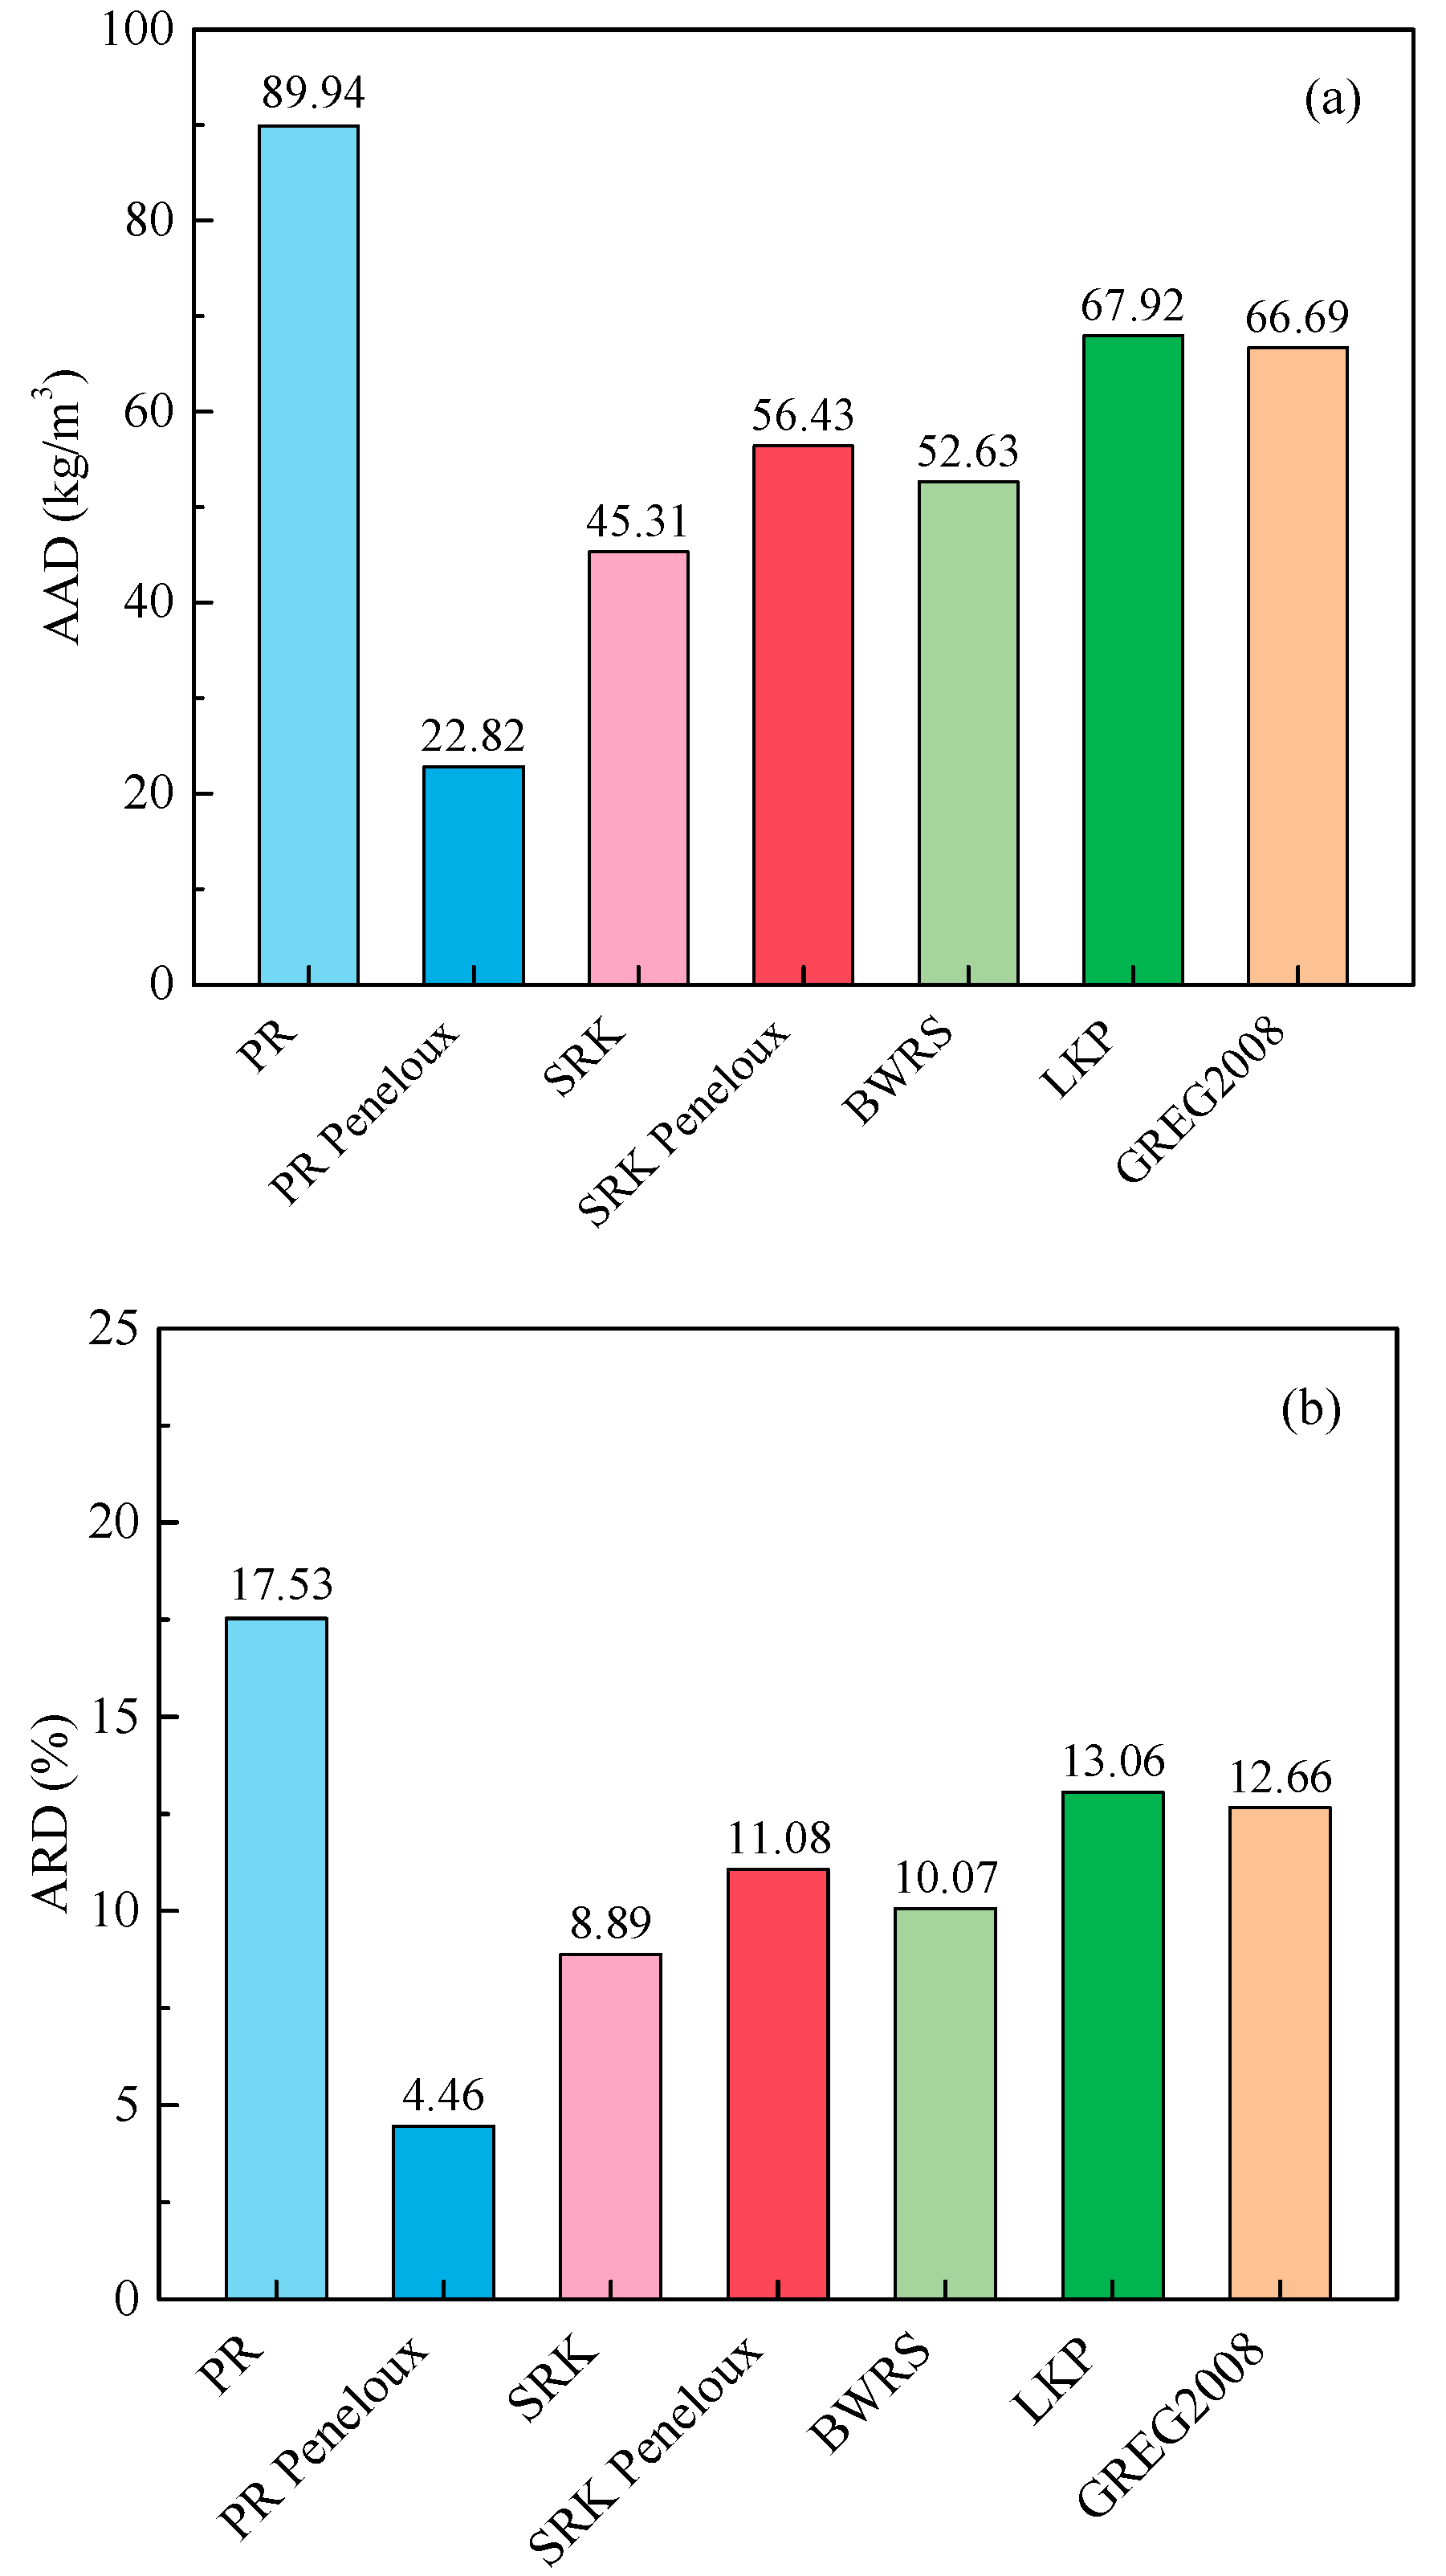
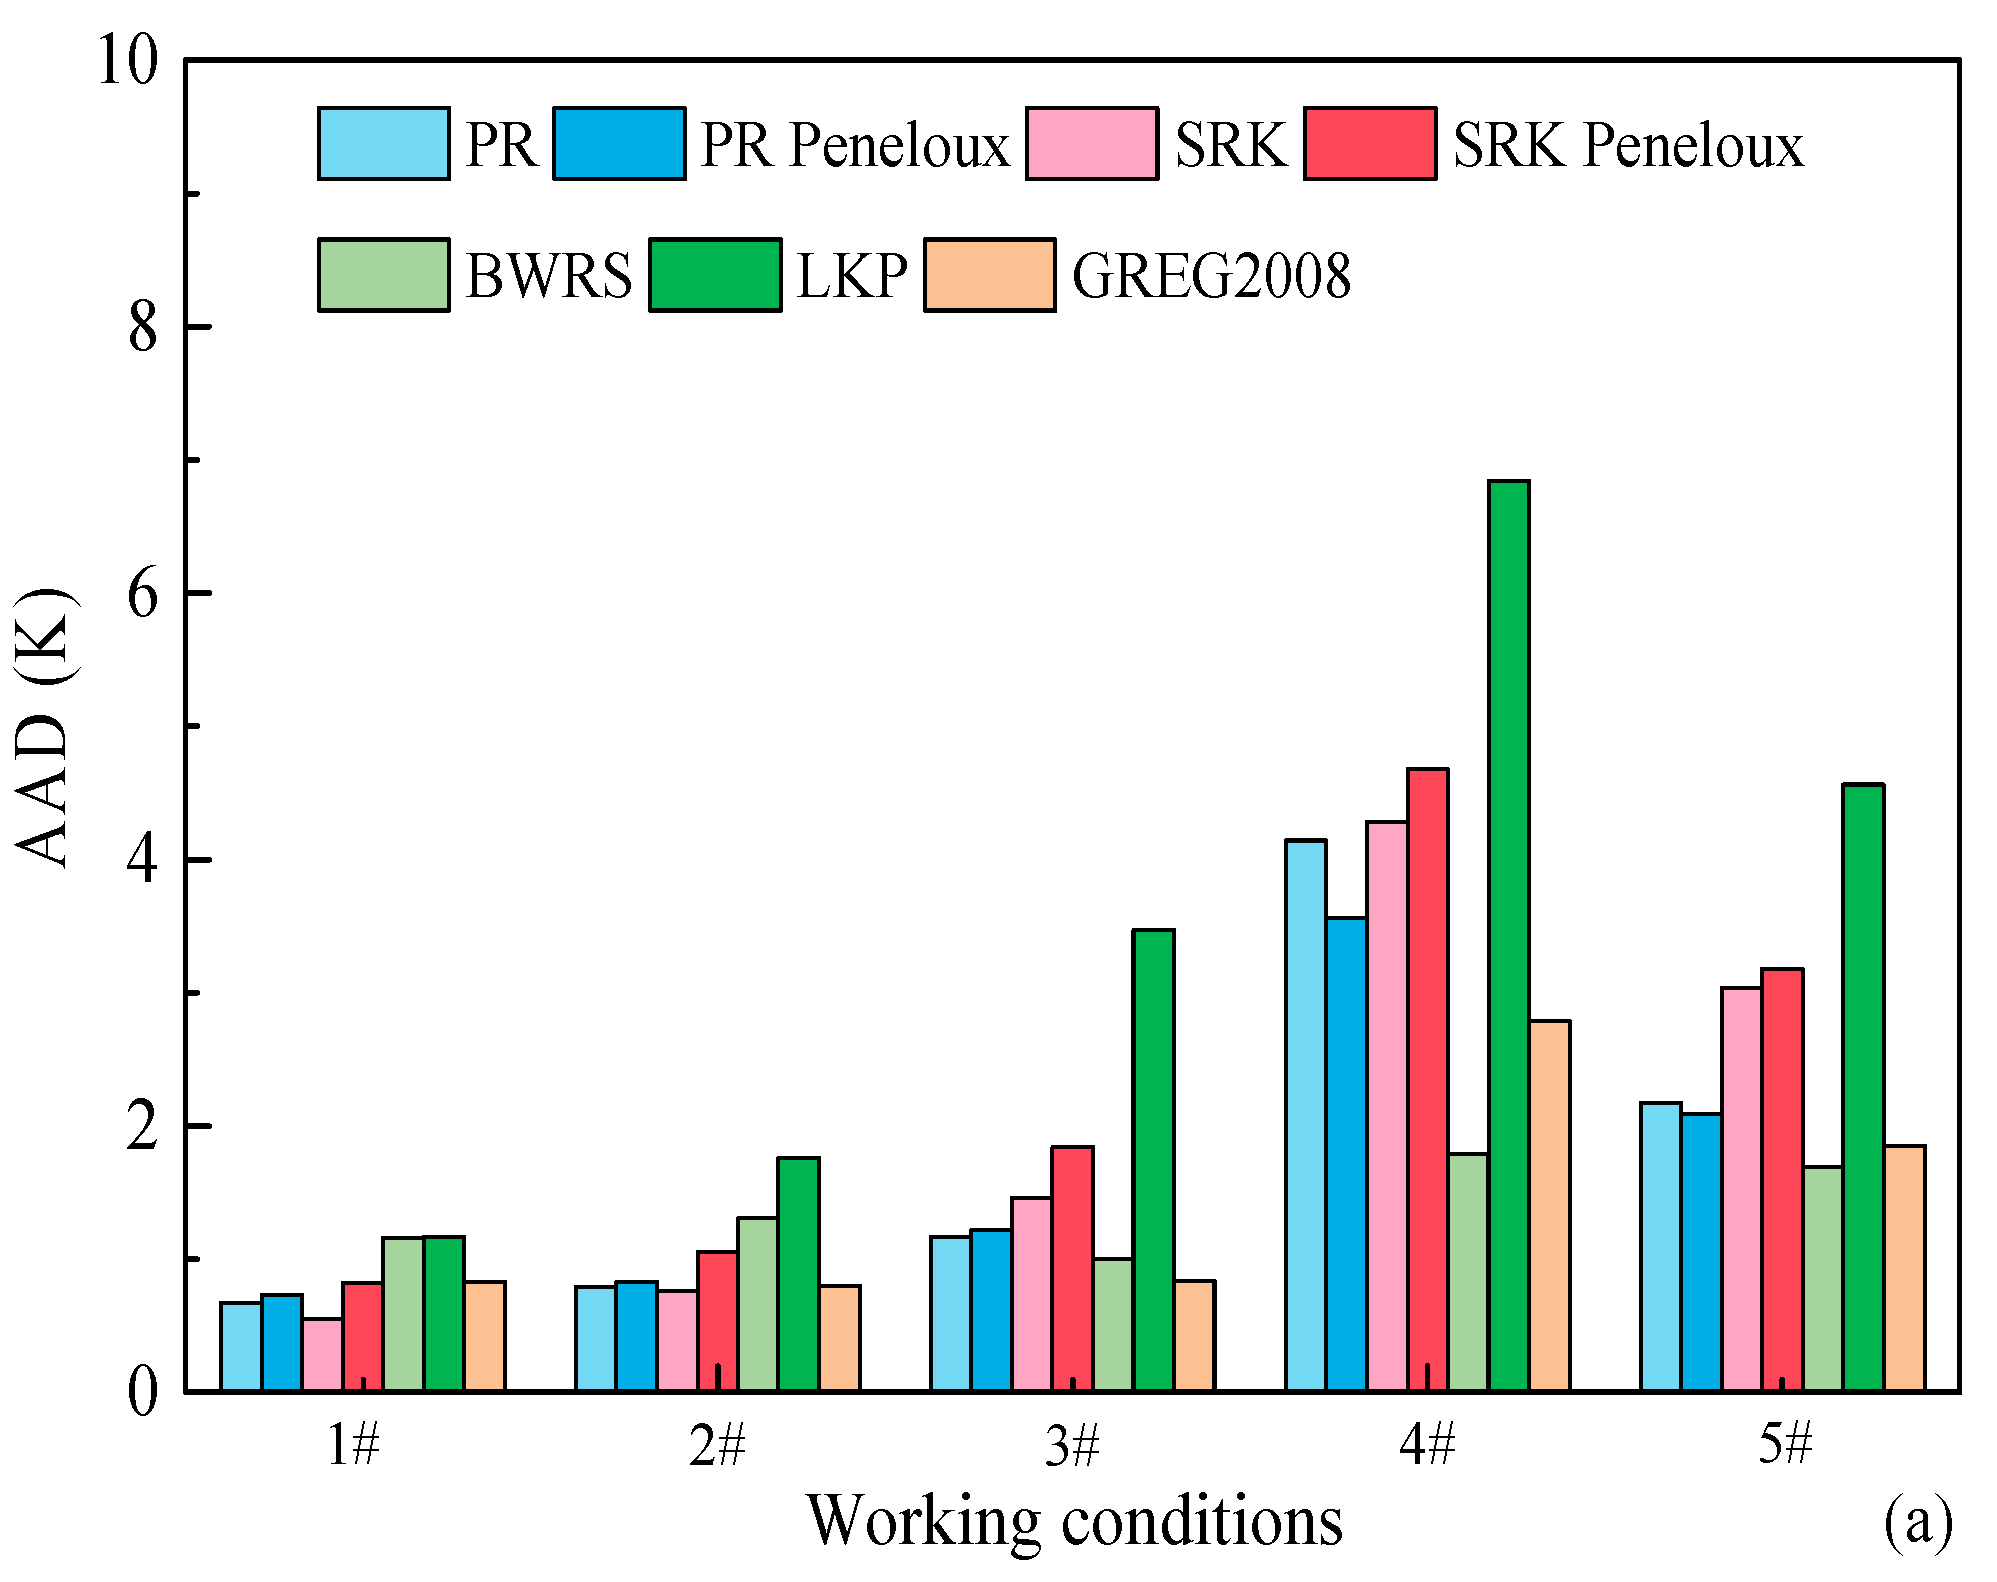
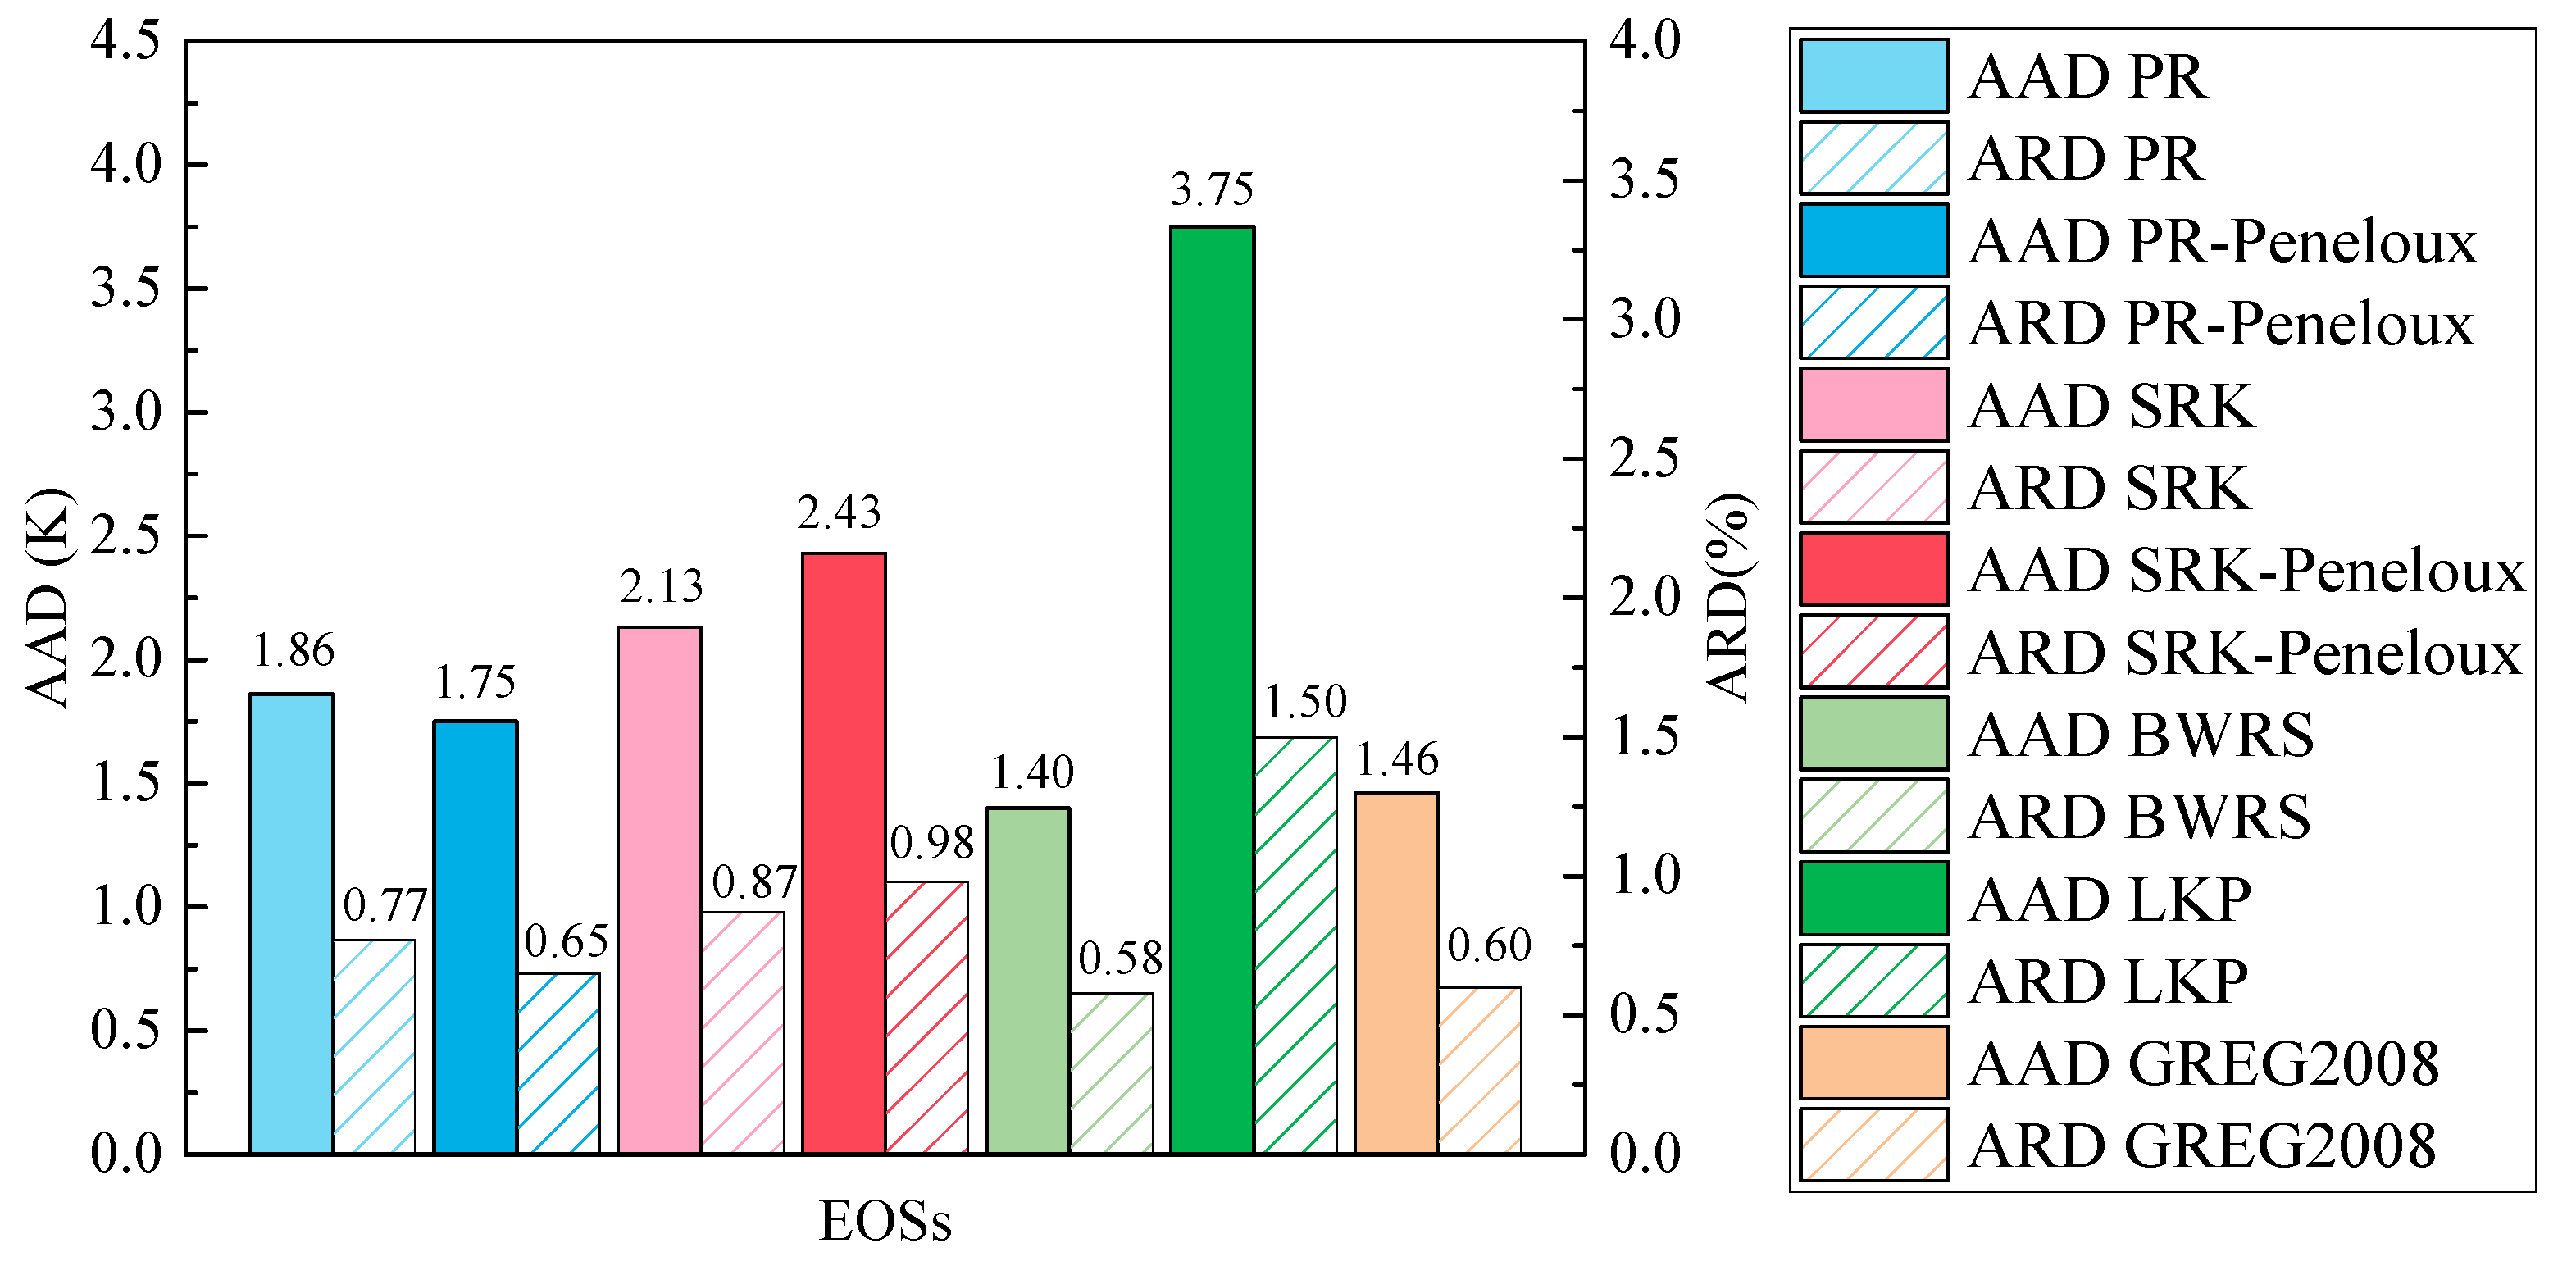
3.1. Evaluation of EOSs for Predicting Density

In this study, the empirical formula, PR EOS, PR-Peneloux EOS, SRK EOS, SRK-Peneloux EOS, BWRS EOS, LKP EOS, GREG-2008 EOS are used to predict the density of the CH4-C2H6-N2 mixture. The calculation accuracy of the density of the CH4-C2H6-N2 mixture is validated and analyzed. Experimental data of different mixed concentrations of CH4-C2H6-N2 mixture under different pressure and temperature conditions are derived from Funke’s work, and it is employed to validate the calculation results of the above empirical formulas. The density data of CH4-C2H6-N2 mixture under different temperatures, pressures and molar concentrations in the experiments by Funke et al. [25] is used in this work, which is listed in Table 3.
It can be clearly seen from Table 1 that the concentration of C2H6 plays a leading role in the density change of the CH4-C2H6-N2 mixture. The higher the concentration of C2H6, the higher the density of the CH4-C2H6-N2 mixture. In addition, it can be found that when the pressure and temperature are constant, the density of the CH4-C2H6-N2 mixture increases by 1.48% for every 1% increase in the C2H6 concentration. The density increase of the CH4-C2H6-N2 mixture is mainly because the density of C2H6 is higher than that of CH4 and N2 (under standard conditions, the density of C2H6 is 1.356 kg/m³, the density of CH4 is 0.717 kg/m³ and the density of N2 is 1.251 kg/m³). Therefore, when the pressure and temperature are constant or the range of change is low, the density of CH4-C2H6-N2 mixture is shown to increase with the increase of the concentration of C2H6.
The density of CH4-C2H6-N2 mixture of twenty samples in Table 3 are calculated using PR EOS, PR-Peneloux EOS, SRK EOS, SRK-Peneloux EOS, BWRS EOS, LKP EOS and GREG-2008 EOS at different experimental temperatures, pressures and molar concentrations. The empirical formulas were used to calculate the mixture density, and the results were compared with experimental data from Funke et al. [25], as shown in Figure 1. It can be found that the calculated value of density of CH4-C2H6-N2 mixture using different empirical formula possess different accuracies. Furthermore, it also can be seen that in most working conditions (temperature in the range of −179~−181 °C, pressure in the range of 0.1~1.1 MPa), the prediction of density of the CH4-C2H6-N2 mixture by the above empirical formulas have a certain degree of accuracy.
In order to further evaluate the calculation accuracy of the above empirical formulas, the AAD and ARD are calculated and analyzed, as shown in Figure 1. It can be clearly seen from Figure 2a that the value of AAD for predicting the density of CH4-C2H6-N2 mixture by PR EOS, PR-Peneloux EOS, SRK EOS, SRK-Peneloux EOS, BWRS EOS, LKP EOS and GREG-2008 EOS are 89.94, 22.82, 45.31, 56.43, 52.63, 67.92 and 66.69, respectively. Obviously, the PR EOS has the worst performance for predicting the density of CH4-C2H6-N2 mixture; this is because the gas to be calculated is a mixture of ethane, methane and N2, and the coefficient a, reflecting the attraction between different molecules, and the coefficient b, reflecting the repulsive force in the PR EOS, are out of alignment when calculating the density parameters of the mixed components, resulting in the density values calculated by the PR EOS all being higher than the corresponding experimental values.
On the contrary, the PR-Peneloux EOS has the best performance for predicting the density of CH4-C2H6-N2 mixture. This is because compared with the PR EOS, the volume translation coefficient c is introduced into the PR-Peneloux EOS, which can further modify the characteristic parameters in the equation and improve the accuracy of density calculation of the PR EOS in the low temperature liquid state. Figure 2b shows the ARD of the density of CH4-C2H6-N2 mixture using the empirical formula, PR EOS, PR-Peneloux EOS, SRK EOS, SRK-Peneloux EOS, BWRS EOS, LKP EOS and GREG-2008 EOS compared with the experimental data. It can be found that the value of ARD for all EOSs is less than 20%. This illustrates that the PR EOS, PR-Peneloux EOS, SRK EOS, SRK-Peneloux EOS, BWRS EOS, LKP EOS and GREG-2008 EOS are capable of accurately predicting the density of CH4-C2H6-N2 mixture in the conditions of −179~−181 °C and 0.1~1.1 MPa. PR-Peneloux EOS can give the best prediction of the density of CH4-C2H6-N2 mixture with an ARD of 4.46%, which is smaller than 8.89% of SRK EOS, 10.07% of BWRS EOS, 11.08% of SRK-Peneloux EOS, 12.66% of GREG-2008 EOS, 13.06% of LKP EOS and 17.5% of PR EOS.
Based on the above analysis, we can draw the conclusion that the above EOSs can efficiency predict the density of CH4-C2H6-N2 mixture and the prediction accuracy is in the order of PR-Peneloux EOS > SRK EOS > BWRS EOS > SRK-Peneloux EOS > GREG-2008 EOS > LKP EOS > PR EOS.

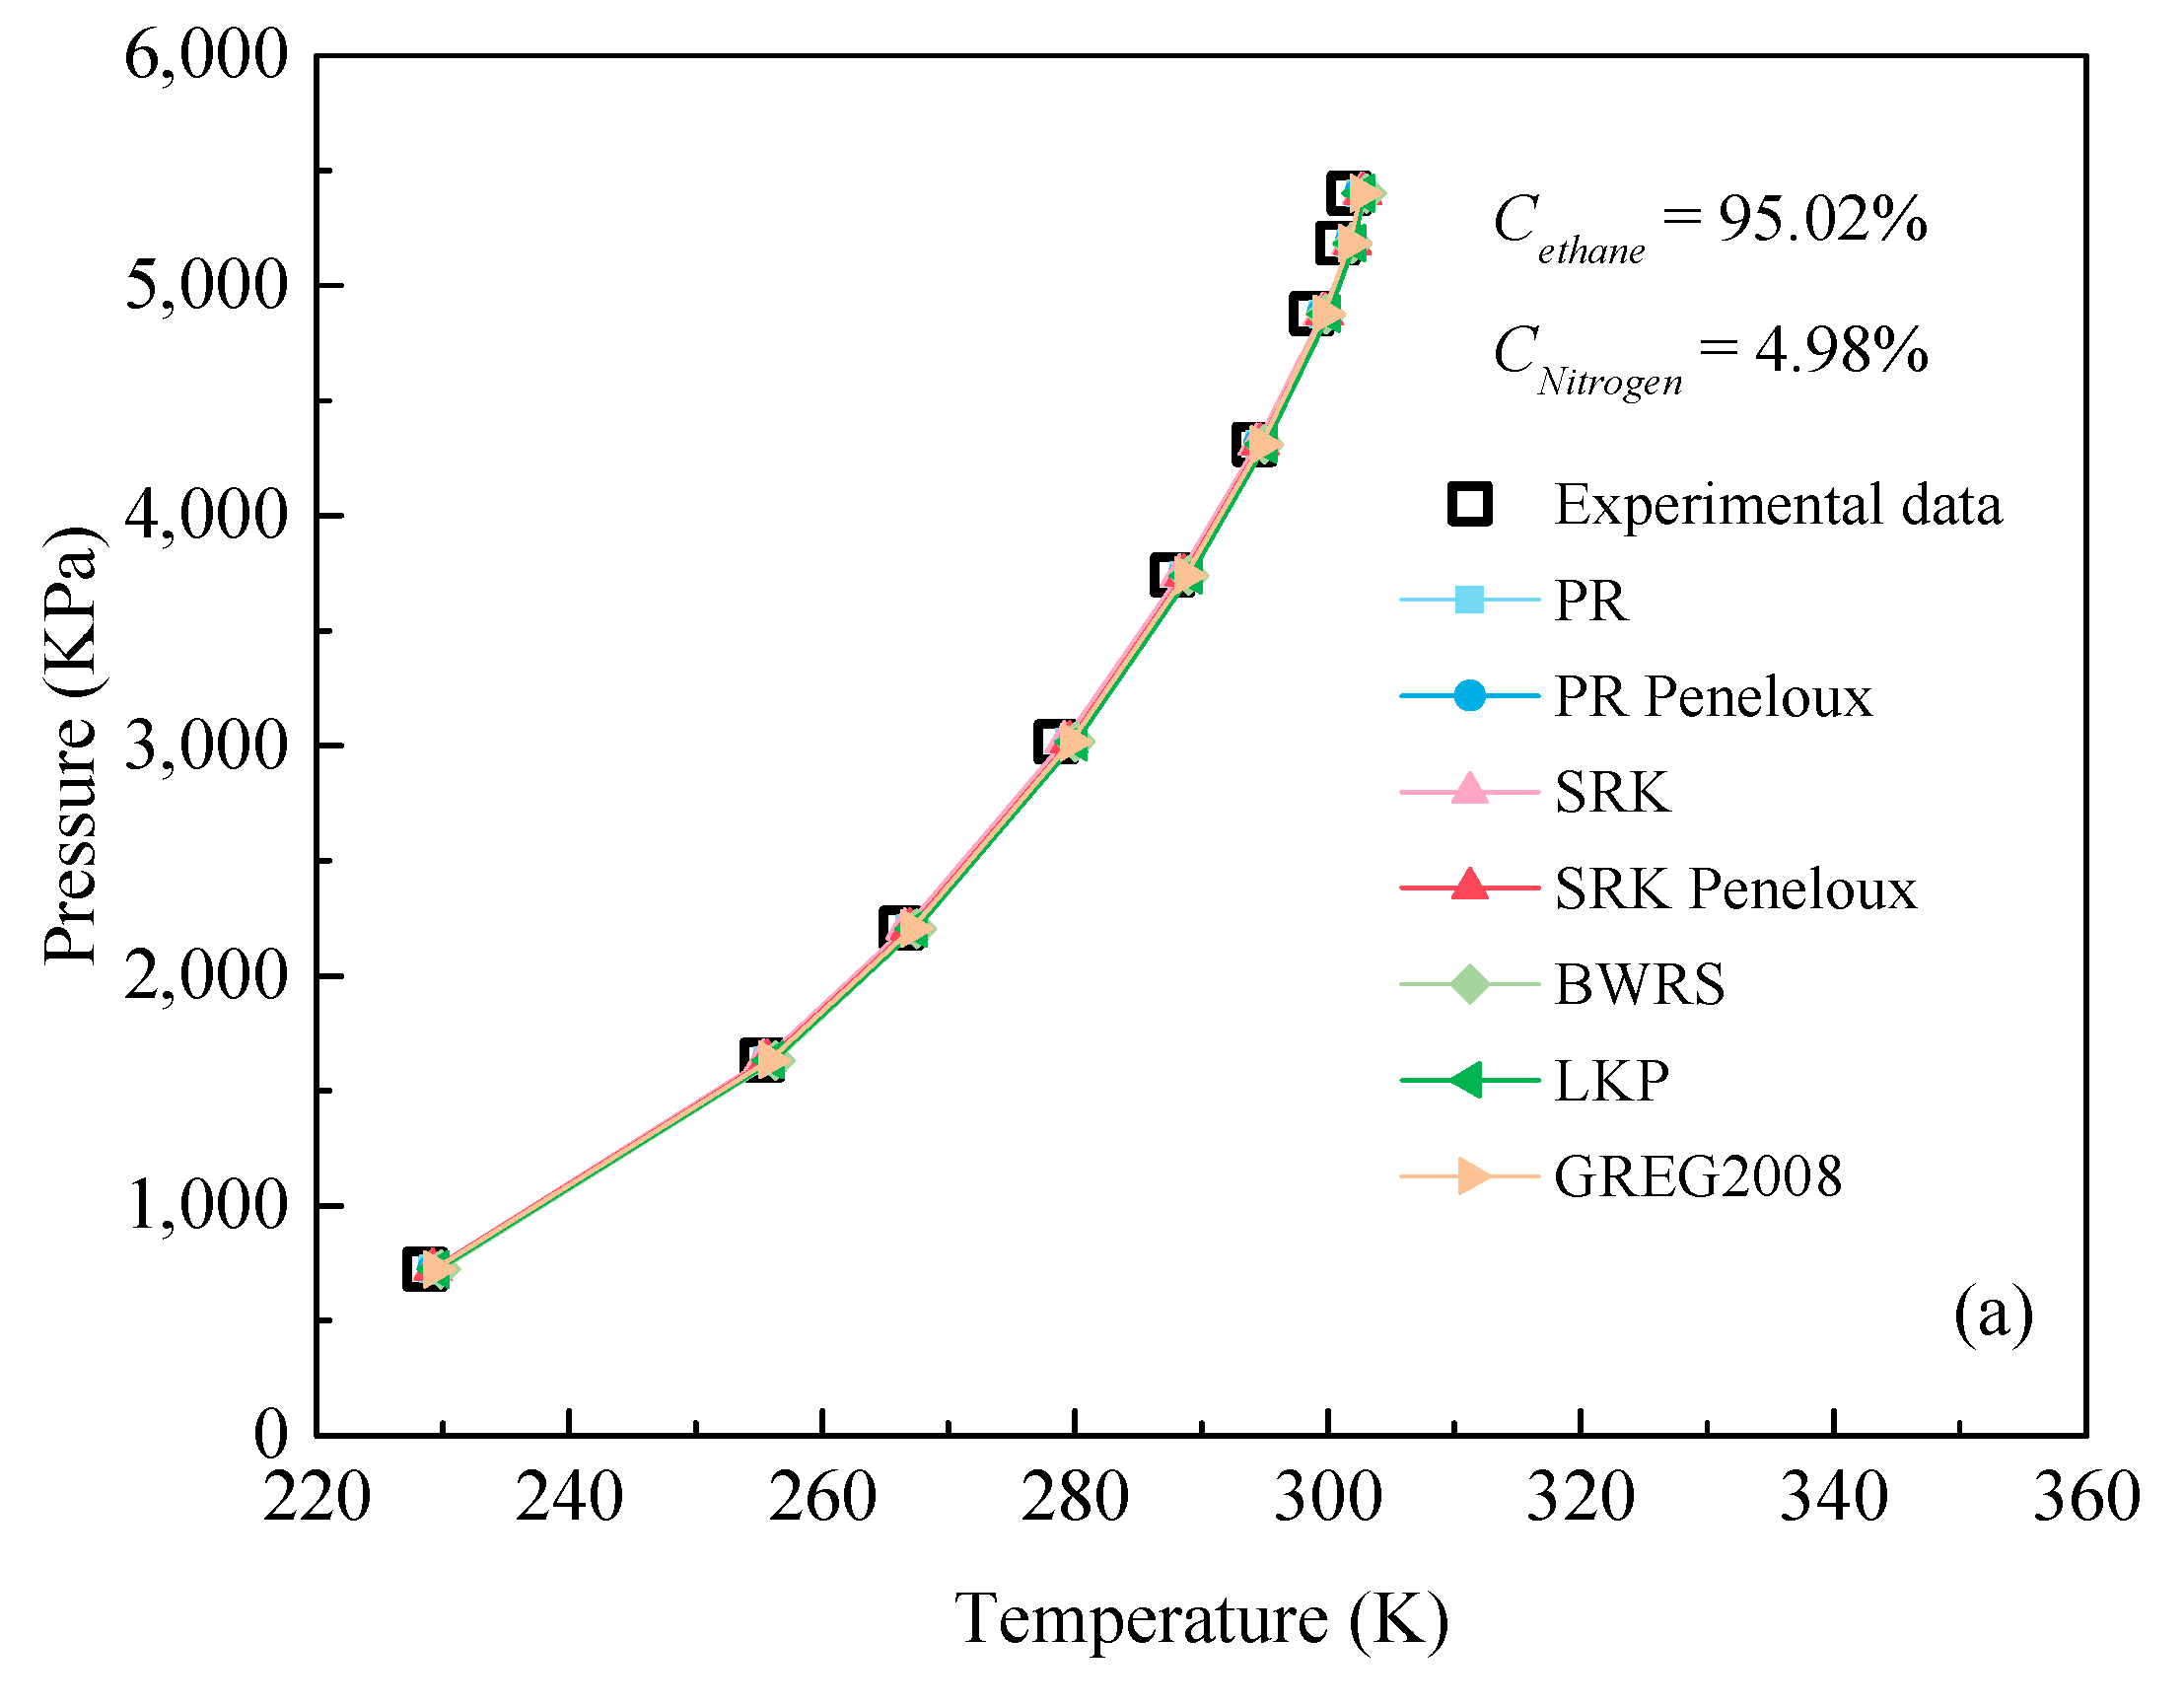
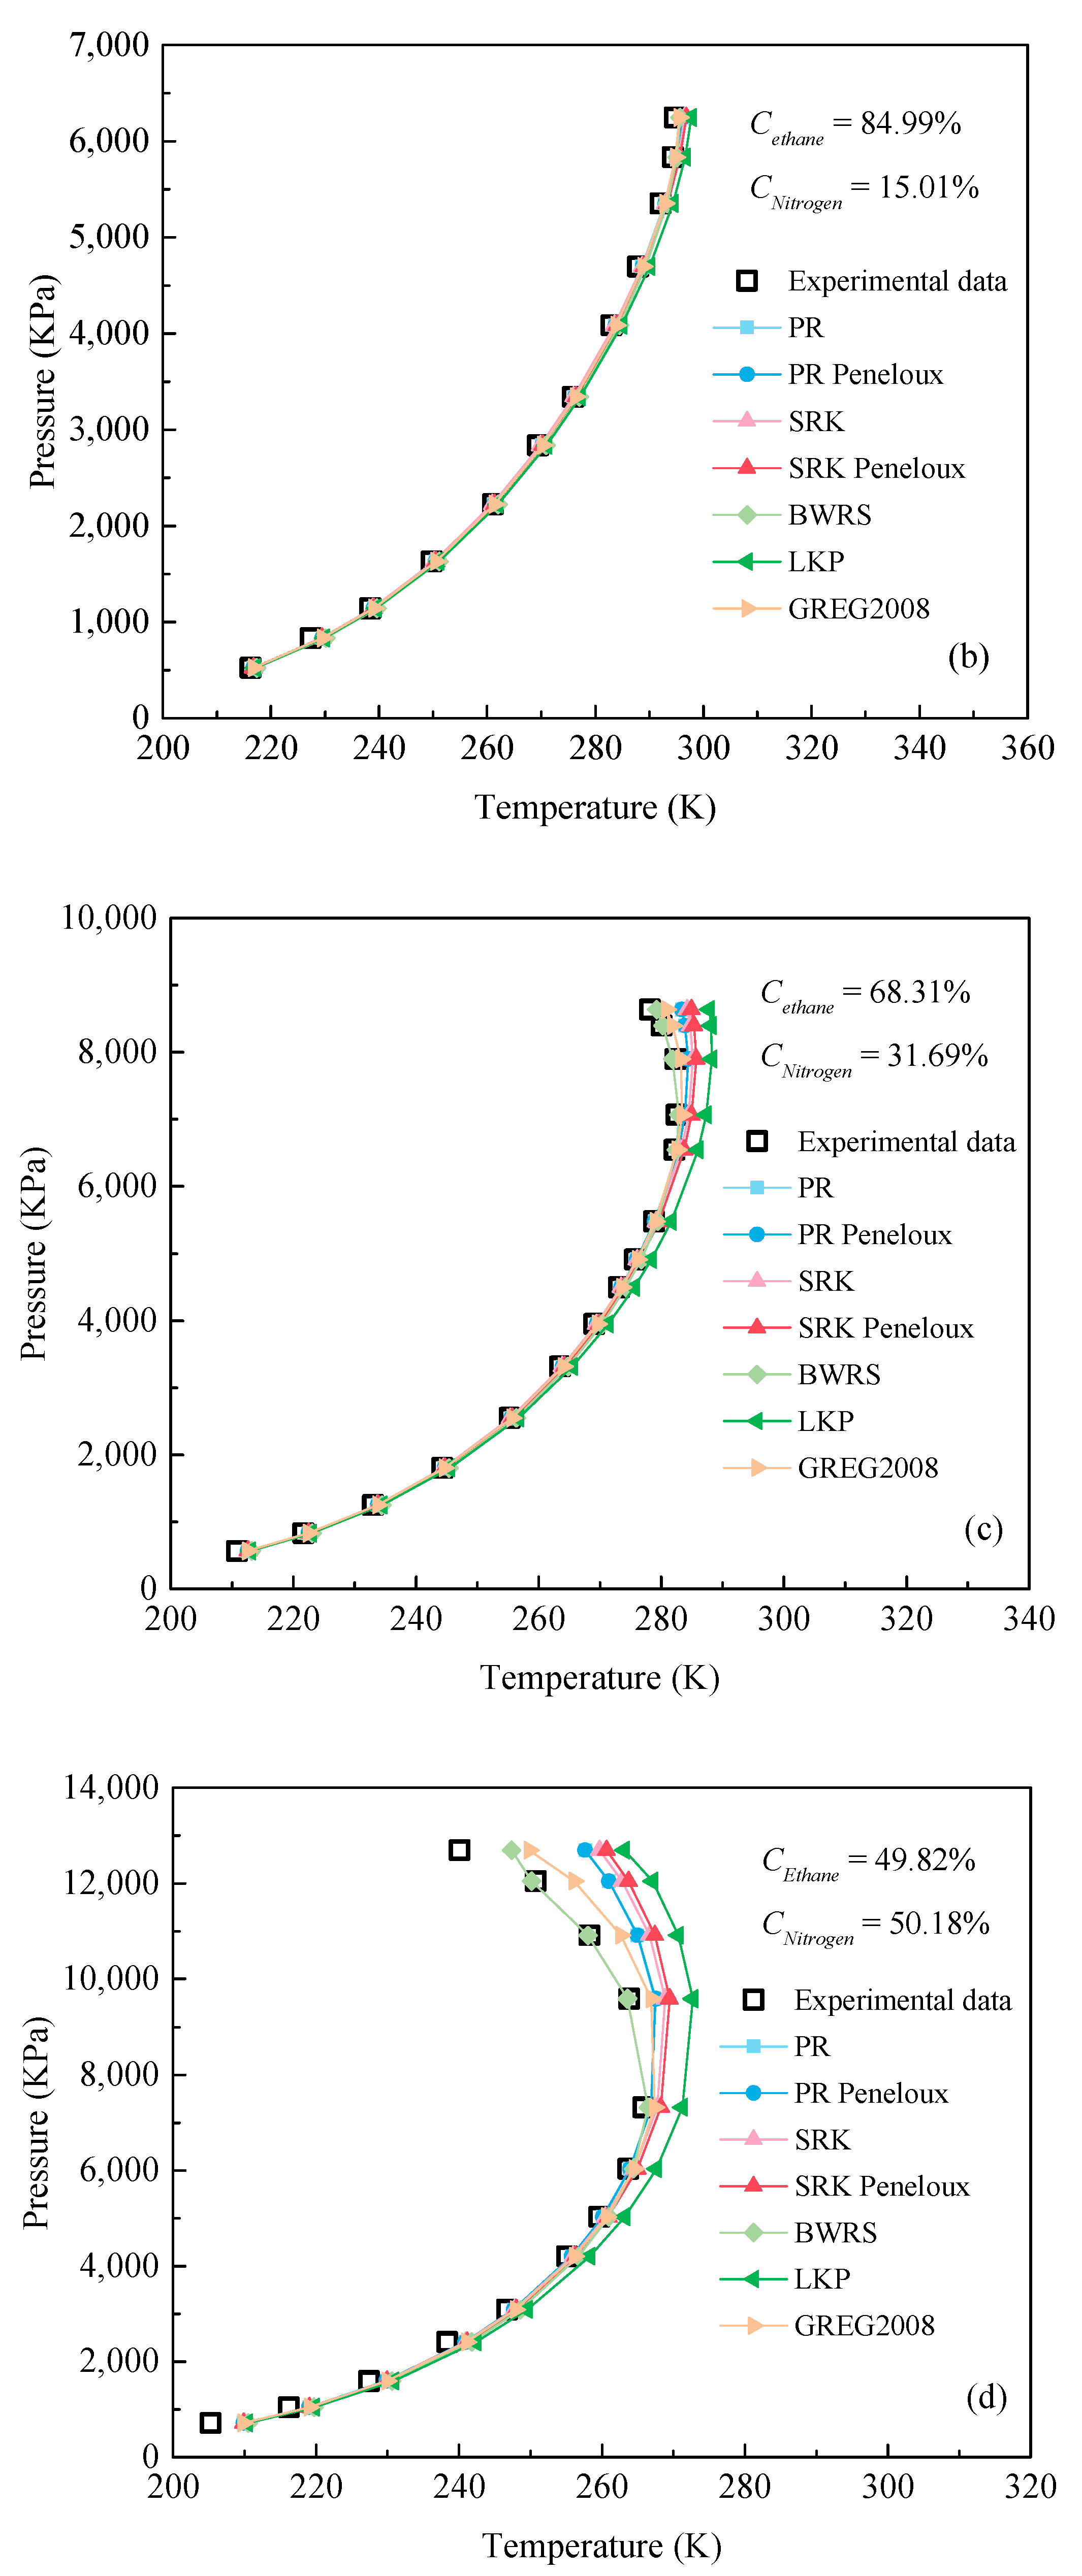
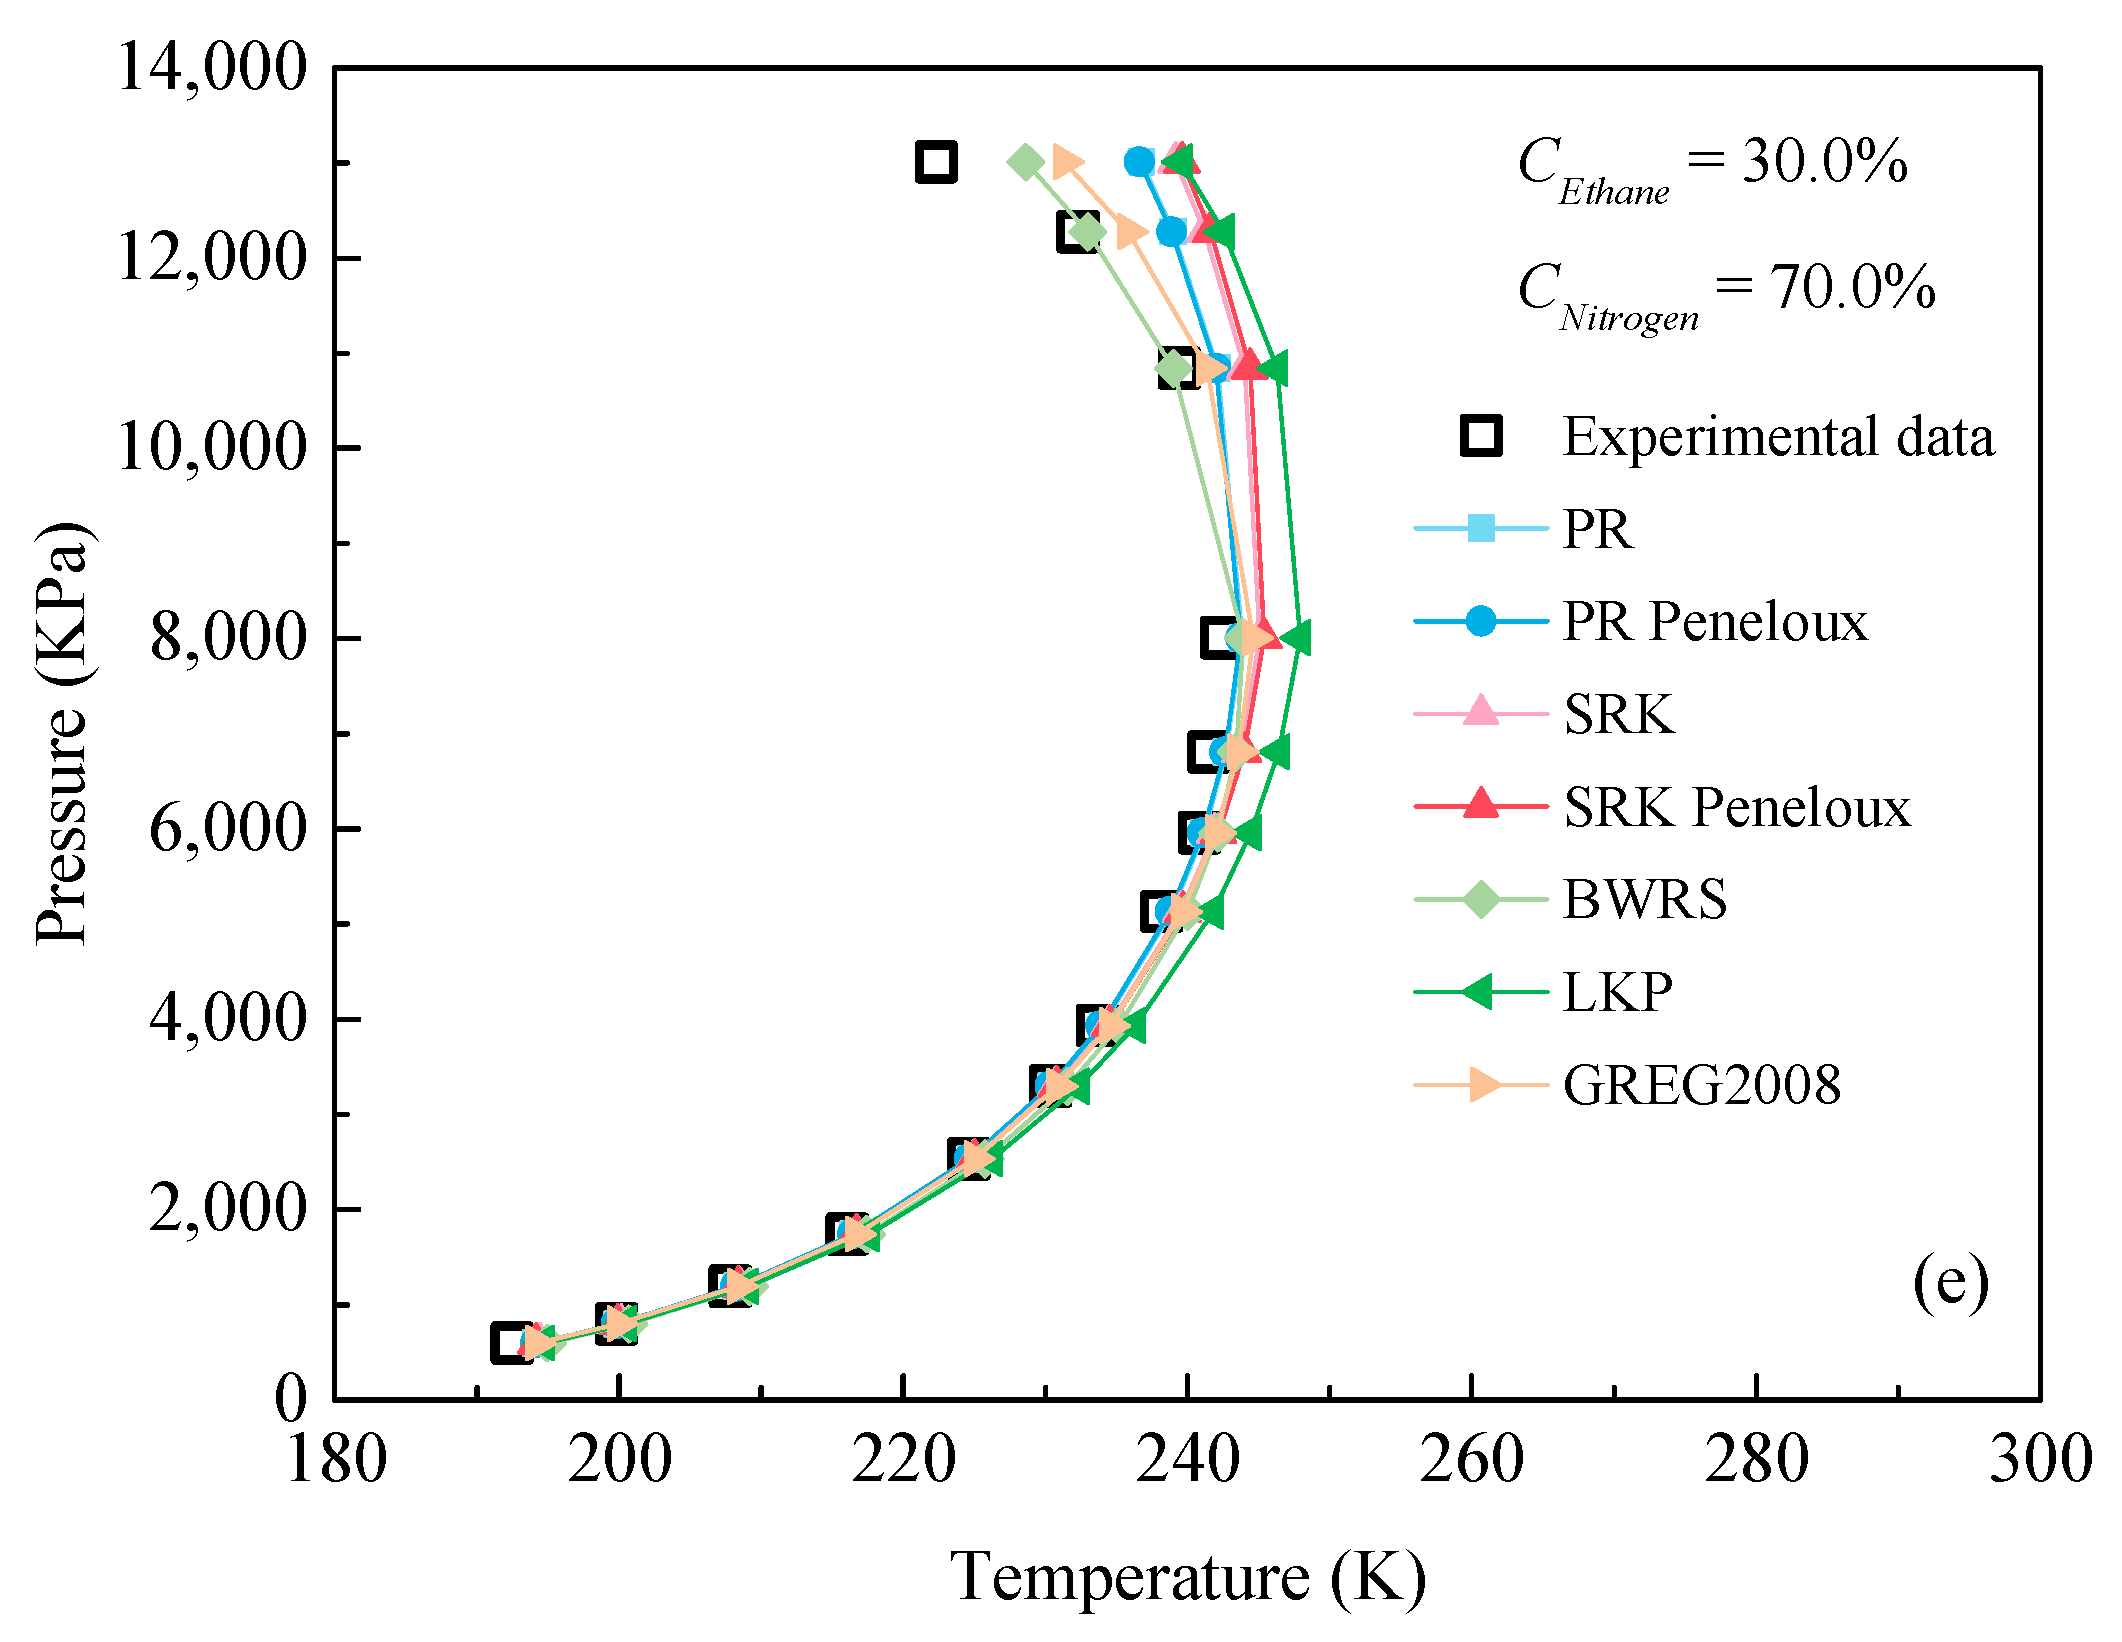
3.2. Evaluation of EOSs for Predicting Dew Point

The phase state envelope diagram of C2H6-N2 mixed components is composed of a dew point curve and bubble point curve, which is an important basis for analyzing and judging the phase state of C2H6, N2 and C2H6-N2 mixed components. The experimental data of dew point of ethane-N2 mixed components by Bier et al. [26] and Syed et al. [27] are collected, which can be divided into 5 groups with 64 sets of data of different temperatures and pressure working conditions, as shown in Table 4. In the same way, these experimental data are used to validate the calculation results of the EOSs.
Figure 3 shows the comparison of dew point of C2H6-N2 mixture between experimental data and calculation results by different EOSs under different working conditions (pressure: 0.52~13.01 MPa, temperature 192.52~301.7 K). Obviously, all the predicted values of all EOSs almost coincide with the corresponding experimental data when the concentration of ethane is higher than 84%, as shown in Figure 3a,b. However, with the continuous decrease of ethane concentration (ranging from 49.82% to 84.99%), some deviations between the predicted values of the EOSs and the experimental data began to appear, and the smaller the concentration of ethane, the greater the deviation, as shown in Figure 3c,d. However, when the concentration of ethane is lower 49.82%, the deviation between the predicted value and the experimental value of the equation of state begins to decrease. In addition, it also can be found from Figure 3 that BWRS EOS can accurately predict the dew point value of C2H6-N2 mixture for all ethane and N2 mixed ratios.
To better evaluate the performance of EOSs for predicting the dew point of C2H6-N2 mixture, the AAD and ARD of different EOSs are calculated, as shown in Figure 4. From Figure 4, it is seen that the AAD and ARD values of SRK EOS are the smallest among all EOSs under the working conditions of 1# ( C C 2 H 6 =95.02, C N 2 = 4.98 ) and 2# ( C C 2 H 6 =84.99, C N 2 = 15.01 ). This illustrates that the SRK EOS has the best performance for predicting the dew point of C2H6-N2 mixture with a higher concentration of C2H6 (>84.99%). However, when the concentration of C2H6 is less than 84.99%, the AAD and ARD values of BWRS EOS are the smallest among all EOSs. That is to say, the BWRS EOS has the best calculation accuracy for dew point of C2H6-N2 mixture under the above conditions.
In order to select the optimal EOS applicable to all working conditions, the values of AAD and ARD under above five working conditions are averaged again, as shown in Figure 5. Obviously, the average AAD and ARD values of BWRS EOS are the smallest, with values of 1.40 and 0.58%, respectively. Namely, the BWRS EOS has the best performance for predicting the dew point of C2H6-N2 mixture regardless of the mixed ratio of C2H6 and N2. On the contrary, the LKP EOS exhibits the worst performance for predicting the dew point of C2H6-N2 mixture, and the corresponding values of AAD and ARD are 3.75 and 1.50%, respectively. The reason for this is that in the process of calculating the dew point of C2H6-N2 mixture, the mixing rule used in the LKP EOS to calculate the multi-comp virtual critical parameters has a deviation, which lead to a large deviation in the LKP EOS.

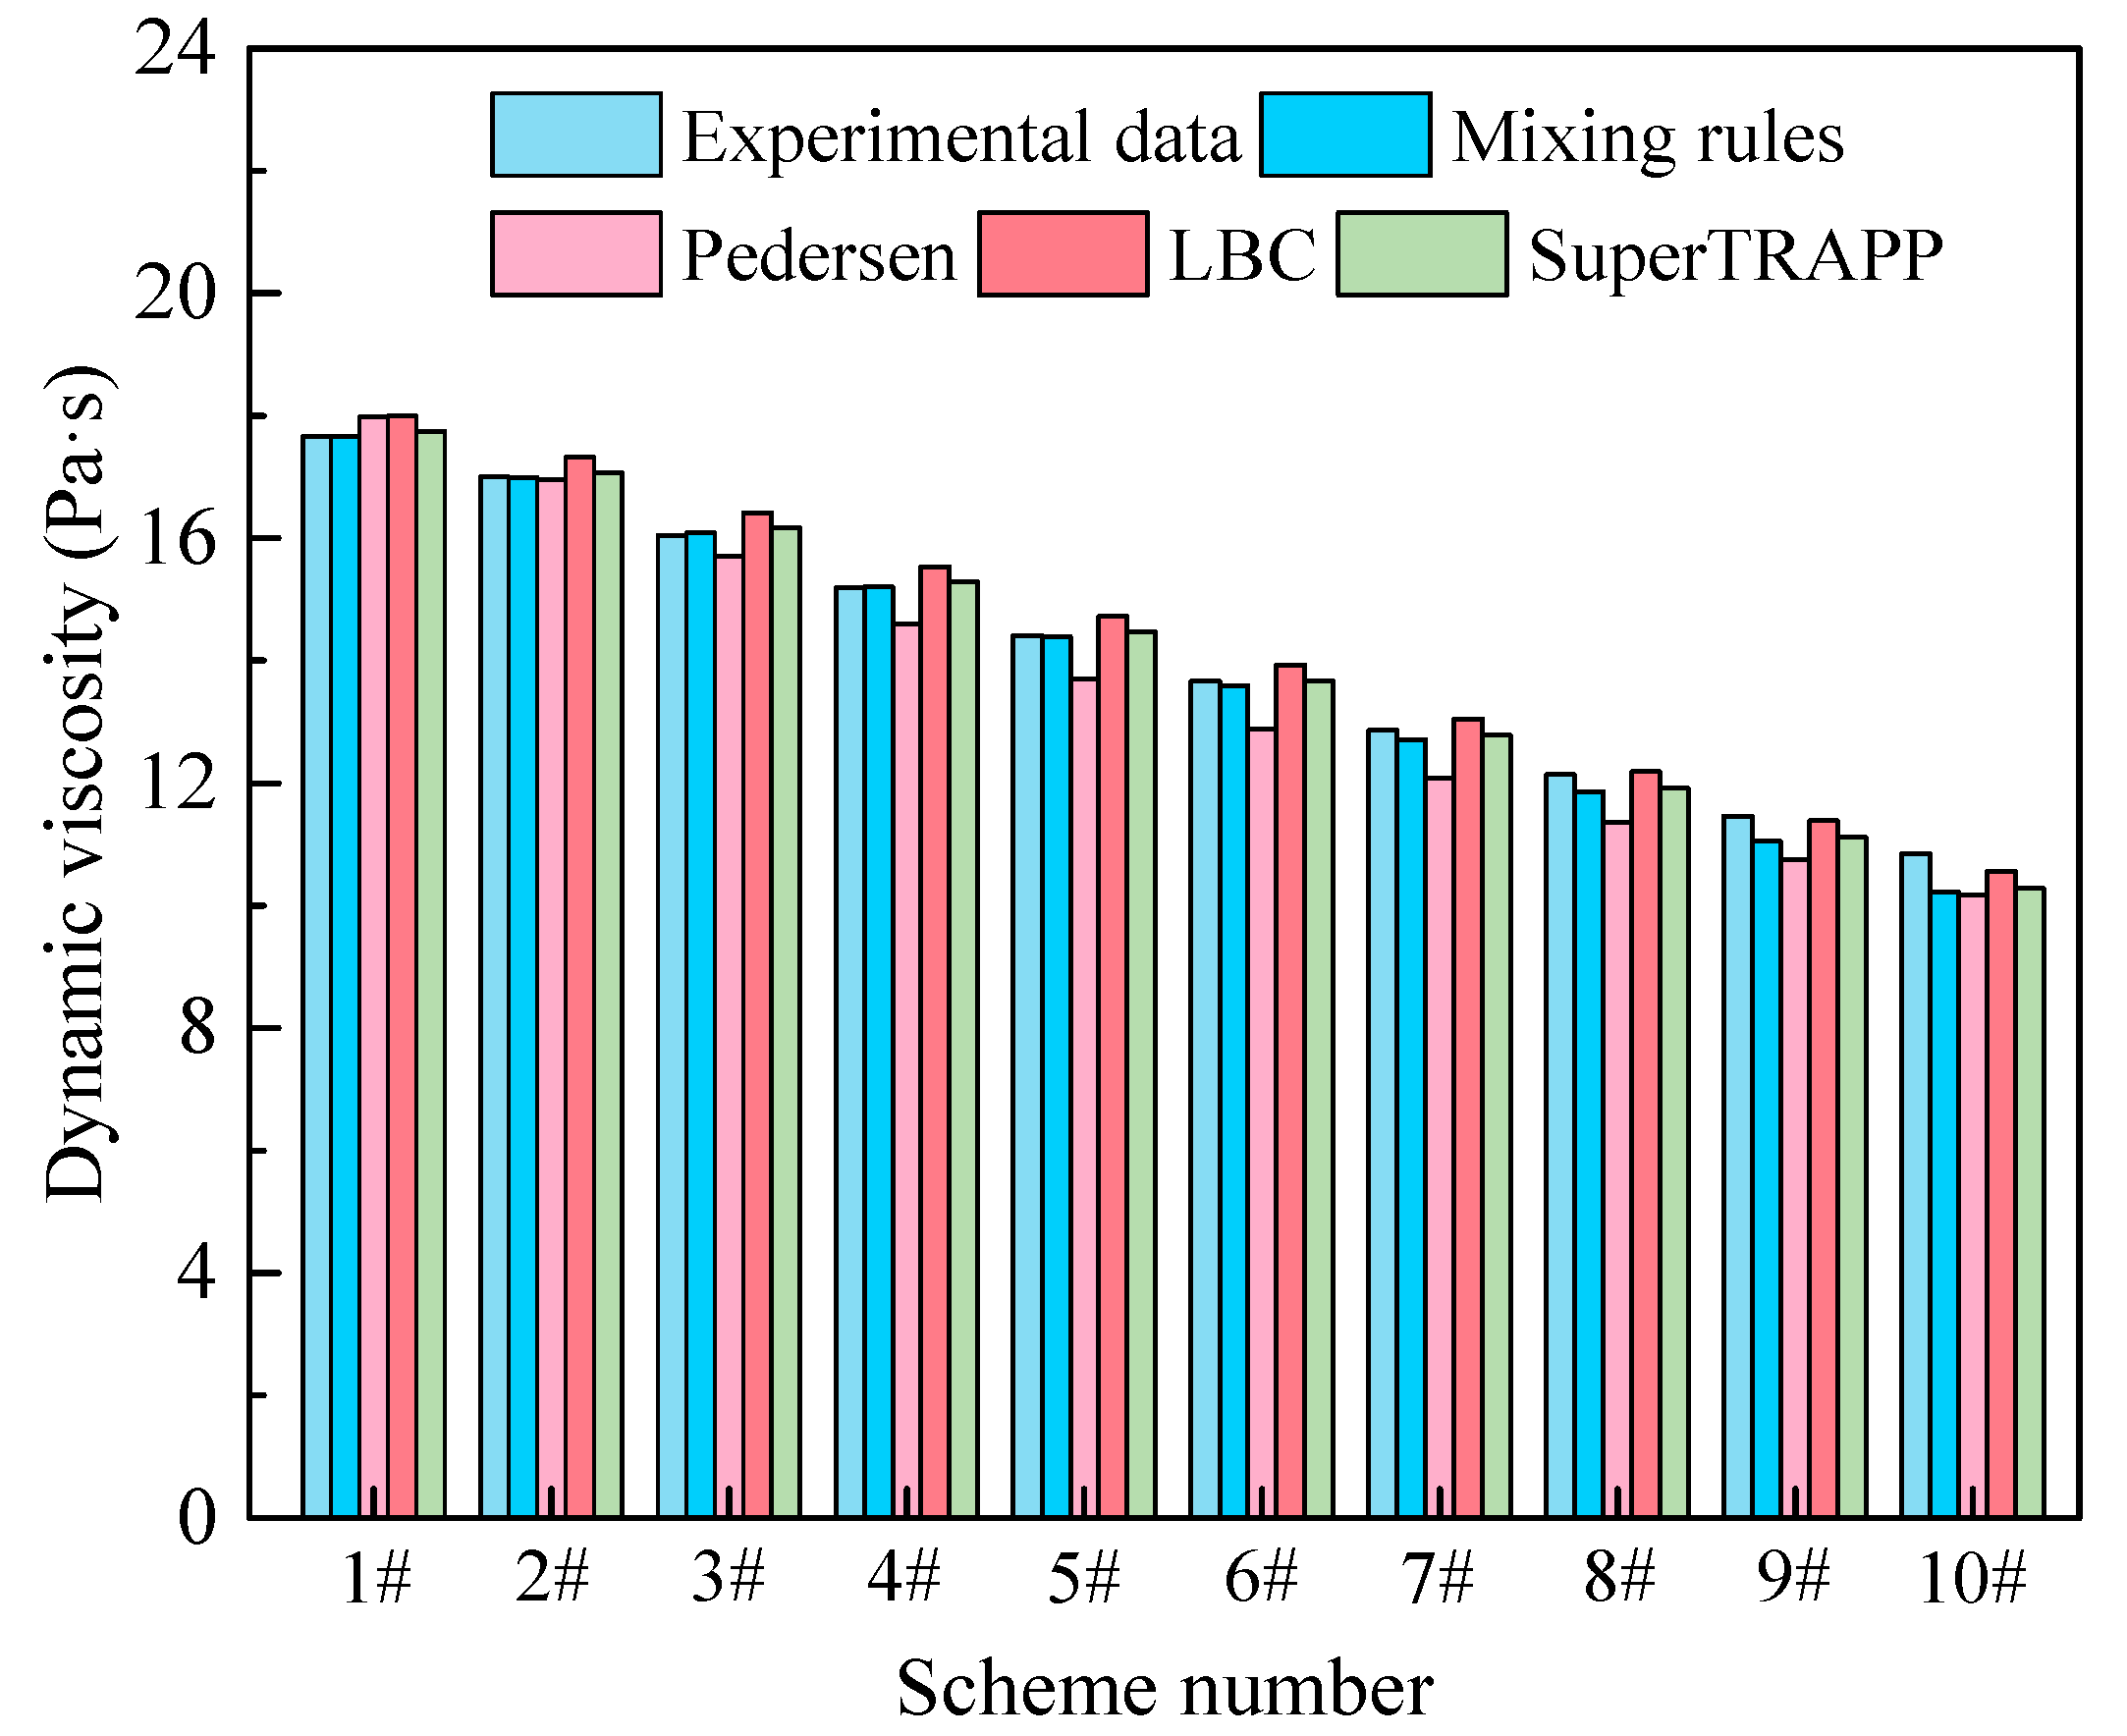
3.3. Evaluation of EOSs for Predicting Dynamic Viscosity

The dynamic viscosity calculation is very different from the density calculation when calculating the physical properties of the components. The density value can be directly obtained by relying on the EOSs. However, due to the complexity of the gaseous components in the oilfield and the dynamic viscosity also being a parameter related to density, pressure and temperature, if the EOS is directly used for dynamic viscosity calculation, there is a certain error in the calculation of density which will lead to the deviation of dynamic viscosity calculation results. Therefore, for predicting dynamic viscosity, a special empirical formula or semi-empirical formula is often used in filed engineering to solve the dynamic viscosity value, such as mixing rule, LBC (Lohrenz-Bray-Clark) [28], Pedersen [29] and SuperTRAPP equations based on TRAPP equations, etc. These empirical equations have built-in reference gases such as methane, propane, etc. In summary, the EOS and the viscosity equation are combined for calculating the parameters used in the viscosity equation. The experimental data of dynamic viscosities from Carr et al.’s [30] work are employed to validate the prediction performance of the EOSs, which is listed in Table 5.
Figure 6 presents the comparison of dynamic viscosity between the predicted results and experimental data at a different molar concentration ratio of C2H6 and N2. Clearly, all empirical formulas predict dynamic viscosity with good accuracy under the conditions of atmospheric pressure and temperature of 300 K. The AAD and ARD results for the prediction of dynamic viscosity using different empirical formulas is shown in Figure 7.
It can be found from Figure 7 that among the above empirical formulas, the SuperTRAPP formula has the smallest calculation error, with AAD and ARD values of 0.16 and 1.33%, respectively. The reason for this is that the SuperTRAPP formula is an extended prediction model of propane as a reference fluid. The viscosity values of propane and ethane are similar under the same working condition. Therefore, in the concentration system dominated by ethane, the calculated viscosity is closer to the experimental value. On the contrary, the Pedersen formula has the largest calculation error, with AAD and ARD values of 0.57 and 4.36%, respectively. The SuperTRAPP formula is recommended for the calculation of dynamic viscosity. The calculated viscosity of the Pedersen equation is higher than the experimental value when the ethane concentration is less than 10%, but with the increase of ethane concentration, the calculated viscosity is lower than the experimental value. This may be because the Pedersen formula is a relative EOS, which is based on the viscosity change rule of the reference substance liquid methane to predict the viscosity of other substances.

3.4. Phase Characteristic of C2H6 or N2 Component

According to the definition of the U.S. Energy Information Administration (EIA), commercial ethane is ethane with a content of 95% or more used in the market. The ethane product produced by the Oilfield of China is composed of 97% ethane, 1.5% methane and 1.5% propane, which belongs to commercial ethane. The phase state of commercial ethane in the Oilfield of China and pure N2 are calculated using PR-Peneloux-EOS, as shown in Figure 8 and Figure 9.
It can be seen from Figure 8 that the critical temperature and pressure of commercial ethane in the Oilfield of China are 32.79 °C and 4.97 MPa, respectively. Meanwhile, the critical temperature and pressure of N2 are −145.39 °C and 3.30 MPa, respectively, as can be found in Figure 9. In pipeline replacement production state, liquefied ethane is more likely to undergo a gas-liquid phase change than natural gas. The gas-phase ethane formed by vaporization may also be liquefied again, resulting in the occurrence of a gas-liquid two-phase flow, which greatly reduces the safety and pipeline transportation efficiency in the process of transportation. Figure 9 reveals that pure N2 has a lower critical temperature and a higher critical pressure, so it is difficult to form gas-liquid two-phase flow under normal pipeline transportation conditions. In the process of replacing N2 with liquid-phase ethane, the content of N2 drops from 100% to 0%, while the content of ethane rises from 0% to 100%. In this replacement process, the proportion of each component of the mixed gas is complicated, so it is still necessary to further study the phase characteristics of the mixed components of ethane and N2 based on the study of the phase states of ethane and N2.

3.5. Phase Characteristic of C2H6-N2 Mixed Component

In the process of replacing nitrogen with liquid-phase ethane, due to the large difference in the physical properties of the two media inside the pipeline, high purity liquid-phase ethane will vaporize after contacting nitrogen to form gas-phase ethane, methane and other components. These gases will be mixed with nitrogen to form a new mixed gas, and with the continuous progress of the ethane replacement process, the proportion of nitrogen components in the mixture gas will continue to decrease. In addition, components such as ethane and methane in high-purity ethane will continue to increase until the proportion of nitrogen in the mixture gas inside the pipeline decreases to 0% and the proportion of high-purity ethane becomes 100%. Then, it can be considered that the nitrogen replacement is completed. At this time, the pipeline is full of high-purity ethane, as shown in Figure 10.
During the whole replacement process, with the continuous progress of replacement construction, the proportion of gas components inside the pipeline is constantly changing. Therefore, it is necessary to carry out phase-state characteristics research on the high purity ethane and nitrogen gas with different mixing ratios and to lay the foundation for the subsequent research on the mixing state and flow process of high-purity ethane and nitrogen gas in the replacement process.
Figure 11 shows the phase diagram of C2H6-N2 with different mixing ratios calculated using PR-Peneloux EOS. As can be seen, the physical properties of ethane are changed after being mixed with nitrogen. Its virtual critical pressure keeps increasing, while the virtual critical temperature keeps decreasing, which results in the enlarging of the gas-liquid two-phase region. The normal transportation pressure in the liquid-phase ethane pipeline is 5~8 MPa, while in the ethane replacement operation, the pipeline pressure ranges from 0 MPa to 15 MPa and the temperature is between −50~40 °C. Therefore, based on this consideration, the phase diagram of C2H6-N2 in actual operating conditions is given, as shown in Figure 11b. According to Figure 1b, the critical parameters of C2H6-N2 mixed gas with different mixing ratios within the actual working conditions can be clarified and the phase state of the pipeline transportation medium can be determined according to the pressure and temperature at different stages of displacement production. In addition, although nitrogen can be dissolved in ethane, the dissolution condition is very harsh. When the pressure is normal pressure and the temperature drops to 90 K, the molar proportion of nitrogen after dissolution is only 7%, and when the temperature rises to 110 K, the molar proportion is only 3%. Therefore, the component of nitrogen dissolved in liquid-phase ethane can be ignored when calculating the physical parameters of the pipeline replacement medium and flow process under the pressure and temperature conditions of the displacement production process.

4. Conclusions

In this paper, different EOSs were used to predict the physical properties (such as density, dew point and dynamic viscosity) of ethane or ethane mixture, and the prediction performance was evaluated by two evaluation indicators, including average absolute deviation (AAD) and average relative deviation (ARD). Then, the phase characteristics of ethane or ethane mixture in the process of ethane pipeline replacement operation were obtained based on the optimal EOS. The main conclusions are as follows:
(1)
PR-Peneloux EOS, SRK EOS, BWRS EOS, SRK-Peneloux EOS, GREG-2008 EOS, LKP EOS and PR EOS can efficiently predict the density of CH4-C2H6-N2 mixture with the ARD values within 20%. The prediction accuracy is in the order of PR-Peneloux EOS > SRK EOS > BWRS EOS > SRK-Peneloux EOS > GREG-2008 EOS > LKP EOS > PR EOS.
(2)
All EOSs can accurately predict the dew point of the C2H6-N2 mixture when the concentration of ethane is greater than 84%. The BWRS EOS has the best performance with an average ARD value of 0.58%, regardless of the mixed ratio of C2H6 and N2.
(3)
Mixing rules, the Pedersen formula, LBC formula and SuperTRAPP formula can predict dynamic viscosity with good accuracy under the conditions of atmospheric pressure and temperature of 300 K. SuperTRAPP formula has the smallest calculation error, with AAD and ARD values of 0.16 and 1.33%.
(4)
The critical temperature and pressure of commercial ethane in the oilfield of China are 32.79 °C and 4.97 MPa, respectively. It is difficult to avoid gas-liquid two-phase flow during the production process of long-distance liquefied ethane pipelines, so further research is needed for this special working condition to ensure the smooth production and operation of the pipeline.

Author Contributions

Conceptualization, J.B. and C.L.; Methodology, J.B. and W.Z.; Validation, W.Y.; Formal analysis, J.B.; Resources, W.Y.; Data curation, Y.X.; Writing—original draft, J.B. and X.Y.; Writing—review & editing, W.Z.; Visualization, X.Y.; Project administration, C.L. All authors have read and agreed to the published version of the manuscript.

Funding

This research was funded by The Postdoctoral Foundation of PetroChina Southwest Oil & Gasfield Company grant number 20230312-10.

Data Availability Statement

Data will be made available on request.

Conflicts of Interest

The authors declare no conflict of interest.

Nomenclatures

K i j bivariate interaction coefficient
y i molar fraction of component i
T c critical temperature of natural gas, K
P a volume translation coefficient
p r pressure ratio
V r molar volume ratio
T r temperature ratio
V molar volume, m3/mol
R gas constant, 8.314 J/(mol·k)
Zcompression factor
R gas constant, 8.314 J/(mol·k)
X ¯ molar fraction of each component in the mixture, %
y i c a l calculated value
y i e x p experimental data
Greek Symbols
δ density variable
τ temperature variable
Abbreviation
AADaverage absolute deviation
ARDaverage relative deviation
C2H6ethane
EOSequation of state
N2Nitrogen

References

  1. Ma, Y.S.; Cai, X.Y.; Zhao, P.R. China’s shale gas exploration and development: Understanding and practice. Petrol. Explor. Dev. 2018, 45, 589–603. [Google Scholar] [CrossRef]
  2. Van Goethem, M.W.M.; Barendregt, S.; Grievink, J.; Verheijen, P.J.T.; Dente, M.; Ranzi, E. A kinetic modelling study of ethane cracking for optimal ethylene yield. Chem. Eng. Res. Des. 2013, 91, 1106–1110. [Google Scholar] [CrossRef]
  3. Zandhaghighi, S.; Iranshahi, D.; Shakeri, M.; Bagherpour-Ardakani, E. Applying a new configuration for thermal integration of ethane cracking and CLC processes to enhance the ethylene and hydrogen productions. Chem. Eng. Res. Des. 2022, 186, 672–684. [Google Scholar] [CrossRef]
  4. Jung, W.; Lee, J.; Ha, K.S. A combined production technology for ethylene and hydrogen with an ethane cracking center and dielectric barrier discharge plasma reactor. Chem. Eng. J. 2023, 462, 142155. [Google Scholar] [CrossRef]
  5. Teh, C.J.; Barifcani, A.; Pack, D.; Tade, M.O. The importance of ground temperature to a liquid carbon dioxide pipeline. Int. J. Greenh. Gas. Con. 2015, 39, 463–469. [Google Scholar] [CrossRef]
  6. Lu, H.F.; Ma, X.; Huang, K.; Fu, L.D.; Azimi, M. Carbon dioxide transport via pipelines: A systematic review. J. Clean. Prod. 2020, 266, 121994. [Google Scholar] [CrossRef]
  7. Nguyen, D.D.; Atiku, F.A.; Pirouzfar, V.; Su, C.H. Technical, economic and thermodynamic analysis for loading, storing, unloading and transporting of Ethane fluid. J. Taiwan Inst. Chem. E. 2021, 120, 218–228. [Google Scholar] [CrossRef]
  8. Raed, Z.; Carlos, A. Transport of ethane-rich gases using an extensive gas pipeline system. In Proceedings of the SPE Annual Technical Conference and Exhibition, Houston, TX, USA, 26–29 September 2004. [Google Scholar]
  9. Mcguire, P.L.; Okuno, R.; Gould, T.L. Ethane-based EOR: An innovative and profitable EOR opportunity for a low-price environment. In Proceedings of the SPE Improved Oil Recovery Conference, Tulsa, OH, USA, 11–13 April 2016. [Google Scholar]
  10. Sicotte, D.M. From cheap ethane to a plastic planet: Regulating an industrial global production network. Energy Res. Social Sci. 2020, 66, 101479. [Google Scholar] [CrossRef]
  11. Liu, G.; Wang, Y.S.; Hao, Z.R.; Wang, Y.; Ren, W.L. Prediction of the instability for simply supported pipes conveying gas-liquid two-phase slug flow. Ocean Eng. 2022, 244, 110388. [Google Scholar] [CrossRef]
  12. Liu, H.S.; Duan, J.M.; Gu, K.C.; Li, J.; Yan, H.; Wang, J. Slug flow hydrodynamics modelling for gas-liquid two-phase flow in a pipe. Energies 2022, 15, 533. [Google Scholar] [CrossRef]
  13. Jia, W.L.; Zhang, Y.R.; Li, C.J.; Wu, X.; Song, S.S.; Yang, F. Optimal diameter of liquid-phase ethane transportation pipeline considering the liquid-vapor phase change. J. Nat. Gas. Sci. Eng. 2022, 107, 104797. [Google Scholar] [CrossRef]
  14. Lozano-Martín, D.; Khanipour, P.; Kipphardt, H.; Tuma, D.; Chamorro, C.R. Thermodynamic characterization of the (H2 + C3H8) system significant for the hydrogen economy: Experimental (p, ρ, T) determination and equation of state modelling. Int. J. Hydrog. Energy 2023, 48, 8645–8667. [Google Scholar] [CrossRef]
  15. Vitali, M.; Leporini, M.; Masi, O.; Speranza, A.; Corvaro, F.; Marchetti, B. Net zero Flow Assurance—Validation of various equations of state for the prediction of VLE and density of CO2-rich mixtures for CCUS applications. Int. J. Greenh. Gas Control 2023, 125, 103877. [Google Scholar] [CrossRef]
  16. Seo, J.; Kim, J.S.; Kim, K.H. Improved prediction of the thermodynamic properties of JP-10 using an extended Redlich-Kwong-Peng-Robinson equation of state. J. Ind. Eng. Chem. 2023, 123, 88–103. [Google Scholar] [CrossRef]
  17. Redlich, O.; Kwong, J.N.S. On the thermodynamics of solutions (V): An equation of state. Fugacities of gaseous solutions. Chem. Rev. 1949, 44, 233–244. [Google Scholar] [CrossRef] [PubMed]
  18. Soave, G. Equilibrium constants for modified Redlich-Kwongequation of state. Chem. Eng. Sci. 1972, 27, 1197–1203. [Google Scholar] [CrossRef]
  19. Peng, D.Y.; Robinson, D.B. A new two-constant equation of state. Ind. Eng. Chem. Fundam. 1976, 15, 59–64. [Google Scholar] [CrossRef]
  20. Péneloux, A.; Rauzy, E.; Fréze, R. A consistent correction for Redlich-Kwong-Soave volumes. Fluid Phase Equilibr. 1982, 8, 7–23. [Google Scholar] [CrossRef]
  21. Starling, K.E. A new approach for determining equation-of-state parameters using phase equilibria data. SPE J. 1966, 6, 363–371. [Google Scholar] [CrossRef]
  22. Lee, B.I.; Kesler, M.G. A generalized thermodynamic correlation based on three-parameter corresponding states. AIChE J. 1975, 21, 510–527. [Google Scholar] [CrossRef]
  23. Kunz, O.; Wagner. The GERG-2008 wide-range equation of state for natural gases and other mixtures: An expansion of GERG-2004. J. Chem. Eng. Data 2012, 57, 3032–3091. [Google Scholar] [CrossRef]
  24. Patel, N.C.; Abovsky, V.; Watanasiri, S. Mixing rules for van-der-Waals type equation of state based on thermodynamic perturbation theory. Fluid Phase Equilibr. 1998, 152, 219–233. [Google Scholar] [CrossRef]
  25. Funke, M.; Kleinrahm, R.; Wagner, W. Measurement and correlation of the (p, ρ, T) relation of ethane II. Saturated-liquid and saturated-vapour densities and vapour pressures along the entire coexistence curve. J. Chem. Thermodyn. 2002, 34, 2017–2039. [Google Scholar] [CrossRef]
  26. Bier, K.; Kunze, J.; Maurer, G.; Sand, H. Experimental results for heat capacity and Joule-Thomson coefficient of ethane at zero pressure. J. Chem. Eng. Data 1976, 21, 5–7. [Google Scholar] [CrossRef]
  27. Syed, T.H.; Hughes, T.J.; Marsh, K.N.; May, E.F. Isobaric heat capacity measurements of liquid methane, ethane, and propane by differential scanning calorimetry at high pressures and low temperatures. J. Chem. Eng. Data 2012, 57, 3573–3580. [Google Scholar] [CrossRef]
  28. Jossi, J.A.; Stiel, L.I.; Thodos, G. The viscosity of pure substances in the dense gaseous and liquid phases. AIChE J. 1962, 8, 59–63. [Google Scholar] [CrossRef]
  29. Pedersen, K.S.; Fredenslund, A. An improved corresponding states model for the prediction of oil and gas viscosities and thermal conductivities. Chem. Eng. Sci. 1987, 42, 182–186. [Google Scholar] [CrossRef]
  30. Carr, N.L.; Kobayashi, R.; Burrows, D. Viscosity of hydrocarbon cases under pressure. Part I: Correlation of the effect of pressure, temperature, and composition on the viscosity of hydrocarbons and their mixtures. J. Pet. Technol. 1954, 10, 47–55. [Google Scholar] [CrossRef]
Figure 1. Comparisons of the density of methane, ethane and N2 mixtures at different working conditions. (a) 1#–10#; (b) 11#–20#.
Processes 11 02283 g001
Figure 2. AAD and ARD for predicting the density of CH4-C2H6-N2 mixture using PR EOS, PR-Peneloux EOS, SRK EOS, SRK-Peneloux EOS, BWRS EOS, LKP EOS and GREG-2008 EOS. (a) AAD; (b) ARD.
Processes 11 02283 g002
Figure 3. Comparison of dew point at different molar concentration ratio of C2H6 and N2: (a) C C 2 H 6 = 95.02 , C N 2 = 4.98   ; (b) C C 2 H 6 = 84.99 , C N 2 = 15.01   ; (c) C C 2 H 6 = 68.31 , C N 2 = 31.69   ; (d) C C 2 H 6 = 49.82 , C N 2 = 50.18   ; (e) C C 2 H 6 = 30.00 , C N 2 = 70.00 .
Processes 11 02283 g003aProcesses 11 02283 g003bProcesses 11 02283 g003c
Figure 4. AAD and ARD for predicting the dew point of C2H6-N2 mixture using PR EOS, PR-Peneloux EOS, SRK EOS, SRK-Peneloux EOS, BWRS EOS, LKP EOS and GREG-2008 EOS under different working conditions. (a) AAD; (b) ARD.
Processes 11 02283 g004aProcesses 11 02283 g004b
Figure 5. Average AAD and ARD for predicting the dew point of CH4-C2H6-N2 mixture using PR EOS, PR-Peneloux EOS, SRK EOS, SRK-Peneloux EOS, BWRS EOS, LKP EOS and GREG-2008 EOS.
Processes 11 02283 g005
Figure 6. Comparison of dynamic viscosity of C2H6-N2 with different molar concentration.
Processes 11 02283 g006
Figure 7. AAD and ARD for predicting the dynamic viscosity of C2H6-N2 mixture. (a) AAD; (b) ARD.
Processes 11 02283 g007
Figure 8. Phase change diagram of commercial ethane (97% C2H6, 1.5% CH4 and 1.5% C3H8).
Processes 11 02283 g008
Figure 9. Phase change diagram of purity N2 (100% N2).
Processes 11 02283 g009
Figure 10. Concentration gradient during nitrogen replacement process.
Processes 11 02283 g010
Figure 11. Phase diagram of C2H6-N2 with different mixing ratios. (a) −200 °C~200 °C; (b) −50 °C~70 °C.
Processes 11 02283 g011
Table 1. Parameter values of cubic PVT EOS for pure component.
Equation of State Functional FormPure Component
ab
RK
[17]
P = R T V b a   T 1 2 V V + b a = Ω a R 2 T c 2.5 P c b = Ω b RT c P c
SRK
[18]
P = R T V b a   V V + b a = 0.42748 R 2 T c 2 P c α b = 0.08664 R T c P c
PR
[19]
P = R T V b a   V V + b + b V + b a = 0.45724 R 2 T c 2 P c α b = 0.07780 R T c P c
SRK-Peneloux [20] P = R T V b a   V V + b a = 0.42748 R 2 T c 2 P c α b = 0.08664 R T c P c
PR-Peneloux [20] P = R T V b a   V V + b + b V + b a = 0.45724 R 2 T c 2 P c α b = 0.07780 R T c P c c
Table 2. Parameter values of cubic PVT EOS for mixed component.
Equation of State Functional FormMixed Component
ab
RK
[17]
P = R T V b a   T 1 2 V V + b a = y i a i 0.5 2 b = y i b i
SRK [18] P = R T V b a   V V + b a = i j y i y j ( a i a j ) 1 / 2 ( 1 - K i j ) b = 0.08664 R T c P c
PR
[19]
P = R T V b a   V V + b + b V + b a = i j y i y j ( a i a j ) 1 / 2 ( 1 - K i j ) b = 0.07780 R T c P c
SRK-Peneloux
[20]
P = R T V b a   V V + b a = i j y i y j ( a i a j ) 1 / 2 ( 1 - K i j ) b = 0.08664 R T c P c - c
PR-Peneloux
[20]
P = R T V b a   V V + b + b V + b a = i j y i y j ( a i a j ) 1 / 2 ( 1 - K i j ) b = 0.07780 R T c P c c
where V is molar volume, m3/mol; R is the gas constant, 8.314 J/(mol·k); P is pressure, Pa; T is pressure, K; Z is the compression factor; a and b are characteristic parameters; y i is the molar fraction of component i; K i j is the bivariate interaction coefficient; T c is the critical temperature of natural gas, K; and P a is the volume translation coefficient.
Table 3. Experimental data of density of CH4-C2H6-N2 mixture.
Working ConditionsTemperature
(°C)
Pressure
(MPa)
Molar Concentration of CH4 (%)Molar Concentration of C2H6 (%)Molar Concentration of N2 (%)Density
(kg/m3)
1#−181.150.1383-96.703.30650.50
2#−181.151.0394-95.204.80651.30
3#−181.150.159188.40-11.60451.00
4#−181.050.273729.1054.5016.40586.40
5#−181.050.27682.609.308.10491.10
6#−181.050.278587.905.406.70471.20
7#−181.051.098860.1029.3010.60527.20
8#−181.051.100575.206.2018.60478.30
9#−179.150.27440.5050.608.90569.70
10#−179.150.276468.0019.3012.70455.10
11#−179.150.54320.6061.8017.60614.60
12#−179.150.568572.4010.6017.00475.30
13#−179.150.568762.0024.4013.60517.30
14#−179.150.828175.608.2016.20474.70
15#−179.151.097641.1015.9043.00606.80
16#−177.150.10617.7080.302.00607.50
17#−177.150.16448.0045.806.20565.30
18#−177.150.276379.4018.202.40471.00
19#−177.151.108156.9020.6022.50521.50
20#−177.151.108868.606.7024.70472.50
Table 4. Experimental data of dew point of C2H6-N2 mixture.
No.1#2#3#4#5#
C C 2 H 6   = 95.02   C N 2 = 4.98   C C 2 H 6   = 84.99   C N 2 = 15.01   C C 2 H 6   = 68.31   C N 2 = 31.69   C C 2 H 6   = 49.82   C N 2 = 50.18   C C 2 H 6   = 30.00   C N 2 = 70.00  
KKPaKKPaKKPaKKPaKKPa
1228.62 724.96 216.24 522.80 210.83 563.73 205.25 713.51 192.52 598.32
2255.31 1631.37 227.40 833.31 221.65 830.49 216.24 1045.72 199.84 798.01
3266.30 2203.25 238.39 1143.73 232.98 1250.02 227.40 1595.90 207.87 1194.13
4278.51 3015.41 249.73 1628.64 244.32 1800.29 238.39 2407.46 216.06 1742.86
5287.75 3738.96 261.07 2222.48 255.31 2546.48 246.76 3086.99 224.61 2531.43
6294.21 4308.61 269.44 2836.66 263.51 3313.09 255.14 4202.31 230.37 3296.84
7298.74 4877.33 275.89 3340.95 269.09 3947.68 259.67 5032.49 233.68 3930.33
8300.84 5183.39 283.05 4085.26 273.10 4494.36 263.68 6036.71 238.22 5130.91
9301.71 5400.01 287.93 4697.72 275.72 4909.62 265.78 7323.28 240.83 5960.14
10--292.12 5353.43 278.86 5477.66 263.86 9588.27 241.53 6810.23
11--294.38 5833.88 282.17 6546.91 258.28 10,914.64 242.40 8009.01
12--294.73 6248.03 282.52 7069.99 250.78 12,043.93 239.44 10,840.03
13----282.35 7897.85 240.14 12,692.36 232.29 12,274.54
14----280.08 8397.88 --222.34 13,010.48
15----278.16 8636.62 ----
Table 5. Experimental data of dynamic of C2H6-N2 mixture.
No. Molar Concentration of C2H6
(%)
Molar Concentration of N2
(%)
Dynamic Viscosity
(Pa·s)
1#1.6298.3817.67
2#9.3390.6717.00
3#19.8880.1216.05
4#30.2269.7815.19
5#39.7660.2414.41
6#49.2950.7113.66
7#59.8440.1612.86
8#70.1829.8212.14
9#79.9220.0811.46
10#90.069.9410.85
Disclaimer/Publisher’s Note: The statements, opinions and data contained in all publications are solely those of the individual author(s) and contributor(s) and not of MDPI and/or the editor(s). MDPI and/or the editor(s) disclaim responsibility for any injury to people or property resulting from any ideas, methods, instructions or products referred to in the content.

