Abstract
Wellbore instability mainly occurs in shale formations, and it is of great significance to deeply analyze the characteristics of shale-failure behavior to evaluate the stability of the shale surrounding the well wall during drilling. Through a uniaxial compression experiment and DIC technology, the whole strain field of shale specimens with prefabricated holes and cracks under uniaxial compression is measured. The experimental data of load, displacement and strain field are analyzed comprehensively. The results show that the fracture location and expansion path of shale are closely related to the evolution of the strain field. The evolution of the strain field directly affects the failure behavior of the rock. Under the action of load, local high strain will first appear around the initial shale defects (pores and fractures), and stress concentration will occur. With the increase of load, cracks and failures will first appear in the local high-strain zone, and the failure will spread along the region and path and eventually lead to the overall failure of the rock. The establishment of a description method for shale-failure behavior through strain-field evolution can effectively analyze the crack behavior of shale with initial defects such as holes and cracks and provide theoretical and experimental bases for the stability evaluation of the shale surrounding the well wall, including shale-strength prediction and shale-failure mechanism.
1. Introduction
Oil and gas drilling is an important process of oil and gas exploitation. Special drilling equipment is used to break the formation rock, drill a hole, and then continue to drill underground until the oil and gas reservoir is drilled, and finally the oil and gas are extracted to the surface. The rock mass of an oil and gas reservoir is mostly composed of shale. Shale is stratified sedimentary rock with discontinuity, heterogeneity, and anisotropy and can be regarded as a porous elastoplastic medium. Natural shale contains holes, cracks and other defective structures, and the distribution is complex. These original cracks in the shale mass play a vital role in the strength and deformation characteristics of the shale mass [1]. In the process of drilling, the stress field of the borehole wall is redistributed under the action of crustal stress, drilling-fluid erosion, and pressure-transfer mechanism [2], which may lead to stress concentration in local areas around defects such as holes and cracks in surrounding rocks. With the increase of local stress around the defective structure, cracks may appear around the defect and continue to expand and penetrate, making the bearing capacity of the rock gradually decrease until it breaks off due to the destruction of its structural integrity, resulting in the instability of the well wall. Wellbore instability mainly occurs in shale formations, and its fundamental reason is the mechanical failure of the rock. The wellbore instability of a shale formation seriously affects the safe and efficient exploitation of oil and gas resources, which is a technical bottleneck [3]. Therefore, it is of great significance to analyze the behavior characteristics of shale-fracture propagation, penetration, and overall failure to evaluate the stability of the wellbore during drilling.
Researchers at home and abroad have done extensive research on the initiation, expansion, and penetration of cracks in rock. Hoek [4] studied the research results of cracks caused by the initiation and expansion of a single crack in a biaxial stress field and discussed the applicability of predicting shale cracks in a compression stress field. Lajtai [5] carried out uniaxial compression experiments on gypsum specimens with a single crack and analyzed the characteristics of wing cracks (tensile cracks) and secondary cracks (shear cracks) on the surface of the specimens. Lin et al. [6] studied the crack-expansion mechanism and failure behavior of specimens with a single crack at different angles and found that the crack expansion and final failure behavior are closely related to the prefabricated crack angle under uniaxial compression. Yang et al. [7] carried out uniaxial compression experiments on discontinuous three-fissure sandstone specimens and obtained the relationship between the macroscopic deformation characteristics of discontinuous three-fissure sandstone specimens and the crack expansion process. Xu et al. [8] carried out uniaxial compression experiments on gypsum specimens with different prefabricated defects and studied the gradual failure behavior of shale in stages under compression conditions from the angle of the dip angle and defect number, concluding that the failure mechanism of shale is closely related to the characteristics of the defects (including defect number, defect dip angle, and defect spacing, etc.). Liu et al. [9] carried out uniaxial compression experiments on shale-like specimens with V-shaped intersecting cracks with different angles and studied the influence of V-shaped prefabricated cracks with different angles on the mechanical properties and failure modes of the specimens. It was concluded that the angle of V-shaped intersecting cracks had a great influence on the reduction of peak stress, elastic modulus, and peak strain, which could reflect the strength and deformation characteristics of the specimens, having a great influence on the crack evolution and failure modes. Dong et al. [10] carried out acoustic-emission experiments on granite instability and cracks, analyzing the stage characteristics of the shale-failure process, and constructed the identification method of the crack expansion state in the plastic stage of the shale mass by using a machine-learning model. Li et al. [11] used CT scanning technology to analyze the laws of shale-crack expansion and failure evolution. Zhao et al. [12] observed the expansion of micro-cracks around prefabricated cracks in the process of uniaxial compression experiments on shale in real time under a scanning electron microscope. The experiment showed that with increasing load, micro-cracks gradually merged from the initial shear-crack zone to the penetration-crack zone. In the above research process, the accurate observation and dynamic monitoring of the mechanical behavior of cracks have always been difficult problems in the experiment implementation. Digital Image Correlation (DIC) was first exploited in the early 80s [13,14]. Digital-image-correlation (DIC) technology is a holistic measurement technology widely used in experimental mechanics [15]. By marking the feature points (scatter plots) on the surface of metal, rock, plastic, wood and other materials, the motion of speckle features can be captured at the sub-pixel level, and the optimized digital-image correlation algorithm can be used to measure the full-field morphology, displacement, and strain data of specimens in real time. This technology can record the whole process of specimen deformation and failure, providing support for mechanical behavior analysis. It has the advantages of convenient operation, non-contact full measurement, strong anti-interference ability, high measurement accuracy, and relaxed requirements for experimental conditions [16]. DIC has been used in many fields. For example, DIC technology has been used in much research on the performance of concrete [17,18,19,20]. With the development of digital-image-correlation technology, some scholars gradually applied Digital Image Correlation (DIC) technology to the study of geotechnical engineering. DIC is widely used to measure subpixel displacement in soil [21,22,23] and crack and failure mechanisms in rock [24,25,26,27,28]. Song et al. [29] used a digital speckle correlation method to describe and analyze the displacement evolution and energy evolution of shale specimens in the whole process of deformation and failure under load. Zhu et al. [30] analyzed the process of crack expansion and crack failure of marble shale with prefabricated initial defects by using Digital Image Correlation (DIC) technology and put forward a method to measure the crack-initiation stress of shale with hole defects.
At present, there is a lack of research on the mechanical failure behavior of shale with initial defects such as pores and fractures. The local evolution characteristics of initial defects such as holes and fractures will affect the damage and failure behavior of shale under stress. Therefore, analyzing the local evolution characteristics of defect structures under load is of great significance for studying the damage and failure behavior laws of shale, such as fracture initiation and fracture expansion.
In this study, a series of uniaxial compression experiments were carried out on cuboid shale samples with prefabricated circular holes and fractures of different inclination angles. Digital Image Correlation (DIC) technology was used to record the whole process of damage evolution to failure of the sample under unidirectional loading, and the strain-field cloud map of the whole process was obtained to quantitatively analyze the influence of different fracture angles on the failure behavior of the shale sample and the relationship between the local strain characteristics of the sample and the failure behavior of the sample, such as fracture initiation, fracture propagation, and penetration. The laws and internal mechanism of crack initiation and propagation are deeply analyzed. This study establishes a method to analyze the failure behavior of shale containing defects (holes and fractures) through the local strain characteristics in the global strain field, which has theoretical significance for the stability evaluation of oil and gas well walls the prediction of shale strength, and the failure mechanism of shale.
2. Uniaxial Compression Experiment on Shale
A uniaxial compression experiment and DIC technique are combined to analyze the evolution behavior of the whole strain field of shale with defects (pores and fractures) under loading. The workflow is shown in Figure 1.
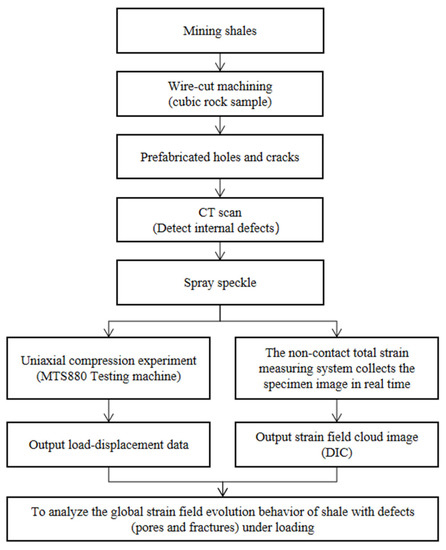
Figure 1.
Flow Chart of Uniaxial Compression Experiment.
2.1. Shale Specimen Preparation
In this study, the experimental shale samples were taken from the core of the Luzhou area, Sichuan Basin. This batch of shale samples were dark gray mixed shale, in which the content of siliceous minerals, carbonate minerals, and clay minerals was relatively uniform, with obvious bedding occurrence, without significant pore development and cracks. This batch of shale showed moderate brittleness, which was suitable for a uniaxial compression test to analyze its damage and failure behavior.
In this study, it was decided to form the shale samples into a cube shape. The purpose was as follows: 1. Under uniaxial compression, the cuboid specimen had uniform force, and the bearing capacity was stronger than that of the plate-shaped specimen, and the damage evolution process was slower, so it was convenient to observe the gradual deterioration process of the specimen under loading. 2. The experiment needed to collect a two-dimensional plane strain field of the specimens in real time. The Vic-2D strain measurement system could accurately collect a two-dimensional plane-strain field of a cuboid specimen, avoiding the influence of misaligned measurement of the curved strain field of cylindrical and other shaped specimens on the analysis of experimental results. Professional rock-cutting equipment was used to cut the shale into several standard cube shale specimens with a side length of 50 mm, and the processing accuracy of the specimens met the following requirements: The non-parallelism error of the two ends of the specimens in all directions was less than 0.05 mm; the error of height, width and thickness of the specimens was less than 0.3 mm; the surface of the specimen was perpendicular to the axis of the specimen, and the deviation was less than 0.25 degrees.
2.2. Prefabricated Holes and Cracks
In order to analyze the effects of holes and fractures on the failure behavior of shale samples, holes and fractures with different inclination angles were prefabricated on shale samples before the uniaxial compression experiments. The specimens contained obvious bedding, and different relative positions of bedding, holes, cracks and loading direction could affect the failure behavior of the specimens. In order to avoid the interference of the above factors on the experimental results, the relative positions of the specimens’ bedding, holes and cracks and loading direction should be consistent, and only the angle between the cracks and the bedding surface was different (as shown in Figure 2). Firstly, an end face perpendicular to the bedding plane should be selected and the center position of this end face should be marked. Then, a special drilling tool was used to drill from the central position perpendicular to this end face until it penetrated the other end face, forming a penetrating circular hole with a diameter of 3 mm. Finally, a single crack with a length of 10 mm and a width of 0.5 mm should be prefabricated from the hole position by wire cutting, and the included angle between the crack and the inside of the layer was α (as shown in Figure 2). Four groups of specimens with included angles of α such as 0°, 30°, 60° and 90° should be made respectively (as shown in Figure 3 & Table 1). Each group contained 3 specimens for uniaxial compression experiments.
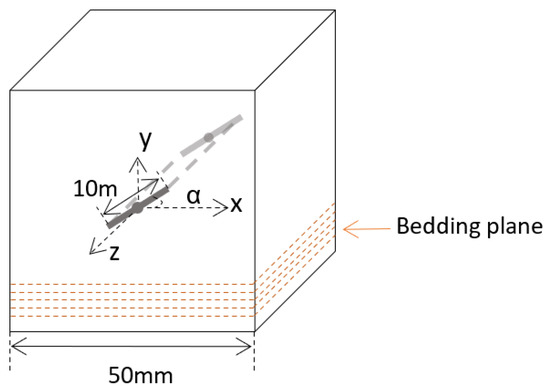
Figure 2.
Schematic Diagram of Shale Specimens.
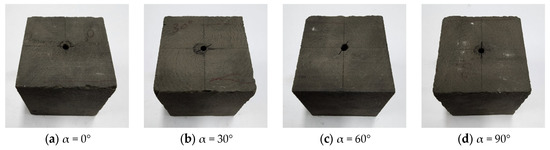
Figure 3.
Shale Specimens with Prefabricated Cracks.

Table 1.
Grouping table of shale specimens in uniaxial compression experiments.
2.3. Experimental Steps
2.3.1. CT Scanning of Internal Image of Shale Specimens
Industrial CT should be used to scan the shale specimens, and the tomographic images of the circular area with a diameter of 50 mm should be collected, and the internal defects of the shale specimens should be analyzed (as shown in Figure 4). From the CT images, it can be seen that the main internal defects of the shale specimens were prefabricated cracks, and there were no other obvious defects. The specimens avoided the influence of other internal defects on rock failure and could reflect the influence of prefabricated cracks on rock failure behavior more objectively and accurately.
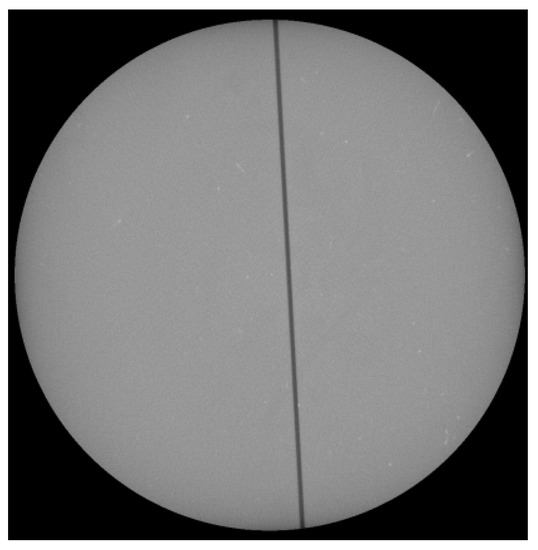
Figure 4.
CT Tomographic Images of Shale Specimens.
2.3.2. Spraying Speckles
DIC technology was used to measure the strain field, which usually requires the acquisition of gray-texture images with high dynamic range and local contrast for measurement [31]. When the surface color of test pieces is uniform and single, and the uniqueness of local points cannot be highlighted, artificial random speckle patterns are usually needed to solve these contrast and uniqueness problems (for example, by spraying the component surface of the tested material with paint of a contrasting color) [32]. In this study, a layer of white primer was sprayed on the surface of the shale sample where the prefabricated cracks were. Then, black paint with obvious color contrast was sprayed on the white primer in tiny particles to form random and uniform speckles (as shown in Figure 5), which provided calibration preparation for measuring the strain field.
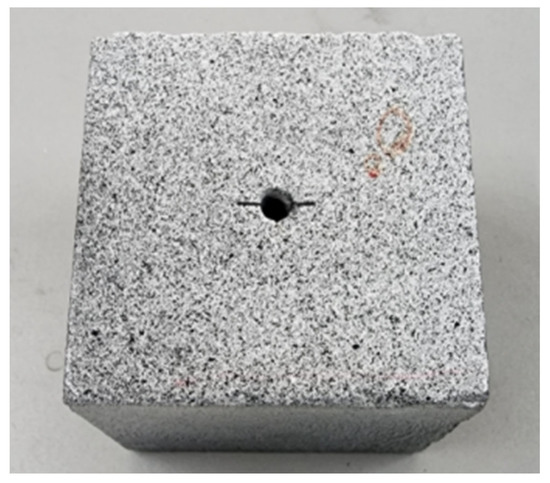
Figure 5.
Shale Specimen after Spraying Speckle.
2.3.3. Uniaxial Compression Experiment
In the oil well site, the stress situation of underground rock is very complicated and may be affected by the complex mechanical action of multiple directions and various characteristics. It is difficult to simulate the complex situation in the field through laboratory experiments. Therefore, the uniaxial compression experiment was used to simplify the complex stress conditions and simulate the evolution process of rock under vertical unidirectional pressure.
The common compression strength of shale is 10–100 MPa. By calculating the parameters such as specimen size, MTS Landmark Electro-Hydraulic Servo Experiment System (Model: 370.50, Maximum Load: 500KN) was selected for uniaxial-compression experiments on shale.
- (1)
- Installing of Shale Specimens
According to the size of the shale specimen, a suitable fixture should be selected, and a layer of vaseline should be evenly coated on the two preloaded end faces of the shale specimen and the fixture plane to reduce the friction between the end of the shale specimen and the fixture. The fixture should be installed on the experiment bench of the MTS experiment system, and then the shale specimen should be horizontally placed in the center of the fixture.
- (2)
- Setting Up a Non-Contact Whole-Strain Measurement System (ARAMIS-4M)
The experimental platform of the ARAMIS-4M system and the MTS experiment system should be set up. The high-speed camera lens should be placed in front of the speckle plane of the specimen (as shown in Figure 6), the lens height should be horizontal with the specimen, and the center position should be about 600 mm away from the specimen. The focal length should be finely tuned according to the actual situation to achieve a clear shooting effect.
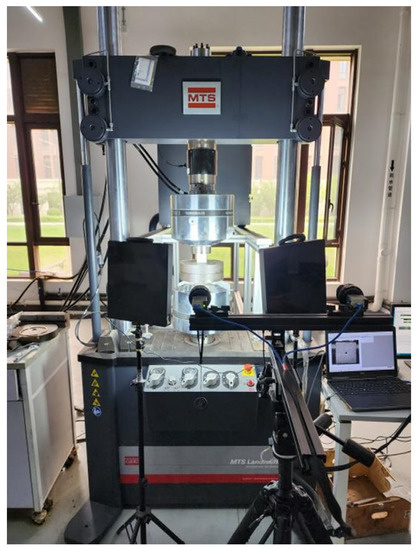
Figure 6.
The Uniaxial-Compression Experimental Platform Set of MTS Experiment System and Non-Contact Whole-Strain Measurement System.
- (3)
- Calibration of the Non-Contact Whole-Strain Measurement System
In order to collect clear images of the specimens, it was necessary to accurately set the aperture size, exposure time, and focal length of the lens, as well as the working distance and field of view. The aperture size and exposure time will affect the brightness of the specimen image. The smaller the aperture f value, the brighter the image will be; the longer the exposure time, the brighter the image will be. Appropriate adjustment should be made to make the image brightness moderate (as shown in Figure 7). There is a quantitative relationship among lens focal length, working distance and field of view; the formula (as shown in Figure 8) is as follows:
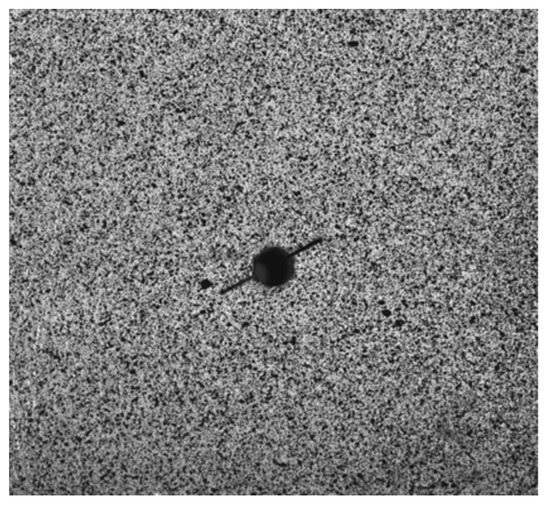
Figure 7.
Image Of Specimen with Appropriate Brightness.
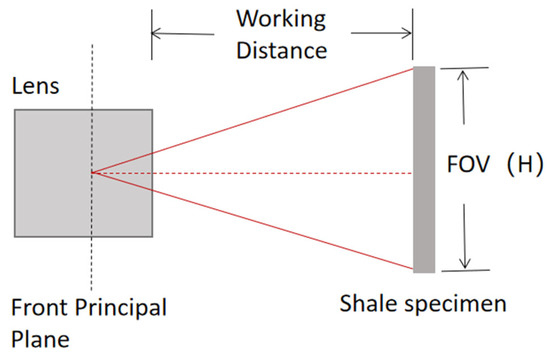
Figure 8.
Schematic Diagram of Lens Focal Length, Working Distance and Field of View.
Among them, represents the focal length of the lens; represents the working distance; represents the chip size of the camera; represents field of vision. The camera parameters in the experiment are as follows: (H = 14.13 mm, V = 10.35 mm), Image Size (H = 4096 Pixel, V = 3000 Pixel), Pixel Size = 3.45 mm. In addition, . According to the Formula (1), we obtain F = 85 mm. Finally, by fine-tuning the aperture, exposure time and focal length, the specimen image is clearly presented.
- (4)
- Real-Time Image Acquisition of Shale Specimen Compression Process
The vertical load was applied to the shale specimen by the MTS experimenting machine (as shown in Figure 9). The loading mode was controlled by axial displacement, and the loading rate was 0.1 mm/min. The loading was continued until the specimen was completely destroyed. During the whole loading process, the high-speed camera should take a two-dimensional plane image of the sprayed speckles of shale specimens at the speed of 10 frames per second and process it by the Digital Image Correlation Technology (DIC technology) to obtain the time-sharing whole strain field of the two-dimensional plane of shale specimens.
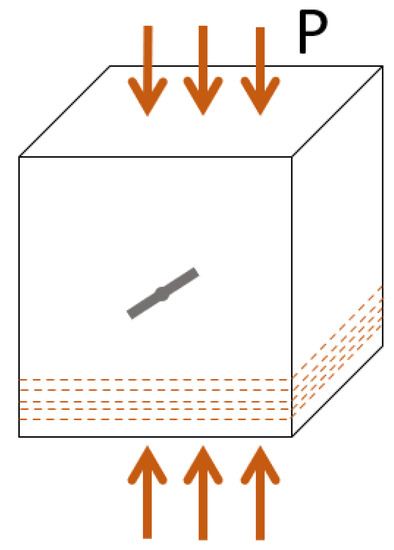
Figure 9.
Schematic Diagram of Uniaxial Compression of Shale Specimens.
- (5)
- Outputting of Experimental Data
After the shale-compression experiment, the MTS experiment system should output the displacement-load curve, and the ARAMIS-4M measurement system should output the time-sharing whole strain field, displacement field, stress field and other data images of the two-dimensional plane of the shale specimens through program operation. Based on the comprehensive analysis of the above experimental data and images, the behavior law of shale from crack initiation and penetration to overall failure of shale was studied.
3. Experimental Results and Analysis
After the uniaxial compression experiment, the MTS experiment system obtained the displacement and load data and the displacement-load curve of four groups of shale specimens with different dip angles during compression (as shown in Figure 10). The full-field strain of the shale specimen during the entire compression process was collected by the non-contact total strain measurement system. By observing the evolution process of the strain-field nephogram, the development characteristics of the strain field of shale specimens with the increase of load were analyzed. Due to space limitation, only the strain-field nephogram of one specimen in each group is presented here at 5%, 75% and 100% of the peak load (as shown in Figure 11).
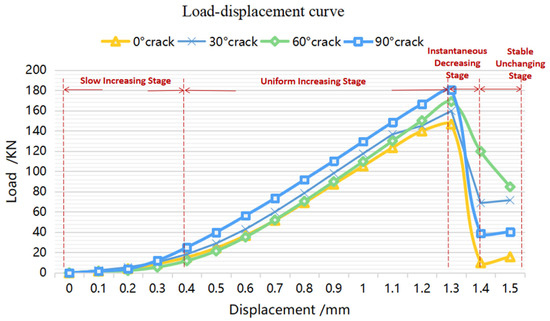
Figure 10.
Load-Displacement Curve of Shale Specimens with Different Dip Angles under Uniaxial Compression.
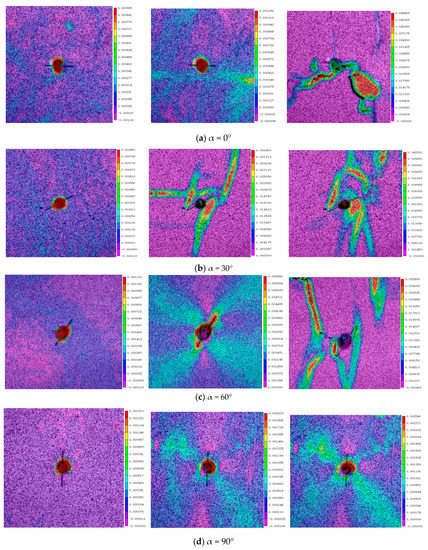
Figure 11.
Evolution of Strain Field for Samples with Cracks of Different Dip Angles.
The experimental data analysis shows the following:
(1) Under mechanical loading, the load-displacement curves of crack specimens with different dip angles are highly consistent. The results show that the holes and cracks with different angles have little influence on the load-displacement trend during compression. With the constant change of displacement, the change of load can be divided into four stages: slow increasing stage, uniform increasing stage, instantaneous decreasing stage, and stable unchanging stage.
Slow Increasing Stage of Loading: In the initial stage of compression, with the uniform change of displacement, the load increases slowly, the change rate of the load increases continuously, and the strain energy of the shale increases slowly. It can be seen from the strain cloud map at this stage that the strain in the whole field is relatively uniform and there is no high strain zone.
Uniform Increasing Stage of Loading: The load change rate tends to be stable, and with the displacement change, the load increases at a uniform speed, and the shale energy accumulates continuously. It can be seen from the strain cloud map at this stage that banded high-strain zones gradually appear around the holes and cracks, and small cracks gradually appear in the high-strain zones.
Instantaneous Decreasing Stage of Loading: When the load reaches the peak value, it reaches the compression strength limit of the shale, and the shale breaks and instantly releases energy. It can be seen from the strain cloud map at this stage that the fracture occurs along the zone of maximum strain.
Stable Unchanging Stage of Loading: The shale is broken but not completely collapsed, and there is some residual energy. In a certain displacement interval, the load tends to be stable, and the residual energy of the shale tends to be unchanged.
The brittle failure characteristics of shale are very significant. As the load increases to the peak compressive strength of rock, the specimens are mainly subjected to instantaneous split failure, accompanied by many large fractures spreading and penetrating failure, and many spalling fragments are produced. The plastic yield process is very short, and the failure stage starts instantaneously. The brittleness characteristics of shale are usually related to the type of shale, coring region, coring location, coring depth, and loading conditions.
(2) The included angle between the cracks and the stratification plane has a certain influence on the shale compression strength. With the angle between the cracks and the stratification plane increasing from small to large, the compression strength of the shale increases gradually in the front section, tends to be stable in the middle section, and then continues to increase in the back section. Among them, the shale with an angle of 0 degrees between the cracks and the stratification plane has the lowest compression strength, and the shale with an angle of 30 degrees to 60 degrees is close, and the shale with an angle of 90 degrees has the highest compression strength.
When the angle between the crack and the bedding plane is 0°, the crack is parallel to the bedding plane, and the loading direction is perpendicular to the crack. The loading has a great influence on the crack, and the damage around the crack is more likely to occur, so the compressive strength of the rock sample is relatively small. When the angle between the crack and the bedding plane is 90°, the crack is perpendicular to the bedding plane, and the loading direction is parallel to the crack. The influence of loading on the crack is small, resulting in the high compressive strength of the rock sample. When the angle between the crack and the bedding plane is 30° and 60°, there is a certain angle between the crack and the bedding plane, and the loading direction also has a certain angle between the loading direction and the crack. The influence of loading on the crack is moderate. Therefore, the compressive strength of rock samples with cracks with 30° and 60° dip angle is between that of rock samples with cracks with 0° dip angle and 90° dip angle.
(3) After the energy is released from shale cracks, the magnitude of the sudden drop of load is related to the crack morphology of shale with different crack-dip angles. The experiment shows that when the load reaches the peak, the shale with an angle of 0 degrees between the cracks and the stratification plane almost completely breaks and collapses at the moment of crack, and the load suddenly drops to a state close to no load; as well, the load reduction is about 95% of the peak load. The shale with an angle of 90 degrees between the cracks and the stratification plane has many cracks, accompanied by several large amounts of shale fragments peeling off, but it has not completely collapsed, and the load reduction is about 75% of the peak load. The shale with angles of 30 degrees and 60 degrees between the cracks and the stratification plane has many large cracks, and a small number of shale fragments is peeled off without complete collapse, and the load reduction is about 50% of the peak load.
(4) The crack initiation position and crack path of shale are closely related to the evolution of its strain field. At the initial stage of loading, the whole strain field of shale has little difference and is almost evenly distributed. In the middle stage of loading, the strain of shale cracks and surrounding areas increases first. Near the end stage of loading, the strain of cracks and surrounding areas increases near the peak value, and local stress concentration appears. In the stage of shale cracks, the crack position appears in the area with large shale strain, and the crack path roughly extends along the area with large shale strain. Eventually, the rock will break and collapse as a whole. The damage and failure behavior of shale is due to strain evolution. When the local strain reaches a certain degree, the cracking occurs first in this region, and when the strain reaches its peak, it directly leads to the fracture failure in this region. Therefore, the strain-field evolution directly affects the failure behavior.
4. Summary and Prospect
In this paper, Digital Image Correlation (DIC) technology is used to obtain the whole strain field of shale specimens with holes and cracks with different dip angles under uniaxial compression, accurately describe the dynamic evolution process of the strain field of the specimens, and analyze the behavior law of crack initiation, crack expansion and crack failure of shale specimens from the perspective of the strain-field evolution. Through the observation and analysis of a series of experimental results, it is concluded that the crack initiation position, failure forms, and evolution law of shale specimens are closely related to the evolution of the strain field.
(1) The evolution of the strain field directly affects the failure behavior of rock. Under the action of load, local high strain will first appear around the initial shale defects (pores and fractures), and stress concentration will occur. With the increase of load, the local high-strain zone will first appear cracks and failures, and the failure will spread along the region and path, and eventually lead to the overall failure of the rock.
(2) The relative position of initial rock defects (holes and cracks) and loading direction has a great influence on rock compressive strength and failure behavior. The larger the angle between the initial fracture and the loading direction, the more local high strain is likely to occur around the fracture, and the more likely the local failure is to occur, resulting in lowering the overall compressive strength of the rock.
(3) The fracture location and expansion path of shale are closely related to the evolution of the strain field. In the process of rock compression, the global strain field is not uniformly distributed, and the greater the local strain, the higher the degree of damage will be in the region. Therefore, the damage and failure behavior of rock can be predicted according to the evolution of observed strain field.
Therefore, the establishment of a description method of shale failure behavior through strain-field evolution can effectively analyze the crack behavior of shale with initial defects such as holes and cracks and provide theoretical and experimental bases for the stability evaluation of shale surrounding the well wall, shale strength prediction, and shale failure mechanism.
Author Contributions
Writing—original draft, W.L.; Project administration, Z.Q. All authors have read and agreed to the published version of the manuscript.
Funding
This work was supported by the National Natural Science Foundation of China, “Research on prediction method using multi-scale fusion of damage and instability for wellbore rock based on machine learning”; (the project number is 52274007). The key laboratory of well stability and fluid and rock mechanics in oil and gas reservoir of Shaanxi province.
Institutional Review Board Statement
Not applicable.
Informed Consent Statement
Not applicable.
Data Availability Statement
Data is contained within the article.
Conflicts of Interest
The authors declare no conflict of interest.
References
- Wen, M.L. Experimental and Numerical Simulation Study on Compressive Fracture Process of Rock-like Materials with Built-in Three-Dimensional Cracks. Master’s Thesis, Chongqing University, Chongqing, China, 2020. [Google Scholar]
- Zhang, Y.; Zou, Y.; Zhang, Y.; Wang, L.; Liu, D.; Sun, J.; Ge, H.; Zhou, D. Experimental Study on Characteristics and Mechanisms of Matrix Pressure Transmission Near the Fracture Surface During Post-Fracturing Shut-In in Tight Oil Reservoirs. J. Pet. Sci. Eng. 2022, 219, 111133. [Google Scholar] [CrossRef]
- Cheng, W.; Sun, J.; Yin, D.; Jiang, G. Research progress on wellbore instability mechanism and prediction model of deep mud shale. Drill. Eng. 2021, 48, 21–28. [Google Scholar]
- Hoek, E.; Bieniawski, Z.T. Brittle fracture propagation in rock under compression. Int. J. Fract. 1965, 1, 137–155. [Google Scholar] [CrossRef]
- Lajtai, E.Z. Brittle fracture in compression. Int. J. Fract. 1974, 10, 525–536. [Google Scholar] [CrossRef]
- Lin, P.; Wong, R.H.C.; Wang, R.-K.; Zhou, W.-Y. Crack growth mechanism and failure behavior of specimen containing single flaw with different angles. Chin. J. Rock Mech. Eng. 2005, 24, 5652–5657. [Google Scholar]
- Yang, S. Study on strength failure and crack propagation characteristics of sandstone with three intermittent fractures. Rock Soil Mech. 2013, 1, 31–39. [Google Scholar]
- Xu, J.; Li, Z. Crack Propagation and Coalescence of Step-Path Failure in Rocks. Rock Mech. Rock Eng. 2019, 52, 965–979. [Google Scholar] [CrossRef]
- Liu, X.; Yin, Z.; Wang, Y. Mechanical properties and failure mode of rock mass containing V-type intersecting fissures(Article). Meitan Xuebao/J. China Coal Soc. 2020, 45, 651–659. [Google Scholar]
- Dong, L.; Zhang, Y.; Sun, D.; Chen, Y.; Tang, Z. Stage characteristics of acoustic emission and identification of unstable crack state for granite fracture. Chin. J. Rock Mech. Eng. 2022, 41, 120–131. [Google Scholar]
- Li, T.C.; Lv, H.B.; Wang, H. CT real-time scanning tests on double cracks propagation under uniaxial compression. Rock Soil Mech. 2010, 31, 9–14. [Google Scholar]
- Zhao, Y.; Huang, J.; Hou, J.; Wang, R. Experimental observation of rock meso-fracture and its implications for understanding seismic activity. Chin. J. Geophys. 1995, 5, 627–636. [Google Scholar]
- Chu, T.C.; Ranson, W.F.; Sutton, M.A. Applications of digital-image-correlation techniques to experimental mechanics. Exp. Mech. 1985, 25, 232–244. [Google Scholar] [CrossRef]
- Peters, W.H.; Ranson, W.F. Digital Imaging Techniques In Experimental Stress Analysis. Opt. Eng. 1982, 21, 213427. [Google Scholar] [CrossRef]
- Shi, Y.; Blaysat, B.; Chanal, H.; Grédiac, M. Designing Patterns for DIC with Poisson Image Editing. Exp. Mech. 2022, 62, 1093–1117. [Google Scholar] [CrossRef]
- Wang, C.; Wang, S.; Xie, L.; Liu, Y.; Deng, J.; He, W. Fatigue crack growth behavior of marine steel under variable amplitude loading-combining DIC technique and SEM observation. Int. J. Fatigue 2023, 170, 107508. [Google Scholar] [CrossRef]
- Abbassi, F.; Ahmad, F. Behavior analysis of concrete with recycled tire rubber as aggregate using 3D-digital image correlation. J. Clean. Prod. 2020, 274, 123074. [Google Scholar] [CrossRef]
- Mata-Falcón, J.; Haefliger, S.; Lee, M.; Galkovski, T.; Gehri, N. Combined application of distributed fibre optical and digital image correlation measurements to structural concrete experiments. Eng. Struct. 2020, 225, 111309. [Google Scholar] [CrossRef]
- Gehri, N.; Mata-Falcon, J.; Kaufmann, W. Refined extraction of crack characteristics in large-scale concrete experiments based on digital image correlation. Eng. Struct. 2022, 251, 113486. [Google Scholar] [CrossRef]
- Meng, S.; Jiao, C.; Ouyang, X.; Niu, Y.; Fu, J. Effect of steel fiber-volume fraction and distribution on flexural behavior of Ultra-high performance fiber reinforced concrete by digital image correlation technique. Constr. Build. Mater. 2022, 320, 126281. [Google Scholar] [CrossRef]
- Eichhorn, G.N.; Bowman, A.; Haigh, S.K.; Stanier, S. Low-cost digital image correlation and strain measurement for geotechnical applications. Strain 2020, 56, e12348. [Google Scholar] [CrossRef]
- Arza-García, M.; Núez-Temes, C.; Lorenzana, J.A.; Ortiz-Sanz, J.; Castro, A.; Portela-Barral, M.; Gil-Docampo, M.; Bastos, G. Evaluation of a low-cost approach to 2-D digital image correlation vs. a commercial stereo-DIC system in Brazilian testing of soil specimens. Arch. Civ. Mech. Eng. 2022, 22, 4. [Google Scholar] [CrossRef]
- Plé, O.; Tourabi, A.; Abuaisha, M.S. 3-Dimensional Digital Image Correlation for Strains Determination in Clayey Soil. Appl. Mech. Mater. 2013, 353–356, 463–466. [Google Scholar] [CrossRef]
- Wang, W.; Ye, Y.; Wang, Q.; Hu, N. Experimental Study on Anisotropy of Strength, Deformation and Damage Evolution of Contact Zone Composite Rock with DIC and AE Techniques. Rock Mech. Rock Eng. 2022, 55, 837–853. [Google Scholar] [CrossRef]
- Cheng, Y.; Song, Z.; Yang, T.; Han, J.; Wang, B.; Zhang, Z. Investigation on aging deformation and damage mechanics characteristics of layered hard sandstone based on digital image correlation (Dic) technology. SSRN Electron. J. 2022, 8–9. [Google Scholar] [CrossRef]
- Miao, S.; Pan, P.-Z.; Li, S.; Chen, J.; Konicek, P. Quantitative fracture analysis of hard rock containing double infilling flaws with a novel DIC-based method. Eng. Fract. Mech. 2021, 252, 107846. [Google Scholar] [CrossRef]
- Xu, J.; Song, X.Z.; Peng, S.J.; Chen, C.C.; Ran, X.M.; Yan, F.Z. Experimental study of generalized stress relaxation of rock based on 3D-DIC technology. Rock Soil Mech. 2021, 42, 27–38. [Google Scholar]
- Zhang, K.; Qi, F.F.; Chen, Y.L. Deformation and fracturing characteristics of fracture network model and influence of filling based on 3D printing and DIC technologies. Yantu Lixue/Rock Soil Mech. 2020, 41, 2555–2563. [Google Scholar]
- Song, Y.; Jiang, Y.; Ma, S.; Yang, X.B.; Zhao, T. Evolution of deformation fields and energy in whole process of rock failure. Yantu Lixue/Rock Soil Mech. 2012, 33, 1352–1356. [Google Scholar]
- Zhu, Q.; Li, D.; Li, X. Experimental study on failure and mechanical characteristics of marble containing a prefabricated elliptical hole. Chin. J. Rock Mech. Eng. 2019, 38, 2724–2733. [Google Scholar]
- Vanderesse, N.; Richter, A.; Nuno, N.; Bocher, P. Measurement of deformation heterogeneities in additive manufactured lattice materials by digital image correlation: Strain maps analysis and reliability assessment. J. Mech. Behav. Biomed. Mater. 2018, 86, 397–408. [Google Scholar] [CrossRef]
- Alhakim, G.; Núñez-Temes, C.; Ortiz-Sanz, J.; Arza-García, M.; Jaber, L.; Gil-Docampo, M.L. Experimental application and accuracy assessment of 2D-DIC in meso-direct-shear test of sandy soil. Measurement 2023, 211, 112645. [Google Scholar] [CrossRef]


Disclaimer/Publisher’s Note: The statements, opinions and data contained in all publications are solely those of the individual author(s) and contributor(s) and not of MDPI and/or the editor(s). MDPI and/or the editor(s) disclaim responsibility for any injury to people or property resulting from any ideas, methods, instructions or products referred to in the content. |
© 2023 by the authors. Licensee MDPI, Basel, Switzerland. This article is an open access article distributed under the terms and conditions of the Creative Commons Attribution (CC BY) license (https://creativecommons.org/licenses/by/4.0/).