Abstract
Climate change is one of the most essential phenomena studied by several researchers in the last few decades. The main reason this phenomenon occurs is greenhouse gases (GHG), chiefly CO2 emissions. About 30% of the created GHG emissions are achieved by electricity generation. This article investigates the role of renewable energy projects in Jordan, specifically wind and solar energy, in mitigating climate change and water consumption reduction using RETScreen software. It was found that the cumulative water consumption reduction from 2017 to 2021 due to the use of wind and solar projects is equal to 6.9491 × 10⁹ gallons. Finally, the results show that the future dependence on renewable energy projects in Jordan to meet the growth in demand by the year 2030 reduces the expected increment in the climate temperature by 1.047 °C by that year.
1. Introduction
Over the past few decades, scientists have extensively relied on climate models to forecast global climate change. These models illustrated that when the levels of greenhouse gases (GHG), like carbon dioxide, rise in the atmosphere, the corresponding earth’s surface temperature, as a result, rises. The justification of this observation is that when the GHG increases in the atmosphere, most fallen solar radiation will be trapped and suppressed. This causes more longwave radiation to be absorbed in the atmosphere. Accordingly, this leads to an increase in the average temperature of the surface where the GHG exists in abundance [1].
Climate change is widely accepted as a scientific fact that requires immediate action to prevent its negative effects, minimize economic damage, and prevent catastrophe and crisis. It is considered one of the most significant issues facing the world as it poses a threat to human survival and future prosperity [2]. Moreover, climate change, directly and indirectly, impacts mental health [3].
These days, the attention of research is oriented toward investigating the effects of climate change on the whole life aspects. However, there is still a lack of agreement on how to transition to low-carbon societies and economies, which is essential for the survival of humanity, avoiding business risk, and promoting economic growth.
Long-term exposure to risks associated with climate change can lead to several issues. Climate change is a widely recognized and discussed problem, both in academic circles and in society as a whole. Recently, the term “climate change” has been frequently used in everyday conversations and research papers. It has been an ongoing issue and has a significant direct or indirect impact on many aspects of human life. As a global problem, climate change has generated significant concern among countries worldwide. This study discusses the topics of climate change, corresponding temperature raising, renewable energy’s role in minimizing CO2 percentage, and water consumption reduction due to the replacement of fossil fuel with renewable energy projects.
1.1. Climate Change Occurrence Due to CO2 Release
By and large, anthropogenic activities, headed by burning fossil fuels, are causing an increase in carbon dioxide (CO2) concentration in the atmosphere. CO2, like other greenhouse gases, absorbs long-wave radiation from the Earth. Consequently, when there is an increase in the concentration of these gases, it results in the trapping of heat waves and leads to an increase in the temperature of the earth [4]. To put it simply, this process is illustrated in Figure 1a.
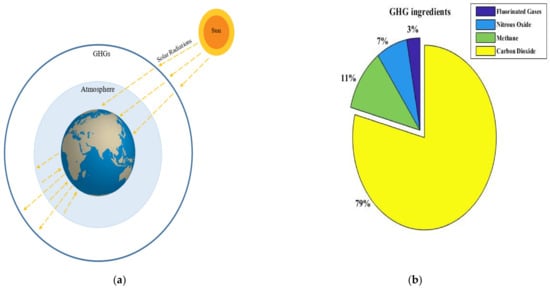
Figure 1.
(a) Trapping the solar radiation due to the existence of GHG, (b) percentages of GHG ingredients.
In addition to the rise in average surface air temperature, scientists predict several other responses due to the increase in the GHG concentration, such as an increase in global mean rates of precipitation and evaporation, rising seas level, and changes in the biosphere. These predictions are based on computer models that simulate basic earth processes. Anyway, the main GHG that has increased during the industrial period are carbon dioxide (CO2), methane (CH4), nitrous oxide (N2O), chlorofluorocarbons CFC-11 (CC13F), and CFC-12 (CC12F2) [5]. Figure 1b clarifies the percentages of these gases among the GHG [6]. These two gases play a significant role in the increase of temperature on Earth [7].
The term “greenhouse” refers to trapping solar radiation in the atmosphere, resulting in higher average temperatures. Among the greenhouse gases, carbon dioxide (CO2) is the most notable because of its long lifespan in the atmosphere and the large amounts released through human activities. Efforts to reduce these emissions through “climate change mitigation” actions can potentially make a significant impact [8].
1.2. Fossil Fuel Contribution to Climate Change
According to the Intergovernmental Panel on Climate Change (IPCC) Working Group III (WG3), global GHG emissions sources are typically categorized into several sectors such as energy systems, industry, buildings, transport, and AFOLU (agriculture, forestry, and other land uses) [9]. In more detail, the contribution of each sector is clarified in Figure 2 [10].
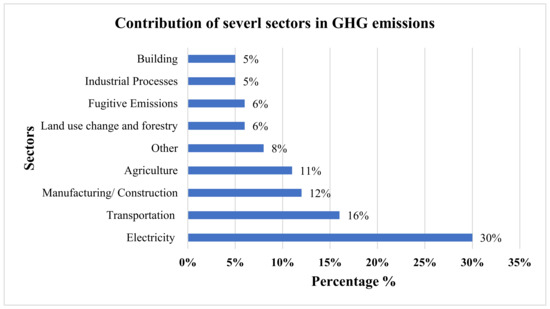
Figure 2.
Emissions of GHGs based on each sector.
Electricity is commonly produced by burning fossil fuels that release waste gases, known as combustion products, into the atmosphere. The most significant combustion product is carbon dioxide (CO2), a colorless and odorless gas. Since the beginning of the industrial revolution, the levels of CO2 in the Earth’s atmosphere have been increasing and are linked to the burning of fossil fuels by humans.
CO2 absorbs infrared radiation and traps heat, leading to the warming of the atmosphere and disrupting the global climate. This physics is well understood and has been for centuries. The geological record also shows clear examples of past climate changes that are correlated with changes in the concentrations of carbon dioxide and other heat-trapping gases in the atmosphere [8]. Despite some claims to the contrary, the science is clear, the evidence is overwhelming, and the connections are apparent. In Jordan, fossil fuel is the dominant source, headed by natural gas [11], for electricity generation, which jeopardizes the ecological balance and human health due to its harmful impacts.
Global fossil CO2 emissions have risen steadily since the beginning of the 21st century, primarily due to increased emissions from China, India, and other countries. The COVID-19 pandemic caused a slowdown in the global economy during the first half of 2020, which led to a temporary decrease in global CO2 emissions, but in 2021, the emissions rebounded. The estimates for 2021 from EDGAR indicated that global human-caused fossil CO2 emissions increased by 5.3% from 2020, reaching 37.86 Gt CO2, which is only 0.36% less than the 37.99 Gt CO2 emissions recorded in 2019 [12].
The burning and use of fossil fuels for energy and transportation have resulted in the release of large amounts of carbon dioxide and methane, significant contributors to greenhouse gases. The increasing emissions from fossil fuels have also led to a rise in average global temperatures of 1.1 °C since preindustrial times. The Intergovernmental Panel on Climate Change has stated that immediate action is necessary to limit global warming to 1.5 °C and prevent severe consequences [13]. Accordingly, based on Figure 2, it can be noticed that electricity contributes to GHG emissions has the largest percentage. Hence, it is necessary to encourage and promote electricity generation from other clean sources. CO2 emissions due to fossil fuel burning are the major cause of climate change human-induced. Over long periods, these emissions have either risen or lowered over timescales in several countries, Figure 3 depicts several scenarios where in some countries, the emissions were tackled and reduced, while in other countries, the CO2 emissions are increasing continuously, and in the rest of countries, the CO2 emissions were reduced then risen again [14,15].
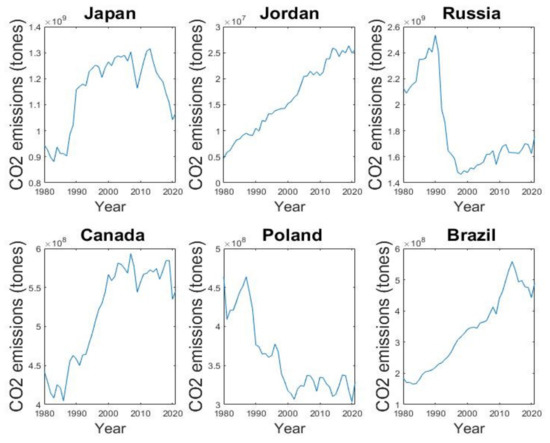
Figure 3.
CO2 emissions in some countries.
Fossil fuels, encompassing coal, oil, and natural gas, have been the predominant energy source for centuries. However, these energy sources entail significant drawbacks concerning the environment, economy, and public health. Consequently, there has been a recent shift towards renewable energy sources. The combustion of fossil fuels emits substantial quantities of carbon dioxide and other greenhouse gases into the atmosphere, contributing to climate change and global warming. The repercussions of these transformations are becoming increasingly apparent, including the escalation of sea levels, extreme weather events, and the decline of biodiversity.
Additionally, the extraction, transportation, and combustion of fossil fuels can cause substantial harm to the environment, such as oil spills and air pollution, which detrimentally affect ecosystems and human well-being. Recognizing these adverse impacts, the world is embracing renewable energy alternatives like solar, wind, hydro, and geothermal. These sources present numerous advantages, including cleaner energy production, reduced emissions of GHG, and improved air quality which justify the orientation into renewable energy sources [14,15].
Several recent studies investigated environmental topics from several points of view, which are clarified in Table 1.

Table 1.
Summary of some related works.
In this study, the main contributions based on the gaps of the previous ones, which align in the same field of research, are summarized in the following points:
- This study investigates the amount of the mitigated amount of CO2 due to producing electricity from wind and solar PV projects in Jordan, accordingly estimating the mitigated rising in temperature.
- The water consumption reduction due to cooling—the free phase in wind and solar PV projects is also discussed.
- Providing a section that clarifies the future situation based on covering the demand for renewable energy projects.
This paper is divided into six major sections starting from the introduction, which provides some knowledge regarding the observed phenomenon, climate change, in addition to providing a table that clarifies a literature survey that consists of the recent studies that investigated (1) climate change phenomenon, (2) water scarcity issues, or (3) both. In the immediate next section, the role of renewable energy sources is visualized, followed by a section that discusses the water consumption reduction in case of replacing the traditional energy sources with clean energy sources. Afterwards, the implemented methodology in this paper is clarified. Next, the obtained results regarding both the temperature rising avoidance estimation and water consumption reduction were involved in the penultimate section. And finally, the last section shows the role of renewable energy sources in the future from both temperature rising avoidance and water consumption reduction, assuming that the demand growth will be covered by wind and PV farms.
2. Role of Renewable Energy in CO2 Reduction
This section emphasizes the role of Renewable Energy Technologies (RETs) in reducing GHG emissions, which is a critical subject in addressing climate change. Research has shown that increasing the use of RETs, such as hydropower, solar, wind, biogas, etc. [37], will decrease GHG emissions. Many countries worldwide are placing a significant emphasis on renewable energy sources due to the detrimental effects of GHG emissions from non-renewable energy sources on the environment. Energy generation based on RETs is the backbone of CO2 emissions reduction, health and environmental complications associated with fossil fuel pollutants [38].
The relationship between renewable energy and climate change is closely linked. Studies have shown that renewable energy can have a positive impact on reducing the effects of climate change. Renewable energy sources decrease carbon emissions in the atmosphere and improve living standards. As such, it is often used as a policy tool to address climate change and plays a vital role in strategies for adapting to it [39].
Around the world, there is a trend toward using renewable energy sources to address environmental problems caused by climate change. RETs have become a common way to adapt to a changing climate and reduce the emissions of greenhouse gases in countries that are both developed and developing [40]. RETs not only help to reduce GHG emissions but also decrease the dependence on natural resources like forests, reduce air pollution, and have a less negative impact on the environment [41].
Jordan is a country with abundant renewable energy sources and an incubator for a wide range of renewable energy projects extending from just a few kW to thousands of kW. Figure 4a shows the distribution of wind and solar PV projects in Jordan [42], which is an evidence that this country gears its policies to expand its inexhaustible energy sources for energy harvesting and generating, accordingly reducing its dependency on fossil fuel. However, Figure 4b,c show the photovoltaic power potential in conjunction with the average wind speed at the height of 100 m in Jordan respectively [43,44].
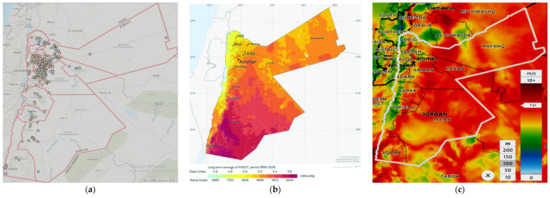
Figure 4.
(a) Distribution of renewable energy project in Jordan, (b) photovoltaic power potential in Jordan, and (c) mean wind speed in Jordan at a height of 100 m.
By a cursory glance at the previous figures, it is manifest that Jordan owns a lush amount of radiation and wind speed throughout the year, making it a fertile country to implement solar and wind energy projects. Jordan recognizes the prompt need to combat the climate change phenomenon. Therefore, it sets ambitious goals and targets to minimize CO2 emissions through renewable energy projects development. Hereby, by investing in renewable energy, Jordan is not merely minimizing the cost of electricity generation but also reducing the CO2 emissions generally caused by burning fossil fuel, as clarified in the previous section.
In recent years, renewable energy uptake in Jordan has been gaining momentum as the nation aims to diversify its energy sources, decrease dependence on imported fossil fuels, and mitigate the environmental impact of conventional energy generation. For instance, Jordan possesses abundant solar resources and has significantly emphasised solar energy as part of its renewable energy initiatives. The country has invested in large-scale solar projects, including the Shams Ma’an Solar Power Plant, one of the largest solar facilities in the Middle East [45]. The government has also introduced policies encouraging installing rooftop solar systems, such as net metering and feed-in tariffs.
Moreover, Jordan is actively exploring the potential of wind energy. The country has established wind farms in areas with favorable wind conditions, such as the Tafila Wind Farm, boasting a capacity of 117 MW. Jordan intends to develop its wind energy sector further and has identified several locations for future wind farm projects. And finally, Jordan has implemented supportive policies and regulations to stimulate investments in renewable energy. Similarly, as stated in [46,47] Jordan was declared one of the top three emerging markets in renewable energy investment in 2018.
It is worth mentioning that even renewable energy technologies emit some CO2 that is ignorable when compared with fossil fuel. Figure 5 compares the amount of CO2 emissions from using several types of energy sources, renewable and non-renewable [48]. In other words, renewable energy sources are not totally CO2 free. Based on Figure 5, it is unequivocal that coal is the worst energy source from CO2 emissions aspect as it emits an immense amount of tCO2 per GWh, followed by oil, which stands between coal and natural gas, with a difference of only 153 tCO2 per GWh lower than that of the coal.
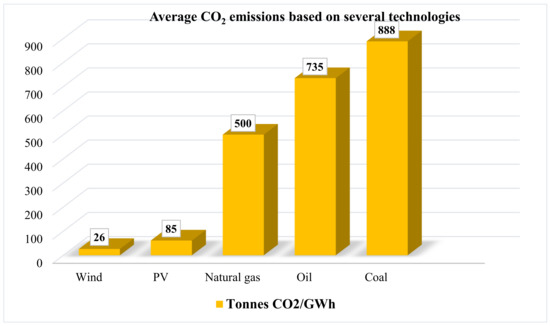
Figure 5.
CO2 emissions are caused by several technologies.
Similarly, regarding natural gas, the prevailing energy source in Jordan, it is plain that it is the inferior type of traditional energy source from a CO2 emitting point of view compared to the aforementioned traditional energy sources. Even though the consistent usage of these fossil fuel resources devastates and spoils the environment.
On the other hand, the stance of renewable energy sources shows its competent and eco-friendly trends where a plummet of CO2 emissions per GWh is recorded by generating electricity from renewable energy sources compared with the traditional ones, where solar PV projects and wind projects emit only 0.17 and 0.052 of tCO2 that is emitted from natural gas respectively.
In the current decade, Jordan promoted renewable energy technology as it relies strongly on energy importing from neighboring countries.
Thus, it is, hitherto, vulnerable and exposed to the fluctuation in global energy prices. The booming of solar and wind energy projects in Jordan can be visualized by understanding the amount of electrical energy purchased by these two renewable sources in Jordan (GWh), as prominent in Figure 6 [49]. Consequently, Jordan made significant efforts to tackle the aforementioned issue, summarized by establishing several RE projects where the contribution of the wind and solar PV projects, combined, in terms of the electrical energy purchased from these two sources, are clarified in Figure 6. In contrast, Figure 7 represents the separate contribution of each type from 2017 to 2021. However, several renewable energy projects were constructed in Jordan, as clarified in Figure 8, in conjunction with their corresponding AC capacities [11,50,51], which is the springboard of this research, and it is worthy to mention that these listed projects are the most known ones in Jordan.
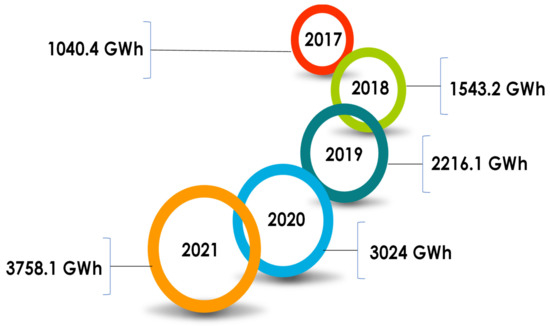
Figure 6.
Combined electrical energy purchased from solar and wind energy in Jordan (GWh).
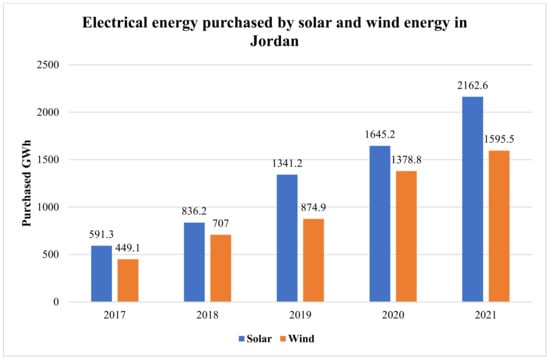
Figure 7.
Detailed electrical energy purchased by solar and wind energy in Jordan (GWh).
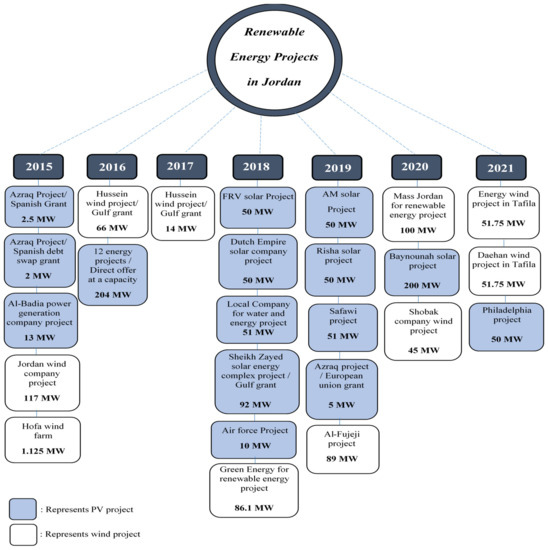
Figure 8.
Renewable energy (wind and solar) ventures in Jordan found between 2015 and 2021.
Jordan possesses a diverse array of renewable energy sources that are utilized for electricity generation and hold the potential to diminish GHG emissions substantially. Adopting these renewable energy sources in Jordan significantly reduces GHG emissions [52]. By replacing traditional fossil fuel-based electricity generation, renewable energy sources aid in mitigating climate change by minimizing the release of carbon dioxide (CO2) and other GHG into the atmosphere. A study conducted by [32] shows that regarding the advancement of renewable energy resources, the strategic approach highlighted the necessity of implementing a renewable energy law, attracting private sector investments, and establishing a dedicated fund to bolster renewable energy initiatives. The beginning of the “Renewable Energy and Energy Efficiency Law” (RE & EE) in 2012 (Law No. 13 of 2012) marked a significant and indispensable initial stride towards the expansion of renewable energy projects within the kingdom. However, the RE & EE Law lacked clarity regarding the expenses of integrating renewable energy projects into the national grid. It failed to provide a definitive pricing framework for feed-in tariffs.
One of the pivotal findings from [32] emerged from the interviews, wherein participants revealed many conflicts pertaining to Jordan’s energy sector, which pose significant challenges to the long-term sustainability of energy security across various dimensions. These conflicts were not discernible by examining policies, governmental reports, or desk research. Notably, all interviewees expressed a collective preference for transitioning towards a future energy composition primarily driven by renewable sources, particularly solar and wind energy, complemented by a requisite proportion of conventional energy sources, namely imported natural gas and domestic oil shale.
3. Water Consumption Reduction Due to Fossil Fuel Replacement
Water plays a kernel role in electricity generation, and it has been claimed that producing electricity is deemed a bleeding driver of water scarcity and stress in Jordan. The main cause of this situation is due to exacerbated rate of population growth in addition to the climate change phenomenon [53]. Jordan is classified as one of the poorest countries in water resources worldwide. As a result, it meets significant crises and challenges in matching the water demand and the available resources.
The scarcity of water resources is the ultimate challenge that is met nowadays in Jordan since, based on per capita, the assigned quantity of water indicates that Jordan owns the lowest level of water resources globally. Although a few surface water resources are present in Jordan, collectable rain is the major source of water [54]. Unfortunately, the evaporation rate in Jordan, which is clarified in Figure 9, is relatively high, and this decimates water resources [55].
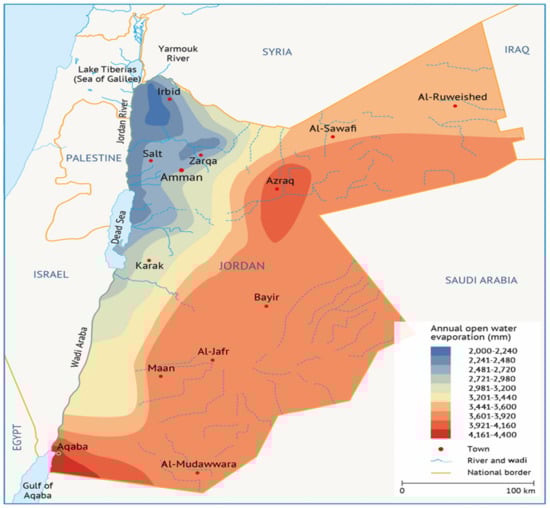
Figure 9.
The annual rate of water evaporation in Jordan.
The lion’s share of water consumption in Jordan goes to the agriculture sector. However, this sector contributes up to merely 3% of the gross domestic product (GDP), where almost 51% of the water resources go for irrigating purposes [56].
To tackle the water scarcity challenges, the government implemented several measures to manage and conserve water resources. For instance, it promoted improving the irrigation process, conducting research regarding wastewater and desalination treatment plants, and encouraging water-saving technologies. However, despite these put exertion, the unbalance situation of water in Jordan remains in dire need of ongoing efforts from both individuals and governments.
Water policies and strategies in Jordan play a vital role, given the country’s limited water resources and growing challenges related to water scarcity. For instance, Jordan faces significant water scarcity challenges due to its limited freshwater resources and rapidly growing population. The country contends with issues such as water scarcity, droughts, and the depletion of groundwater aquifers. Regarding the national water strategy, Jordan has developed a comprehensive National Water Strategy as a roadmap for sustainable water management. The strategy prioritizes increasing water supply, enhancing water efficiency and conservation, and strengthening water governance and institutional frameworks. In response to the scarcity of freshwater resources, Jordan has increasingly explored desalination as an alternative water source. The country has implemented desalination projects, including the Red Sea-Dead Sea Water Conveyance Project, which aims to desalinate seawater from the Red Sea and provide fresh water to the Dead Sea region [32].
And regarding water demand management, Jordan greatly emphasises water demand management strategies to reduce water consumption. These strategies include promoting water-saving technologies, raising awareness about water conservation practices, and implementing water pricing reforms to encourage efficient water use.
Efficient water usage and addressing water scarcity are significant concerns in the Jordan Valley, particularly agriculture. This region holds significant agricultural importance in Jordan, prompting the government and various organizations to undertake strategies and initiatives to resolve water management challenges in this sector [35]. The formulation of policies, regulations, and projects on water usage in agriculture, including pumping practices, falls under the jurisdiction of the Ministry of Water and Irrigation in Jordan and other relevant government entities. Their objectives encompass the promotion of sustainable water management, the advancement of irrigation techniques, and the enhancement of water-use efficiency within the agricultural domain. For instance, a project carried out by the National Energy Research Centre (NERC), Jordanian Ministry of Environment, Renewable Energy and Energy Efficiency program involved the inefficient electrical and diesel irrigation pumps substituted with Photovoltaic PV solar energy in the Jordan Valley, southern valleys, and highlands (including Azraq, Mafraq, and Madaba). A total of 214 water pumps in the Jordan Valley and southern valleys, as well as 106 pumps in the highlands, are affected by this replacement. The water pumps in the Jordan Valley and Southern Aghuar are responsible for drawing water from irrigation ponds on the farms. These irrigation pumps are supplied with water from the King Abdallah Canal via a pumping station and a gravity inlet owned and operated by the Jordanian Valley Authority (JVA) [57].
Using cooling water in thermal power plants has led to difficulties in managing water resources and determining how to distribute water fairly in various areas recently [58]. Approximately half of the water used in the United States and Western Europe is for energy production, mainly for cooling. In China, the majority of water withdrawals, at 84%, are for thermoelectric power generation, mostly used in coal-fired power plants. Worldwide, around 10% of water withdrawals are used for energy production. Along with cooling, some water is also used in fuel extraction, processing, and transportation for electricity generation [59]. While there is no need for water in renewable energy projects compared with the required amounts in thermal power plants. A massive amount of water is needed in power plants that use natural gas, oil, coal, and other sources. Figure 10 clarifies the average amount of water required by each energy source [60]. A study conducted by [33] stated that Water resources in Jordan can be classified into two main categories: conventional and unconventional. Conventional water sources encompass groundwater, rivers, and streams (including base flow and flood flow), while unconventional resources include treated wastewater, brackish water, and desalinated water. The primary source of water in Jordan is highly variable seasonal rainfall. However, substantial rainfall (exceeding 200 mm/year) is predominantly restricted to the highlands in the country’s northwestern region. Approximately 5% of the rainfall infiltrates the ground, replenishing the groundwater aquifers, while a slightly smaller portion transforms into direct flood flow. More than 90% of the annual rainfall is lost through evapotranspiration. Besides local water resources, the contribution from regional watercourses and transboundary groundwater flow significantly adds to the country’s renewable water resources.
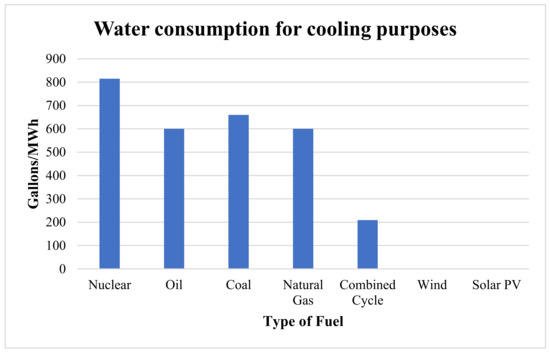
Figure 10.
The amount of required water for cooling purposes in power plants.
4. Methodology
The approach of studying the relationship between climate and space-time is an interesting method. It is relatively comprehensive compared to methods that only focus on temperature or precipitation, as it allows for a more complete understanding of spatiotemporal climate patterns. This approach provides a more concrete and relatable understanding of projected future climate instead of just abstract projections. Using this method, it is possible to observe the projected future climate at many locations worldwide, in a different location that currently experiences similar conditions. This research has been carried out by applying eight main steps, represented in Figure 11.
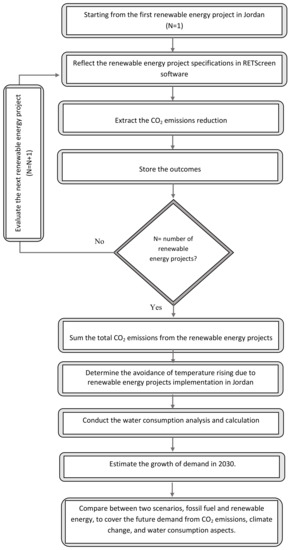
Figure 11.
Steps of conducting the research.
These steps can be summarized by estimating the amounts of CO2 reduced due to generating electricity from wind and PV technologies since, as mentioned before, the CO2 emissions from RE projects are much lower than that of fossil fuel sources. The estimation of CO2 reduction has been carried out with the aid of RETScreen software, as clarified in the following subsection. Afterwards, estimate the temperature is avoided by dint of the mentioned RE projects. The penultimate step is to discuss how these projects contribute to reducing water consumption as they do not require a cooling phase. Finally, the demand in 2030 will certainly increase due to the population increase, and the growth in demand will be assumed to be covered by the RE projects, keeping in mind that the existing traditional power plants will still work in parallel with the RE projects.
In this paper, a particular software has been used to estimate the reduction in CO2 emissions due to implementing renewable energy projects, RETScreen. The RETScreen software is a promising tool to facilitate the feasibility and pre-feasibility analysis for renewable energy technologies. It is considered the quickest tool to estimate the viability of a potential renewable energy project. Moreover, several aspects are involved within this software, such as evaluating the energy production, life-cycle costs and gas emissions reduction for central-grid, and off-grid projects, ranging in size from large-scale to small-scale systems and for various types of renewable energy technologies. This software is used by several positions, such as funders and lenders, regulators and policymakers, consultants and product suppliers, planners, developers, and owners.
RETScreen involves several worksheets (location, Facility, Energy, Cost, Emissions, Finance, Risk, …etc.). The attention of this paper is geared toward focusing on CO2 reduction.
The GHG analysis portion is provided to help the user to estimate the GHG, certainly CO2 gas, mitigation potential by the candidate project. This optional portion determines the annual reduction in the tCO2 from using the proposed renewable energy technology instead of the base case technology (fossil fuel).
The tCO2 emissions reduction potential is found simply by combining the difference of the GHG emission factors with other information determined by RETScreen by its built-in mathematical formulas, such as the annual energy delivered by the proposed project.
The annual tCO2 emissions reduction is estimated based on the following formula [61]:
where ebase is defined as the base case GHG emission factor, while eprop is the term of the proposed case GHG emission factor, Eprop is the proposed case annual electricity produced, λprop is the fraction of electricity lost in transmission and distribution (T&D) for the proposed project, and finally, ecr is the GHG emission reduction credit transaction fee. The user will not deal will this formula as it is a built-in one. On the other hand, the location of the investigated project, irradiation, wind speed, and the capacity of the proposed system will be considered and transferred into the tCO2 reduction emissions.
5. Results and Discussion
5.1. Temperature Rising Avoidance Estimation
As mentioned, the RETScreen environment has been used to analyze CO2 emissions. The tCO2 reduction is achieved by comparing the energy that can be produced from the renewable energy projects with the base case, where the base case is the generation of electricity by a certain type of traditional energy source (fossil fuel) that the user selects.
For more clarification, the tCO2 that would be reduced due to energy generation from renewable energy projects will be assumed to be generated using a particular fossil fuel type.
Based on the RETScreen environment, 100 tCO2 can be translated into several equivalent quantities, which are clarified in Table 2. Accordingly, the outcomes of tCO2 reduction for the aforementioned wind and solar farms obtained from RETScreen are clarified and reflected in Table 3.
Table 2.
Equivalents to 100 tCO2.
Table 3.
Reflected tCO2 emissions equivalents for the investigated wind and PV farms in Jordan.
However, it is necessary to shed light on a certain point regarding the emissions, where several factors play a major role in achieving minimal CO2. For instance, more than two projects may have the same capacities but with an uneven amount of reduced CO2. The justification for this likely observation is the locations of the projects. Assuming two solar PV projects with the same capacities were constructed in two distinct locations, the corresponding emissions for each will not be matched since the solar irradiation in each location has its profile.
Therefore, the corresponding energy to be produced from the two projects will differ, and as a result, the expected emissions will be varied from one project to another. In addition, another factor that affects the productivity of any project is the cleanness of the panels since dust accumulation hinders the conversion process from solar energy into electricity. So, to sum up, projects with the same capacities may not contribute identically from a CO2 emissions point of view.
Table 3 shows the equivalents of the estimated reduced amount of tCO2 in terms of cars and Light trucks not used, liters of gasoline not consumed, barrels of crude oil not consumed, people reducing energy use by 20%, acres of forest absorbing carbon, hectares of forest absorbing carbon, tons of waste recycled. The lower amounts of the previously mentioned things, the lower pollution, the lower gas emissions due to the combustion process, and accordingly, the lower climate change observation.
Based on Table 3 and amongst the investigated projects, it is manifest that the expanded Maan wind project and Baynounah solar project stand ahead of the rest. In terms of achieving our goals and making a significant impact, these two projects are rising above all others, proving themselves to be the Titans. In other words, while all the projects were commendable and impressive in their own right, these two aforementioned projects rose above the fray, delivering unparalleled value and impact. Figure 12 and Figure 13 show the tCO2 reduction from the expanded Maan wind project and Baynounah solar project, respectively.

Figure 12.
tCO2 reduction from the expanded Maan wind project.
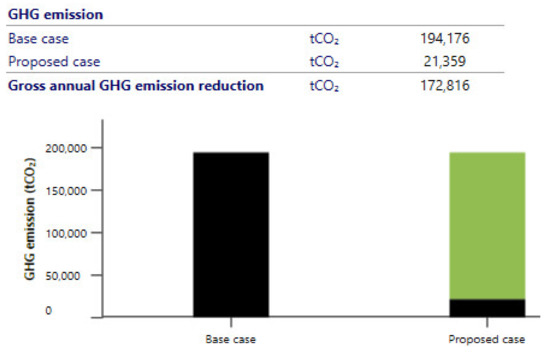
Figure 13.
tCO2 reduction from Baynounah solar project.
As mentioned before, the core of the climate change phenomenon that is met nowadays is the increase in CO2 emissions due to several activities conducted by several sectors. Based on Table 3, it is plain that the yearly reduction in tCO2 due to replacing the traditional energy sources by wind projects equals 753,302, while the tCO2 reduction from PV projects equals 674,213. The overall mitigated carbon dioxide due to renewable energy projects equals 14,27,515 = 1.427,515 Mt. Hereby, to understand the role of renewable energy projects in climate stabilization, the plot of this research lies in assuming that the amount of mitigated CO2 is not mitigated and produced from fossil fuel for electricity generating.
Table 4 links the average temperature with the corresponding CO2 emissions during the same year in Jordan. It is worth mentioning that these listed amounts of megatons (Mt) of CO2 are due to electricity generated from fossil fuels. The aim of linking the temperature with the emitted CO2 from fossil fuel on the same plot is to estimate an equation that can be used to study to which level the existence of CO2 affects the temperature rising in Jordan. Figure 14 and Figure 15 clarify the situation of temperature increment, based on the data inserted in Table 4, in case the CO2 emissions were not controlled. The temperature increases along with time as CO2 emissions increase continuously. The average temperature and the CO2 emissions are linked together, where the CO2 emissions are the causing factor of temperature rising. In other words, the increase in temperature is a function of the CO2 emissions from fossil fuel burning for electric energy generating purposes.
Table 4.
Average temperature [62] and CO2 emissions in Jordan [63].
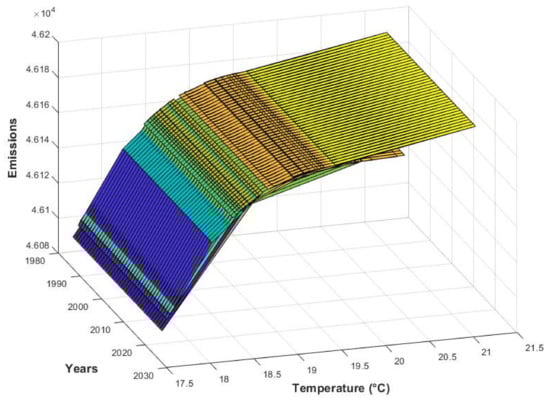
Figure 14.
Clarification of how the emissions and the temperature increases with time.
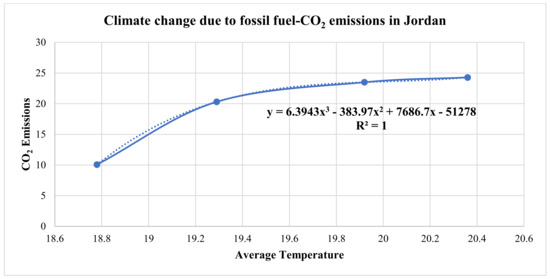
Figure 15.
Climate change in Jordan due to CO2 emissions.
Furthermore, based on Table 4 it can be noticed that the increment in both CO2 emissions as well average temperature jumped obviously from 1990 to 2005 as in this period, RETs environment was not existed in Jordan as these days, which justifies the usage of fossil fuel as the main source for energy. While from 2005 to 2020, several renewable energy projects were constructed in Jordan, which contributed to minimizing the CO2 emissions, where the increase was moderate, as clear in Table 4. Nevertheless, over only one year, from 2020 to 2021, the average temperature and CO2 emissions increased due to the industrial revolution in conjunction with the increase in the population.
Based on Table 4, it is unequivocal that the produced CO2 from fossil fuel burning in 2021 is 24.297. However, to investigate the contribution of renewable energy projects in tackling temperature rising, a reduced amount of CO2 will be added to that produced from burning fossil fuel, as pointed out previously.
The relationship that links the temperature with the CO2 emissions from fossil fuel, which is the core of this research, is clarified in Equation (2). Consequently, based on the following formula, which is obtained with the aid of Figure 15, the unreal temperature (avoided one) that clarifies the contribution of a renewable energy project can be determined and, accordingly, the difference between the actual temperature, listed in Table 4, and the avoided temperature depicts the effectiveness of renewable energy projects. To achieve the research objective, this process is summarized in merely three steps, as clarified in Figure 16.
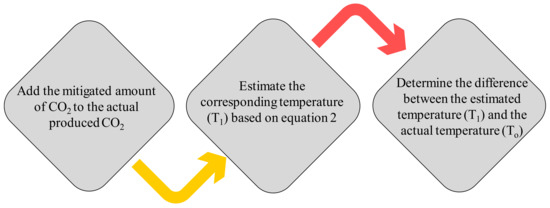
Figure 16.
Deep understanding of how renewable energy projects contribute to mitigating temperature rising in Jordan.
Based on Equation (2), it is manifest that the amounts of the tCO2 produced from burning the fossil fuel for electricity generation purposes in the years 1990, 2005, 2020, and 2021 that are represented in the y-axis are linked with the average temperature in the same mentioned years, which are represented in the x-axis. The role of this equation is to estimate the average temperature in 2021 in case of the absence of wind and solar PV projects. Moreover, Equation (2) is a cubic equation where three roots are expected to be found. Only the real number will be considered, while the complex ones will be ignored. And finally, this equation gives an accepted estimation as the coefficient of determination, R2, which is a statistical measure that indicates how well the equation fits the data points.
According to Equation (2), temperature estimation in the absence of renewable energy projects has been conducted for 2021 since it involves the most recent data. If the produced energy from renewable energy projects were produced from fossil fuel, the CO2 emissions would have become 24.297 + 1.427515 = 25.724515 Mt, and the correspondence temperature would have been, based on Equation (2), 20.751 °C instead of 20.36 °C for the year 2021. Thus, the existing renewable energy projects mitigate the temperature rising by 0.391 °C each year.
Accordingly, from 2021 to 2030, the operation of renewable energy projects, wind and solar, in Jordan will mitigate an increase in the temperature to 3.9 °C. The obtained value is reasonable and can be justified because of the industrial revolution, where several technologies that depend on electricity emerged. Consequently, the generation of electricity must be increased. As evidence, based on Table 4, it is clear that from 2020 to 2021, the temperature increased significantly. However, the period is only one year, while from 1990 to 2005, the increment in temperature was less than 1o C despite the long period. Moreover, population growth contributes to requiring more electricity to be generated.
5.2. Water Consumption Outcomes
Any met problem can be solved by having a clear understanding of what is the reason for the resultant problem. Similarly, to effectively address water scarcity and manage water governance at all levels, it is essential to have a clear understanding of the underlying causes. This understanding can then be used to develop sustainable, efficient, and effective approaches to integrated water management that foster cooperation, community building, and peaceful resolution of conflicts.
Jordan’s water situation is complex and relatively unsustainable, with increasing demand for freshwater exceeding the availability and pollution of surface and groundwater resources. Additionally, Jordan is facing significant challenges with water scarcity and pollution and heavy reliance on importing water through trade [14]. Besides, Jordan is facing a severe water shortage due to its dependence on highly variable annual precipitation, and the potential impact of climate change on freshwater resources is a significant concern as it could exacerbate the existing water scarcity. It is essential to consider the effects of climate change in the management and sustainable use of available water resources [38].
Most of the power plants used for electricity generation in Jordan depend on Natural gas sources, which require 600 gallons/MWh for cooling [15]. Hereby, the quantity of the saved water is determined for the renewable energy projects by assuming that if each renewable energy project is replaced with a traditional power plant with the same production level, how many gallons or m3 of water will be required, as clarified in Table 5.
Table 5.
Quantities of saved water due to renewable energy farms’ implementation.
Based on the previous outcomes, the amount of saved water from the aforementioned renewable energy farms in Jordan equals 6.9491 × 10⁹ gallons. In other words, if the energy produced from the existing renewable projects is produced from traditional energy sources, an amount of water equal to 6.9491 × 10⁹ gallons will be required for cooling purposes in thermal power plants. Thus, the effectiveness of renewable energy projects is proven from both the climate change phenomenon and water consumption points of view. However, one gallon is equivalent to 0.00378541 m3 [64]. Ergo, the contribution of wind and PV projects in Jordan in water consumption reduction in terms of m3 is clarified in Figure 17.
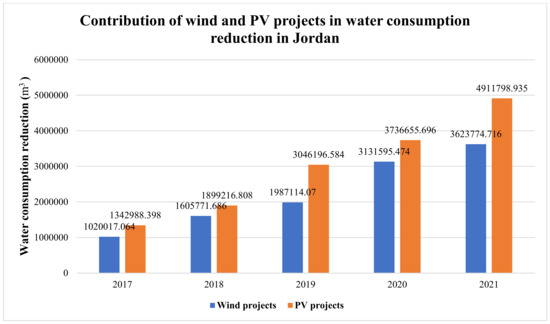
Figure 17.
Role of wind and PV projects in Jordan in water consumption reduction.
6. Future Situation Estimation
The population in Jordan in 2030 will be about 11.9 million [65], and the corresponding expected demand for energy (Electrical Energy needed) in the same year is 28,230 GWh [66], while the demand in 2021 has been recorded to be 17,380.17 GWh [67]. Hence, the difference between 2040 and 2021 is 10,849.83 GWh. Table 6 clarifies the number of emissions that will be produced in the absence of renewable energy projects (Scenario 1) and with the existence of renewable energy projects (Scenario 2). However, since natural gas is the most used fuel in Jordan, a comparison has been conducted between generating electricity from natural gas, wind, and PV technologies. Assuming that this demand growth will be covered by the wind with a percentage of 40% and by the PV with a percentage of 60%.
Table 6.
Emissions of tone CO2/GWh.
Thus, the contribution of RE projects in covering the growth of demand in 2030 will appear in producing 666,179.562 tCO2, while covering the increase in demand by natural gas will contribute to emitting 5,424,915 tCO2. Hence, the reduction in the emissions equals 4,758,735.438 tCO2 = 4.758735438 Mt. Accordingly. The existing renewable energy projects are reducing the production of CO2 with an annual amount of 1.427515 Mt, and in the future, if the increase in demand in 2030 is covered by renewable energy projects (40% from wind and 60% from solar PV) an amount of reduction which is equal to 4.758735438 Mt is likely. Hereby, the cumulative decrease in the aforementioned renewable energy projects from 2021 to 2030 is equal to 1.427515 × 10 = of 14.27515 Mt, bearing in mind the likely reduction in 2030 due to covering the difference in demand by the renewable energy projects, which is equal to 4.758735438. Hence, the total reduction in CO2 emissions in 2030 due to renewable energy projects would be about 19.033885438 Mt.
Referring to Figure 18, which has been plotted based on Table 4, the expected emissions of CO2 due to fossil fuel burning in 2030 is equal to 28.554 Mt. However, if the covered amount of energy by renewable energy is replaced with fossil fuel, the reduction amount of CO2 will not be reduced. In other words, instead of having only 28.554 Mt, the reduced amount of CO2 by renewable energy projects will be added.
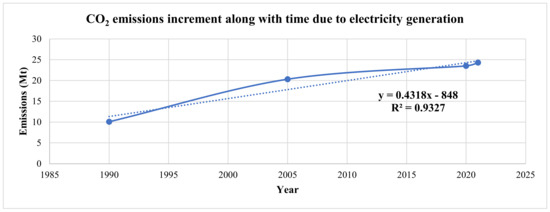
Figure 18.
The amount of emitted CO2 due to generating electricity.
Hence, with the absence of renewable energy projects, the emitted amount of CO2 in 2030 will be 28.554 Mt + 19.033885438 Mt = 47.587885438 Mt. Accordingly, based on Equation (2), the temperature would be 21.623 °C, but based on Figure 19 that also has been plotted based on Table 4 the temperature in 2030 is expected to be 20.576 °C, which means that if the growth in demand in 2030 is covered by implementing some new renewable energy project in conjunction with the already existing renewable energy projects, an amount of temperature increasing avoidance in 2030 will be equal to 1.047 °C in that year.
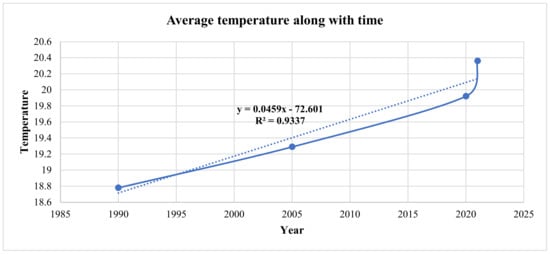
Figure 19.
Variation of temperature along with time.
However, regarding the water consumption reduction, it is mentioned how covering the growth in demand by the renewable energy projects in Jordan affects the water consumption situation in Jordan. As mentioned in the previous section, the difference in demand between 2030 and 2021 equals 10,849.83 GWh. If this growth is decided to be covered by natural gas, the most used one in Jordan, an amount of water for cooling purposes will be required that is equal to 6.5 × 10⁹ gallons, while neither in the wind nor in PV technologies, the water will be required. In other words, the amount of saved water will likely be 6.5 × 10⁹ gallons if generating electricity from natural gas is replaced by wind or PV projects.
It is manifest that Equation (3) represents a linear equation, which links the amount of CO2 in Jordan along with the years to estimate the number of emissions in the future. The high R2 value suggests a strong correlation between the variables, allowing for accurate predictions and further relationship analysis.
Similarly, Equation (4) links the average temperature in Jordan along with the years to estimate the amount of the expected temperature in the future. As mentioned before, the high R2 value suggests a strong correlation between the variables, allowing for accurate predictions and further analysis of the relationship.
7. Conclusions
This paper addressed the pressing and multifaceted issue of climate change, a phenomenon arising from the retention of solar irradiation within the atmosphere, primarily due to the presence of various greenhouse gases, such as carbon dioxide (CO2), methane (CH4), nitrous oxide (N2O), and chlorofluorocarbons CFC-11 (CC13F) and CFC-12 (CC12F2). The study investigated the significant contributions of wind and photovoltaic (PV) projects in Jordan between 2015 and 2021. In particular, it examined the reduction in CO2 emissions achieved by replacing conventional power plants, predominantly reliant on natural gas, with renewable energy sources, ensuring equitable capacity comparisons.
The findings revealed that wind and PV farms in Jordan have made substantial strides in reducing CO2 emissions. When replacing a conventional power plant dependent on natural gas with renewable energy sources, a noteworthy reduction in tCO2 emissions was observed. Additionally, the study highlighted the water consumption reduction resulting from the transition to wind and solar energy, indicating that 957,300,000 gallons were saved by wind projects and 1,297,560,000 gallons by PV projects in 2021.
To enhance the study’s efficacy, a simulation for the future, specifically projecting to the year 2030, was conducted. The simulation assumed that 40% of the growth in energy demand would be met by wind energy, while the remaining 60% would be covered by solar energy instead of fossil fuels. The outcomes demonstrated that such an approach would result in an estimated reduction of 112,838.232 tons of CO2 emissions from wind energy and 553,341.33 tons from solar energy. Additionally, it was projected that 6.5 × 10⁹ gallons of water could be conserved if renewable energy were to fulfil the growth in energy demand.
Lastly, the paper presented two scenarios regarding future energy demand growth. The first scenario assumed conventional power plants would meet the demand, while the second scenario considered adopting wind projects to cover 40% of the growth and PV projects to cover 60%. These scenarios underscored the importance of embracing renewable energy sources to address climate change challenges effectively.
Author Contributions
Conceptualization, A.A.-Q. and H.D.; methodology, A.A.-Q. and H.D.; software, H.D.; validation, H.D.; formal analysis, A.A.-Q. and H.D.; investigation, A.A.-Q. and H.D; resources, H.D.; data curation, H.D.; writing—original draft preparation, H.D.; writing—review and editing, A.A.-Q.; visualization, A.A.-Q., A.M.A.M.; supervision, A.A.-Q.; project administration, A.A.-Q.; funding acquisition, A.A.-Q. and A.M.A.M. All authors have read and agreed to the published version of the manuscript.
Funding
This research received no external funding.
Data Availability Statement
The data presented in this study are available on request from the corresponding author.
Acknowledgments
The authors would like to thank Yarmouk University for the support in this research study.
Conflicts of Interest
The authors declare no conflict of interest.
Symbols and Abbreviations
| GHG | Greenhouse gases | tCO2 | Tons of carbon dioxide. |
| IPCC | Intergovernmental Panel on Climate Change | Mt | Megaton |
| WG3 | Working Group III | MWh | Megawatt hour |
| RETs | Renewable Energy Technologies | GWh | Gigawatt hour |
| GDP | Gross Domestic Product | ρ | Air Density |
| tCO2 | Tons of carbon dioxide. | V | Wind Velocity |
References
- Manabe, S. Role of greenhouse gas in climate change. Tellus A Dyn. Meteorol. Oceanogr. 2019, 71, 1620078. [Google Scholar] [CrossRef]
- Shobande, O.A. Is climate change a monetary phenomenon? Evidence from time series analysis. Int. J. Sustain. Dev. World Ecol. 2021, 29, 99–111. [Google Scholar] [CrossRef]
- Atwoli, L.; Muhia, J.; Merali, Z. Mental health and climate change in Africa. BJPsych Int. 2022, 19, 86–89. [Google Scholar] [CrossRef]
- IPCC. Climate Change 2022: Impacts, Adaptation and Vulnerability. 2022. Available online: https://www.ipcc.ch/report/ar6/wg2/ (accessed on 3 August 2023).
- Ledley, T.S.; Sundquist, E.T.; Schwartz, S.E.; Hall, D.K.; Fellows, J.D.; Killeen, T.L. Climate change and greenhouse gases. Eos Trans. Am. Geophys. Union 1999, 80, 453–458. [Google Scholar] [CrossRef]
- United States Environmental Protection Agency. Overview of Greenhouse Gases. 16 May 2022. Available online: https://www.epa.gov/ghgemissions/overview-greenhouse-gases (accessed on 3 August 2023).
- Jeffry, L.; Ong, M.Y.; Nomanbhay, S.; Mofijur, M.; Mubashir, M.; Show, P.L. Greenhouse gases utilization: A review. Fuel 2021, 301, 121017. [Google Scholar] [CrossRef]
- Soeder, D.J. Fracking and the Environment: A Scientific Assessment of the Environmental Risks from Hydraulic Fracturing and Fossil Fuels; Springer: Cham, Switzerland, 2021. [Google Scholar]
- Lamb, W.F.; Wiedmann, T.; Pongratz, J.; Andrew, R.; Crippa, M.; Olivier, J.G.J.; Wiedenhofer, D.; Mattioli, G.; Al Khourdajie, A.; House, J.; et al. A review of trends and drivers of greenhouse gas emissions by sector from 1990 to 2018. Environ. Res. Lett. 2021, 16, 073005. [Google Scholar] [CrossRef]
- Roberts, D. What’s Causing Climate Change, in 10 Charts. Vox. 11 September 2020. Available online: https://www.vox.com/energy-and-environment/21428525/climate-change-cause-charts-china-us-responsible (accessed on 3 August 2023).
- National Electric Power Company (NEPCO). Annual Report; NEPCO: Amman, Jordan, 2021. [Google Scholar]
- Crippa, M.; Guizzardi, D.; Banja, M.; Solazzo, E.; Muntean, M.; Schaaf, E.; Pagani, F.; Monforti-Ferrario, F.; Olivier, J.G.J.; Quad-relli, R.; et al. CO2 Emissions of All World Countries—JRC/IEA/PBL 2022 Report; Publications Office of the European Union: Luxembourg, 2022; JRC130363. [Google Scholar] [CrossRef]
- Perera, F.; Nadeau, K. Climate Change, Fossil-Fuel Pollution, and Children’s Health. N. Engl. J. Med. 2022, 386, 2303–2314. [Google Scholar] [CrossRef] [PubMed]
- Le Quéré, C.; Korsbakken, J.I.; Wilson, C.; Tosun, J.; Andrew, R.; Andres, R.J.; Canadell, J.G.; Jordan, A.; Peters, G.P.; van Vuuren, D.P. Drivers of declining CO2 emissions in 18 developed economies. Nat. Clim. Chang. 2019, 9, 213–217. [Google Scholar] [CrossRef]
- IIs Climate Change the World’s Biggest Problem? And What Can We Do about It? Available online: https://www.givingwhatwecan.org/cause-areas/long-term-future/climate-change?gclid=CjwKCAiAk--dBhABEiwAchIwkVhtZtkGhNFAmQtXD-2c-si8ECC3fCjkDa9dLOqKYQNkhH866yWNrhoCrCUQAvD_BwE (accessed on 20 January 2023).
- Al-Hasani, I.; Al-Qinna, M.; Hammouri, N.A. Potential Impacts of Climate Change on Surface Water Resources in Arid Regions Using Downscaled Regional Circulation Model and Soil Water Assessment Tool, a Case Study of Amman-Zerqa Basin, Jordan. Climate 2023, 11, 51. [Google Scholar] [CrossRef]
- Cal-Adapt. Available online: https://cal-adapt.org/help/faqs/which-rcp-scenarios-should-i-use-in-my-analysis/ (accessed on 3 August 2023).
- Rovinaru, M.D.; Bako, D.E.; Rovinaru, F.I.; Rus, A.V.; Aldea, S.G. Where Are We Heading? Tackling the Climate Change in a Globalized World. Sustainability 2022, 15, 565. [Google Scholar] [CrossRef]
- Tavakoli, A. How precisely “kaya identity” can estimate GHG emissions: A global review. Jordan J. Earth Environ. Sci. 2017, 8, 91–96. [Google Scholar]
- Hwang, Y.; Um, J.-S.; Hwang, J.; Schlüter, S. Evaluating the Causal Relations between the Kaya Identity Index and ODIAC-Based Fossil Fuel CO2 Flux. Energies 2020, 13, 6009. [Google Scholar] [CrossRef]
- Guyadeen, D.; Henstra, D. Evaluating rural municipal climate change plans in ontario, Canada. J. Rural. Stud. 2023, 97, 123–139. [Google Scholar] [CrossRef]
- Zhang, C.-Y.; Oki, T. Water pricing reform for sustainable water resources management in China’s agricultural sector. Agric. Water Manag. 2023, 275, 108045. [Google Scholar] [CrossRef]
- Sahana, V.; Mondal, A. Evolution of multivariate drought hazard, vulnerability and risk in India under climate change. Nat. Hazards Earth Syst. Sci. 2023, 23, 623–641. [Google Scholar] [CrossRef]
- Hruby, F. Applications of Bivariate Choropleth Maps. In Proceedings of the 15th International Multidisciplinary Scientific Geoconference SGEM 2015, Albena, Bulgaria, 18–24 June 2015. [Google Scholar] [CrossRef]
- Smith, J.C.; Whiley, H.; Ross, K.E. Climate Change and Health: Local Government Capacity for Health Protection in Australia. Int. J. Environ. Res. Public Health 2023, 20, 1750. [Google Scholar] [CrossRef]
- Nayak, M.S.D.P.; Narayan, K.A. Strengths and weaknesses of online surveys. Technology 2019, 6, 0837–2405053138. [Google Scholar]
- Azouz, M.; Salem, D. Urban resilience and stormwater management: Lessons learnt from New Cairo, Egypt. Ain Shams Eng. J. 2023, 14, 102117. [Google Scholar] [CrossRef]
- François, D.; Youssef, Z. Where to measure water quality? Application to nitrogen pollution in a catchment in France. J. Environ. Manag. 2023, 326, 116721. [Google Scholar] [CrossRef]
- Sugimura, Y.; Kawasaki, T.; Murakami, S. Potential for Increased Use of Secondary Raw Materials in the Copper Industry as a Countermeasure Against Climate Change in Japan. Sustain. Prod. Consum. 2023, 35, 275–286. [Google Scholar] [CrossRef]
- Jungudo, M. The Impact of Climate Change in Egypt. In Resource Conflict and Environmental Relations in Africa; Springer Nature: Singapore, 2023; pp. 173–188. [Google Scholar]
- Al-Omari, A.; Al-Houri, Z.; Muhammetoglu, H.; Muhammetoglu, A.; Topkaya, B. Energy and Carbon Footprints for the Urban Water Cycle in Amman, Jordan. Int. J. Environ. Res. 2022, 16, 87. [Google Scholar] [CrossRef]
- Sandri, S.; Hussein, H.; Alshyab, N. Sustainability of the Energy Sector in Jordan: Challenges and Opportunities. Sustainability 2020, 12, 10465. [Google Scholar] [CrossRef]
- Talozi, S.A. Water and security in Jordan. In Integrated Water Resources Management and Security in the Middle East; Springer: Dordrecht, The Netherlands, 2007; pp. 73–98. [Google Scholar]
- Salameh, E. Water Security Needs What Ought to Be Done to Increase the Future Water Security as a Fundamental Base for Social, Economic and Political Stability—The Case of Jordan. J. Geosci. Environ. Prot. 2022, 10, 1–17. [Google Scholar] [CrossRef]
- Al Naber, M.; Molle, F. Controlling groundwater over abstraction: State policies vs local practices in the Jordan highlands. Water Policy 2017, 19, 692–708. [Google Scholar] [CrossRef]
- Hussein, H. Yarmouk, Jordan, and Disi basins: Examining the impact of the discourse of water scarcity in Jordan on transboundary water governance. Mediterr. Politics 2019, 24, 269–289. [Google Scholar] [CrossRef]
- Ellabban, O.; Abu-Rub, H.; Blaabjerg, F. Renewable energy resources: Current status, future prospects and their enabling technology. Renew. Sustain. Energy Rev. 2014, 39, 748–764. [Google Scholar] [CrossRef]
- Owusu, P.A.; Asumadu-Sarkodie, S. A review of renewable energy sources, sustainability issues and climate change mitigation. Cogent Eng. 2016, 3, 1167990. [Google Scholar] [CrossRef]
- Javaid, A.; Arshed, N.; Munir, M.; Zakaria, Z.A.; Alamri, F.S.; Khalifa, H.A.E.-W.; Hanif, U. Econometric Assessment of Institutional Quality in Mitigating Global Climate-Change Risk. Sustainability 2022, 14, 669. [Google Scholar] [CrossRef]
- Suman, A. Role of renewable energy technologies in climate change adaptation and mitigation: A brief review from Nepal. Renew. Sustain. Energy Rev. 2021, 151, 111524. [Google Scholar] [CrossRef]
- Surendra, K.C.; Khanal, S.K.; Shrestha, P.; Lamsal, B. Current status of renewable energy in Nepal: Opportunities and challenges. Renew. Sustain. Energy Rev. 2011, 15, 4107–4117. [Google Scholar] [CrossRef]
- ArcGIS Web Application. Available online: https://memrgis.memr.gov.jo/portal/apps/webappviewer/index.html?id=718d18fa725f444094355abd6e729e18&fbclid=IwAR3EVm3QtXUAcBNvtl4cu8Wiu4TCDrbVSHlvL9PP-fu55mw54bKouT2OwRE (accessed on 15 March 2023).
- Solar Resource Maps of Jordan. Available online: https://solargis.com/maps-and-gis-data/download/jordan?fbclid=IwAR0_SVrEoHcp2a6KO-1qlVjwB-7M3TMH16VgcPqM12p-kHRgRj3vMrDDM_A (accessed on 15 March 2023).
- Global Wind Atlas. 2019. Available online: https://globalwindatlas.info/ (accessed on 3 August 2023).
- Darwish, H.H.; Al-Quraan, A. Machine Learning Classification and Prediction of Wind Estimation Using Artificial Intelligence Techniques and Normal PDF. Sustainability 2023, 15, 3270. [Google Scholar] [CrossRef]
- Al-Quraan, A.; Al-Mhairat, B. Intelligent Optimized Wind Turbine Cost Analysis for Different Wind Sites in Jordan. Sustainability 2022, 14, 3075. [Google Scholar] [CrossRef]
- Schuetze, B.; Hussein, H. The geopolitical economy of an undermined energy transition: The case of Jordan. Energy Policy 2023, 180, 113655. [Google Scholar] [CrossRef]
- World Nuclear Association. Comparison of Lifecycle Greenhouse Gas Emissions of Various Electricity Generation Sources; World Nuclear Association: London, UK, 2011. [Google Scholar]
- Minister of Energy and Mineral Resources (MEMR). Annual Report; NEPCO: Amman, Jordan, 2021.
- World Bank. World Bank Group—International Development, Poverty, & Sustainability. Available online: https://www.worldbank.org/en/home (accessed on 10 October 2021).
- South Amman Solar Conversion Plant Ready for Operation. Jordan Times. 3 November 2019. Available online: https://jordantimes.com/news/local/south-amman-solar-conversion-plant-ready-operation (accessed on 22 April 2023).
- Al-Mhairat, B.; Al-Quraan, A. Assessment of Wind Energy Resources in Jordan Using Different Optimization Techniques. Processes 2022, 10, 105. [Google Scholar] [CrossRef]
- Jin, Y.; Behrens, P.; Tukker, A.; Scherer, L. Water use of electricity technologies: A global meta-analysis. Renew. Sustain. Energy Rev. 2019, 115, 109391. [Google Scholar] [CrossRef]
- Akkam, Y.; Omari, D.; Alhmoud, H.; Alajmi, M.; Akkam, N.; Aljarrah, I. Assessment of Xenoestrogens in Jordanian Water System: Activity and Identification. Toxics 2023, 11, 63. [Google Scholar] [CrossRef]
- Introduction into Water in Jordan. Fanack Water. Available online: https://water.fanack.com/jordan/ (accessed on 3 August 2023).
- Adisorn, T.; Venjakob, M.; Pössinger, J.; Ersoy, S.R.; Wagner, O.; Moser, R. Implications of the Interrelations between the (Waste)Water Sector and Hydrogen Production for Arid Countries Using the Example of Jordan. Sustainability 2023, 15, 5447. [Google Scholar] [CrossRef]
- Nerc.gov.jo. 2020. Available online: http://www.nerc.gov.jo/EN/ListDetails/Energy_Efficiency_Projects/1035/17 (accessed on 3 August 2023).
- Lubega, W.N.; Stillwell, A.S. Analyzing the economic value of thermal power plant cooling water consumption. Water Resour. Econ. 2019, 27, 100137. [Google Scholar] [CrossRef]
- Pan, S.-Y.; Snyder, S.W.; Packman, A.I.; Lin, Y.J.; Chiang, P.-C. Cooling water use in thermoelectric power generation and its associated challenges for addressing water-energy nexus. Water-Energy Nexus 2018, 1, 26–41. [Google Scholar] [CrossRef]
- POWER. Water Conservation Options for Power Generation Facilities, POWER Magazine. 1 September 2012. Available online: https://www.powermag.com/water-conservation-options-for-power-generation-facilities/ (accessed on 3 August 2023).
- Clean Energy Project Analysis: RETScreen ® Engineering & Cases Textbook, Third Edition. Available online: https://nrcaniets.blob.core.windows.net/iets/M154-13-2005E.pdf (accessed on 19 July 2023).
- World Bank Climate Change Knowledge Portal. Available online: https://climateknowledgeportal.worldbank.org/country/jordan/climate-data-historical (accessed on 3 August 2023).
- Radaideh, A.; Bodoor, M.; Al-Quraan, A. Active and Reactive Power Control for Wind Turbines Based DFIG Using LQR Controller with Optimal Gain-Scheduling. J. Electr. Comput.Eng. 2021, 2021, 1218236. [Google Scholar] [CrossRef]
- Convert Gallon (US) to Cubic Meter. Available online: https://www.unitconverters.net/volume/gallon-us-to-cubic-meter.htm (accessed on 3 August 2023).
- World Population Review. Jordan Population 2020 (Demographics, Maps, Graphs). 2020. Available online: https://worldpopulationreview.com/countries/jordan-population (accessed on 3 August 2023).
- Abu-Rumman, G.; Khdair, A.I.; Khdair, S.I. Current status and future investment potential in renewable energy in Jordan: An overview. Heliyon 2020, 6, e03346. [Google Scholar] [CrossRef] [PubMed]
- Writer, S.; Times, T.J. Electricity Consumption Reaches New Heights in Jordan. Available online: https://www.zawya.com/en/economy/levant/electricity-consumption-reaches-new-heights-in-jordan-mtnmtt (accessed on 3 August 2023).


Disclaimer/Publisher’s Note: The statements, opinions and data contained in all publications are solely those of the individual author(s) and contributor(s) and not of MDPI and/or the editor(s). MDPI and/or the editor(s) disclaim responsibility for any injury to people or property resulting from any ideas, methods, instructions or products referred to in the content. |
© 2023 by the authors. Licensee MDPI, Basel, Switzerland. This article is an open access article distributed under the terms and conditions of the Creative Commons Attribution (CC BY) license (https://creativecommons.org/licenses/by/4.0/).