Article

The Characteristics of Fracturing Fluid Distribution after Fracturing and Shut-In Time Optimization in Unconventional Reservoirs Using NMR

1
Drilling and Production Technology Research Institue of Petrochina Jidong Oilfield, Tangshan 063299, China
2
E&D Research Institute of Liaohe Oilfield Company of PetroChina, Panjin 124000, China
3
Oil and Gas Technology Research Institute of Changqing Oilfield Company of PetroChina, Xi’an 710018, China
4
Exploration and Development Department of Petrochina Jidong Oilfield, Tangshan 063299, China
5
College of Petroleum Engineering, Xi’an Shiyou University, Xi’an 710065, China
6
Gas Recovery Plant No. 2 of Changqing Oilfield Company of PetroChina, Qingyan 745000, China
*
Author to whom correspondence should be addressed.
Processes 2023, 11(8), 2393; https://doi.org/10.3390/pr11082393
Submission received: 20 June 2023 / Revised: 26 July 2023 / Accepted: 7 August 2023 / Published: 9 August 2023

Abstract

:
Post-fracturing shut-in, as an important means of improving the energy efficiency of fracturing fluid, has been widely used in the development process of unconventional reservoirs. The determination of the shut-in duration is key to the effectiveness of shut-in measures. However, the distribution characteristics of the fracturing fluid during the post-fracturing shut-in period in unconventional reservoirs, such as the Chang 7 reservoir, were not clear, and the shut-in duration needed further optimization. Therefore, this paper employed low-field nuclear magnetic resonance (NMR) technology to study the distribution characteristics of the fracturing fluid during the post-fracturing shut-in period in unconventional reservoirs and optimized the shut-in duration. The study showed that the Chang 7 reservoir had a complex pore structure and relatively low porosity and permeability. During the shut-in process, the filtrate was distributed in pore throats with radii ranging from 0.0012 μm to 0.025 μm. Pore throats with radii ranging from 0.003 μm to 0.07 μm acted as dynamic pore throats in the process of imbibition displacement. When the shut-in duration for the Chang 7 segment was 7 days, the growth rate of the retained volume of fracturing fluid filtrate was the highest. When the shut-in duration was 10 days, there was no oil displacement in the medium and large pores, and the retained volume of filtrate was lower than that at 7 days shut-in, indicating that an optimal shut-in duration would be 7 days. This study can provide theoretical and technical support for the development of unconventional reservoirs.

1. Introduction

Oil, as a strategic resource, plays a vital role in the economic development of a nation. Oil and gas from unconventional reservoirs are gradually replacing conventional resources to become the primary source of energy supply [1,2,3]. China has a wide distribution and vast reserves of unconventional oil and gas, which exhibit enormous development potential and substantial challenges. This has made it one of the primary research directions for scholars both domestically and internationally [4,5]. The Chang 7 reservoir of the Yanchang Formation in the Ordos Basin is a typical example. Its tight lithology, minuscule pore throats, and complex physical properties make the distribution and seepage of reservoir fluids complicated [6,7]. The reservoir fluid storage characteristics and mobilization rules are different from those of conventional reservoirs [8,9,10]. The Chang 7 reservoir primarily consists of continental clastic rock deposits, predominantly fine-grained sandstones. The physical properties of the reservoir are poor, with well-developed natural fractures. The average porosity is approximately 9.8%, and the average permeability is approximately 0.07 × 10⁻³ μm2. The crude oil viscosity in the formation is less than 10 mPa·s, indicating good oil properties with a lower content of heavy components. The formation temperature is 75 °C, the original formation pressure is 18 MPa, and the formation pressure coefficient is between 0.7 and 0.85, making it a typical low-pressure unconventional oil reservoir [11,12]. Long horizontal wells and large-scale hydraulic fracturing are the key technologies for developing the Chang 7 reservoir.
Fracture network fracturing technology is an essential means for the effective development of tight oil and gas reservoirs. This technology, based on the development characteristics of natural fractures and stress distribution, utilizes newly opened fractures and secondary fractures to increase the fluid drainage volume per well, thereby enhancing the yield per well [13,14]. Unlike traditional fracturing technology principles, fracture network fracturing places more emphasis on forming a complex fracture system after fracturing. Therefore, research on the complexity of fracturing fractures has gradually become a hot topic [15,16]. Talechani et al. [17] believe that the interaction between natural fractures and fracturing fractures is a key factor affecting the complexity of fracture morphology. Jin et al. [18], from a theoretical analysis perspective, constructed a fracture model that illustrates the reasons for the turning and twisting of near-well fractures under bidirectional load conditions, as well as the degree of turning and twisting. Cipolla et al. [19] used semianalytical and grid fracture models combined with microseismic data to describe fracture complexity, evaluate fracturing effects, and study the changes in fracture complexity with fracturing construction design parameters. In the fracturing construction of unconventional reservoirs, with the large-scale invasion of fracturing fluid into the formation and its retention in the reservoir pore channels, the modification effect of unconventional reservoirs is ultimately affected.
To address the above issues, many scholars have started researching the problem of fracturing fluid retention in reservoirs. Parmar [20] studied the impact and mechanism of gravity, surface tension, and wettability on fracturing fluid retention, concluding that gravity has a significant impact on the retention of fracturing fluid. Additionally, surfactants can alter the wettability of shale reservoirs, and changes in wettability affect the final flowback rate. Liu [21] found that fracture tortuosity weakens the effect of gravity segregation, and when gravity is weakened, capillary force-induced matrix imbibition becomes more pronounced. Le et al. [22] proposed that when the production pressure drop is greater than the capillary pressure, the fracturing fluid flows back to the surface; when the production pressure drop is less than the capillary pressure, the fracturing fluid is retained in the formation, causing a “water block” effect. Hassan et al. [23] suggested that the spontaneous imbibition of fracturing fluid leads to the formation of “water blocks” and clay swelling, affecting the production capacity of tight gas reservoirs, especially in water-sensitive unconventional reservoirs. Tang [24] believed that in shale reservoirs, for fractures that are not filled with proppant, fracturing fluid can enter and play a supportive role. At the same time, the roughness and tortuosity of the fracture will increase the complexity of liquid flow, hindering the flowback of fracturing fluid. After large-scale fracturing of the Chang 7 reservoir, a large amount of fracturing fluid remains in the formation, and its distribution characteristics are still unclear.
Kamath’s [25] study showed that the phenomenon of water phase entrapment within the reservoir during the shut-in process is a transient phenomenon. Bostrom [26] conducted further research on this basis, measuring the change in gas phase permeability before and after the core absorbed fracturing fluid under reservoir conditions, and found that the water block phenomenon inside most cores is transient. After absorbing the fracturing fluid, the gas phase permeability of most cores drops sharply, but with time, the measured gas permeability goes through a continuous rebound recovery stage. Le [22] used numerical simulation to calculate the change in gas phase permeability inside the area where fracturing fluid invades and considered the effects of gas evaporation and the deep imbibition of fracturing fluid into the matrix. The results showed that the permeability tends to recover over time, indicating that capillary force-induced imbibition can promote the recovery of reservoir permeability during the flowback process. Wang [27] used numerical analysis to study the change in gas flow rate during the shut-in stage, and their research showed that the decrease in early stage gas flow rate in the reservoir is mainly caused by the increase in water saturation inside the reservoir. The full imbibition of fracturing fluid by the reservoir matrix and the gravity settling of fracturing fluid inside the fracture network are key to increasing the gas flow rate during the shut-in stage. Dutta [28] used X-ray CT to visualize the change in water saturation inside low-permeability sandstone samples and found that the fluid inside the core tends to diffuse toward the deep low water saturation area of the matrix, redistributing the water saturation inside the reservoir, reducing the gas flow resistance inside the reservoir, and enabling some recovery of the reservoir’s permeability. Meng [29] used low-field nuclear magnetic resonance technology to monitor the change in T2 spectra during the core spontaneous imbibition process and used pulse decay permeability testing technology to detect the change in core permeability during the imbibition process. The results showed that the imbibition of fracturing fluid greatly reduces the gas phase permeability of the core; however, imbibition-induced fractures can significantly improve this permeability reduction, even potentially making the core’s permeability exceed the permeability before fracturing fluid imbibition. This suggests that microfractures induced during the shut-in stage might be an important factor in improving reservoir permeability. Yan [30] studied the relationship between gas production changes caused by spontaneous imbibition and the shut-in time, and their research indicated that the nature of the reservoir rock has a significant impact on the relationship between the shut-in time and permeability recovery. Odumabo’s [31] research showed that the amount of fracturing fluid imbibed by the reservoir and the shut-in time are key factors influencing the distribution of water saturation near the fracture face during the shut-in period, and they are affected in different ways. The distribution of water saturation and permeability changes inside the fracturing fluid invasion area near the fracture face are important factors affecting gas seepage after fracturing. Fakcharoenphol [32] studied the impact of mineralization on fluid imbibition, and their research showed that osmotic pressure is an important driving force in the imbibition process. Wang [33] studied the fluid imbibition phenomenon under the action of osmotic pressure and capillary force and explored the impact of imbibition on the generation of microfractures in the hydraulic fracturing of shale gas reservoirs. Their research showed that clay minerals act as semipermeable membranes, absorbing water more strongly than organic matter and other minerals. Shut-in after pressurization is an efficient technique, but the optimal shut-in time is still a challenge, and research on optimizing the shut-in time should be conducted based on understanding the distribution characteristics of fracturing fluid.
Nuclear magnetic resonance (NMR) technology is a rapid and effective visualization detection method for analyzing rock core frameworks and pore distribution and studying the flow state of fluids in rock core pores, playing an especially important role in the evaluation of low porosity and low permeability reservoirs. NMR and its imaging technology can more intuitively present the migration of fluids within the rock core, with rapid and accurate detection, high resolution, and importantly, no damage to the sample during the detection process. Therefore, this technology is of significant importance for field research in oil and gas fields [34]. The NMR T2 spectrum can not only observe the fluid distribution in the rock core pores but also quantitatively provide the amounts of movable and bound fluids [35,36]. In this study, low-field NMR technology was used to investigate the distribution characteristics of fracturing fluid during the shut-in period after pressurization, using the Chang 7 reservoir as an example, and the shut-in time was optimized [37]. This study can provide theoretical and technical support for the optimization of the return plan and the determination of the shut-in time in unconventional reservoirs.

2. Experimental

2.1. Materials and Equipment

The basic parameters of the thin sections used in the experiment are shown in Table 1. The instrument used for the experiment is the MesoMR23-60H-I low-field nuclear magnetic resonance analyzer, manufactured by Suzhou Newmai Electronic Technology Co., Ltd. (Suzhou, China). The type of magnet is a permanent magnet, with a magnetic field strength of 0.5 ± 0.05 T, a probe coil of 25 mm, magnet temperature of 32 °C, main frequency of the instrument is 23 MHz, and the sample size should be approximately 25 mm in diameter and 50 mm in length. The sample used in the final experiment was a slice about 2 mm thick. The environmental temperature is approximately 25 °C, and the relative humidity is 60%, as shown in Figure 1.
In this experiment, to prevent the hydrogen signal in distilled water from affecting the oil signal in the core, the experimental water was a 40% mass fraction of manganese chloride solution. This is because the water signal is shielded when divalent manganese ions fully diffuse into the core pores. Manganese chloride is not soluble in oil, so the oil signal is unaffected, thus separating the water and oil signals and facilitating observation of the T2 spectrum. T2 describes the T transversal, thus the relaxation of the transversal magnetization. It can obtain the fluid distribution status in different types of pores based on data such as mercury intrusion. In addition, imaging was achieved through stereoscopic microscopy. Stereoscopic microscopy can produce upright three-dimensional spatial images when observing objects, with strong stereoscopic effect, clear and wide imaging, and long working distance.

2.2. Experimental Steps

(1)
A wire cutting machine was used to cut the core to the required size for the thin section experiment (the thickness of the core thin section was 1~2 mm). A polishing sander was then used to make the thin section smooth, and the core thin section was washed. The cleaned core was placed in a constant temperature box set at 70 °C until the weight of the thin section no longer changed, indicating that it had reached a stable dry weight. The diameter, thickness, mass, permeability, and other basic parameters of the thin section were measured, and full-field and local field photos were taken of the dry sample with a stereomicroscope. Then, the dried core thin section was pressurized and saturated with simulated formation water for 24 h until the wet weight of the core no longer changed, resulting in a core thin section saturated with water.
(2)
The saturated core thin section was scanned and imaged with nuclear magnetic resonance to obtain the T2 spectrum and imaging image of the saturated water. The scanned core was placed in a constant temperature box at 70 °C for drying. Then, the core thin section was placed in a prepared 40% manganese chloride solution for saturation. The core thin section saturated with a 40% manganese chloride solution was scanned and imaged with a nuclear magnetic resonance analyzer to obtain the T2 spectrum and imaging image of the saturated manganese. It was then photographed with a stereomicroscope in both full and local fields.
(3)
The core thin section was placed in a displacement device to start oil displacement until water no longer came out of the outlet, forming a core saturated with oil with a certain bound water saturation. The core thin section was scanned and imaged with a nuclear magnetic resonance analyzer to obtain the T2 spectrum and imaging image.
(4)
The original oil-containing core thin section with bound water was placed in the displacement device and displaced with a 40% manganese chloride solution until no oil was produced from the outlet. The core thin section was scanned and imaged with a nuclear magnetic resonance analyzer and then photographed with a stereomicroscope.
(5)
The core thin section, after water flooding the oil, was reversed with oil until water no longer came out of the outlet. The core thin section was scanned and imaged with a nuclear magnetic resonance analyzer and then photographed with a stereomicroscope. This was done to prepare samples for the spontaneous imbibition displacement oil experiment.
(6)
The core thin sections were placed in a 40% manganese chloride solution to simulate the shut-in process. The core thin sections were removed after being shut-in for 3 days, 5 days, 7 days, and 10 days to monitor the distribution of fracturing fluid and the situation of imbibition displacement oil.

3. Results and Discussion

3.1. Characteristics of the Fracturing Fluid Distribution during the Shut-In Period

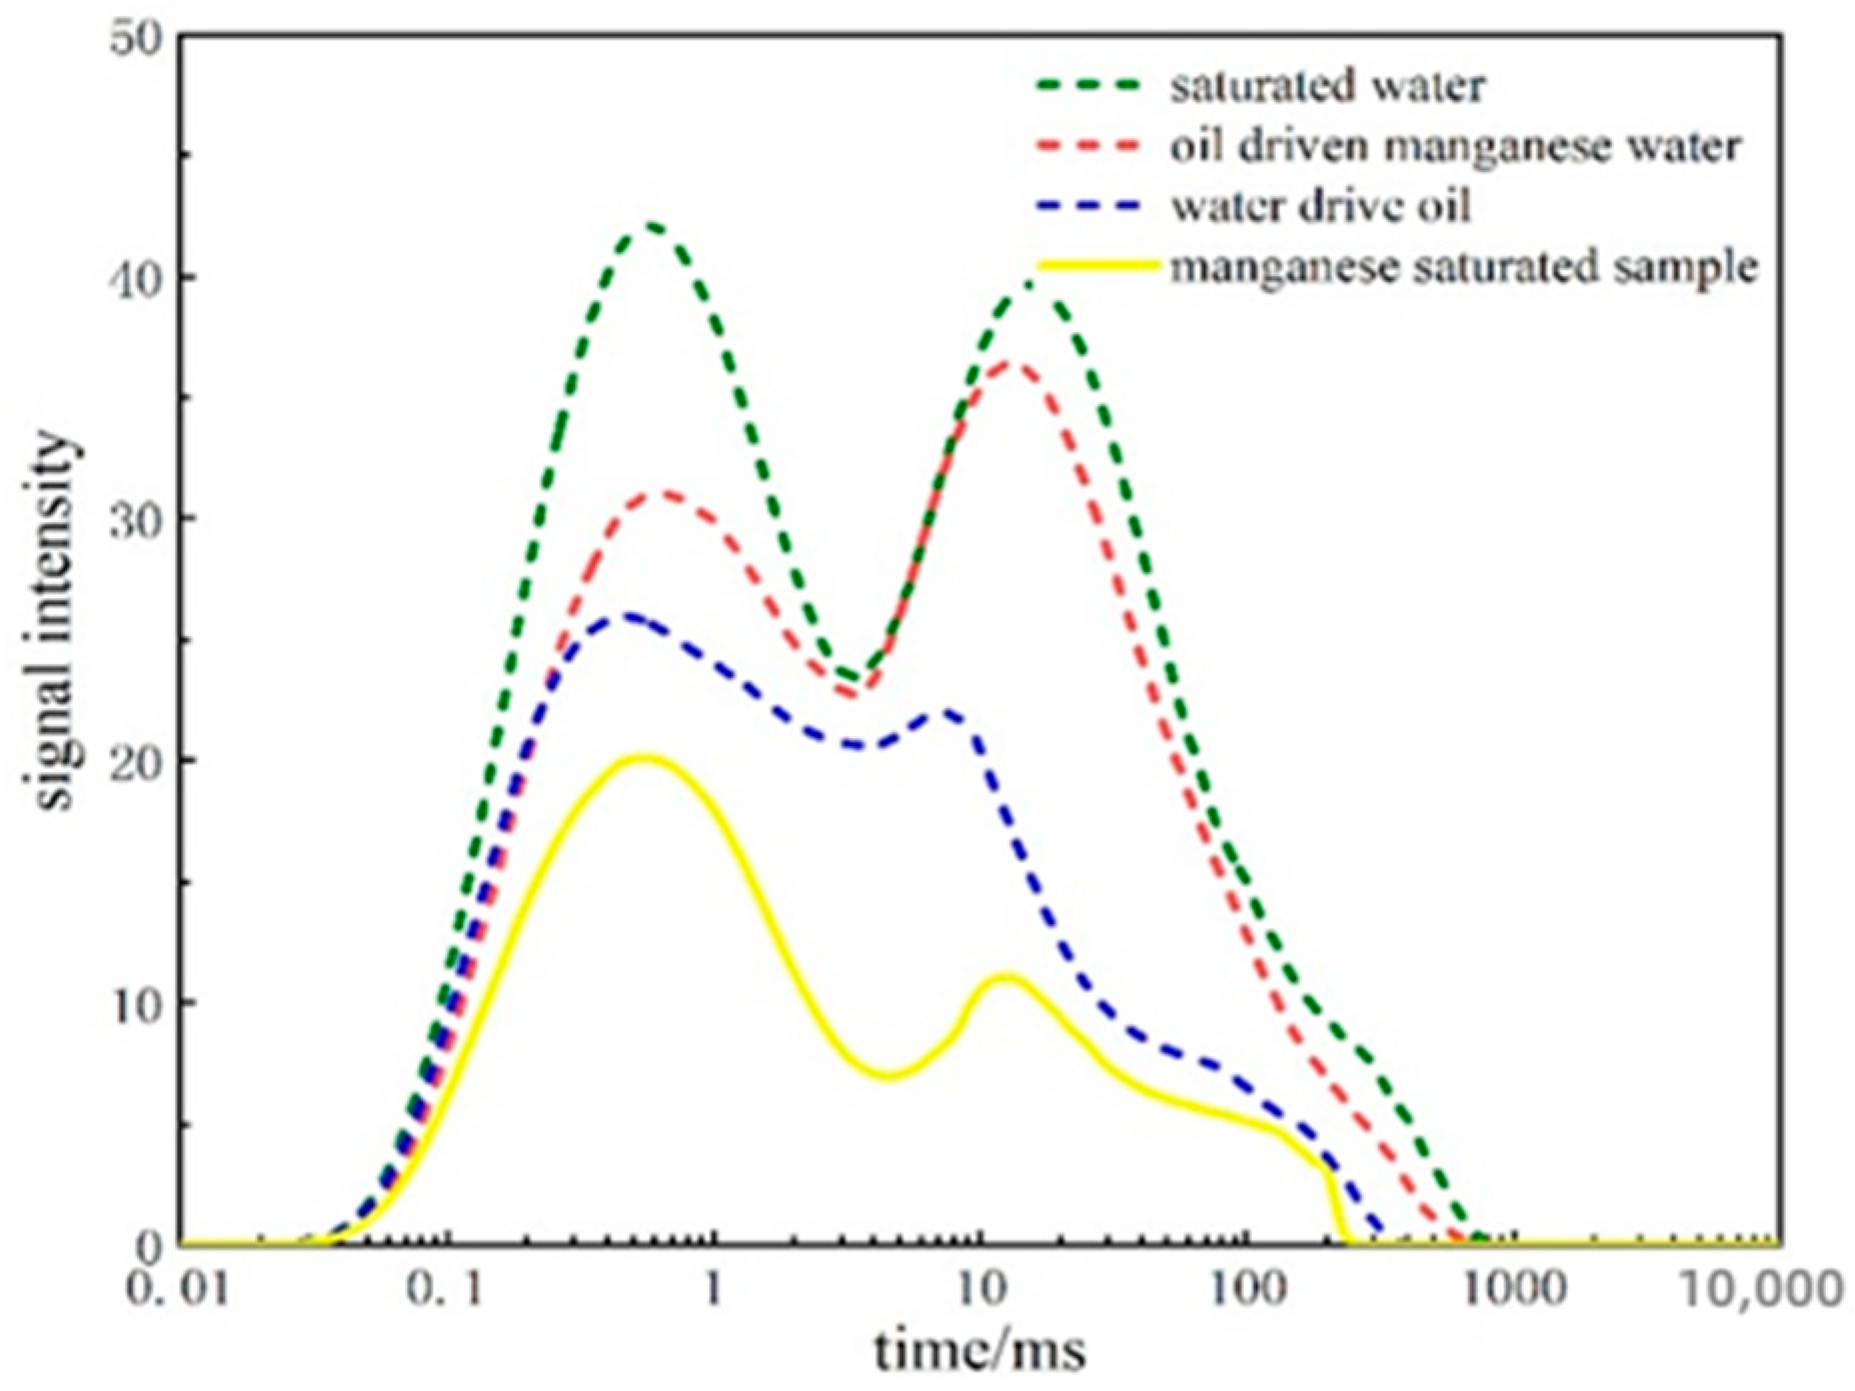
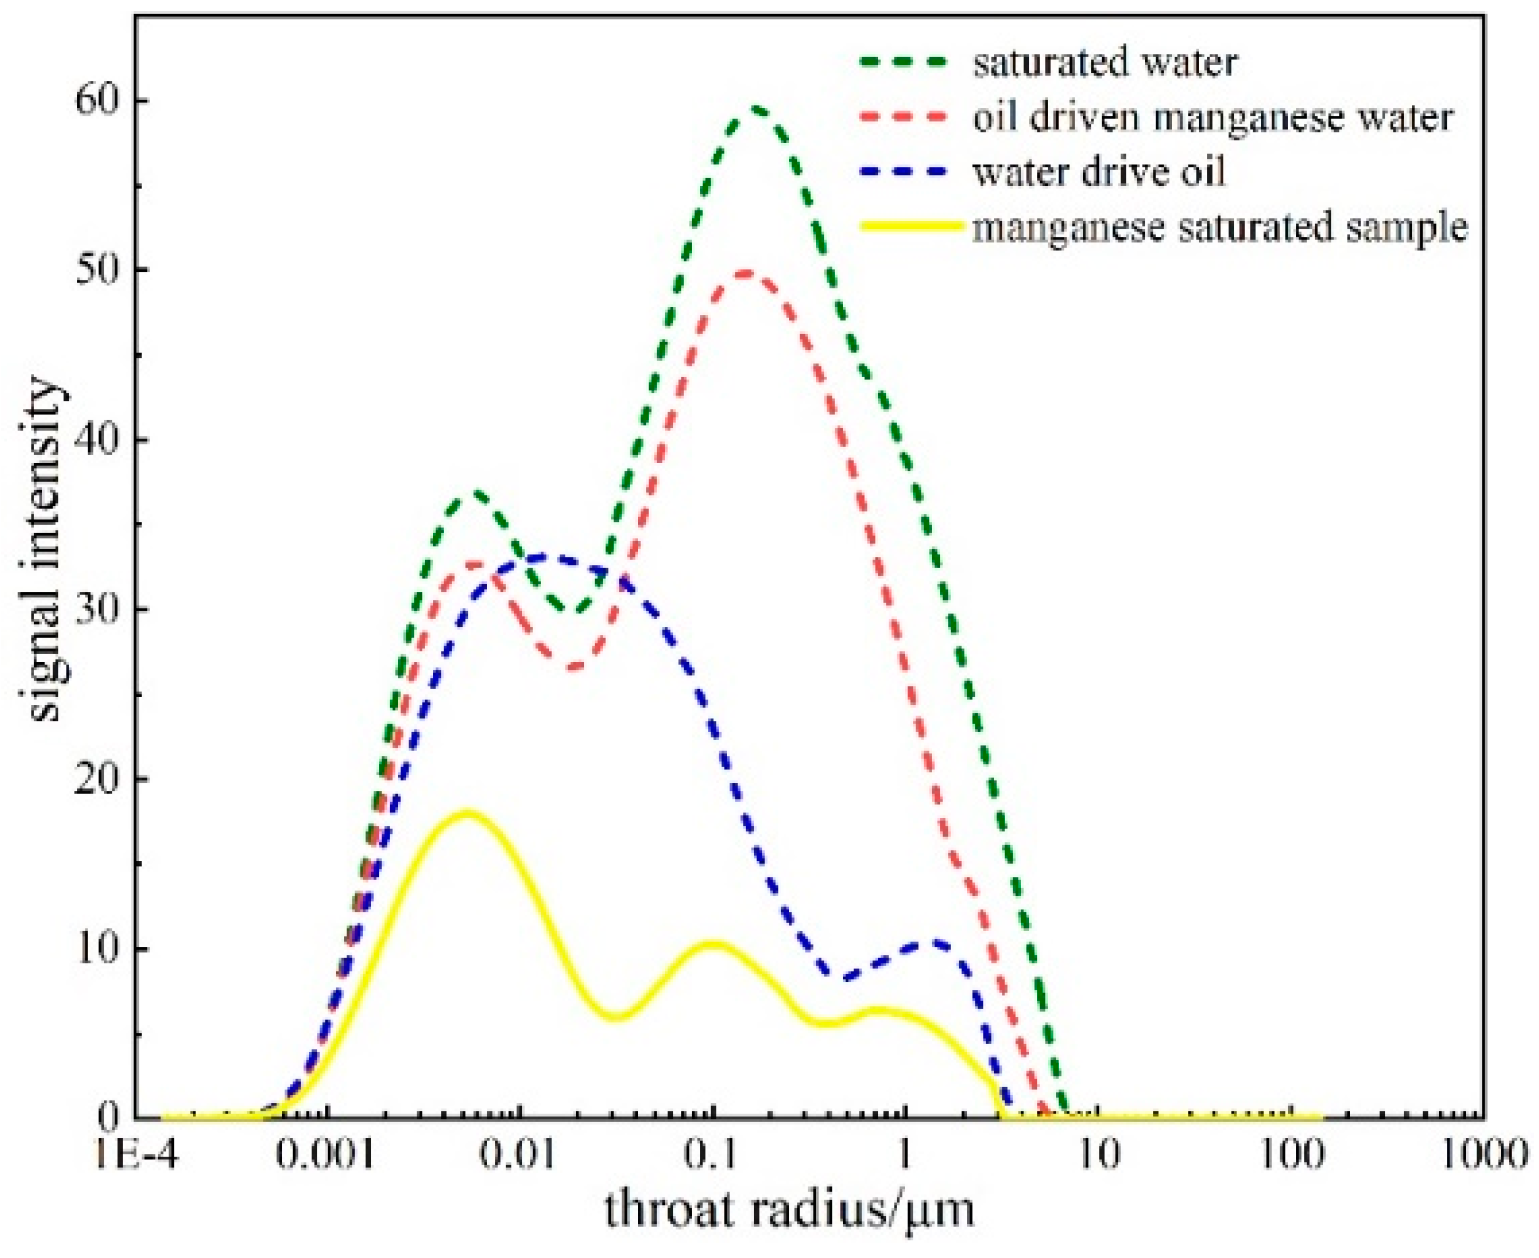
As is shown in Figure 2 and Figure 3, the right peak of the T2 spectrum curve after oil displacement by manganese water was significantly lower than the right peak of the saturated sample, while the left peak was significantly higher than the middle peak of the saturated sample. This suggested that a large amount of oil had been displaced and saturated into large pores, with only a small portion of the oil entering into the small pores. Thus, the small pores inside the rock core were the main storage space for the fracturing fluid.
The T2 spectrum after oil displacement by manganese water reflected the existence state of oil inside the rock core under initial oil saturation, while the T2 spectrum after water displacement by manganese water reflected the residual oil retention in pores of different sizes. The initial oil saturation of core slice A-1 was 68.44%, the movable oil percentage was 52.33%, the movable oil saturation was 35.81%, and the extraction degree was 25.92%.
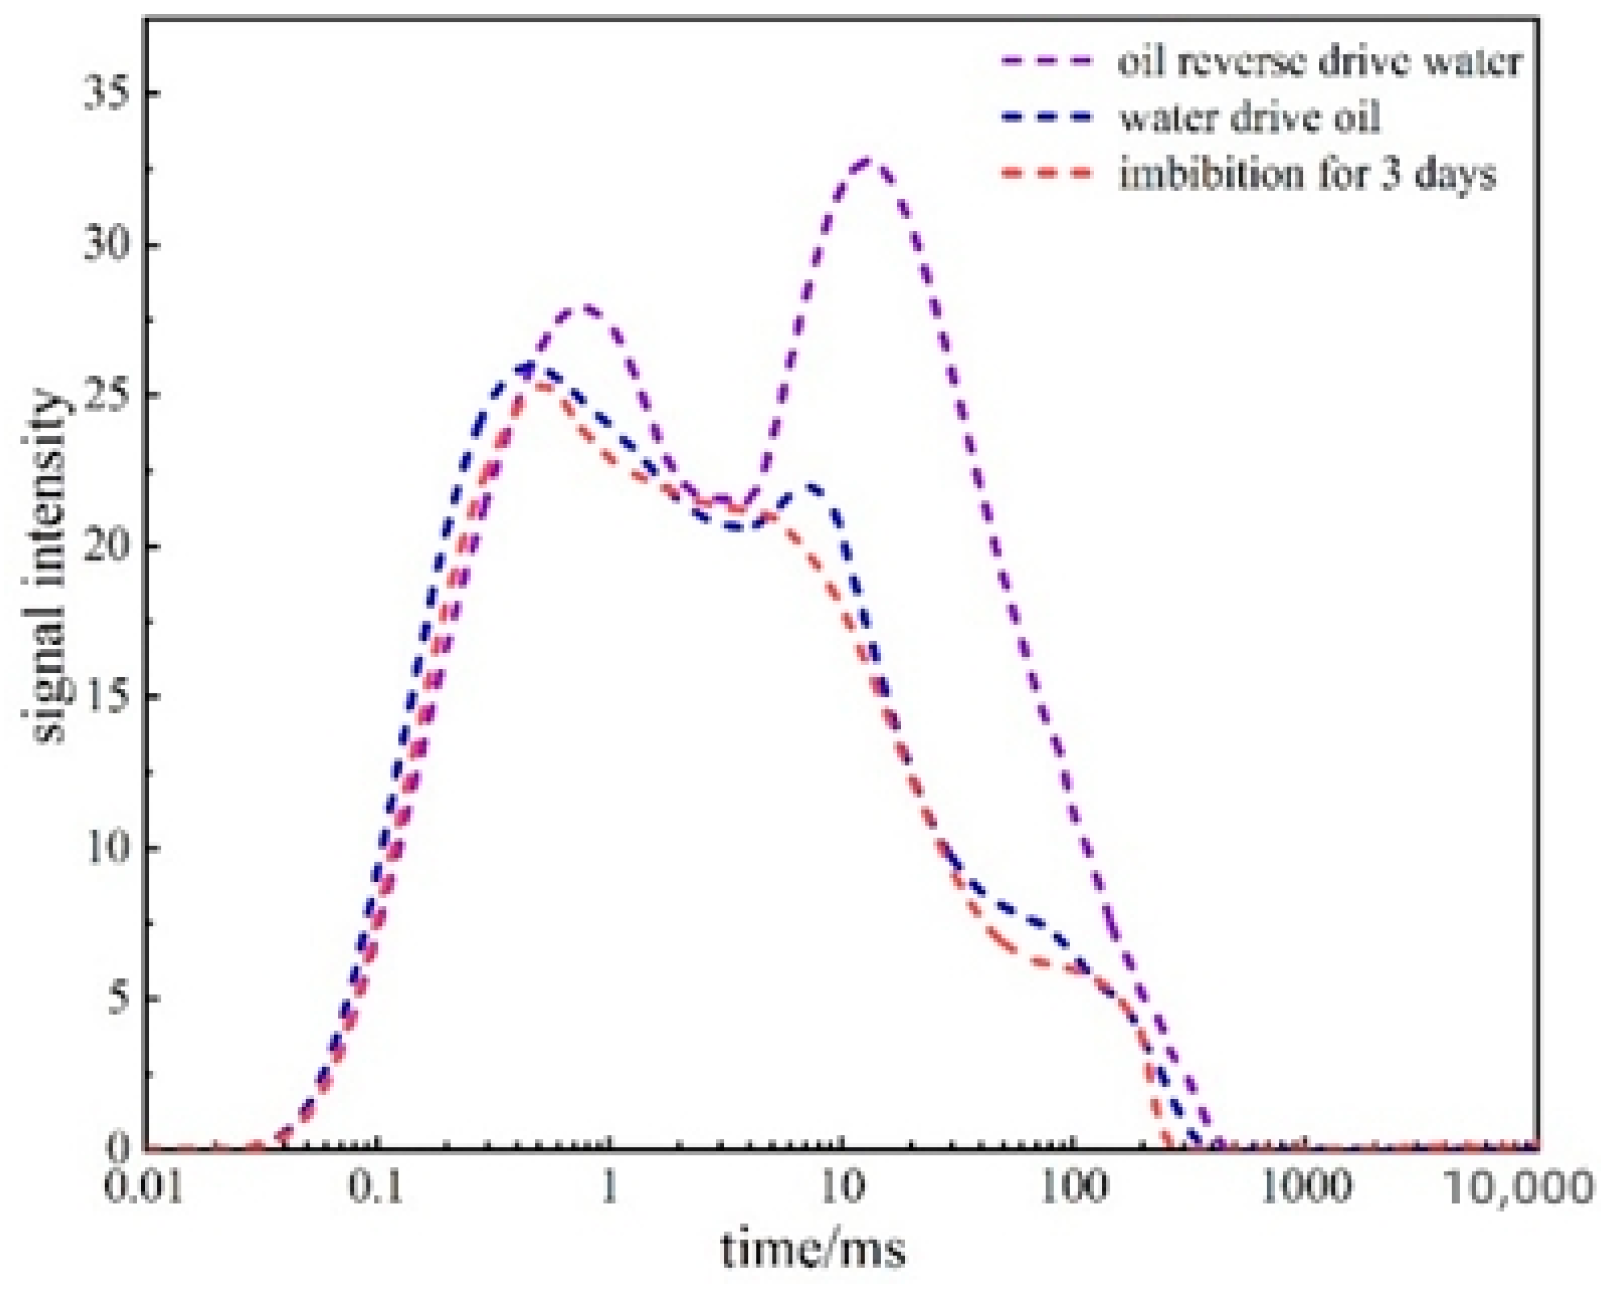
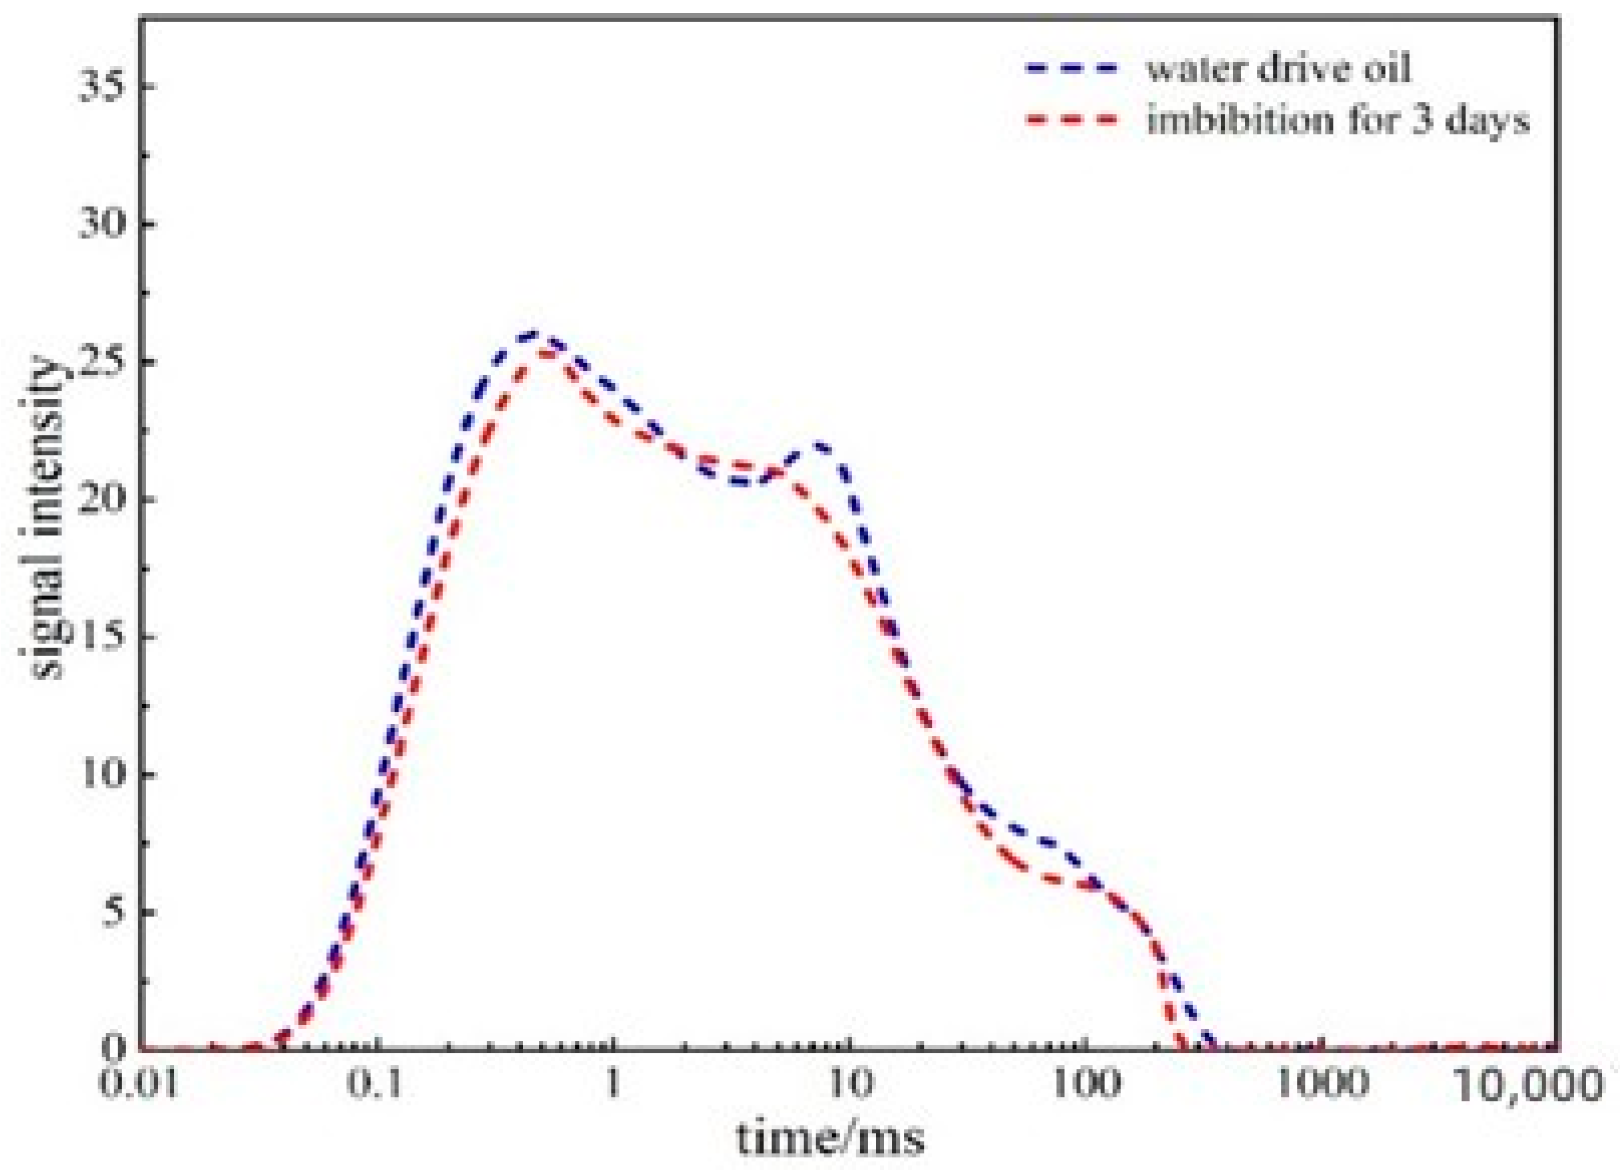
When core slice A-1 was water-flooded to residual oil status and then soaked in a 40% manganese chloride solution for 3 days, it could be seen from Figure 4 and Figure 5 that small pores primarily absorbed the filtrate during the absorption process, displacing the residual oil that could not be displaced, while the medium and large pores did not change significantly. Absorption mainly occurred in small pores. The pore-throat radius of 0.008~0.029 μm was the dynamic pore-throat during shut-in when the filtrate was absorbed and displaced.
When core slice A-1 was soaked for 3 days and then reverse-flooded with oil, this process simulated the expulsion of oil after shut-in. During oil displacement, most of the oil could only flow along the large pore throats, but some water in the small pores was still displaced. Even so, compared to the direct reverse flooding experiment without shut-in, more water remained in the formation after shut-in.
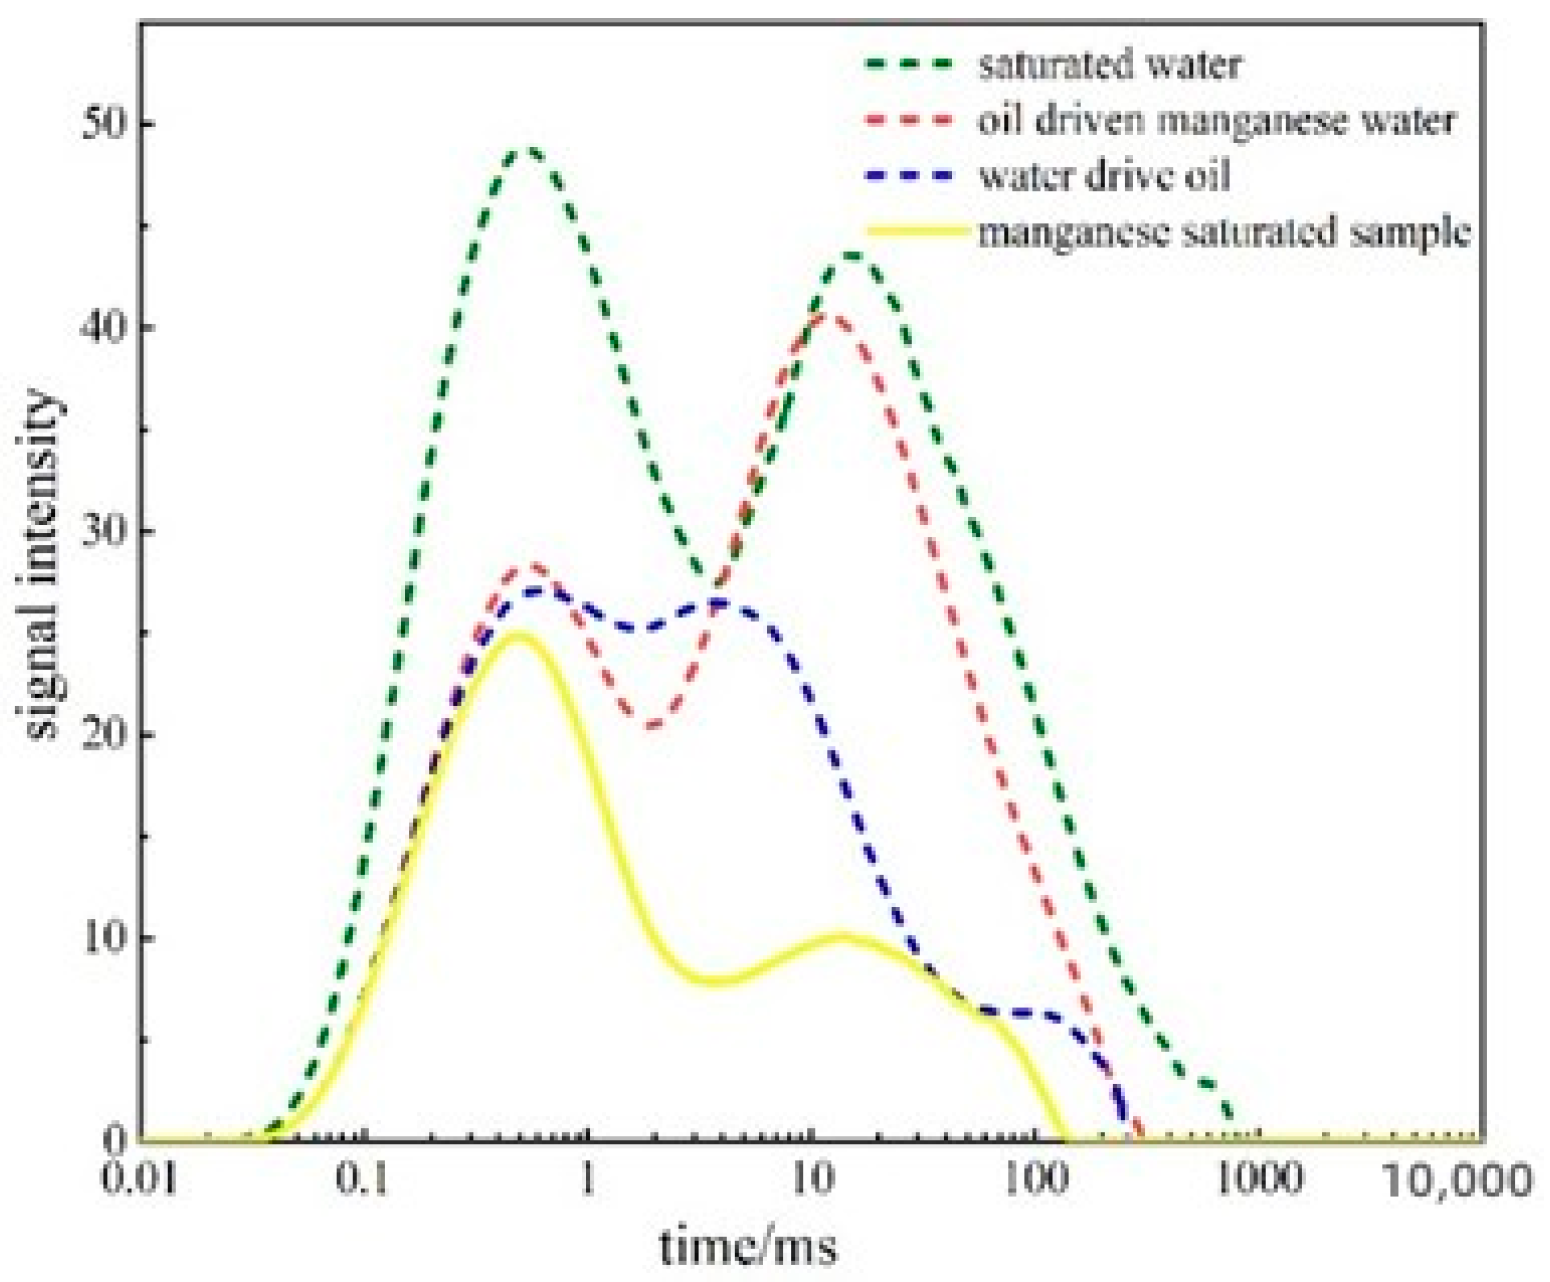
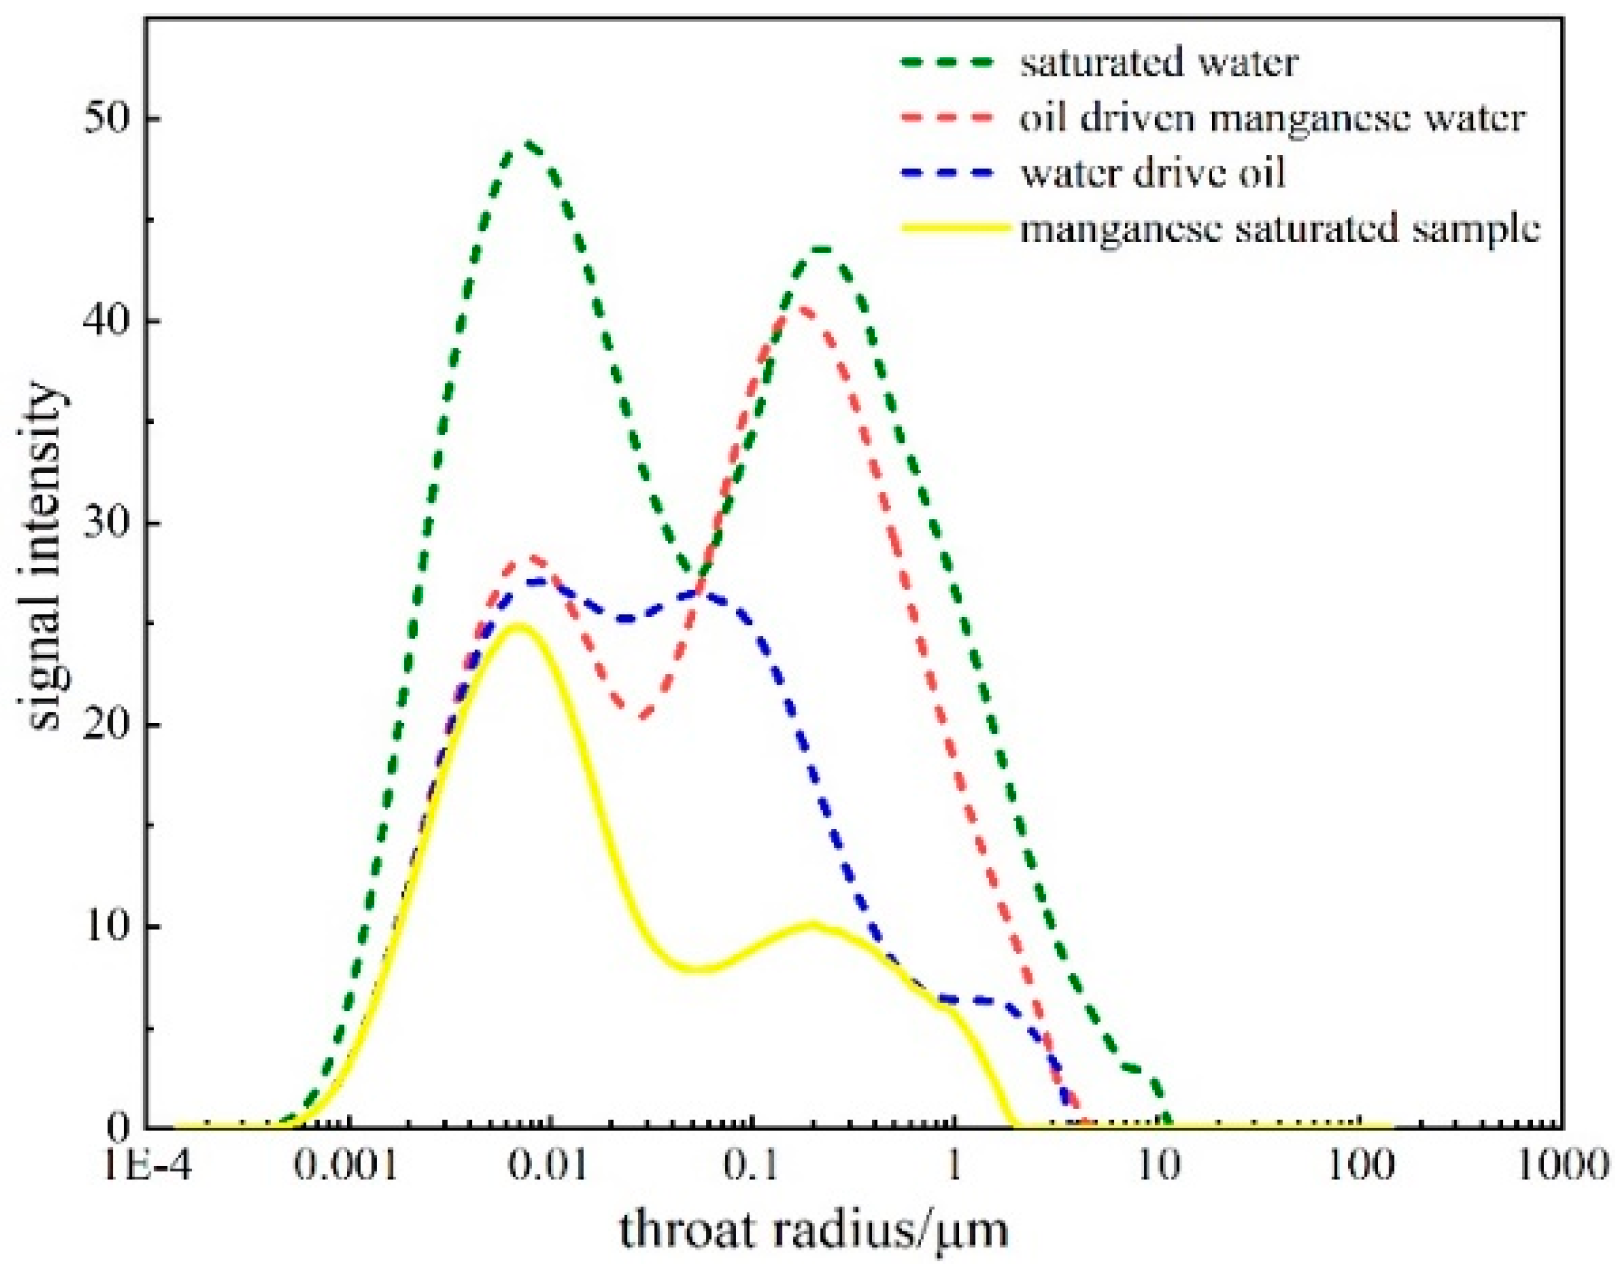
Figure 6 and Figure 7 show the distribution curve of the NMR T2 spectrum and the NMR pore diameter spectrum for the saturated sample, manganese-saturated sample, oil-saturated sample, and after water flooding in core slice A-2. At this time, the water signal inside the rock core had been shielded by Mn2+. The initial oil saturation of core slice A-2 was 48.90%, the movable oil percentage was 60.72%, the movable oil saturation was 29.69%, and the extraction degree was 23.72%. During water flooding, the main oil in the large pores was displaced, with a small amount of oil and water existing in tiny pores in an interpenetrating manner, causing the T2 spectrum distribution curve after water flooding to be slightly larger than the curve during oil saturation. The filtrate was in the micropores where T2 < 1 ms.
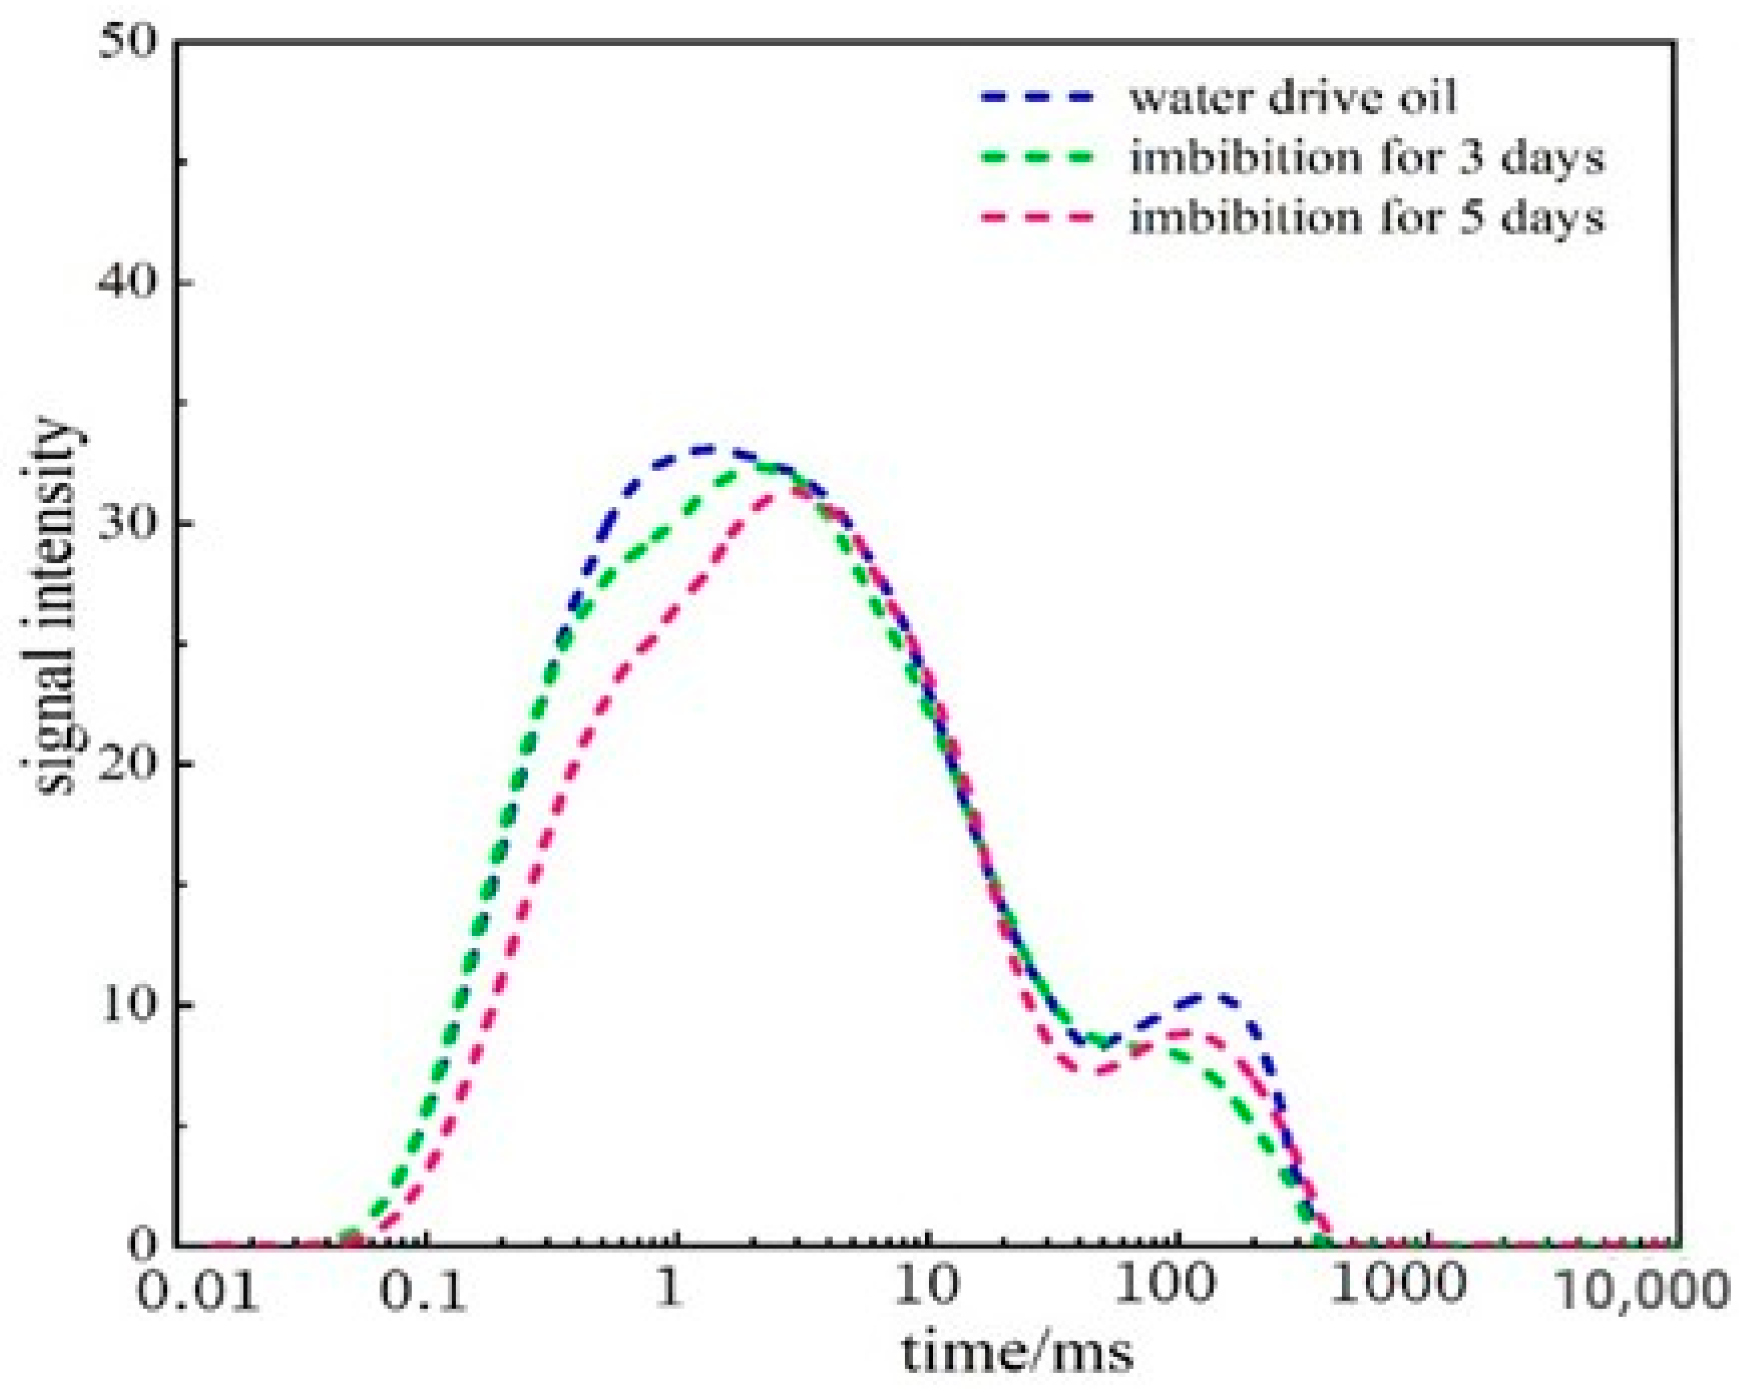
Figure 8 and Figure 9 show that after core thin section A-2 had been soaked for five days, it underwent a secondary oil displacement experiment. During the soaking process, the manganese solution absorbed into the small pores displaced the oil, which was then expelled from the large pores. After oil displacement, a substantial amount of manganese solution remained within the thin section. When oil re-entered, it struggled to penetrate the already filled pores and therefore could only flow along the larger pores with relatively high permeability. During the mud loss shut-in process, the pores with a throat radius of 0.003~0.022 μm were the pores that displaced the oil.
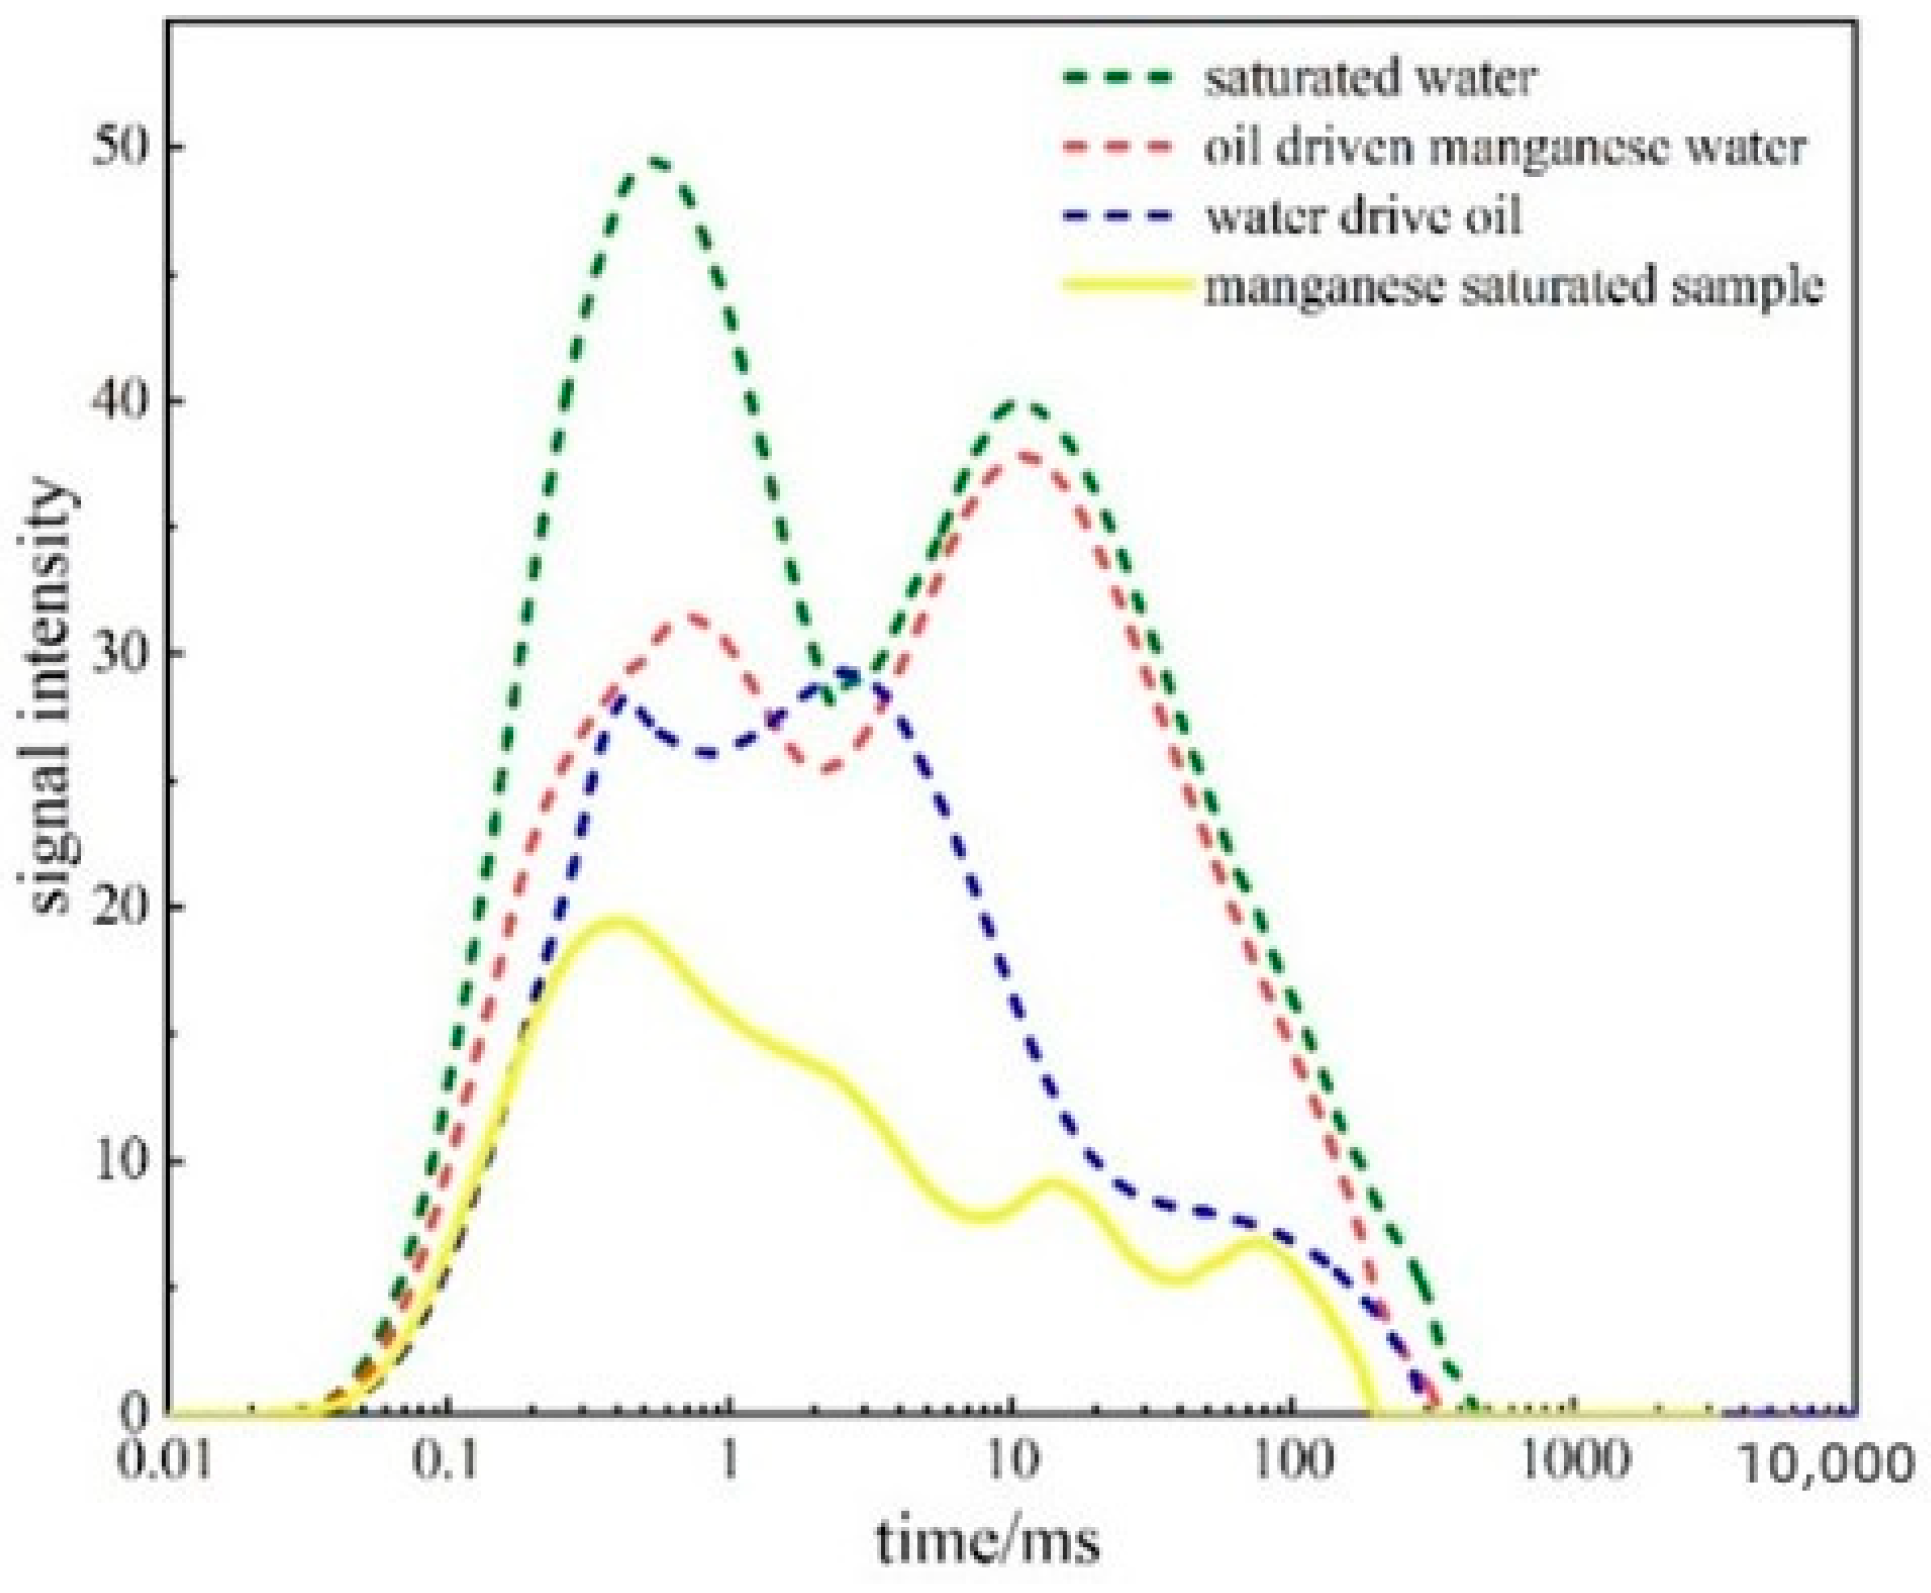
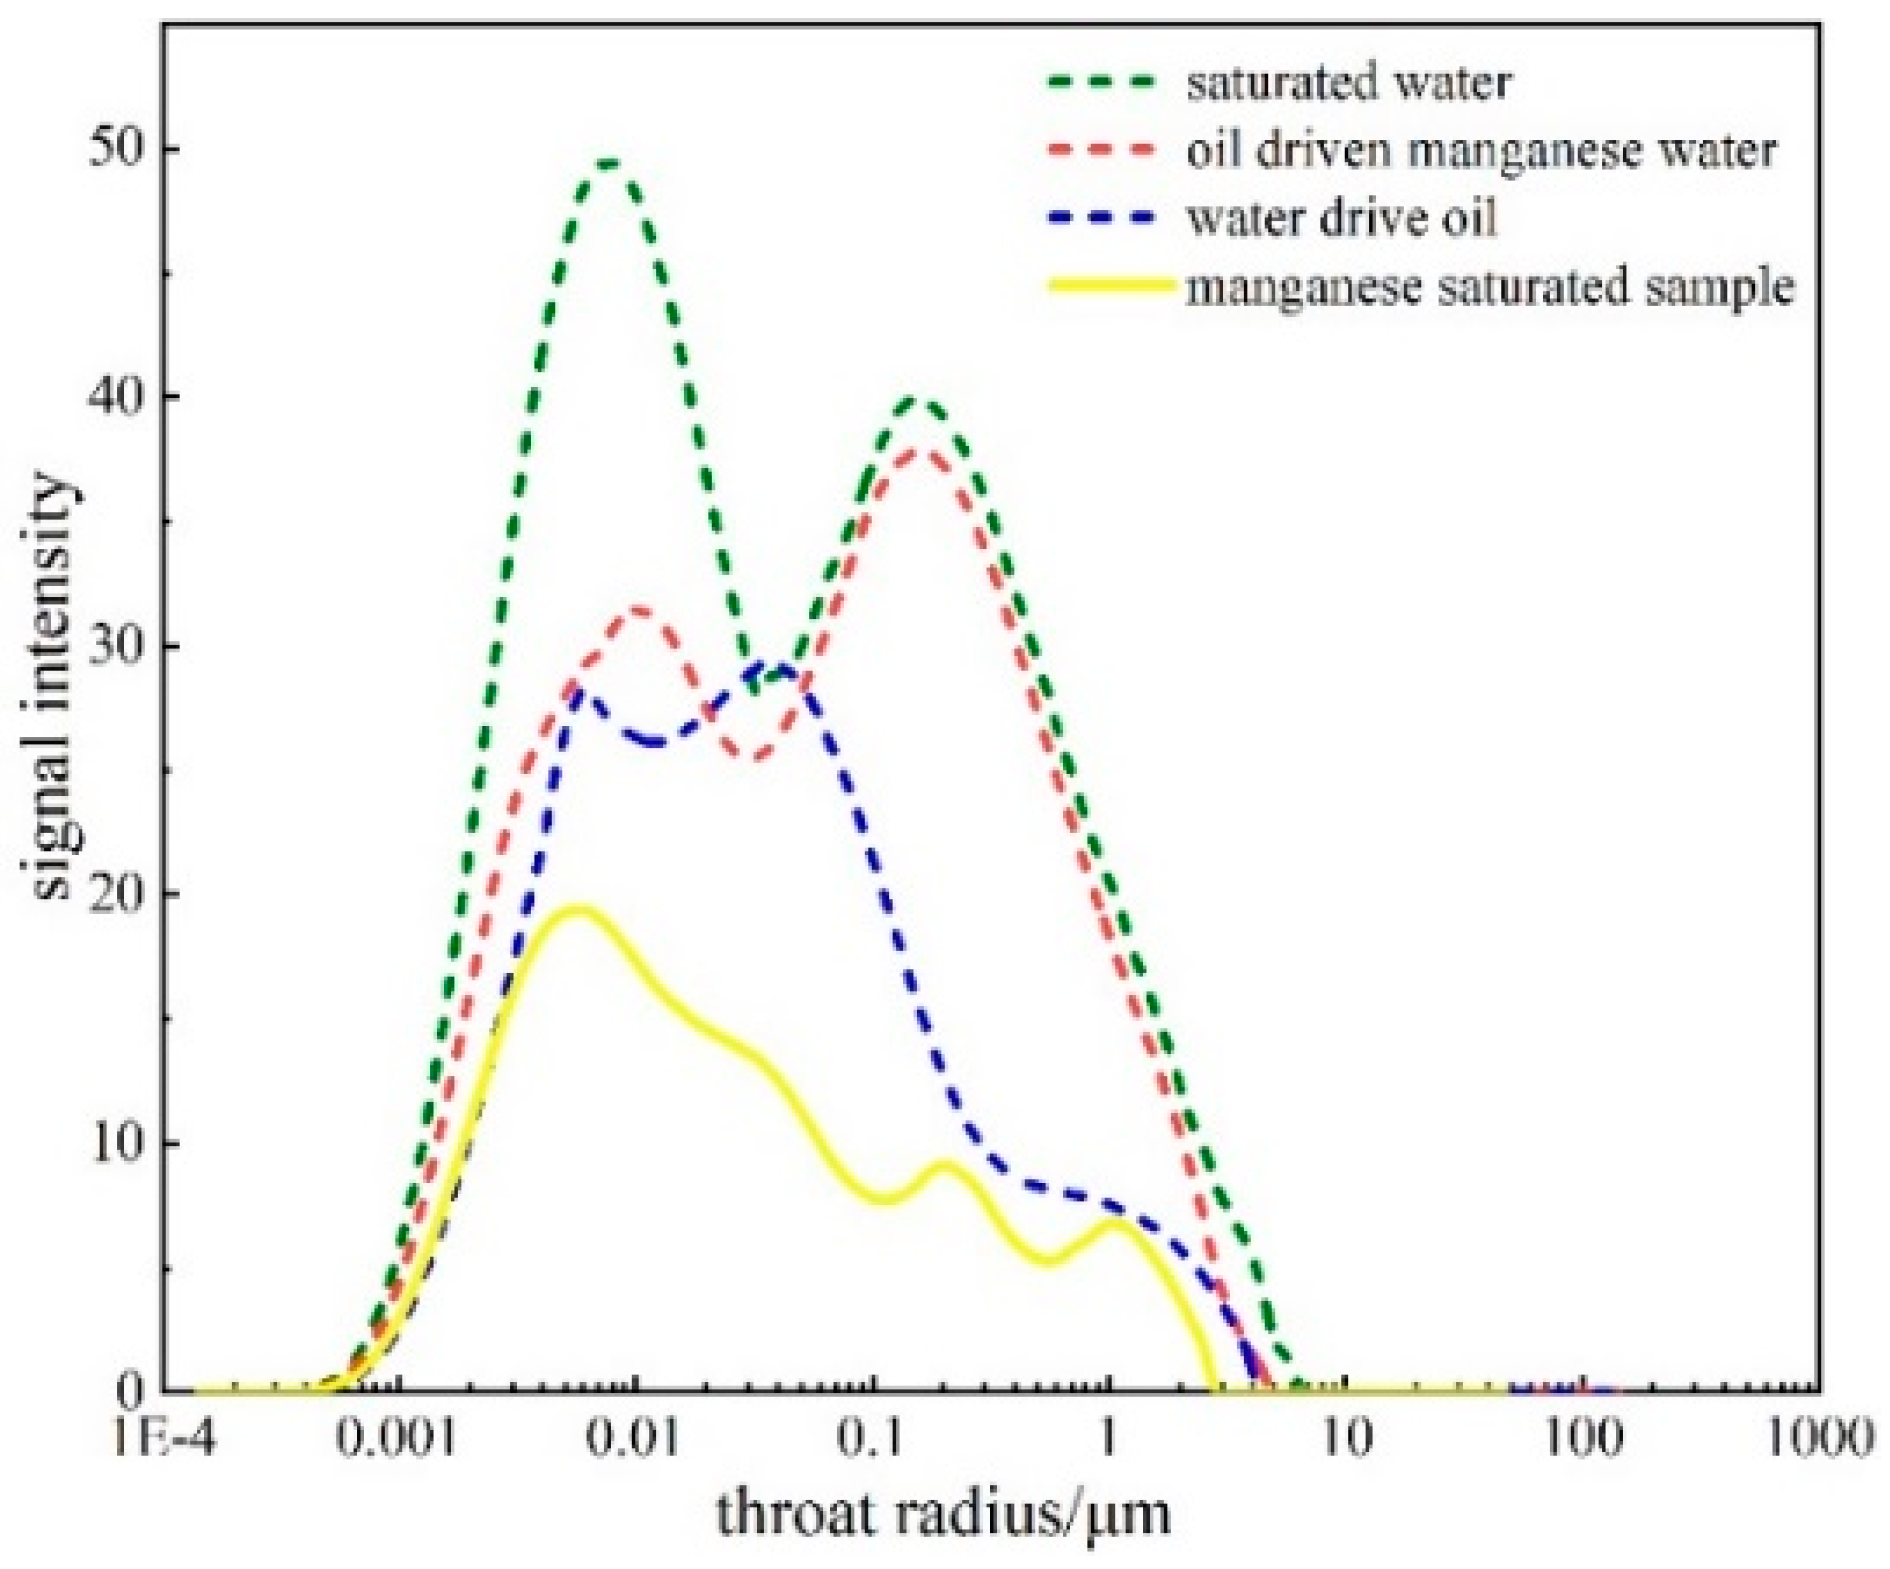
By analyzing Figure 10 and Figure 11, it was found that the main resistance to oil displacement came from capillary forces. This led to oil advancing along the large pore channels first, only entering the small pores when the displacement pressure exceeded the capillary pressure of the small pores. However, most of the oil continued to move along the oil channels in the larger pores. Hence, the majority of the bound water was located in smaller pores. Due to the irregular shape of larger pores, bound water also existed in the dead corners, but the bound volume was relatively less.
The initial oil saturation of thin section A-3 was 55.82%, the movable oil percentage was 63.77%, the movable oil saturation was 35.60%, and the recovery degree was 26.93%. The T2 spectral distribution curve significantly decreased after water drove oil, suggesting that water primarily expelled kerosene from the large pores. Owing to the narrow and long pore throats of low-permeability reservoirs, the oil phase tended to be trapped in small pores, suppressing some crude oil movement and blocking existing oil-water channels. This caused oil droplets to aggregate in small pores, increasing the chance of conversion into residual oil and thus affecting the oil recovery rate. Residual oil might have existed in dead corners within large pores due to their irregular shape. The NMR T2 spectrum of thin section A-3 showed that the filtrate remained in the micropores and small pores of the reservoir.
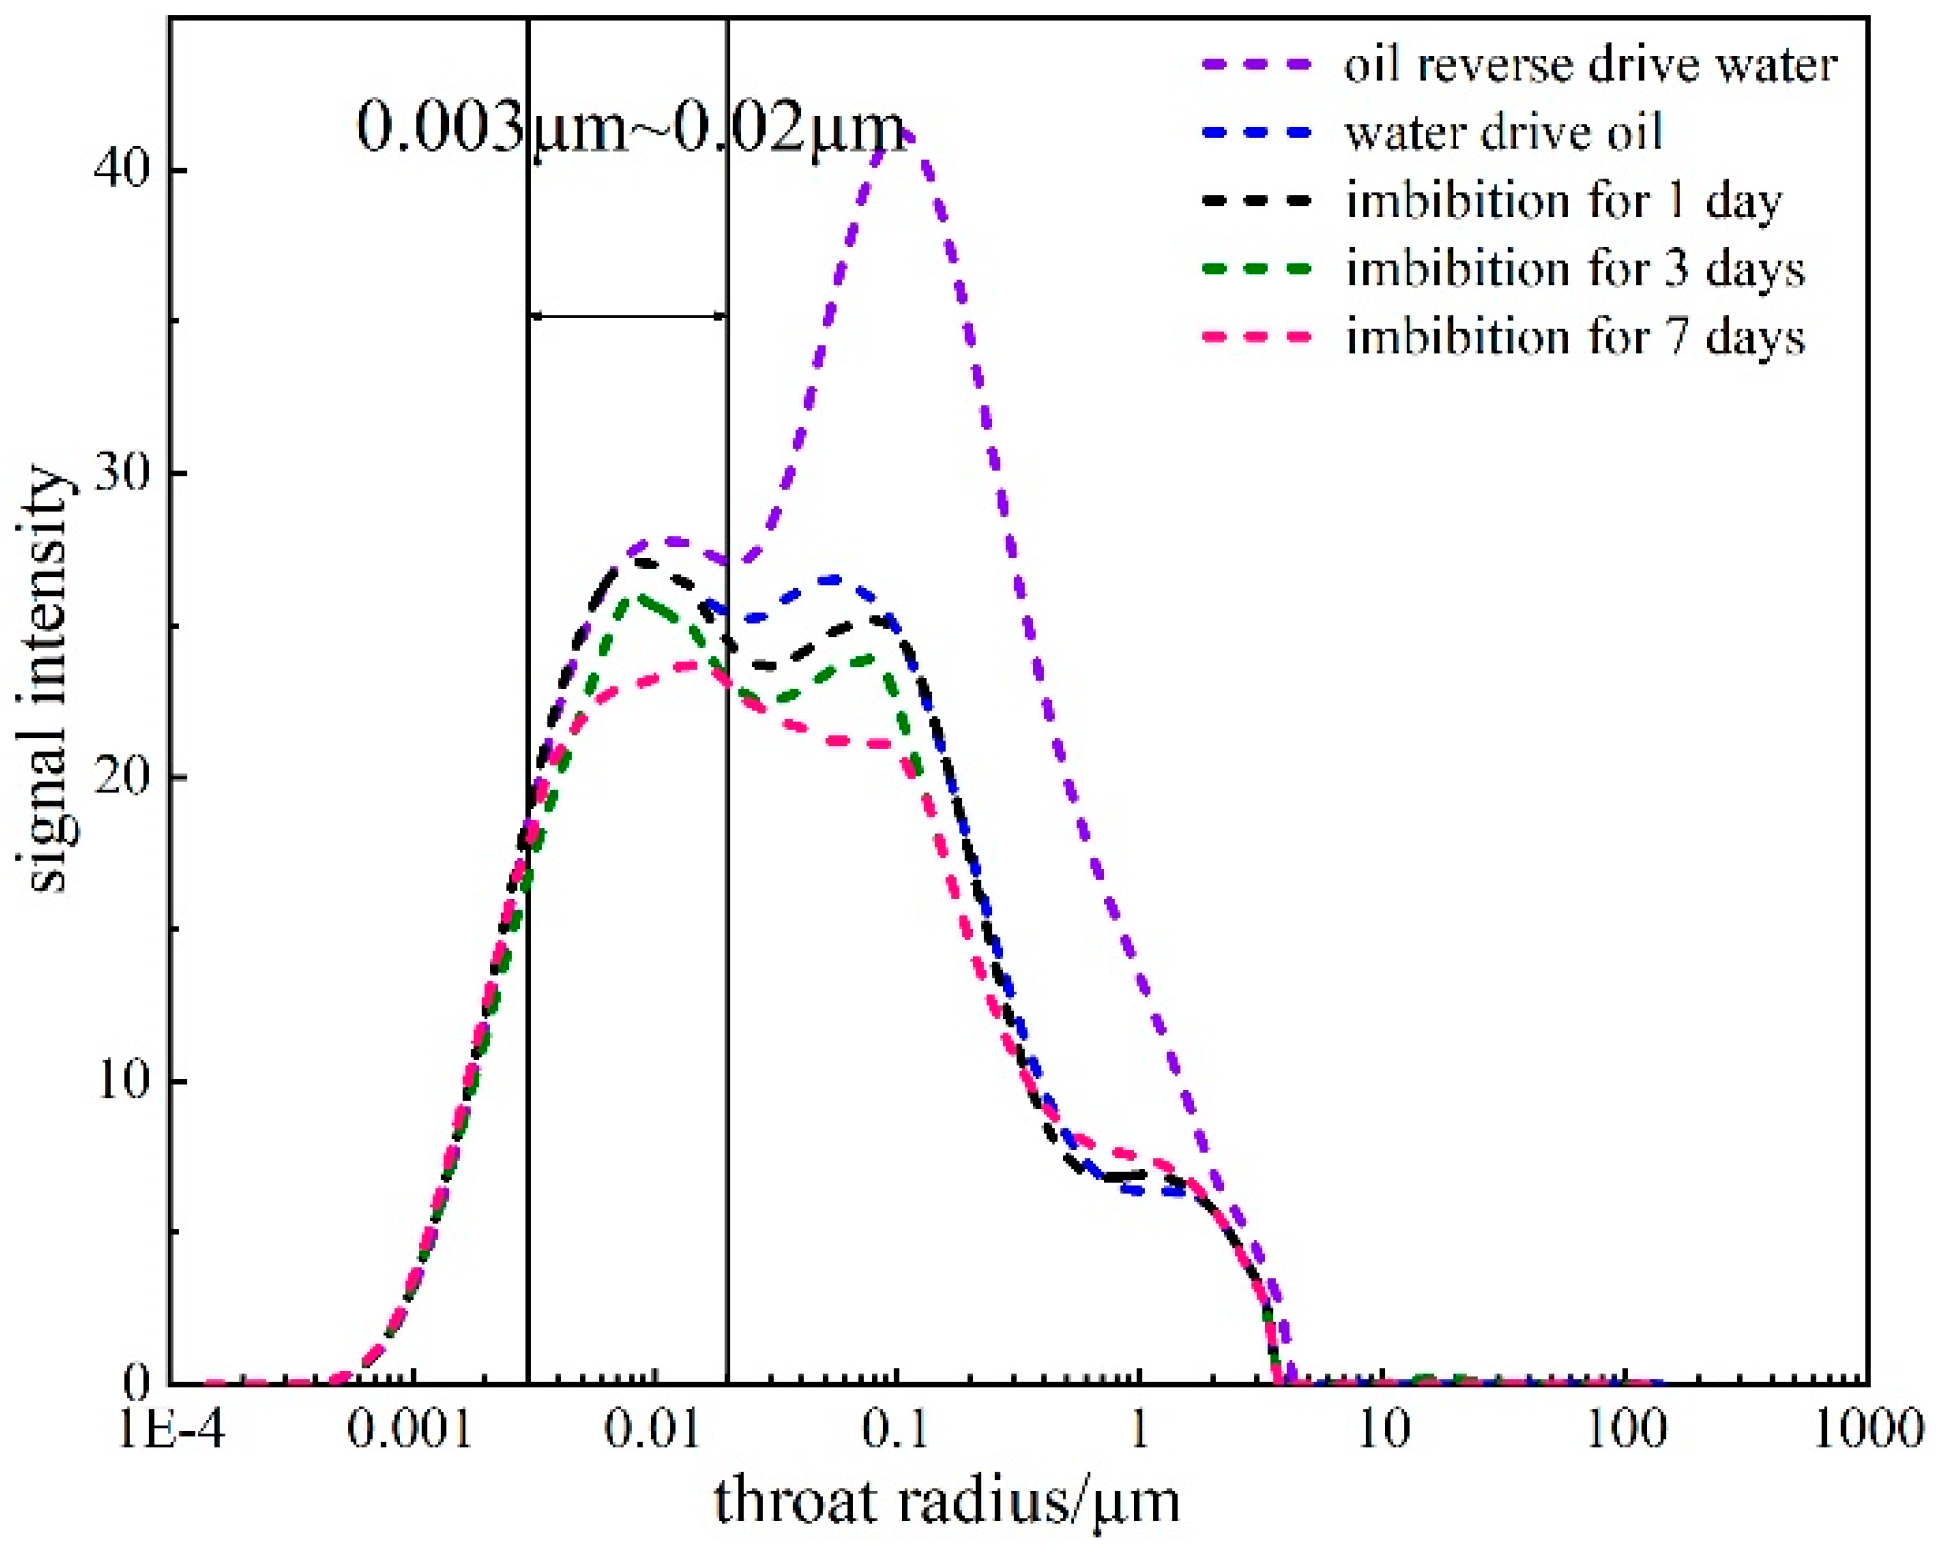
Figure 12 demonstrates that as the soaking time increased, the left side of the T2 spectral distribution curve gradually decreased, while the right side slightly increased. Since the core thin section was in a residual oil state during shut-in, the increase on the right side of the curve was not obvious. This suggested that as the shut-in progressed, the oil in the small pores was displaced by the retained filtrate and expelled from the large pores. When simulating the process of oil entering the wellbore with an oil displacement experiment, a substantial amount of filtrate remained in the thin section and had not been expelled. The more water retained at this time; the more oil was displaced during shut-in soaking. The nuclear magnetic pore size map (Figure 13) showed that during the shut-in of thin section A-3, the pore throat with a radius of 0.003 μm~0.02 μm was the main soaking displacement power pore throat.
From Figure 14 and Figure 15, the T2 spectral distribution curve showed a lower right peak than the left peak during oil saturation. This indicated that when oil displaced water, oil first advanced along the large pores with less capillary force, expelling the water therein and forming a bypass around the water in the middle small pores. When the water in the small pores lost its drainage channel, a large amount of bound water formed.
The initial oil saturation of thin section A-4 was 61.81%, the movable oil percentage was 62.09%, the movable oil saturation was 38.38%, and the recovery degree was 25.92%. The T2 spectral distribution curve after water drove oil shifted to the right compared to when oil was saturated, indicating that due to the presence of pressure during displacement oil and water entered smaller pores, co-existing in a state of mutual invasion, although there might have been minor errors. The NMR T2 spectrum showed that the filtrate, which entered the formation, existed in the micro and small pores.
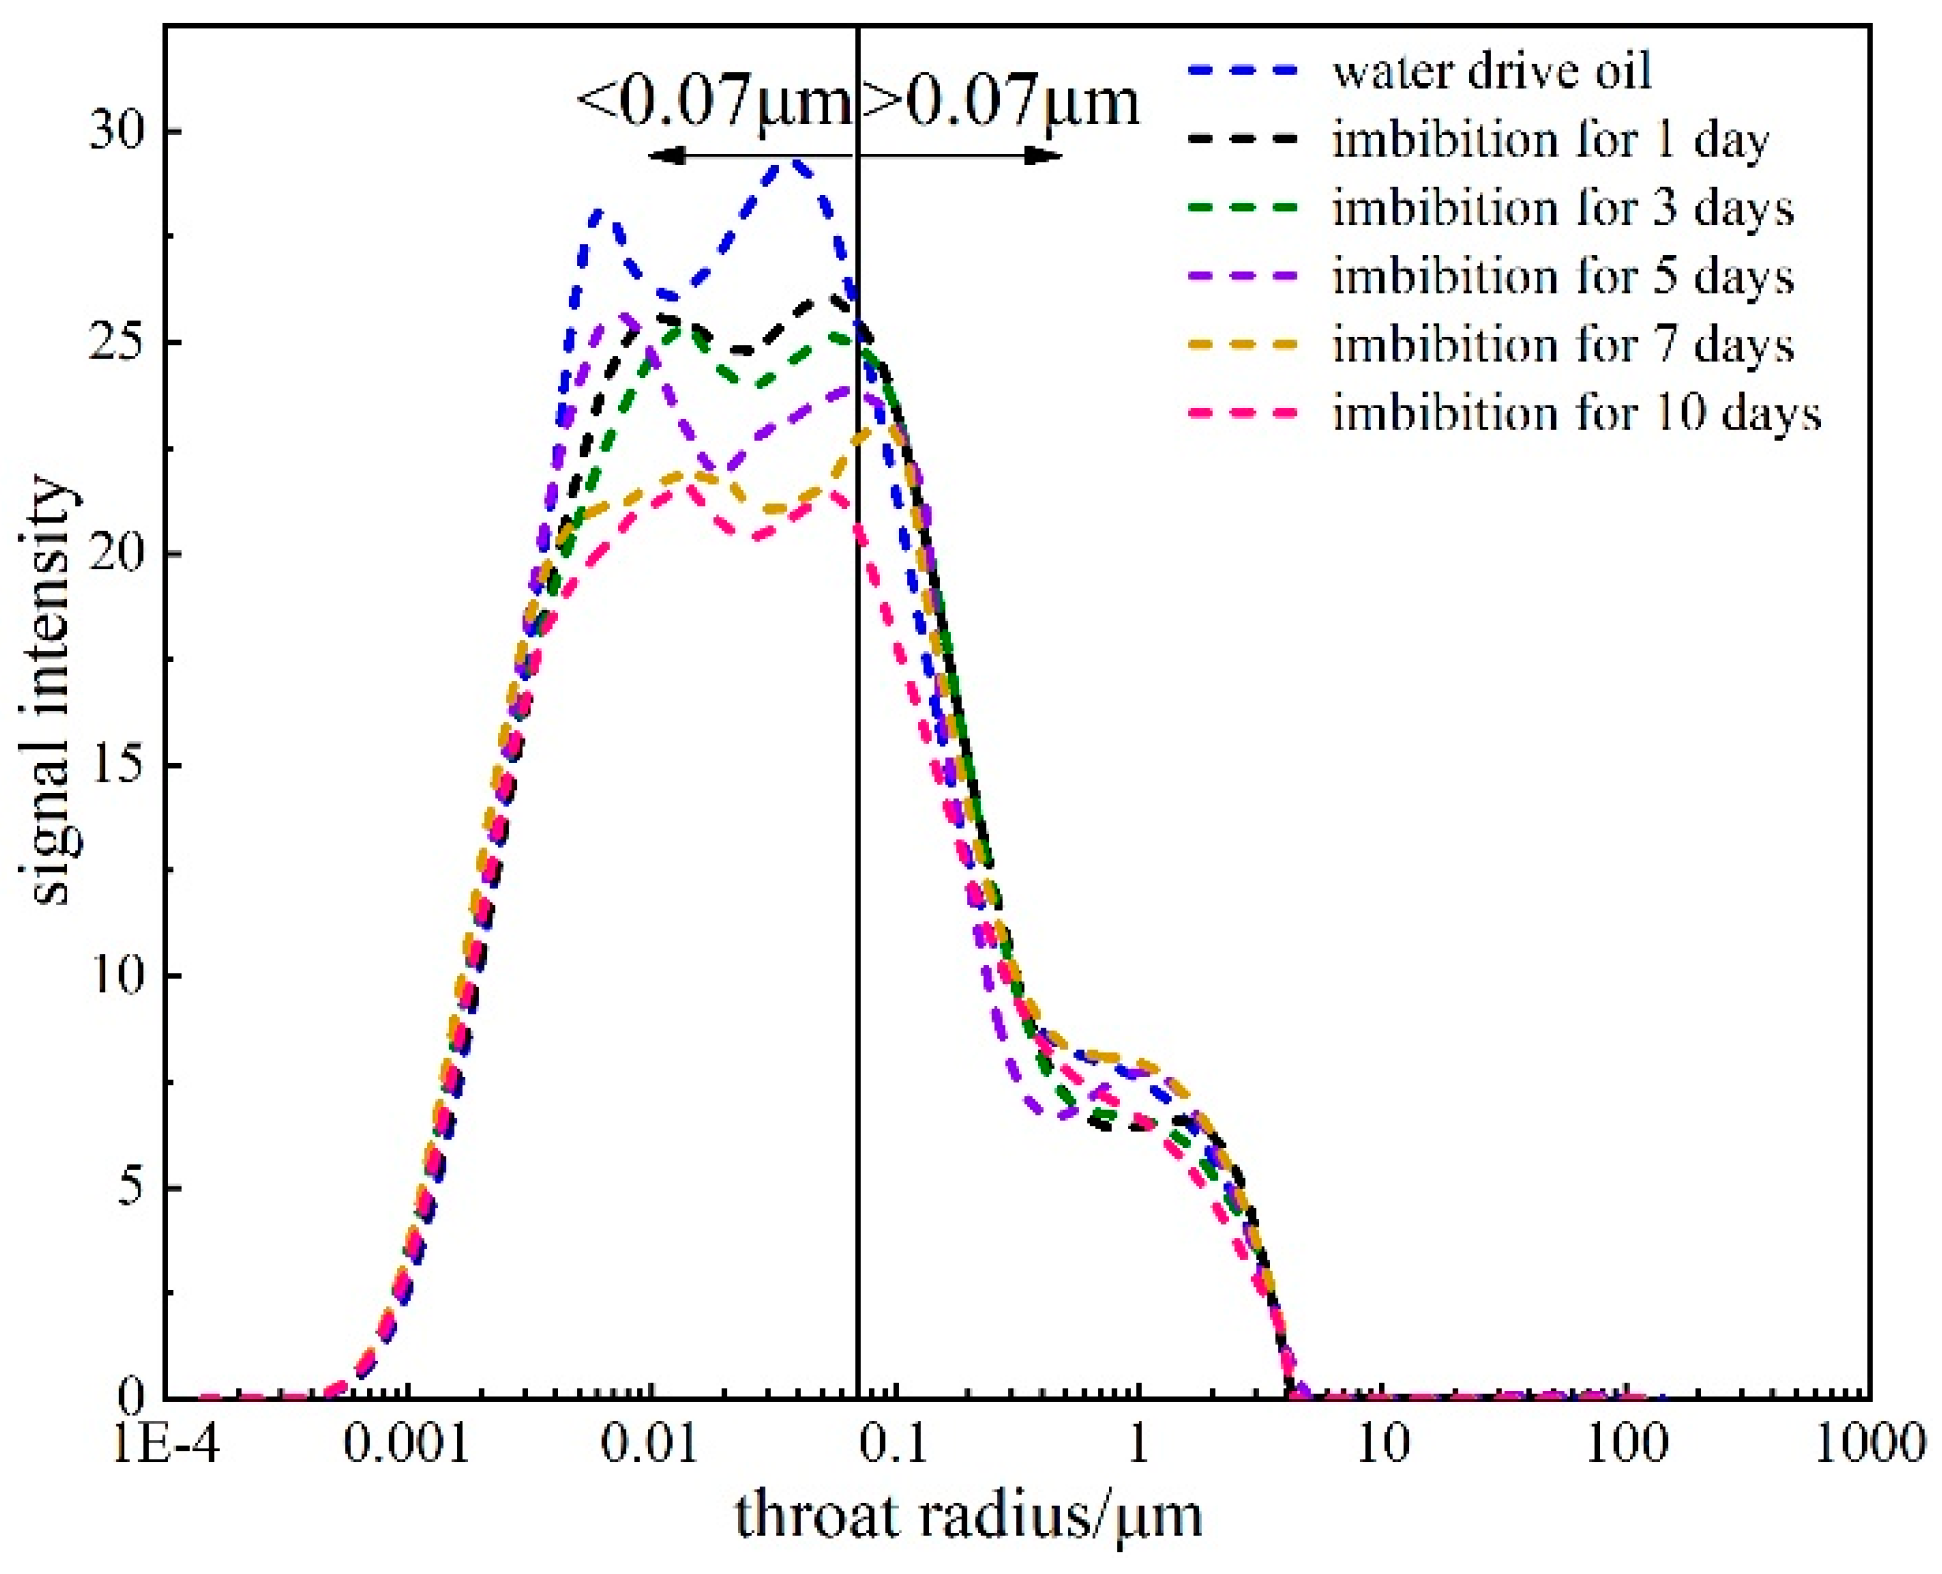
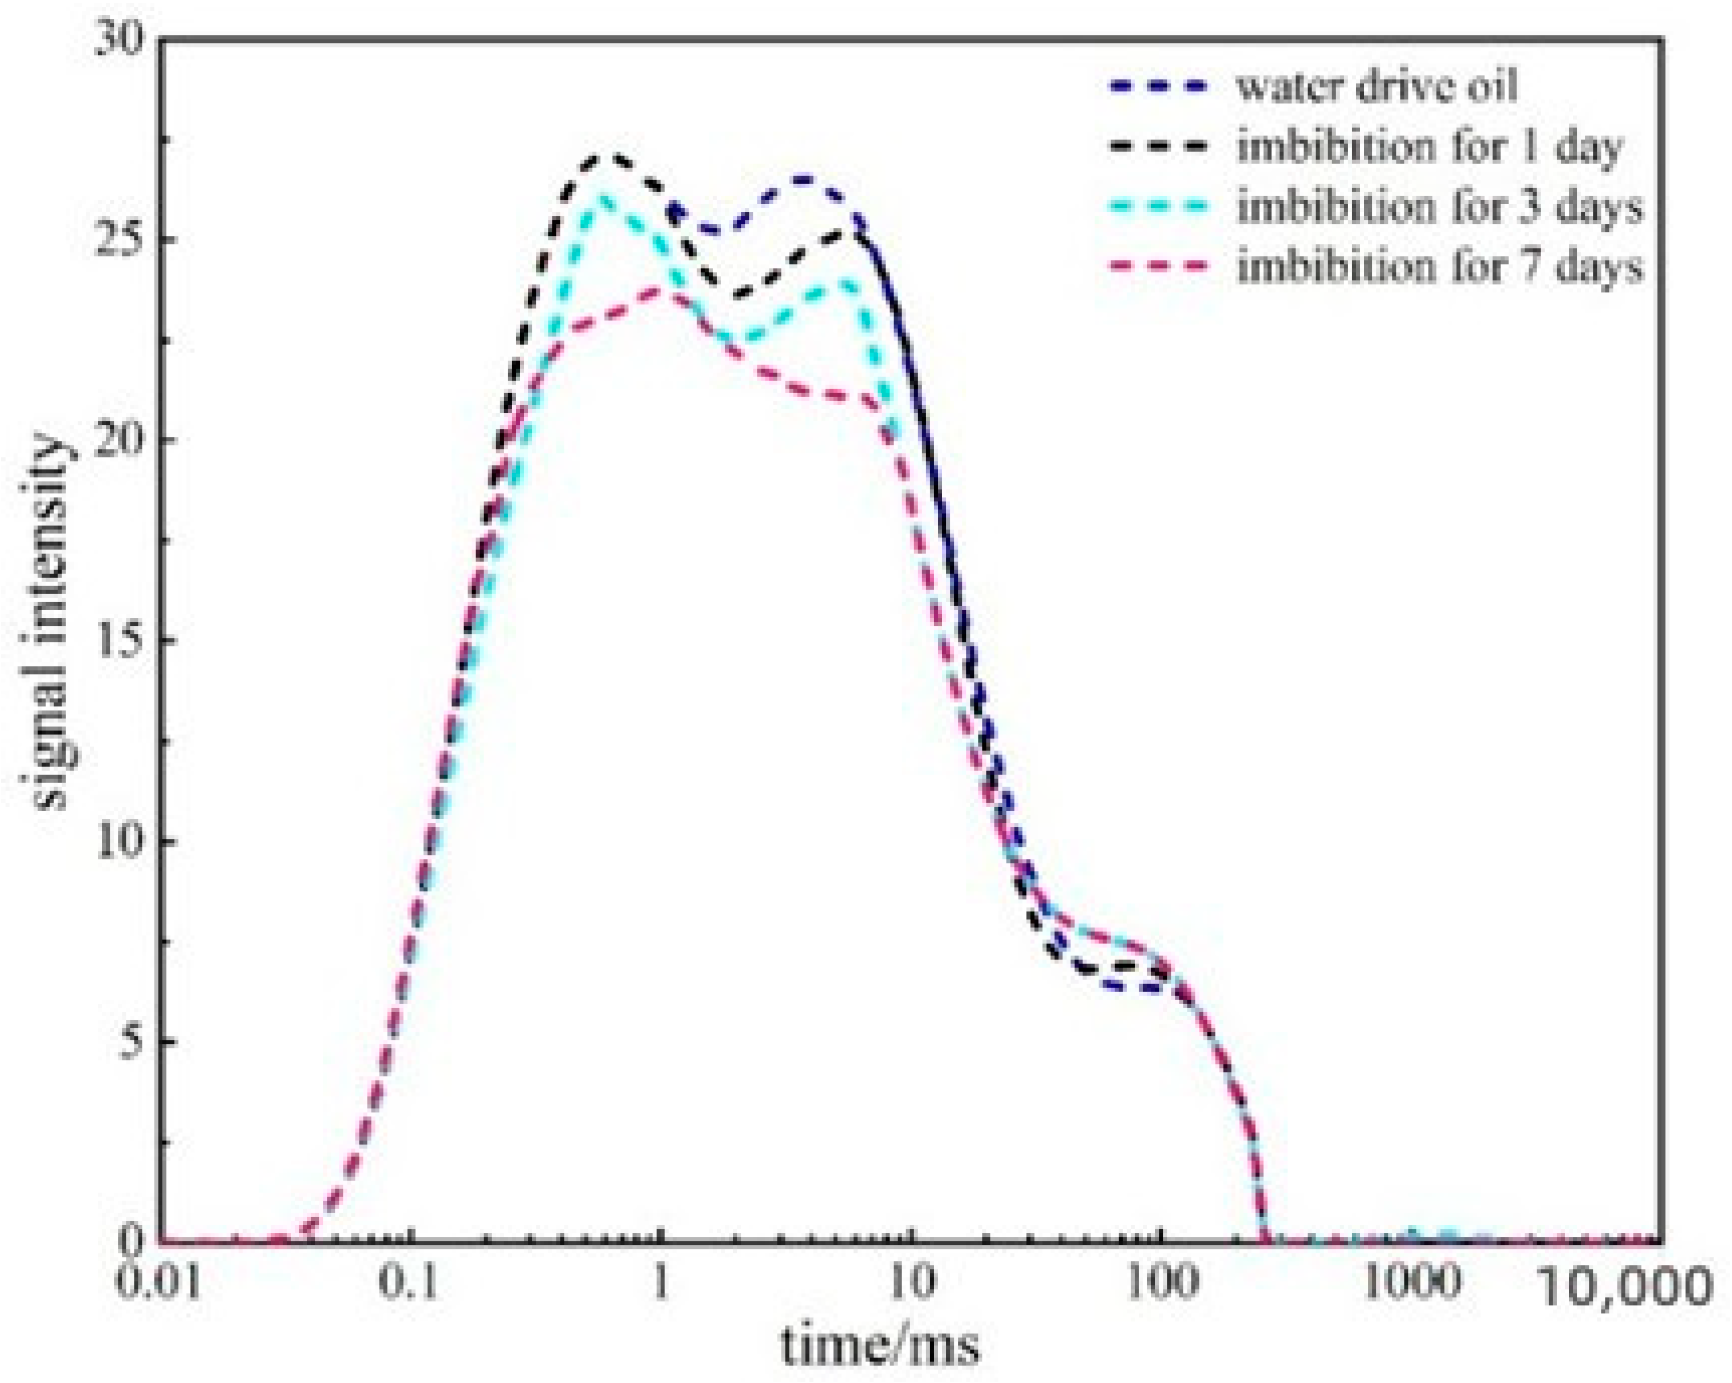
As the shut-in time progressed, the T2 spectral distribution curve representing small pores gradually decreased, while the curve representing large pores gradually increased. This suggested that soaking was a process where small pores absorbed water and large pores expelled oil. However, by the tenth day, the right side of the curve decreased, indicating that by the tenth day of shut-in under residual oil conditions, almost no oil was expelled. During the shut-in process, the power pore throats were those with radii smaller than 0.07 μm, while those with radii larger than 0.07 μm were liquid-expelling pore throats, as shown in Figure 16 and Figure 17.
The same trend was observed where the T2 spectral distribution curve representing small pores gradually decreased and the one representing large pores gradually increased as shut-in time progressed. This demonstrated that soaking was a process where small pores absorbed water and displaced oil to larger pores. However, by the tenth day, the right side of the curve decreased, indicating that by the tenth day of shut-in under residual oil conditions, almost no oil was expelled. During the shut-in process, the power pore throats were those with radii smaller than 0.07 μm, while those with radii larger than 0.07 μm were liquid-expelling pore throats.
Figure 18 presents the nuclear magnetic resonance pseudocolor images of core thin section A-3 at different stages. Compared with the post-oil displacement, the signal intensity was higher when the sample was water saturated. This indicated that when oil was saturated, due to the presence of capillary forces, oil first advanced along large pore throats. As the displacement pressure increased, it gradually entered the small pores; hence, a large amount of bound water existed in small pores at this time. During the secondary oil displacement, the signal intensity significantly decreased compared to the first oil entry, indicating that it was difficult for oil to re-enter the small pores already filled with oil and water. Most of the oil could only flow and be expelled along the large pores. Comparatively, after 3 days of shut-in displacement (A-2) and after 7 days of shut-in displacement, more manganese water was retained in the thin section than in A-1 without shut-in displacement.

3.2. Optimization of the Shut-In Time Method Post-Fracture

As observed in Figure 19, Figure 20, Figure 21 and Figure 22, the NMR distribution curves reveal that during the soaking periods of 3, 5, and 7 days, the curve representing small pores gradually decreased, while the curve for large pores conversely increased. This suggested that soaking was a process of oil displacement from small pores, followed by expulsion from large pores. However, after soaking for 10 days, the curve representing large pores decreased, indicating that the large pores in the core thin sections no longer expelled oil. Hence, for cores under residual oil conditions, the expulsion of oil from large pores was essentially finished after soaking for 7 days, and the effect of extending the shut-in time was generally diminished.
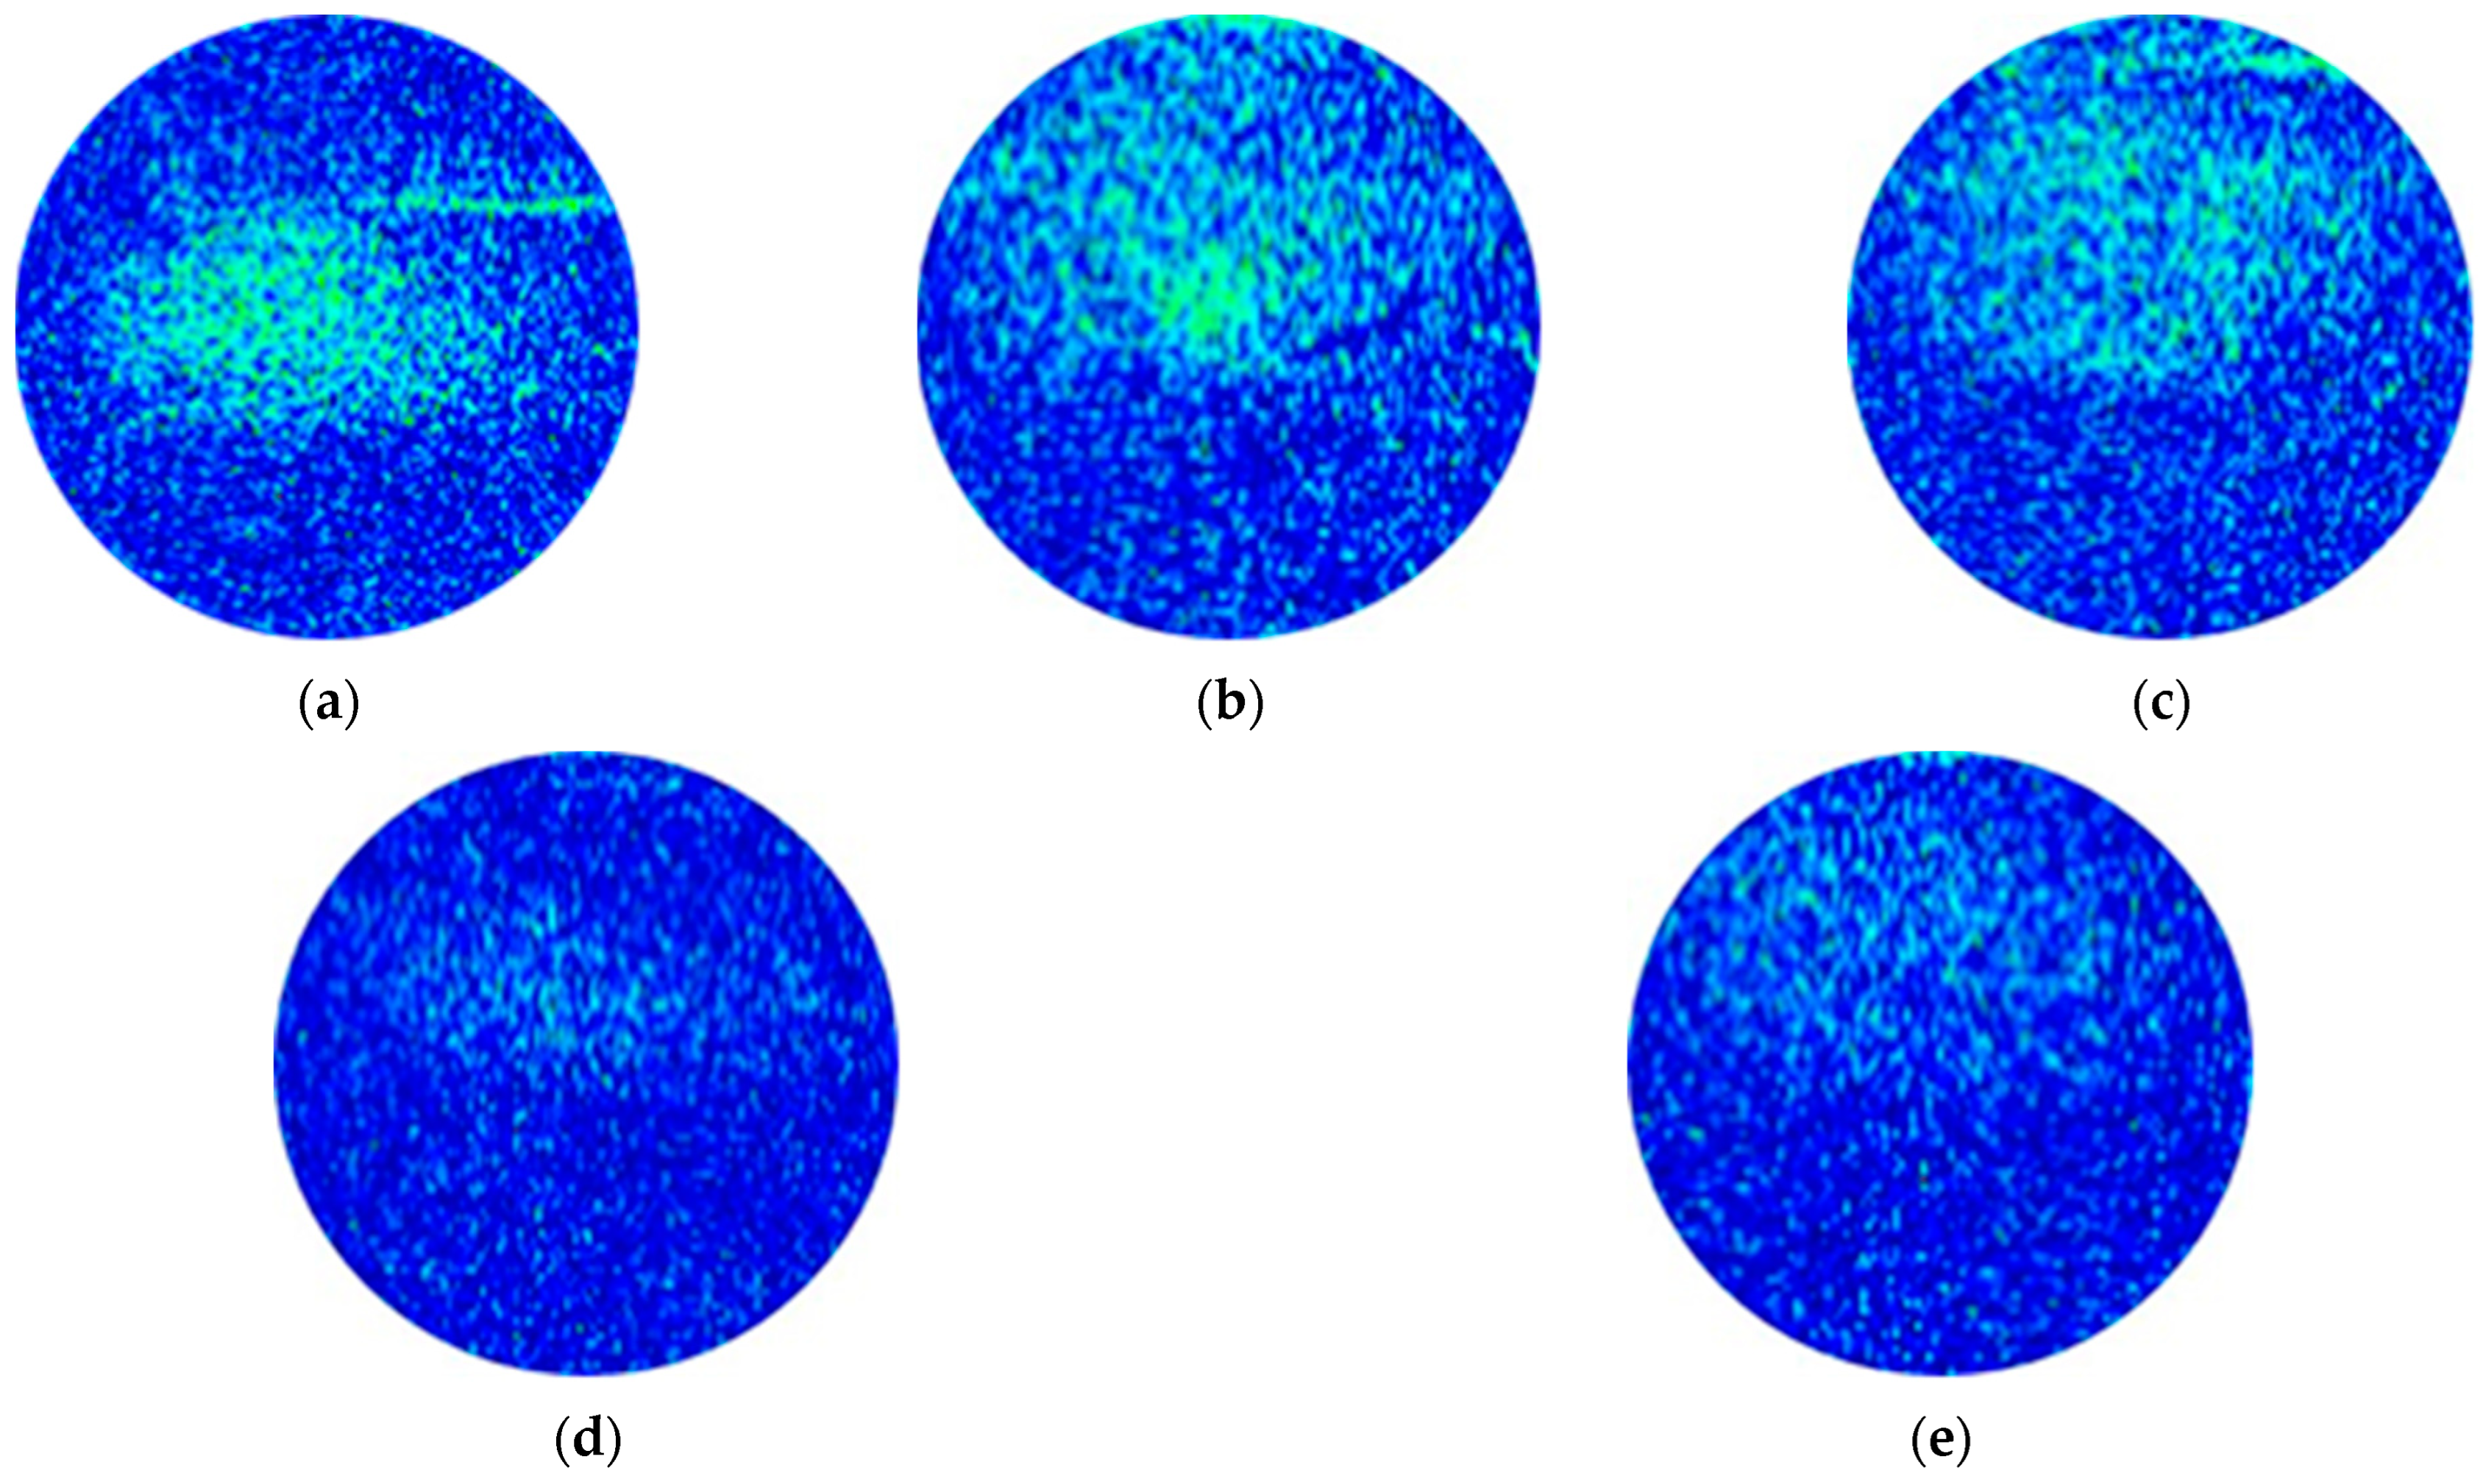
As depicted in Figure 23, with the extension of shut-in time, the signal intensity after oil counter-flushing decreased, indicating that the longer the shut-in time, the more filtrate remained in the core after oil counter-flushing. This meant that more crude oil was displaced due to soaking, which could significantly enhance the recovery rate. However, when oil counter-flushing was performed after soaking for 10 days, the signal intensity was similar to that after soaking for 7 days, suggesting that the change in filtrate retained within the core thin sections was minimal. Overall, for cores under residual oil conditions, the reasonable shut-in time should be 7 days.

4. Conclusions

This study utilized low-field nuclear magnetic resonance technology to investigate the distribution characteristics of fracturing fluid during the shut-in period post-fracture and optimize the shut-in time. The main conclusions were as follows:
(1)
Filtrate retention occurred in pore throats with radii ranging from 0.0012 μm to 0.025 μm. During the shut-in process, pore throats with radii ranging from 0.003 μm to 0.07 μm were the power pore throats in soaking displacement and were the main sites where filtrate retention occurred in the Chang 7 tight oil reservoir.
(2)
After shut-in, the retention amount of pressure fluid filtrate increased to a certain extent compared to before shut-in. When the shut-in time in the Chang 7 reservoir was 7 days, the growth rate of fracturing fluid filtrate retention was the highest. When shut-in occurred for 10 days, no oil was expelled from medium and large pores, and the amount of filtrate retained was lower than when shut-in occurred for 7 days. The reasonable shut-in time should be 7 days.
(3)
By combining low-field nuclear magnetic resonance, an experimental method was proposed to characterize the distribution of fracturing fluid during the shut-in time post-fracture in unconventional reservoirs. This method helped reveal the distribution characteristics of retained fracturing fluid in different pore sizes, providing theoretical and technical support for the development of tight oil reservoirs.

Author Contributions

Conceptualization, X.H. and L.W.; methodology, N.W.; software, M.L. and S.X.; validation, Q.D.; formal analysis, S.W.; investigation, Z.T.; data curation, W.Y.; writing, X.H. All authors have read and agreed to the published version of the manuscript.

Funding

This research received no external funding.

Data Availability Statement

No new data were created.

Conflicts of Interest

The authors declare no conflict of interest.

References

  1. Cao, J.; Yang, Y. The present situation and prospect of enhancing low permeability reservoir recovery technology in china. Sichuan Chem. Ind. 2017, 20, 17–21. [Google Scholar]
  2. Zou, C.; Yang, Z.; Zhu, R.; Zhang, G.; Hou, L.; Wu, S.; Tao, S.; Yuan, X.; Dong, D.; Wang, Y.; et al. Progress in china’s unconventional oil & gas exploration and development and theoretical technologies. Acta Geol. Sin. 2015, 89, 979–1007. [Google Scholar]
  3. Sun, L.; Zou, C.; Jia, A.; Wei, Y.; Zhu, R.; Wu, S.; Guo, Z. Development characteristics and orientation of tight oil and gas in China. Pet. Explor. Dev. 2019, 46, 1015–1026. [Google Scholar] [CrossRef]
  4. Xie, Y.; Liu, X.; Wang, J.; Wu, N.; Hu, C.; Wang, Y. Characteristics and main controlling factors of tight oil reservoirs in Chang 7 Member of Yanchang Formation inOrdos Basin, North Shaanxi. Mar. Geol. Quat. Geol. 2022, 42, 149–159. [Google Scholar]
  5. Zhang, D.; Zhang, L.; Tang, H.; Zhao, Y. Fully coupled fluid-solid productivity numerical simulation of multistage fractured horizontal well in tight oil reservoirs. Pet. Explor. Dev. 2022, 49, 338–347. [Google Scholar] [CrossRef]
  6. Li, S.; Xia, Y.; Lan, J.; Ye, S.; Ma, X.; Zou, J.; Li, M. CO2 flooding experiment in the Chang-7 tight oil reservoir of Ordos Basin. Sci. Technol. Eng. 2020, 20, 2251–2257. [Google Scholar]
  7. Wang, H.; Zhao, W.; He, H.; Feng, J. Characteristics oftight oil reservoirs in ordos basin--a case study of Chang-7 memberof longdong area. Ordos Basin. Unconv. Oil Gas 2019, 6, 42–51. [Google Scholar]
  8. Zhao, J.; Fan, J.; Xue, T.; Wu, D.; Wang, C. Classification and evaluation of Chang 7 tight oil reservoirseepage features in Ordos Basin. J. Northwest Univ. (Nat. Sci. Ed.) 2018, 48, 857–866. [Google Scholar]
  9. Zhou, X.; He, S.; Liu, P. Characteristics and classi-fication of tight oil pore structure in reservoir Chang 6 of Daijiapingarea, Ordos Basin. Earth Sci. Front. 2016, 23, 253–265. [Google Scholar]
  10. Wang, X.Z.; Zhao, X.S.; Dang, H.L.; Xiao, Q.H.; Qi, Z.L. Characteristics of movable fluids for chang 7 tight reservoir in Yanchang oilfield. Sci. Technol. Eng. 2018, 18, 72–77. [Google Scholar]
  11. Zhongxing, L.; Jian, L.; Xuefeng, Q.; Xianwen, L.; Qihong, L.; Jianming, F. The experiment and rec-ognition of the development of Chang 7 tight oil in Ordos Basin. Nat. Gas Geosci. 2015, 26, 1932–1940. [Google Scholar]
  12. Han, W.X.; Hou, L.H.; Yao, J.L.; Ma, W.J. Characteristics andformation mechanism of Chang 7 tight sandstone reservoir in Ordos Basin. J. China Univ. Min. Technol. 2016, 45, 765–771. [Google Scholar]
  13. Zhang, Y.; Ge, H.; Zhao, K.; Liu, S.; Zhou, D. Simulation of pressure response resulted from non-uniform fracture network communication and its application to interwell-fracturing interference in shale oil reservoirs. Geomech. Geophys. Geo-Energy Geo-Resour. 2022, 8, 114. [Google Scholar] [CrossRef]
  14. Zhang, Y.; Zou, Y.; Zhang, Y.; Wang, L.; Liu, D.; Sun, J.; Ge, H.; Zhou, D. Experimental Study on Characteristics and Mechanisms of Matrix Pressure Transmission Near the Fracture Surface During Post-Fracturing Shut-In in Tight Oil Reservoirs. J. Pet. Sci. Eng. 2022, 219, 111133. [Google Scholar] [CrossRef]
  15. Li, X.; Zhao, Z.; Li, Z.; Wang, C.; Cong, H. Stochastic fractal modal for fracture network parameter inversion of fracturing horizontal well. Fault-Block Oil Gas Field 2019, 26, 205–209. [Google Scholar]
  16. Xie, B.; Jiang, J.; Jia, J.; Ren, L.; Huang, B.; Huang, X. Partition seepage model and productivity analysis of fractured borizontal wells of tight reservoirs. Fault-Block Oil Gas Field 2019, 26, 324–328. [Google Scholar]
  17. Talechani, A.D.; Olson, J.E. Numerical modeling of multistranded hydraulic-fracture propagation accounting for the interaction between induced and natural fractures. SPE J. 2011, 16, 575–581. [Google Scholar] [CrossRef]
  18. Jin, X.; Shah, S. Fracture propagation direction and its application in hydraulic fracturing. SPE J. 2013, 18, 608–620. [Google Scholar]
  19. Cipolla, C.; Weng, X.; Mack, M.; Ganguly, U.; Gu, H.; Kresse, O.; Cohen, C. Integrating microseismic mapping and complex fracture modeling to characterrize fracture complexity. SPE J. 2011, 16, 368–380. [Google Scholar]
  20. Parmar, J.; Dehghanpour, H.; Kuru, E. Displacement of water by gas in propped fractures: Combined effects of gravity, surface tension, and wettability. J. Unconv. Oil Gas Resour. 2014, 5, 10–21. [Google Scholar] [CrossRef]
  21. Liu, Y. Modeling of Recovery and In-Situ Distribution of Fracturing Fluid in Shale Gas Reservoirs due to Fracture Closure, Proppant Distribution and Gravity Segregation. Master’s Thesis, University of Alberta, Edmonton, AB, Canada, 2017. [Google Scholar]
  22. Le, D.H.; Hoang, H.N.; Mahadevan, J. Impact of capillary section on fracture face skin evolution in water blocked wells. In Proceedings of the SPE Hydraulic Fracturing Technology Conference, The Woodlands, TX, USA, 31 January–2 February 2023; Society of Petroleum Engineers: Richardson, TX, USA, 2023. [Google Scholar]
  23. Baharmi, H.; Rezaee, R.; Clennel, B. Water blocking damage in hydraulically fractured tight sand gas reservoirs: An example from Perth Basin, Western Australia. J. Pet. Sci. Eng. 2012, 88, 100–106. [Google Scholar] [CrossRef]
  24. Tang, J.; Wu, K.; Li, Y.; Hu, X.; Liu, Q.; Ehlig-Economides, C. Numerical investigation of the interactions between hydraulic fracture and bedding planes with non-orthogonal approach angle. Eng. Fract. Mech. 2018, 200, 1–16. [Google Scholar] [CrossRef]
  25. Kamath, J.; Laroche, C. Laboratory-Based Evaluation of Gas Well Deliverability Loss Caused by Water Blocking. Soc. Pet. Eng. 2003, 8, 71–80. [Google Scholar] [CrossRef]
  26. Bostrom, N.; Chertov, M.; Pagels, M.; Willberg, D.; Chertova, A.; Davis, M.; Zagorski, W. The Time-Dependent Permeability Damage Caused by Fracture Fluid. Soc. Pet. Eng. 2014. [Google Scholar] [CrossRef]
  27. Wang, J.; Rahman, S.S. An Investigation of Fluid Leak-off Due to Osmotic and Capillary Effects and Its Impact on Micro-Fracture Generation during Hydraulic Fracturing Stimulation of Gas Shale. Soc. Pet. Eng. 2015. [Google Scholar] [CrossRef]
  28. Dutta, R.; Lee, C.-H.; Odumabo, S.; Ye, P.; Walker, S.C.; Karpyn, Z.T.; Ayala, H.L.F. Experimental Investigation of Fracturing-Fluid Migration Caused by Spontaneous Imbibition in Fractured Low-Permeability Sands. Soc. Pet. Eng. 2014. [Google Scholar] [CrossRef]
  29. Meng, M.; Ge, H.; Ji, W.; Shen, Y.; Su, S. Monitor the process of shale spontaneous imbibition in co-current and counter-current displacing gas by using low field nuclear magnetic resonance method. J. Nat. Gas Sci. Eng. 2015, 27, 336–345. [Google Scholar] [CrossRef]
  30. Yan, Q.; Lemanski, C.; Karpyn, Z.T.; Ayala, L.F. Experimental investigation of shale gas production impairment due to fracturing fluid migration during shut-in time. J. Nat. Gas Sci. Eng. 2015, 24, 99–105. [Google Scholar] [CrossRef]
  31. Odumabo, S.M.; Karpyn, Z.T.; Ayala, H.L.F. Investigation of gas flow hindrance due to fracturing fluid leak off in low permeability sandstones. J. Nat. Gas Sci. Eng. 2014, 17, 1–12. [Google Scholar] [CrossRef]
  32. Fakcharoenphol, P.; Kurtoglu, B.; Kazemi, H.; Charoenwongsa, S.; Wu, Y.-S. The Effect of Osmotic Pressure on Improve Oil Recovery from Fractured Shale Formations. Soc. Pet. Eng. 2014. [Google Scholar] [CrossRef] [Green Version]
  33. Wang, Q.; Guo, B.; Gao, D. Is Formation Damage an Issue in Shale Gas Development? Soc. Pet. Eng. 2012. [Google Scholar] [CrossRef]
  34. Li, J.; Yu, W.; Guerra, D.; Wu, K.V. Modeling wettability alteration effect on well performance in Permian basin with complex fracture networks. Fuel 2018, 224, 740–751. [Google Scholar] [CrossRef]
  35. Feng, X.; Jiang, H.; Li, W.; Fang, W.; Zhao, L. Study on formation damage of fracturing fluid to low-permeable reservoir by NMR. Complex Hydrocarb. Reserv. 2015, 8, 75–79. [Google Scholar]
  36. Zhang, Y.; Ge, H.; Shen, Y.; Jia, L.; Wang, J. Evaluating the potential for oil recovery by imbibition and time-delay effect in tight reservoirs during shut-in. J. Pet. Sci. Eng. 2019, 184, 106557. [Google Scholar] [CrossRef]
  37. Li, J.; Yu, W.; Wu, K. Analyzing the impact of fracture complexity on well performance and wettability alteration in Eagle Ford shale. In Proceedings of the SPE Unconventional Resources Technology Conference (URTeC), Houston, TX, USA, 23–25 July 2018. [Google Scholar] [CrossRef]
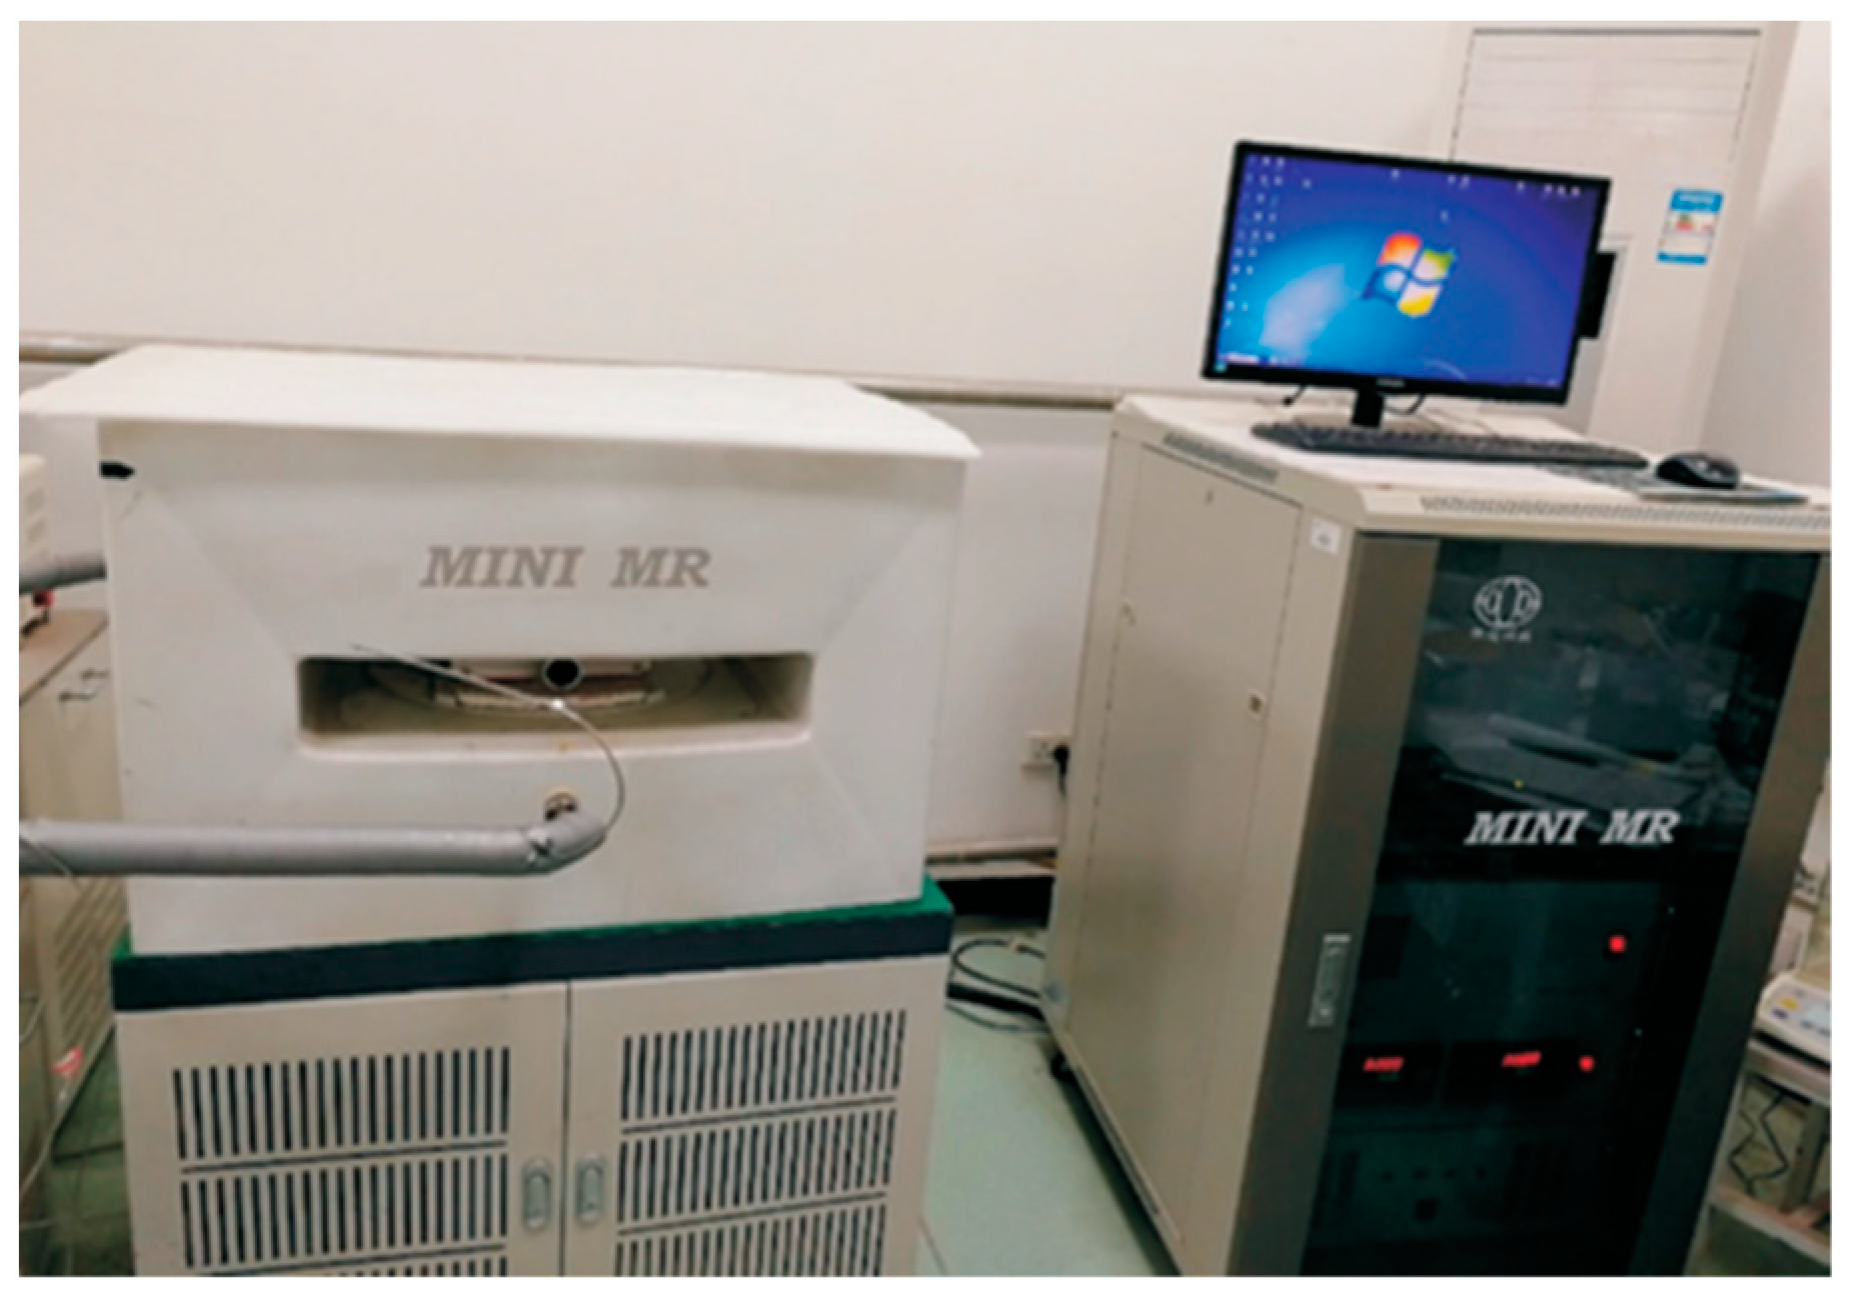
Figure 1. Low-field nuclear magnetic resonance analyzer.
Processes 11 02393 g001
Figure 2. Distribution curve of T2 spectrum for thin section A-1.
Processes 11 02393 g002
Figure 3. Nuclear magnetic pore spectrum of thin Section A-1.
Processes 11 02393 g003
Figure 4. Distribution curve of T2 spectrum for thin section A-1 under the condition of oil reverse drive water.
Processes 11 02393 g004
Figure 5. Nuclear magnetic pore spectrum of thin section A-1.
Processes 11 02393 g005
Figure 6. Distribution curve of T2 spectrum for thin section A-2.
Processes 11 02393 g006
Figure 7. Nuclear magnetic pore spectrum of thin section A-2.
Processes 11 02393 g007
Figure 8. Distribution curve of T2 spectrum for thin section A-2 under the condition of oil reverse drive water.
Processes 11 02393 g008
Figure 9. Nuclear magnetic pore spectrum of thin section A-2 under the condition of oil reverse drive water.
Processes 11 02393 g009
Figure 10. Distribution curve of T2 spectrum for thin section A-3.
Processes 11 02393 g010
Figure 11. Nuclear magnetic pore spectrum of thin section A-3.
Processes 11 02393 g011
Figure 12. Distribution curve of T2 spectrum for thin section A-3 under the condition of oil reverse drive water.
Processes 11 02393 g012
Figure 13. Nuclear magnetic pore spectrum of thin section A-3 under the condition of oil reverse drive water.
Processes 11 02393 g013
Figure 14. Distribution curve of T2 spectrum for thin section A-4.
Processes 11 02393 g014
Figure 15. Nuclear magnetic pore spectrum of thin section A-4.
Processes 11 02393 g015
Figure 16. Distribution curve of T2 spectrum for thin section A-4 under the condition of water drive oil.
Processes 11 02393 g016
Figure 17. Nuclear magnetic pore spectrum of thin section A-4 under the condition of water drive oil.
Processes 11 02393 g017
Figure 18. Pseudocolor images of thin section A-3 at different stages. (a) Original sample, (b) water-saturated sample, (c) oil displacing water, (d) water displacing oil, (e) oil counter-flushing water.
Processes 11 02393 g018
Figure 19. T2 spectrum distribution curve of core thin section A-1 during shut-in soaking.
Processes 11 02393 g019
Figure 20. T2 spectrum distribution curve of core thin section A-2 during shut-in soaking.
Processes 11 02393 g020
Figure 21. T2 spectrum distribution curve of core thin section A-3 during shut-in soaking.
Processes 11 02393 g021
Figure 22. T2 spectrum distribution curve of core thin section A-4 during shut-in soaking.
Processes 11 02393 g022
Figure 23. Pseudocolor images of the core after different shut-in times following oil counter-flushing. (a) Oil counter-flushing water (no shut-in), (b) oil counter-flushing water (3 days shut-in), (c) oil counter-flushing water (5 days shut-in), (d) oil counter-flushing water (7 days shut-in), (e) oil counter-flushing water (10 days shut-in).
Processes 11 02393 g023
Table 1. Core Thin Section Parameter List.
NumberDiameter/mmThickness/mmWeight/gPermeability/mD
A-125.331.971.8870.091
A-225.332.532.6640.034
A-325.342.182.2470.088
A-425.332.112.1480.034
Disclaimer/Publisher’s Note: The statements, opinions and data contained in all publications are solely those of the individual author(s) and contributor(s) and not of MDPI and/or the editor(s). MDPI and/or the editor(s) disclaim responsibility for any injury to people or property resulting from any ideas, methods, instructions or products referred to in the content.