Article

Monitoring and Characterizing the Flame State of a Bluff-Body Stabilized Burner by Electrical Capacitance Tomography

1
School of Energy and Power Engineering, Beihang University, Beijing 100191, China
2
Zhongfa Aviation Institute of Beihang University, 166 Shuanghongqiao Street, Pingyao Town, Yuhang District, Hangzhou 311115, China
3
Beihang Hangzhou Innovation Institute Yuhang, Xixi Octagon City, Yuhang District, Hangzhou 310023, China
*
Authors to whom correspondence should be addressed.
Processes 2023, 11(8), 2403; https://doi.org/10.3390/pr11082403
Submission received: 21 July 2023 / Revised: 4 August 2023 / Accepted: 8 August 2023 / Published: 10 August 2023
(This article belongs to the Special Issue Engine Combustion and Emissions)

Abstract

:
Unstable combustion phenomena such as flame flashback, flame liftoff, extinction and blowout frequently take place during the operation of the bluff-body stabilized burner. Therefore, flame state monitoring is necessary for the safe operation of the bluff-body stabilized burner. In the present study, an electrical capacitance tomography (ECT) system was deployed to detect the permittivity distribution in the premixing channel and further characterize the flame states of stabilization, flashback, liftoff, extinction and blowout. A calderon-based reconstruction method was modified to reconstruct the permittivity distribution in the annular premixing channel. The detection results indicate that the permittivity in the premixing channel increases steeply when the flame flashback takes place and decreases obviously when the flame lifts off from the combustor rim. Based on the varied permittivity distribution at different flame states, a flame state index was proposed to characterize the flame state in quantification. The flame state index is 0, positive, in the range of −0.64–0, and lower than −0.64 when the flame is at the state of stable, flashback, liftoff and blowout, respectively. The flame state index at the flame state of extinction is the same as that at the flame state of liftoff. The extinction state and the blowout state can be distinguished by judging whether the flame flashback takes place before the flame is extinguished. These results reveal that the ECT system is capable of monitoring the flame state, and that the proposed flame state index can be used to characterize the flame state.

1. Introduction

Bluff body stabilizes the flame by creating a recirculation zone, and has been widely applied in industrial systems, including gas turbines, industrial furnaces and scramjet engines [1]. With the increasing attention to environmental protection, lean premixed combustion has been widely adopted to reduce the NOX emissions [2]. However, the lean premixed combustion is susceptible to flame flashback [3], flame liftoff [4] and blowout [5]. During the operation of the combustor, the flame usually presents four states, including the stable flame, the flame flashback, the flame liftoff and the blowout. When the flow velocity is lower than the flame propagation speed at the burner outlet, the flame propagates upstream into the premixing channel [6]. When the flow velocity is so large that the fresh reactants cannot be ignited at the outlet by the hot mixtures in recirculation zone, the flame propagates downstream and lifts off from the burner rim [7]. The flame liftoff height increases when the airflow rises, and the flame extinguishes when the flame liftoff height exceeds a certain critical value [8].
Flame flashback and flame liftoff can cause considerable mechanical damage to the combustion system, while the blowout may cause the in-flight shutdown of the aeroengine [9]. Therefore, monitoring the flame state in real time is significant for the operation safety of the combustors. A lot of studies have been done in the flame state monitoring. For the flame flashback, Christodoulou et al. detected the dynamics prior to flame flashback of a bluff-body burner using a pressure transducer [10]. They found that subtle changes occur in system dynamics seconds before the actual flashback event [10]. Eichler et al. studied flame flashback in wall boundary layers using a particle image velocimetry system (PIV) [11]. They found a backflow region upstream of the flame during the process of the flame flashback, and that backflow was caused by the imbalance between the pressure upstream of the flame and in the boundary layer [11]. Ebi et al. obtained the 3D flashback flame topography using a tomographic PIV [12]. For flame liftoff, Yon et al. monitored the liftoff height of an oxy-fuel burner using a PIV system [13]. They found that the addition of hydrogen caused the decrease in flame liftoff height [13]. Zheng et al. detected the flame liftoff location using a high speed camera and studied the influence of the gasoline proportion in gasoline-diesel mixtures on flame liftoff height [14]. Li et al. simultaneously captured spray length and flame liftoff length using a high-speed camera and a Mie-scattering system [15]. For the flame blowout, Nair et al. detected the blowout of a swirl-stabilized combustor using a condenser microphone [16] and a photo-multiplier tube (PMT) [17]. Li et al. researched the combustion instability of a swirl flame as approaching lean blowout by the method of diode-laser absorption [18]. It was found that the low-frequency temperature fluctuations increase as the flame approaches lean blowout [18].
These works used acoustic or optical technologies to detect only one of the flame states. The acoustic and optical technologies need the opening hole and the observation window, which confines the acoustic and the optical techniques in laboratories rather than in practice [19,20]. A technique with simple structure, no need of observation window and applicability in practice is highly needed to monitor the flame state. In addition, monitoring all the flame states including the steady flame, the flame flashback, the flame liftoff and the flame blowout just using a flame measurement method can dramatically improve the safety of combustor. This is the primary motivation of the present study.
Electrical capacitance tomography (ECT) is a non-invasive measurement technology and has been proved the ability to monitor the fluid in tube no matter whether the premixing channel is transparent or not [21]. Consequently, the ECT is suitable for detecting flame flashback inside the premixing channel with no need for an observation window and opening hole. In the process of experiment, we found that ECT systems can also be used to detect flame liftoff and blowout by combining the fringe effect of the ECT sensor [22]. Therefore, monitoring all the flame states with only one measuring technique can be realized via the ECT system. In this study, the ECT system was used to detect the flame under various flame states, and a flame state index was proposed to characterize these different flame states.

2. Methodology

2.1. Flame State of Bluff-Body Stabilized Burner

For a fixed fuel flow, the flame state of the bluff-body stabilized burner varies with the airflow. Figure 1 shows the flame photos taken by a high-speed camera at the fuel flow of 60 mL/min and the airflow of 1.3 L/min, 1.36 L/min, 2.48 L/min, 3.0 L/min and 3.25 L/min. The flame is stably anchored to the edge of the burner and the equivalence ratio is 1.27 when the airflow is 1.3 L/min. Under the airflow of 1.3 L/min, the flame is stable in the fuel-rich condition and the flame state is defined as fuel-rich stable state. When the airflow increases to 1.36 L/min, the flame propagates upstream into the premixing channel, presenting a flashback state as shown in Figure 1b. When the airflow further increases to 2.48 L/min, the flame reattaches to the edge of the burner and the equivalence ratio is 0.72. Under this condition, the flame presents a fuel-lean stable state. When the airflow reaches 3.0 L/min, the flame presents a liftoff state as shown in Figure 1d. The flame liftoff height increases with the increase in airflow. When the airflow is greater than 3.25 L/min, the flame cannot be anchored by the bluff body and the flame is blown out by the flow.
Table 1 lists the flame states as the airflow increases from 0 L/min to 3.25 L/min at the fuel flow of 60 mL/min. When the airflow is lower than 1.36 L/min, the equivalence ratio is greater than 1.3 and the flame is stable in the fuel-rich condition. When the airflow is in the range of 1.36 L/min and 2.48 L/min, the equivalence ratio is in the range of 0.72–1.27. In this condition, the flame propagation speed is relatively large and the flame is in the flashback state. When the airflow is in the range of 2.48–3.0 L/min, the equivalence ratio is in the range of 0.59–0.72 and the flame is stable at fuel-lean condition. When the airflow is in the range of 3.0–3.25 L/min, the equivalence ratio is in the range of 0.54–0.59 and the flame is in the liftoff state. When the airflow is greater than 3.25 L/min, the equivalence ratio is lower than 0.54 and the flame is in the blowout state.

2.2. Flame State Monitoring

When the flame flashback takes place, the flame propagates upstream into the premixing channel causing a sharp increase in the permittivity of the flow in the premixing channel. An electrical capacitance tomography (ECT) system can detect the flashback flame by measuring the permittivity of the flow in the premixing channel. In addition, the ECT sensor has the fringe effect by which the medium outside the measurement area has a certain influence on the measurement results of the ECT system [21]. When the flame lifts off from the edge of the burner, the distance between the flame and the ECT sensor increases leading to the decrease in the measurement data of the ECT system. When the flame blows out, the measurement data of the ECT system further decreases due to the disappearance of the fringe effect. Therefore, the ECT system can be used to monitor all the flame state of the bluff-body stabilized burner. The following introduces the ECT system and the fringe effect of the ECT sensor briefly.

2.2.1. Electrical Capacitance Tomography System and the Modified Reconstruction Method

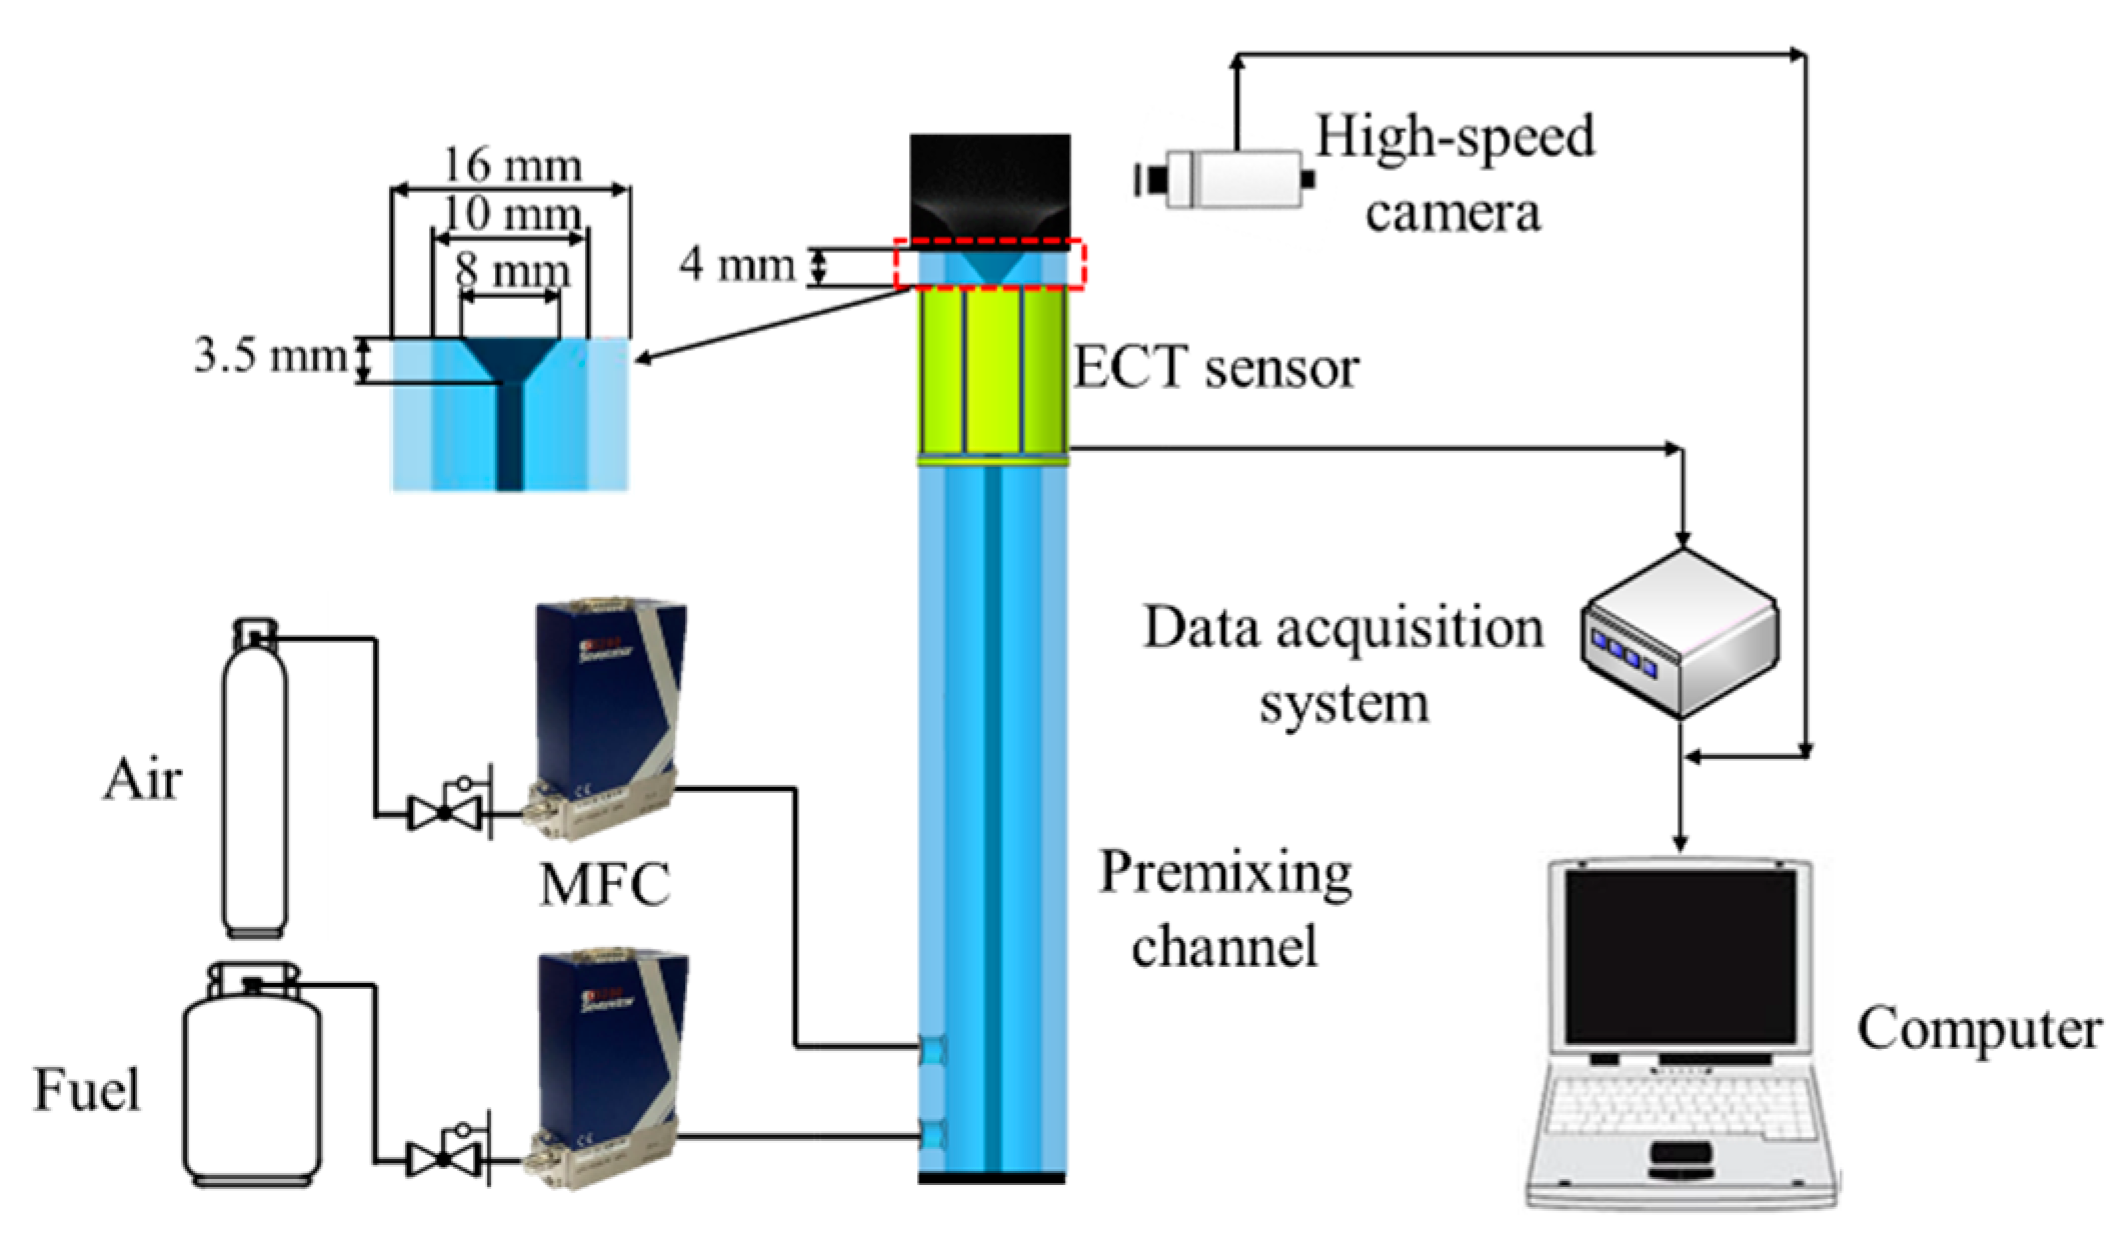
Figure 2 shows the schematic diagram of the ECT system for flame state monitoring. The ECT system mainly consists of three parts: the ECT sensor, the data acquisition system and the computer. In this study, the ECT sensor is made up of eight copper electrodes to detect the permittivity distribution in the region of interest (ROI). The electrodes of the ECT sensor are pasted on the outside surface of the premixing channel to detect the permittivity distribution in the premixing channel. Impedance between all pairs of the electrodes is acquired by the data acquisition system and is further transferred to the computer through a USB cable.
The cross-sectional permittivity distribution image is reconstructed using the Calderon-method based image reconstruction algorithm on the computer [23]. The traditional reconstruction method is usually used for reconstructing the permittivity distribution of a circular region [24,25,26], while the measurement area in the present study is an annular region with a rod in the center to support the bluff-body. Therefore, the reconstruction method needs to be modified. According to the structure of the bluff-body burner, the scattering transform of the permittivity distribution in the region of central rod is first calculated by:
t 0 s 2 S 2 Ω C   ε c × e i 2 s 1 , 2 s 2 · x , y d x d y
where S is the coordinates in frequency domain, Ω C is the region of center rod, ε c is the permittivity of the central rod and s1 and s2 are the real and imaginary parts of S, respectively.
The scattering transform of the measured data is calculated by:
t m s = A 2 π N E 1 * Λ ε   Λ 1   E 1 T
where E 1 = e i k 1 + ik 2 e i θ 1 , e i k 1 + ik 2 e i θ 2 , , e i k 1 + ik 2 e i θ N , N is the number of electrodes, E 1 * is the conjugate of E1, E 1 T is the transpose of E1 and Λ ε   is the Dirichlet-to-Neumann map when the permittivity is ε .
Combing t0 and tm, the variation of permittivity for the annular region can be deduced by the two-dimensional inverse Fourier transform:
ε x , y D s   t 0 s + t m s S 2 e 2 i s 1 x s 2 y d s 1 d s 2
where ε x , y is the reconstructed permittivity value at abscissa of x and ordinate of y for the annular region.

2.2.2. Fringe Effect of Electrical Capacitance Tomography Sensor

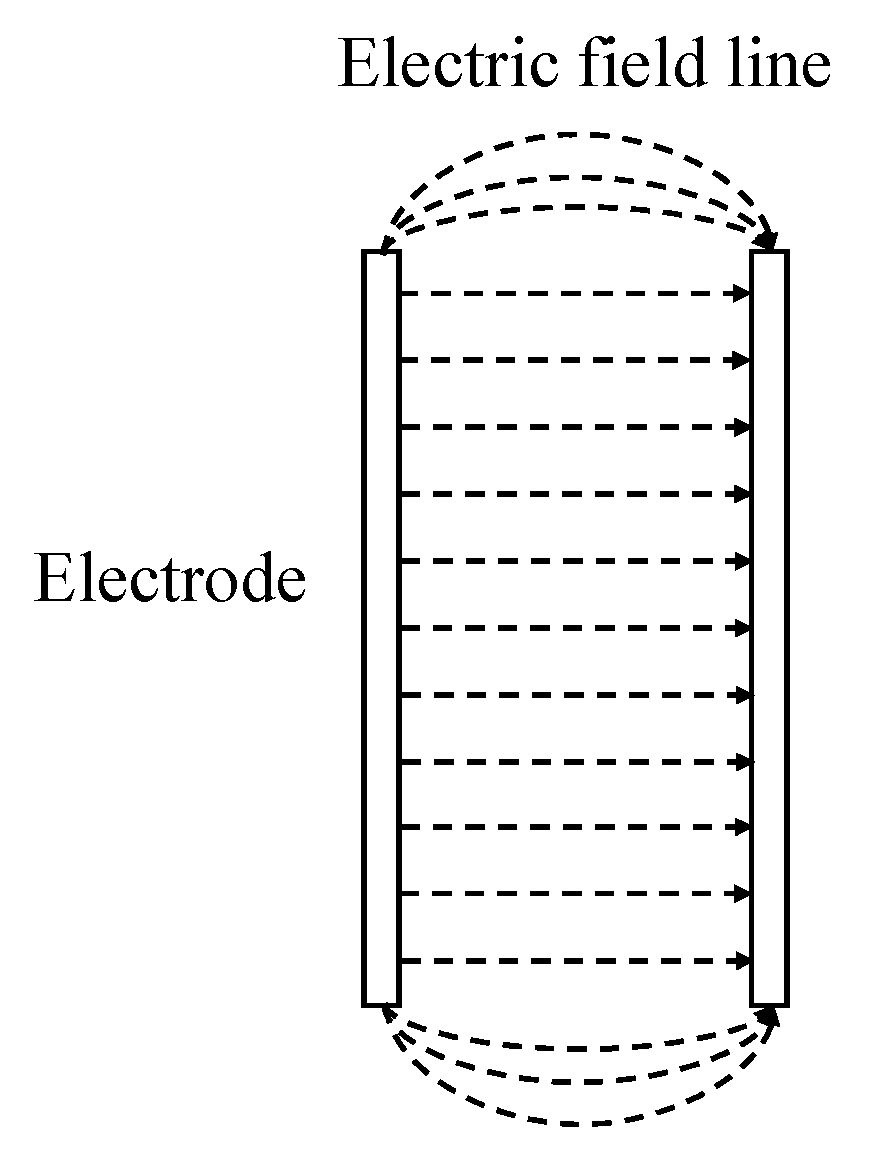
Figure 3 shows the schematic diagram of the fringe effect of the electrical capacitance tomography (ECT) sensor. The ECT is based on ‘soft-field’ sensing, and the electric field line can be either a straight line or a curve [27]. For a pair of parallel electrodes, the inner electric field lines are straight and parallel, while the electric field lines at both ends of the electrodes are curved and spread to a large outer space [28]. This field distribution at the ends of all the pairs of the electrodes is referred to as the fringe effect of the ECT sensor [29].
When the flame blows out, there is no flame in the whole electric field and the measurement data of the ECT system is relatively low. When the flame is attached to the edge of the burner, the electric field lines at the ends of the electrodes pass through the flame, resulting in the increase in the measurement data of the ECT system. When the flame lifts off from the edge of the burner, the electric field lines passing through the flame decrease, resulting in the decrease in the measurement data of the ECT system. Therefore, the ECT system has the potential to detect the flame liftoff and blowout with the fringe effect.

2.3. Flame State Characterization

The measurement data of the ECT system is quite different at different flame states. This results in the great distinction of the permittivity distribution reconstructed by the ECT system at different flame states. Therefore, the mean permittivity value can be used to characterize the flame state at the corresponding moment, and can be calculated by:
E ¯ t = 1 M x = R R y = R R ε x , y , t d x d y
where E ¯ t is the mean permittivity value at the time of t, ε x , y , t is the permittivity value at abscissa of x, ordinate of y for the time of t, R is the radius of the region of interest, M is the total number of reconstructed pixels in an image. Three threshold lines: flashback determination threshold (TF), liftoff determination threshold (TL) and blowout determination threshold (TB), are set to determine the flame state. The flame is in the state of flashback, steady, liftoff and blowout when the mean grapy value is greater than TF, in the range of TL and TF, in the range of TF and TB and less than TB.
To characterize the flame state and evaluate the unstable intensity of the flame over a period of time, the flame state index (FS) is introduced and defined as:
F S = t 0 t 1 E ¯ t T F b E ¯ t T F + E ¯ t T L b T L E ¯ t d t E = · t E ¯ t > T F + t E ¯ t < T L
where E = is the mean value of E ¯ t during the time period from t0 to t1, b E ¯ t T F is the binary conversion of E ¯ t T F (1 if E ¯ t > T F and 0 otherwise) and is used to include the data only when the flame flashback takes place, b T L E ¯ t is the binary conversion of T L E ¯ t (1 if T L > E ¯ t and 0 otherwise) and is used to include the data only when the flame liftoff takes place. t0 and t1 should be chosen as the adjacent intersection between the mean permittivity and all the threshold line. The flame state index is similar to the flame flashback index introduced in our previous work and represents the normalized mean value of the E ¯ t greater than TF or less than TB in a period of time.

3. Experiment

The experiment was carried out on a bluff-body stabilized combustor using the developed ECT system. The experimental system mainly contains a bluff-body stabilized combustion system, a high-speed camera and an ECT system, as shown in Figure 4. The combustion system includes an air tank, a fuel tank and a bluff-body burner. The burner mainly includes a conical bluff body, a supporting rod and a circular tube. The bluff-body with a diameter of 8 mm and a height of 3.5 mm is concentrically fitted within the tube and mounted on the rod with a diameter of 1 mm. The inner diameter of the premixing channel is 10 mm, and the blockage ratio is 0.64. The fuel used in this study is made up of 80% butane and 20% propane. The fuel and the air are controlled by two mass flow controllers (MFC, Sevenstar-CS200A).
The ECT sensor is composed of eight electrodes and a ground shield. The sensor with eight electrodes has been proven to be effective in measuring the flame in our previous work [21]. Due to the conical structure of the bluff-body, the ECT sensor is attached to the outer surface of the premixing tube with a distance of 4 mm from the outlet, ensuring that the detection region of the sensor is annular. The height of the shield electrode is 1 mm, and the height of the electrodes is 20 mm. The data acquisition system uses 100 kHz AC voltage excitation on all electrodes, and the imaging rate of the ECT system is 3125 frames per second (fps). A high-speed camera (FASTCAM SA-Z) was used to take the transient flame photo to validate the flame image reconstructed by the ECT system.
During the experiments, the fuel flow remained at 60 mL/min while the airflow was increased from 0 L/min until the flame was blowout. The measurement data of the ECT system when the flame is stable was set as the reference. All the measurement data of the ECT system were processed by using the modified image reconstruction method based on the reference data. Therefore, the permittivity obtained in this study is a relative value. When the flame flashback takes place, the measurement data is greater than the reference and the permittivity value in the image reconstructed by the ECT system is positive. The permittivity increases as the intensity of flashback enhances. When the flame lifts off from the burner edge, the measurement data is less than the reference and the permittivity reconstructed by the ECT system is negative. The permittivity decreases as the height of the flame lifts off from the burner rim increases. When the flame blows out, the permittivity reconstructed by the ECT system is stable and is much less than that of when the flame is in the liftoff state.

4. Results and Discussion

4.1. Flame Images Reconstructed by ECT System at Different Flame States

4.1.1. Flame Images Reconstructed by ECT System at Fuel-Rich and Fuel-Lean Stable States

For the fuel flow of 60 mL/min, the flame is stable when the airflow is in the range of 0–1.3 L/min and 2.48–3.0 L/min. When the airflow is lower than 1.3 L/min, the equivalence ratio is greater than 1.27 and the flame state is named fuel-rich stable. The flame state is named fuel-lean stable when the airflow is in the range of 2.48–3.0 L/min. The measurement data at the airflow of 2.48 L/min is set as the reference data, considering the fuel-lean combustion is adopted frequently and the flame state transforms from the flashback state into the stable state at this condition.
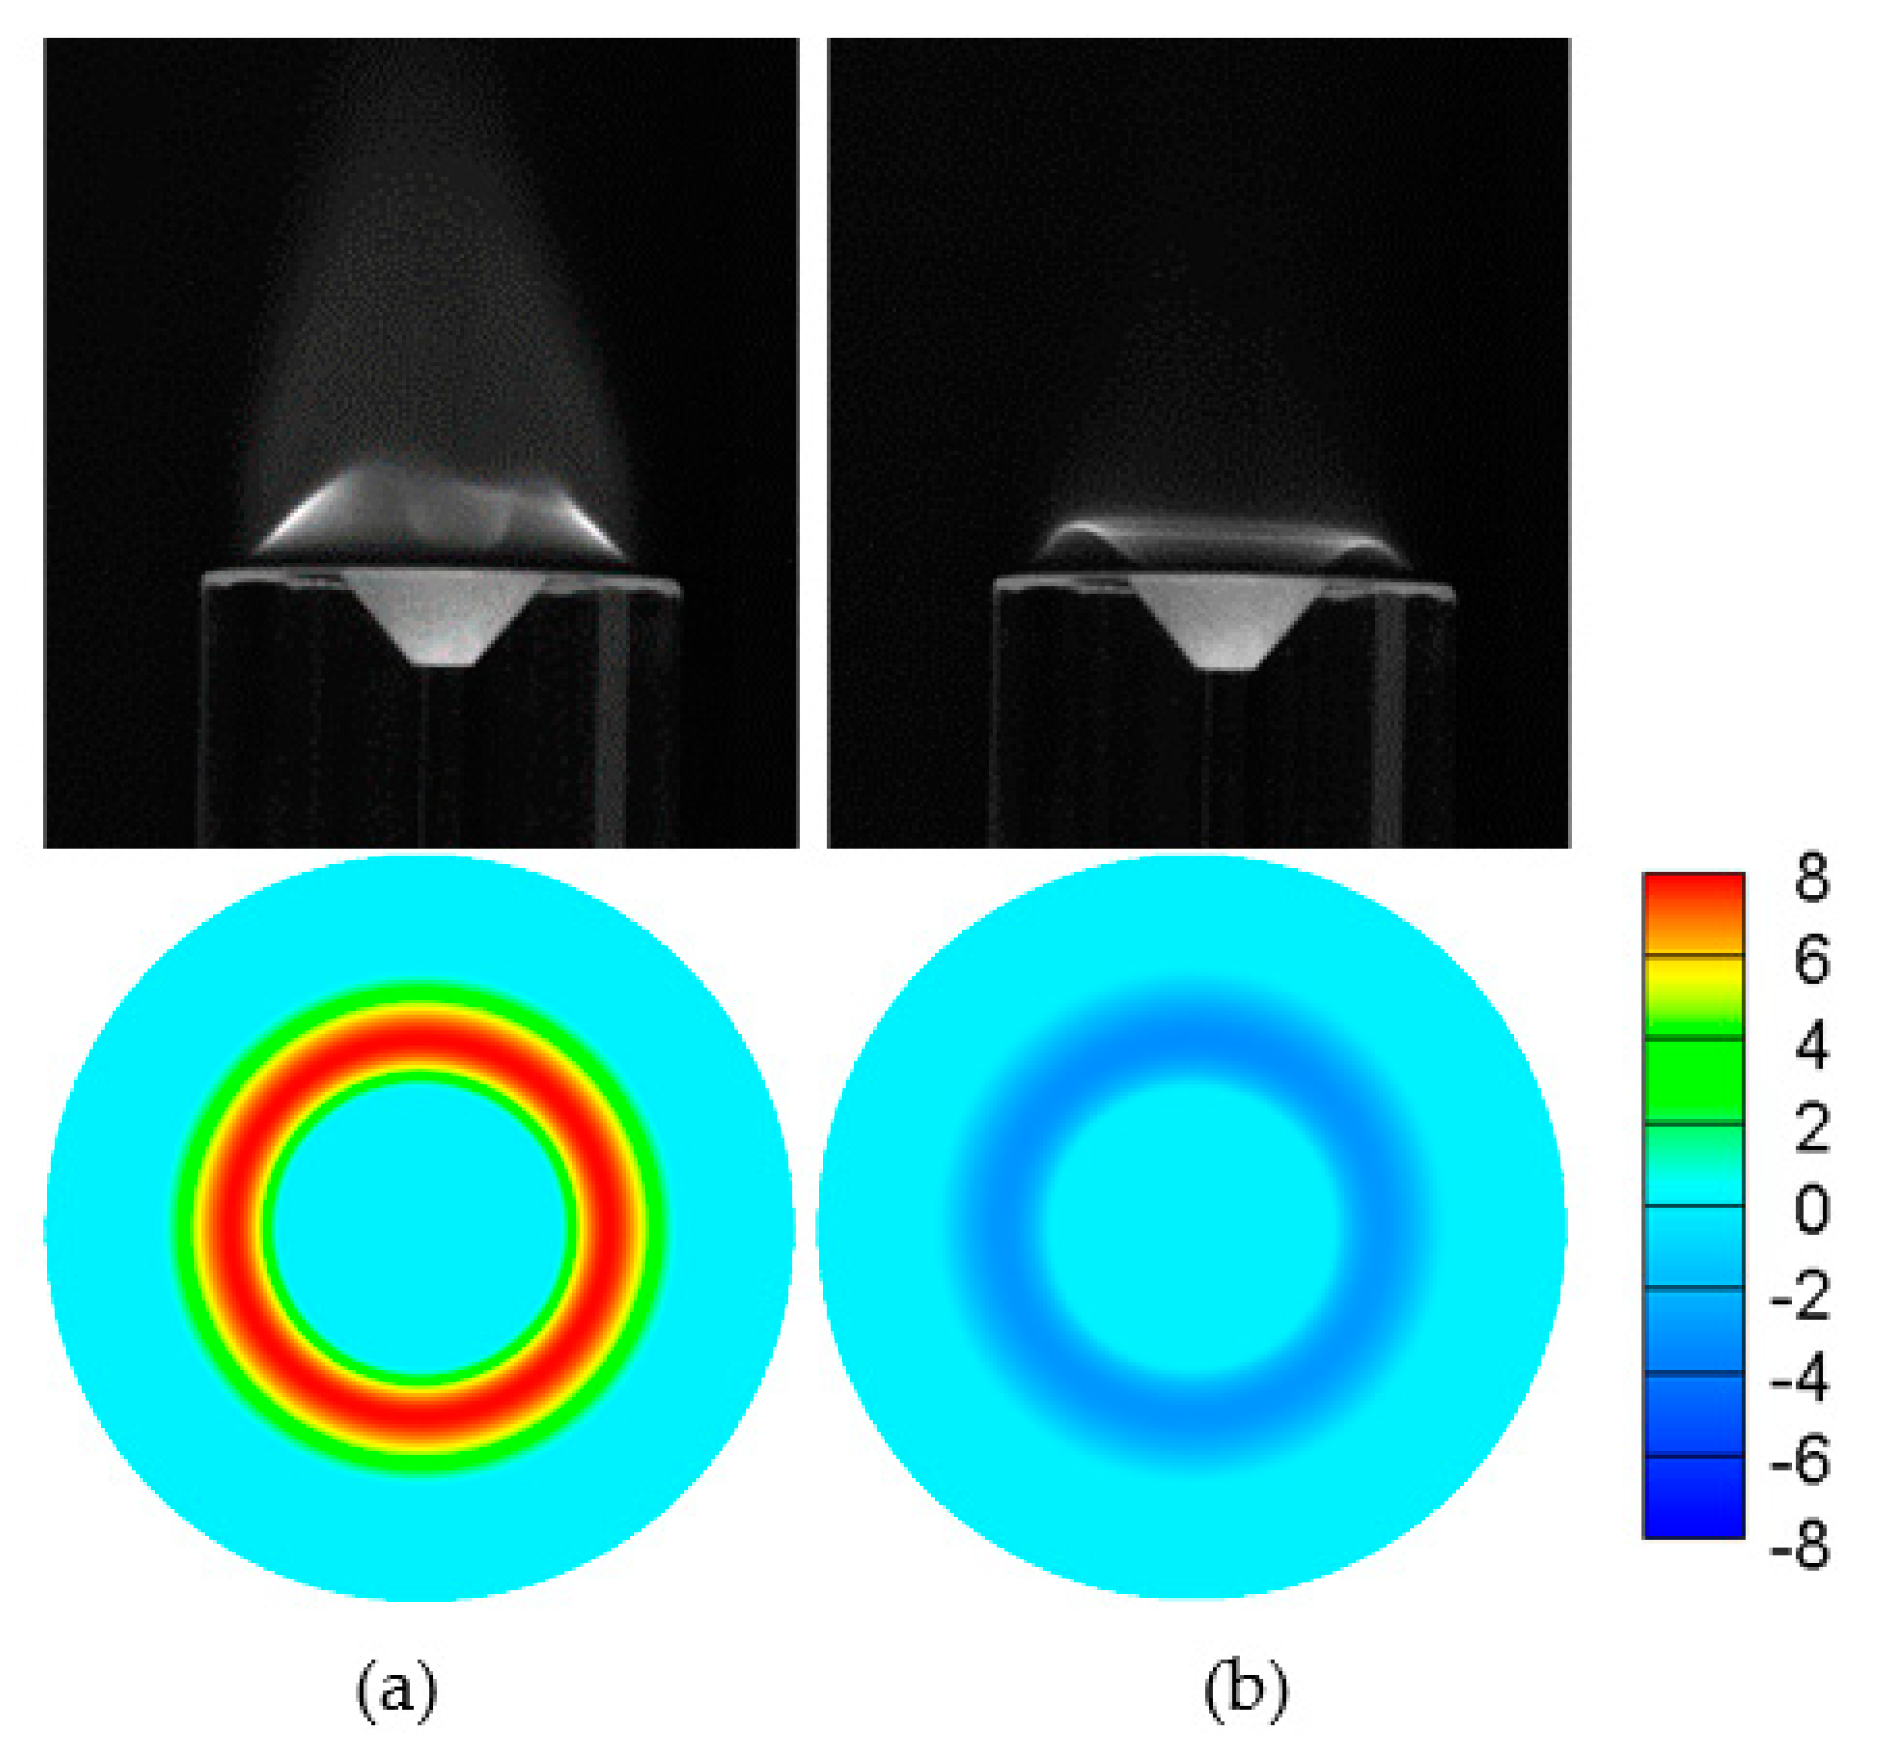
Figure 5 shows the photos taken by the camera and images reconstructed by the ECT system at the fuel flow of 60 mL/min and the airflow of 1.3 L/min and 2.8 L/min. At the airflow of 1.3 L/min, the flame height is higher than that at Qair = 2.48 L/min as shown in Figure 1c, resulting in a more intense fringe effect of the ECT sensor. As a result, the images reconstructed by the ECT system present positive permittivity distributions at Qair = 1.3 L/min. When the airflow is increased from 2.48 L/min to 2.8 L/min, the flame is still in the stable state. The flame brightness decreases indicating the chemical reaction intensity decreases as the airflow is increased from 2.48 L/min to 2.8 L/min. Compared with the condition at the airflow of 2.48 L/min, the fringe effect of the ECT sensor is weakened at the airflow of 2.8 L/min. Therefore, the images reconstructed by the ECT system present negative permittivity distributions at Qair = 2.8 L/min.
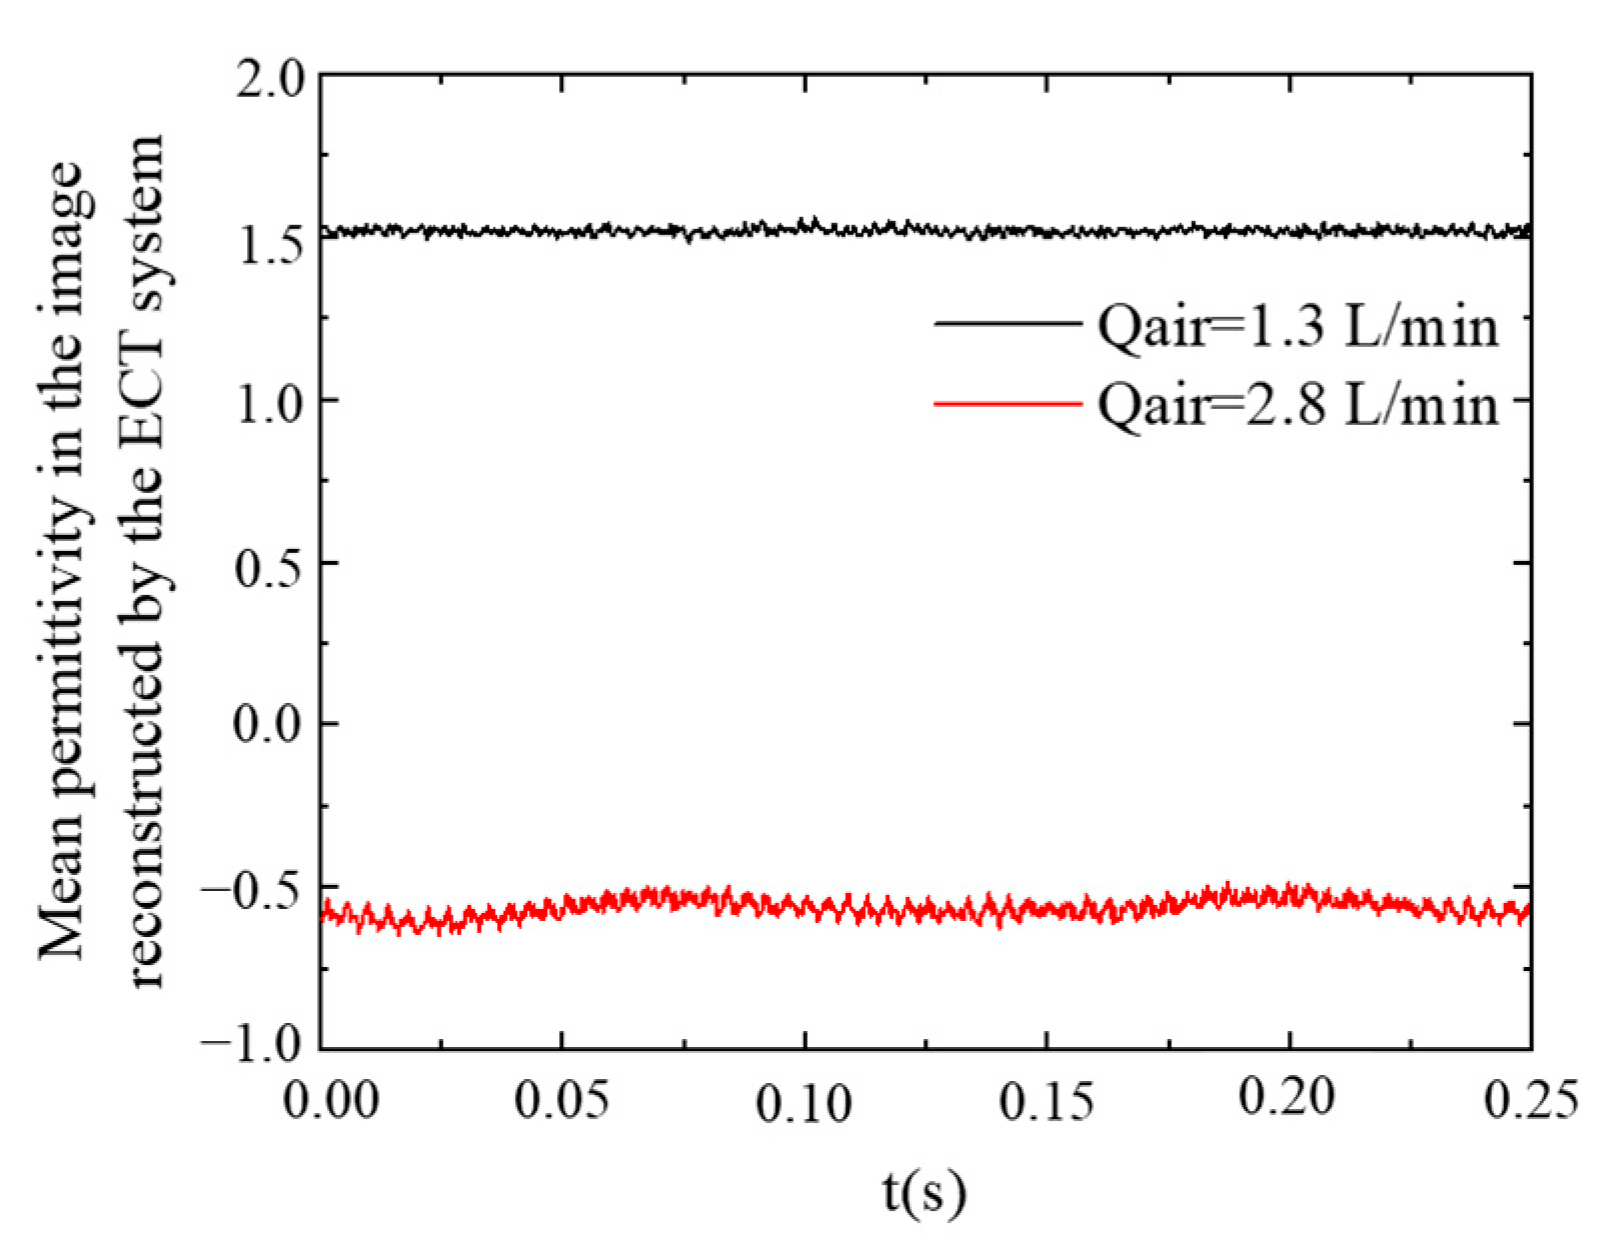
Figure 6 shows the time series of the mean permittivity in the image reconstructed by the ECT system at the fuel flow of 60 mL/min and the airflow of 1.3 L/min, 2.8 L/min. The mean permittivity is positive and stable, around 1.51, at the airflow of 1.3 L/min. When the airflow is 2.8 L/min, the mean permittivity is negative and stable around −0.55. Therefore, the fuel-rich stable state and the fuel-lean stable state can be distinguished according to the positive value and negative value of the mean permittivity.

4.1.2. Flame Images Reconstructed by ECT System at Flashback and Extinction States

For the fuel flow of 60 mL/min, the flame is in the flashback state when the airflow is in the range of 1.36–2.48 L/min. Figure 7 shows the flame flashback photos taken by the camera at the fuel flow of 60 mL/min and the airflow of 1.72 L/min. The flame is ignited at t = 0 s, and then propagates against the incoming flow into the premixing tube. From the flame photo at 0.024 s to the flame photo at 0.216 s, the time interval between the two adjacent images is 0.048 s, and the distance between the flame surfaces in the two adjacent images is approximately identical. This indicates the propagation velocity of the flashback flame is steady during the flame flashback process. The flame reaches the inlets of the air and the fuel at t = 0.216 s, and the flame is extinguished because there is not enough time to make the fuel and the air mix perfectly.
Figure 8 shows the flame flashback images reconstructed by the ECT system at the fuel flow of 60 mL/min and the airflow of 1.72 L/min. At t = 0 s, the flame is attached to the outlet of the burner and the image reconstructed by the ECT system presents a relatively low permittivity distribution. At t = 0.02 s, the flame propagates upstream into the premixing channel, and the permittivity in the reconstructed image increases obviously. As the flame further propagates upstream, the area of the flame entering the ECT measurement area increases. The permittivity in the reconstructed images increases to the maximum at t = 0.04 s. Then, the flashback flame further propagates upstream and begins to leave the measurement area of the ECT sensor, resulting in the decrease in the permittivity in the reconstructed image. The permittivity in the reconstructed image at 0.06 s is lower than that at 0.04 s. At t = 0.08 s, the flashback flame leaves the measurement area of the ECT sensor completely and the image reconstructed by the ECT system presents a low permittivity distribution. It must be pointed out that the interval of the flashback images in Figure 8 is inconsistent with the photos in Figure 7 because the ECT sensor can only detect the initial flashback flame as the height of the ECT is 20 mm. The flashback images reconstructed by the ECT system after 0.08 s are similar to that at 0.08 s, and are not shown in Figure 8. In spite of inconsistent intervals, both Figure 7 and Figure 8 indicate that the flashback flame first enters and then leaves the measurement area of the ECT sensor, which validates the applicability of ECT in monitoring the flame flashback.
Figure 9 shows the time series of the mean permittivity in the image reconstructed by the ECT system at the fuel flow of 60 mL/min and the airflow of 1.72 L/min. It can be found that during the flame flashback process, the mean permittivity first increases and then decreases. The flashback flame propagates into the measurement area of the ECT system and causes the increase in the mean permittivity. The decrease in the mean permittivity is caused by the leaving of the flashback flame from the measurement area of the ECT system. When the flame is extinguished, the mean permittivity becomes stable around −2.5.

4.1.3. Flame Images Reconstructed by ECT System at Liftoff and Blowout States

For the fuel flow of 60 mL/min, the flame is in the liftoff state when the airflow is greater than 3.0 L/min. Figure 10 shows the photos taken by the camera and images reconstructed by the ECT system at the fuel flow of 60 mL/min and the airflow of 2.93 L/min, 3.0 L/min, 3.2 L/min and 3.25 L/min. When the airflow is 2.93 L/min, the flame is attached to the burner edge. Because the airflow is higher than that at the reference state, the flame reaction intensity is reduced and the image reconstructed by the ECT system presents a negative permittivity distribution. As the airflow is raised from 2.93 L/min to 3.0 L/min, the flame lifts off from the burner edge causing the obvious decrease in the permittivity in the reconstructed image. As the airflow is further raised to 3.2 L/min, the flame liftoff height increases which causes the further decrease in the permittivity in the reconstructed image. When the airflow is increased from 3.2 L/min to 3.25 L/min, the flame is blown out and the permittivity in the reconstructed image decreases to the minimum.
When the airflow is 2.93 L/min, the flame is attached to the burner edge. Because the airflow is higher than that at the reference state, the flame reaction intensity is reduced and the image reconstructed by the ECT system presents a negative permittivity distribution. As the airflow is increased from 2.93 L/min to 3.0 L/min, the flame lifts off from the burner edge causing the obvious decrease in the permittivity in the reconstructed image. As the airflow is further raised to 3.2 L/min, the flame liftoff height increases and results in the further decrease in the permittivity in the reconstructed image. When the airflow is increased from 3.2 L/min to 3.25 L/min, the flame is blown out and the permittivity in the reconstructed image decreases to the minimum.
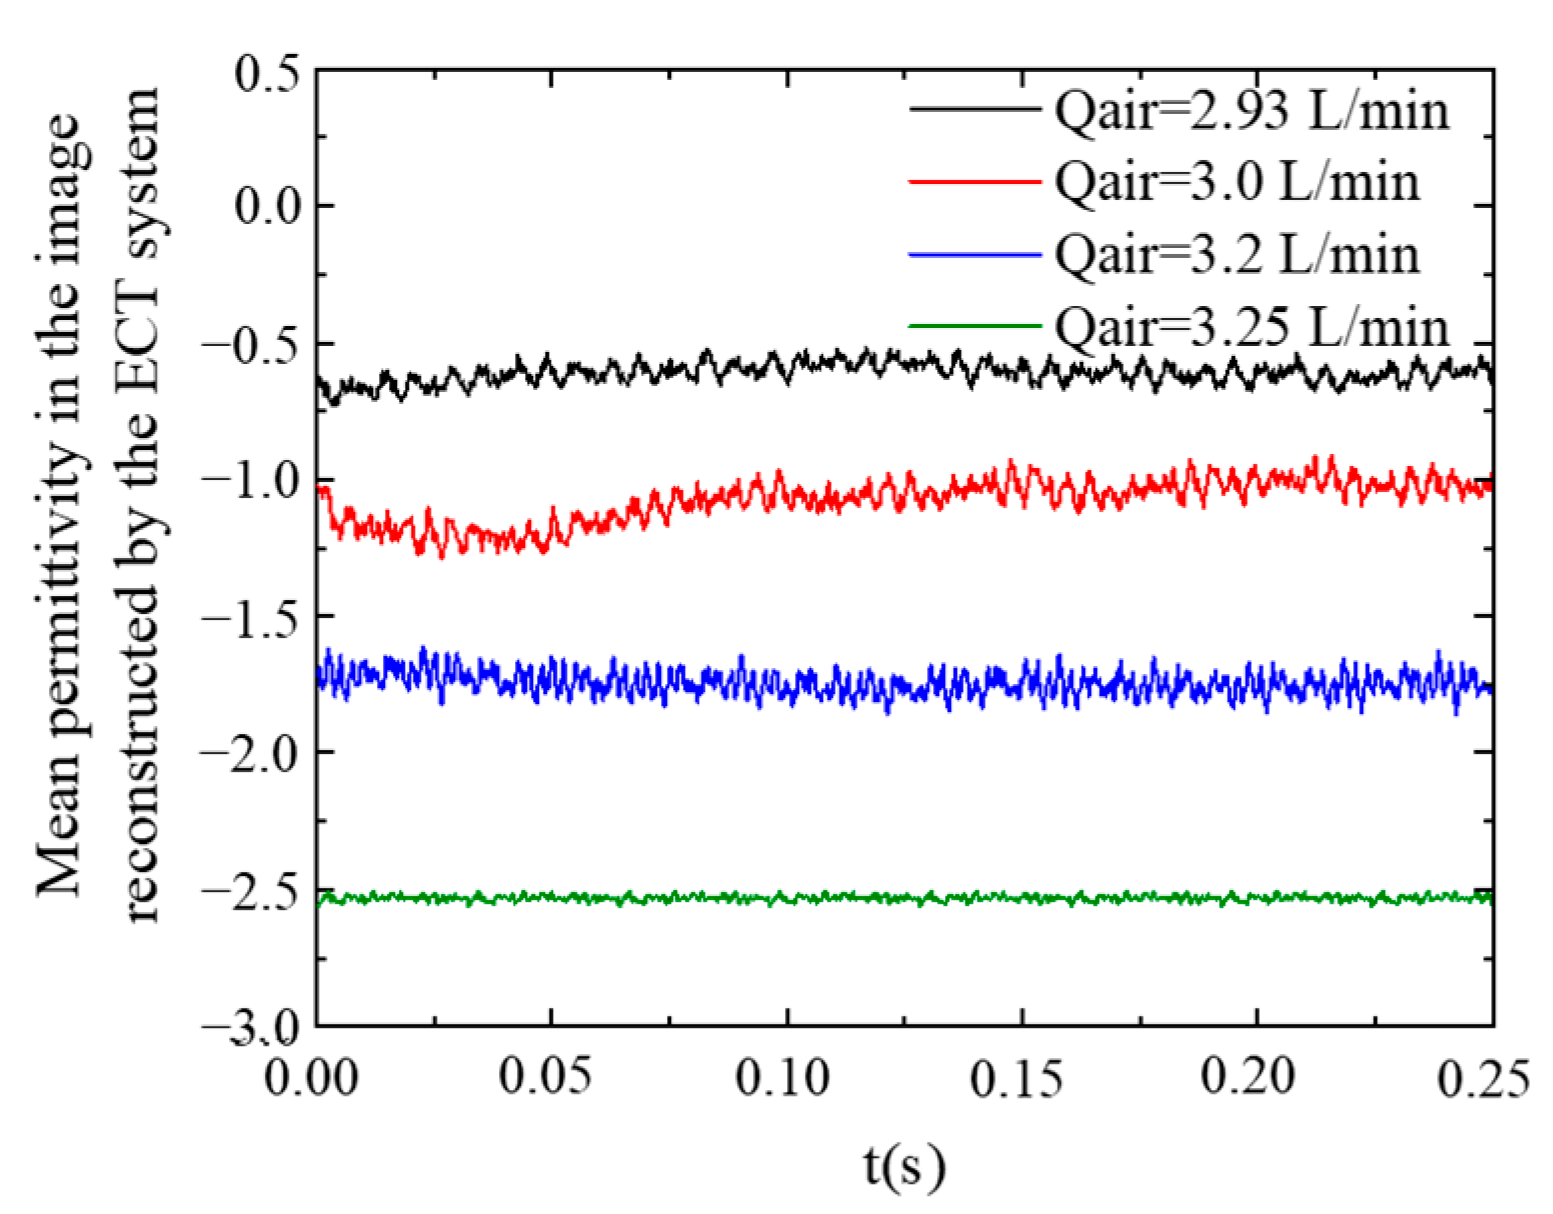
Figure 11 shows the time series of the mean permittivity in the image reconstructed by the ECT system at the fuel flow of 60 mL/min and the airflow of 2.93 L/min, 3.0 L/min, 3.2 L/min and 3.25 L/min. The mean permittivity is negative and relatively stable in the four conditions. The mean values of permittivity are stable at around −0.6, −0.92, −1.7 and −2.5 at the airflow of 2.93 L/min, 3.0 L/min, 3.2 L/min and 3.25 L/min, respectively. The above results indicate that the mean permittivity in the reconstructed image at different flame states distinguish each other obviously, and the ECT system can be used to monitor and determine the flame state.

4.2. Determination of Flame State Index

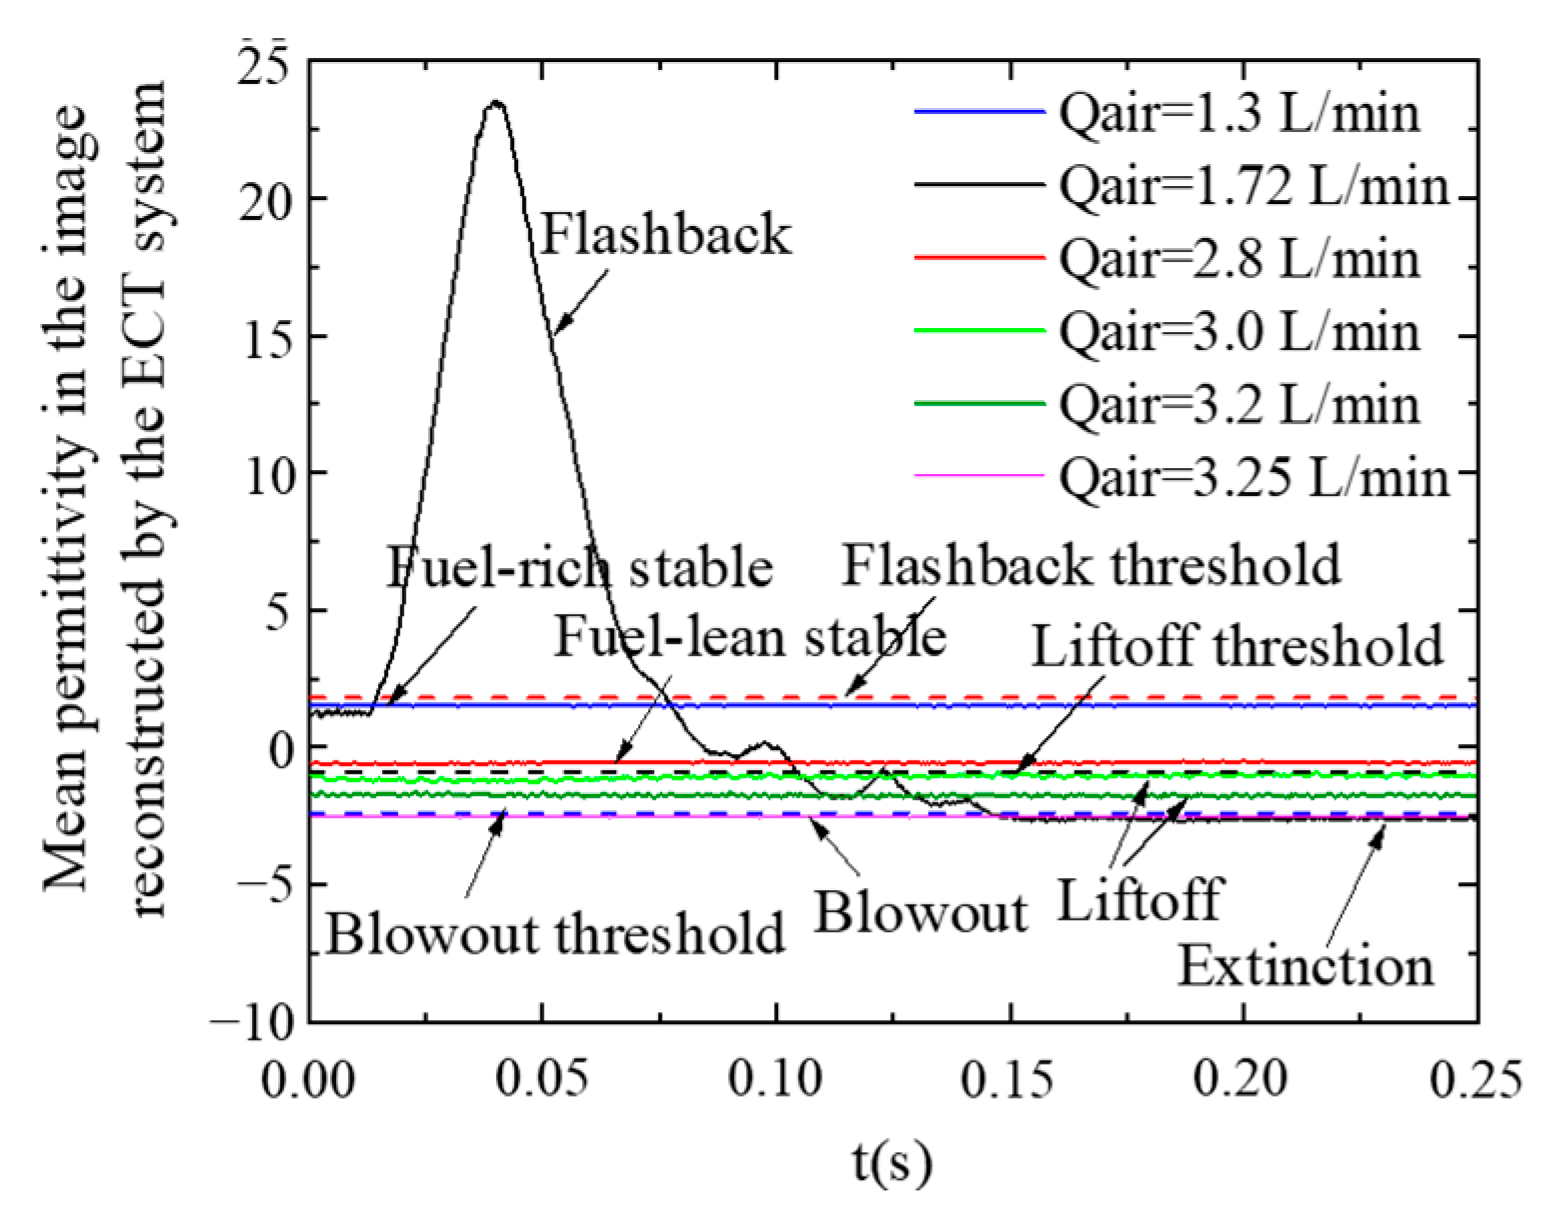
To identify the state of the bluff-body stabilized flame, the threshold-based detection method is adopted. Figure 12 shows the determination of the threshold of the mean permittivity for flame state monitoring. When the airflow is 1.3 L/min, the flame is in the fuel-rich stable state and the mean permittivity is stable around 1.51. As the airflow is increased to 1.72 L/min, the occurrence of the flame flashback causes the abrupt increase and decrease in the mean permittivity. The peak of the mean permittivity reaches 23 and is much larger than the mean permittivity at fuel-rich stable state. The flashback threshold TF is set as 1.2 times of the maximum of the mean permittivity at fuel-rich stable state. The flame flashback is identified as beginning when the mean permittivity rises above the flashback threshold and disappears when it drops below the flashback threshold.
When the airflow is 2.8 L/min, the flame is at the fuel-lean stable state and the mean permittivity is stable around −0.55. As the airflow is increased to 3.0 L/min, the flame is in the state of liftoff and the mean permittivity is stable around −0.92. The difference in the mean permittivity at the fuel-lean stable state and liftoff state is obvious. The liftoff threshold TL is set as 0.85 times of the maximum of the mean permittivity at the airflow of 2.8 L/min, when the flame lifts off from the burner rim exactly. As the airflow is increased to 3.25 L/min, the flame is blown out and the mean permittivity is stable around −2.5. The blowout threshold TB is set as 0.95 times of the maximum of the mean permittivity at blowout state. The mean permittivity at extinction state is same with that at blowout state, and hence the blowout threshold is also used to identify the extinction state.
The mean permittivity above the flashback threshold indicates the occurrence of the flame flashback. The mean permittivity between the flashback threshold and the liftoff threshold indicates that the flame is in the stable state. In this condition, the positive permittivity indicates the fuel-rich stable state, while the negative permittivity indicates the fuel-lean stable state. When the mean permittivity is in the range of the liftoff threshold and the blowout threshold, the flame is in the liftoff state. The mean permittivity below the blowout threshold indicates that the flame is extinguished.
To describe the flame state more conveniently, the flame state index is defined as shown in Equation (5). The flame state index is calculated by integrating the mean permittivity above the flashback threshold and below the liftoff threshold. The flame state indexes under the conditions given in Figure 12 are listed in Table 2. It can be found that the flame state index is 0 when the flame is in the stable state, positive when the flame is in the flashback state and negative when the flame is in the liftoff state. When the flame is in the blowout state, the flame state index is decreased to −0.6444.

4.3. Characterization of Different Flame States

Figure 13 shows the variation of the flame state index with the airflow at the fuel flow of 60 mL/min. The airflow is increased from 0 L/min until the flame is blown out. When the airflow is in the range of 0–1.36 L/min, the mean permittivity is between the flashback threshold and the liftoff threshold, resulting that the flame state index is 0. This indicates that the flame is stable in the airflow of 0–1.36 L/min. When the fuel flow is in the range of 1.36–2.47 L/min, the flame is in the flashback state and the mean permittivity has two intersections (denoted as t1 and t2) with the flashback threshold, and one intersection (denoted as t3) with the blowout threshold. The flame state index calculated using the mean permittivity in the time range of t1t2 is positive, indicating that the flame flashback takes place in the airflow of 1.36–2.47 L/min. After the time of t3, the flame state index is −0.6444, indicating that the flame is distinguished. When the airflow is in the range of 2.48–2.93 L/min, the flame state index is 0 indicating that the flame is in the stable state. When the airflow is in the range of 3.0–3.25 L/min, the flame state index is in the range of −0.6444–0, indicating that the flame is in the flashback state. In addition, with the increase in airflow, the flame state index decreases steeply. This reveals that the flame state index can describe the degree of flame liftoff. When the airflow is larger than 3.25 L/min, the flame state index is −0.6444 indicating that the flame is blown out. Here, the critical flame state index of −0.64 is used to identify the flame blowout state.
The flame states monitored by the ECT system with the proposed flame state index at varied airflow conditions are the same as those monitored by the camera as shown in Figure 13. This reveals that the ECT system can be used to monitor the flame state, and that the proposed flame state index can characterize the flame state in quantification.

5. Conclusions

In the present study, an ECT system with the modified Calderon-based reconstruction method was used to monitor all the flame states and a flame state index was proposed to characterize the flame state of a bluff-body stabilized burner. It can be found that the values of the permittivity detected by the ECT system at different flame states evidently distinguish each other. The mean permittivity at different flame states can be divided by the set flashback threshold, the liftoff threshold and the blowout threshold. The flame state indexes at different flame states conclude that the flame state index of 0 and the positive flame state index indicate the stable and flashback flame states, respectively. The flame state indexes in the range of −0.64–0 and below −0.64 indicate that the flame is at the liftoff state and blowout state, respectively. These results indicate that all the flame states of the bluff-body burner used in the present study can be monitored and characterized by the proposed flame state index with the ECT system.

Author Contributions

Conceptualization, L.C. (Liuyong Chang) and G.L.; methodology, L.C. (Liuyong Chang) and L.C. (Longfei Chen); software, C.Z.; validation, L.C. (Longfei Chen), B.C. and G.L.; formal analysis, L.C. (Liuyong Chang); investigation, B.C.; resources, L.C. (Liuyong Chang); data curation, L.C. (Liuyong Chang); writing—original draft preparation, L.C. (Liuyong Chang); writing—review and editing, G.L.; visualization, C.Z.; supervision, B.C.; project administration, L.C. (Longfei Chen) and Z.X.; funding acquisition, L.C. (Longfei Chen) and Z.X. All authors have read and agreed to the published version of the manuscript.

Funding

This research was funded by the National Key Research and Development Project, grant number [2022YFB2602002], Basic Research Program of the National Nature Science Foundation of China, grant number [52206131], and Zhejiang Provincial Natural Science Foundation of China, grant number [LQ22E060004].

Data Availability Statement

The data used to support the findings of this study are included within the article.

Conflicts of Interest

The authors declare no conflict of interest.

References

  1. Tong, Y.; Liu, X.; Wang, Z.; Richter, M.; Klingmann, J. Experimental and numerical study on bluff-body and swirl stabilized diffusion flames. Fuel 2018, 217, 352–364. [Google Scholar] [CrossRef]
  2. Khateeb, A.A.; Guiberti, T.F.; Zhu, X.; Younes, M.; Jamal, A.; Roberts, W.L. Stability limits and exhaust NO performances of ammonia-methane-air swirl flames. Exp. Therm. Fluid Sci. 2020, 114, 110058. [Google Scholar] [CrossRef]
  3. Dam, B.; Love, N.; Choudhuri, A. Flashback propensity of syngas fuels. Fuel 2011, 90, 618–625. [Google Scholar] [CrossRef]
  4. Kim, W.; Im, S.-K.; Do, H.; Mungal, M.G. Flame liftoff height dependence on geometrically modified bluffbodies in a vitiated flow. Exp. Fluids 2009, 49, 27–41. [Google Scholar] [CrossRef]
  5. Li, F.; Xu, L.; Du, M.; Yang, L.; Cao, Z. Ion current sensing-based lean blowout detection for a pulse combustor. Combust. Flame 2016, 176, 263–271. [Google Scholar] [CrossRef]
  6. Kurdyumov, V.; Fernández-Tarrazo, E.; Truffaut, J.-M.; Quinard, J.; Wangher, A.; Searby, G. Experimental and numerical study of premixed flame flashback. Proc. Combust. Inst. 2007, 31, 1275–1282. [Google Scholar] [CrossRef]
  7. Kedia, K.S.; Ghoniem, A.F. The blow-off mechanism of a bluff-body stabilized laminar premixed flame. Combust. Flame 2015, 162, 1304–1315. [Google Scholar] [CrossRef]
  8. Li, S.; Yao, Q.; Law, C.K.; Liang, W.; Zhuo, J. Liftoff and blowout of the Emmons flame: Analysis of the triple flame. Combust. Flame 2020, 215, 184–192. [Google Scholar] [CrossRef]
  9. De, S.; Bhattacharya, A.; Mukhopadhyay, A.; Sen, S. Early detection of lean blowout in a combustor using symbolic analysis of colour images. Measurement 2021, 186, 110113. [Google Scholar] [CrossRef]
  10. Christodoulou, L.; Kabiraj, L.; Saurabh, A.; Karimi, N. Characterizing the signature of flame flashback precursor through recurrence analysis. Chaos Interdiscip. J. Nonlinear Sci. 2016, 26, 013110. [Google Scholar] [CrossRef] [Green Version]
  11. Eichler, C.; Sattelmayer, T. Premixed flame flashback in wall boundary layers studied by long-distance micro-PIV. Exp. Fluids 2011, 52, 347–360. [Google Scholar] [CrossRef]
  12. Ebi, D.; Clemens, N.T. Simultaneous high-speed 3D flame front detection and tomographic PIV. Meas. Sci. Technol. 2016, 27, 035303. [Google Scholar] [CrossRef]
  13. Yon, S.; Sautet, J.-C. Flame lift-off height, velocity flow and mixing of hythane in oxy-combustion in a burner with two separated jets. Appl. Therm. Eng. 2012, 32, 83–92. [Google Scholar] [CrossRef]
  14. Zheng, L.; Ma, X.; Wang, Z.; Wang, J. An optical study on liquid-phase penetration, flame lift-off location and soot volume fraction distribution of gasoline-diesel blends in a constant volume vessel. Fuel 2015, 139, 365–373. [Google Scholar] [CrossRef]
  15. Li, D.; He, Z.; Xuan, T.; Zhong, W.; Cao, J.; Wang, Q.; Wang, P. Simultaneous capture of liquid length of spray and flame lift-off length for second-generation biodiesel/diesel blended fuel in a constant volume combustion chamber. Fuel 2017, 189, 260–269. [Google Scholar] [CrossRef]
  16. Nair, S.; Lieuwen, T. Acoustic Detection of Blowout in Premixed Flames. J. Propuls. Power 2005, 21, 32–39. [Google Scholar] [CrossRef]
  17. Muruganandam, T.M.; Nair, S.; Scarborough, D.; Neumeier, Y.; Jagoda, J.; Lieuwen, T.; Seitzman, J.; Zinn, B. Active Control of Lean Blowout for Turbine Engine Combustors. J. Propuls. Power 2005, 21, 807–814. [Google Scholar] [CrossRef]
  18. Li, H.; Zhou, X.; Jeffries, J.; Hanson, R. Sensing and Control of Combustion Instabilities in Swirl-Stabilized Combustors Using Diode-Laser Absorption. AIAA J. 2007, 45, 390–398. [Google Scholar] [CrossRef]
  19. Docquier, N.; Candel, S. Combustion control and sensors: A review. Prog. Energy Combust. Sci. 2002, 28, 107–150. [Google Scholar] [CrossRef]
  20. Chang, L.; Cao, Z.; Fu, B.; Lin, Y.; Xu, L. Lean blowout detection for bluff-body stabilized flame. Fuel 2020, 266, 117008. [Google Scholar] [CrossRef]
  21. Hu, D.; Tian, Y.; Chang, L.; Sun, S.; Sun, J.; Cao, Z.; Xu, L. Estimation of Combustion Temperature Field from the Electrical Admittivity Distribution Obtained by Electrical Tomography. IEEE Trans. Instrum. Meas. 2020, 69, 6271–6280. [Google Scholar] [CrossRef]
  22. Sun, J.; Yang, W.; Tian, W. 3D imaging based on fringe effect of an electrical capacitance tomography sensor. Measurement 2015, 74, 186–199. [Google Scholar] [CrossRef]
  23. Calderón, A.P. On an inverse boundary value problem. Comput. Appl. Math. 2006, 25, 133–138. [Google Scholar] [CrossRef] [Green Version]
  24. Gut, Z.; Wolanski, P. Flame Imaging Using 3D Electrical Capacitance Tomography. Combust. Sci. Technol. 2010, 182, 1580–1585. [Google Scholar] [CrossRef]
  25. Waterfall, R.C.; He, R.; Beck, C.M. Visualizing combustion using electrical impedance tomography. Chem. Eng. Sci. 1997, 52, 2129–2138. [Google Scholar] [CrossRef]
  26. Chen, Q.; Jia, Y.; Mao, X.; Ju, Y. Direct Measurements of Permittivity of Plasma-Assisted Combustion Using Electrical Capacitance Tomography. IEEE Trans. Plasma Sci. 2016, 44, 3009–3016. [Google Scholar] [CrossRef]
  27. Sun, J.; Yang, W. Fringe effect of electrical capacitance and resistance tomography sensors. Meas. Sci. Technol. 2013, 24, 074002. [Google Scholar] [CrossRef] [Green Version]
  28. Wen, Y.; Zhao, L.; Zhang, Y.; Zhao, P.; Wang, H. Defect detection of the adhesive layer of composite component based on the ECT technology. Chinses J. Sci. Instrum. 2015, 36, 1783–1791. [Google Scholar]
  29. Ma, M.; Liu, H. Design of ECT system based on planar array electrode sensor. Trans. Microsyst. Technol. 2016, 36, 82–87. [Google Scholar]
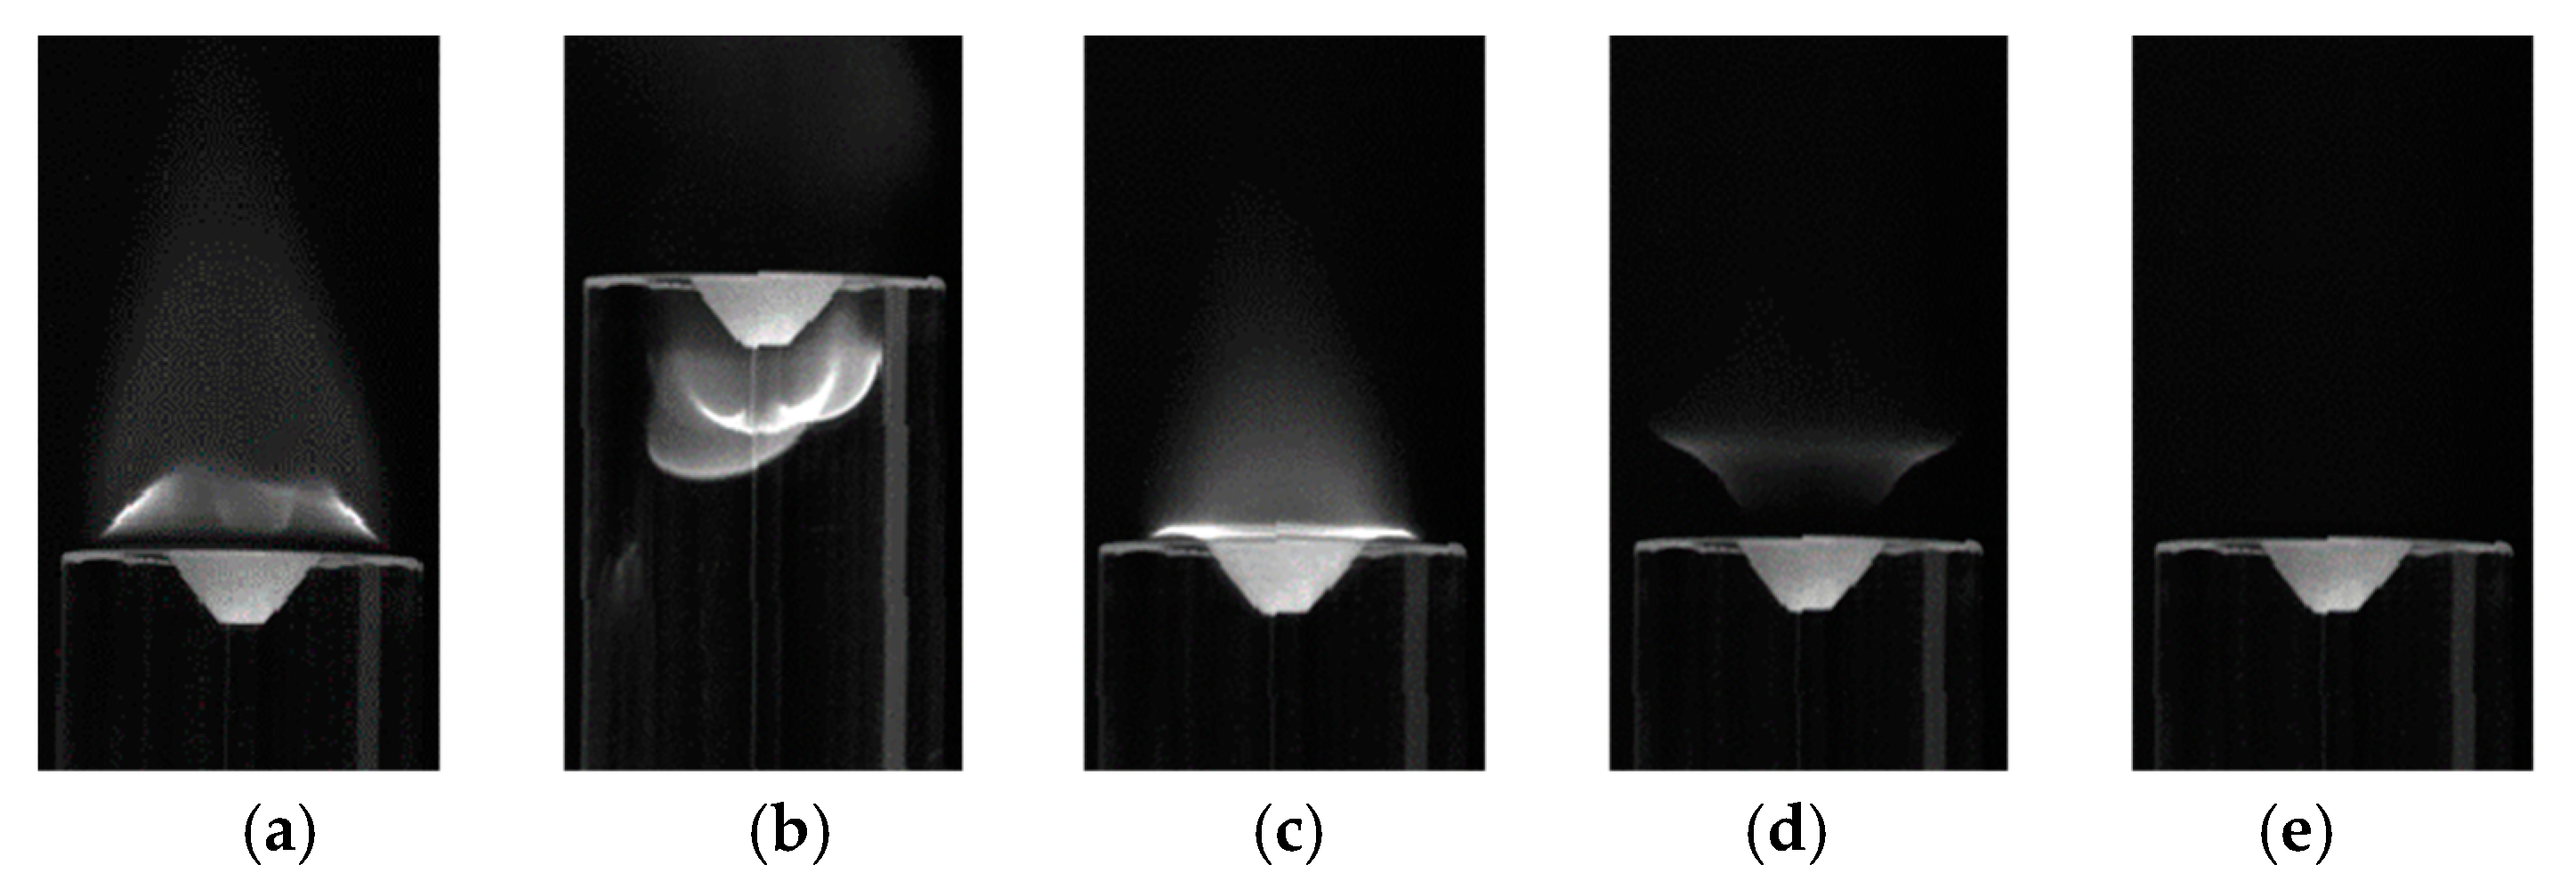
Figure 1. Flame photos taken by a high-speed camera at Qfuel = 60 mL/min and Qair = 1.3 L/min, 1.36 L/min, 2.48 L/min, 3.0 L/min and 3.25 L/min. (a) 1.3 L/min; (b) 1.36 L/min; (c) 2.48 L/min; (d) 3.0 L/min; (e) 3.25 L/min.
Processes 11 02403 g001
Figure 2. Schematic diagram of the electrical capacitance tomography system for flame state monitoring.
Processes 11 02403 g002
Figure 3. Schematic diagram of the fringe effect of the electrical capacitance tomography sensor.
Processes 11 02403 g003
Figure 4. Schematic diagram of the experimental setup.
Processes 11 02403 g004
Figure 5. Photos taken by the camera and images reconstructed by the ECT system at Qfuel = 60 mL/min and Qair = 1.3 L/min, 2.8 L/min. (a) Qair = 1.3 L/min (b) Qair = 2.8 L/min.
Processes 11 02403 g005
Figure 6. Time series of the mean permittivity in the image reconstructed by the ECT system at Qfuel = 60 mL/min and Qair = 1.3 L/min, 2.8 L/min.
Processes 11 02403 g006
Figure 7. Flame flashback photos taken by the camera at Qfuel = 60 mL/min and the Qair = 1.72 L/min.
Processes 11 02403 g007
Figure 8. Flame flashback images reconstructed by the ECT system at Qfuel = 60 mL/min and Qair = 1.72 L/min.
Processes 11 02403 g008
Figure 9. Time series of the mean permittivity in the image reconstructed by the ECT system at the Qfuel = 60 mL/min and Qair = 1.72 L/min.
Processes 11 02403 g009
Figure 10. Photos taken by the camera and images reconstructed by the ECT system at Qfuel = 60 mL/min and the airflow of (a) 2.93 L/min, (b) 3.0 L/min, (c) 3.2 L/min and (d) 3.25 L/min.
Processes 11 02403 g010
Figure 11. Time series of the mean permittivity in the image reconstructed by the ECT system at Qfuel = 60 mL/min and the airflow of 2.93 L/min, 3.0 L/min, 3.2 L/min and 3.25 L/min.
Processes 11 02403 g011
Figure 12. Determination of the threshold of the mean permittivity for flame state monitoring.
Processes 11 02403 g012
Figure 13. Variation of the flame state index with the airflow at the fuel flow of 60 mL/min.
Processes 11 02403 g013
Table 1. Flame states at Qfuel = 60 mL/min and Qair = 0–3.25 L/min.
Airflow (L/min)Equivalence RatioFlame State
<1.36>1.27Stable flame at fuel-rich condition
1.36–2.480.72–1.27Flame flashback
2.48–3.00.59–0.72Stable flame at fuel-lean condition
3.0–3.250.54–0.59Flame liftoff
>3.25<0.54Blowout
Table 2. Flame state indexes at Qfuel = 60 mL/min and airflows of 1.3 L/min, 1.72 L/min, 2.8 L/min, 3.0 L/min, 3.2 L/min and 3.25 L/min.
Airflow (L/min)Flame StateFlame State Index
1.3Fuel-rich stable0
1.72Flashback0.8452
2.8Fuel-lean stable0
3.0Liftoff−0.1176
3.2Liftoff−0.4841
3.25Blowout−0.6444
Disclaimer/Publisher’s Note: The statements, opinions and data contained in all publications are solely those of the individual author(s) and contributor(s) and not of MDPI and/or the editor(s). MDPI and/or the editor(s) disclaim responsibility for any injury to people or property resulting from any ideas, methods, instructions or products referred to in the content.