Abstract
This paper aims to optimize the quality characteristics of the drilling process in glass fiber-reinforced polymer (GFRP) composites. It focuses on optimizing the drilling parameters with drill point angles concerning delamination damage and energy consumption, simultaneously. The effects of drilling process parameters on machinability were analyzed by evaluating the machinability characteristics. The cutting power was modeled through drilling parameters (speed and feed), drill point angle, and laminate thickness. The response surface analysis and artificial neural networks enhanced by the particle swarm optimization algorithm were applied for modeling and evaluating the effect of process parameters on the machinability of the drilling process. The most influential parameters on machinability properties and delamination were determined by analysis of variance (ANOVA). A multi-response optimization was performed to optimize drilling process parameters for sustainable drilling quality characteristics. The obtained models were applied to predict drilling process characteristics, and exhibited an excellent harmony with the experiment results. The optimal drilling process factors were the highest spindle speed and the lowest feed, with a drill point angle of 118° for the laminate of 4.75 mm thickness.
1. Introduction
Fiber-reinforced polymer composite materials attract great interest in the industry because of their properties that make them superior to other traditional materials in the manufacture of structures for aircraft, cars, trains, ships, and others [1,2]. These structures are usually assembled by screw connections or by any other means, through the holes drilled in them. The quality of these holes is critical, as non-matching of quality characteristics such as roundness, roughness, straightness, parallelism, and perpendicularity can create excessive stress on the screws, leading to their failure.
Many researchers have reported their studies on the impact of drilling process parameters such as cutting speed, feed rate, and geometry of drilling tools on machining process characteristics such as critical thrust force, drilling torque, induced temperature, and damage in laminates of fiber-reinforced polymer composites like Glass-FRP and Carbon-FRP. The delamination damage is more intricate, due to the need for systematic repair increasing manufacturing costs, since repairing a defective hole caused by such delamination takes 5–6 h per hole [3,4]. Moreover, Davim and Reis [5] investigated the effect of the machining parameters on the cutting power in drilling carbon fiber-reinforced plastic composite experimentally.
Manufacturing industries require large inputs of energy, while sometimes the manufacturing industry’s participation in the energy consumed in the industry is greater than that for its economic return from the industry [6]. Regarding sustainable machining, Ali Bastas [7] examined 46 research articles targeting sustainable manufacturing, where it was noted that turning and milling are the most common manufacturing processes in sustainable manufacturing technology research, with 67% of the total articles examined. A total of 17% of research articles studied cutting condition optimization, in which the optimal parameters were investigated, including speed, feed, depth of cut, and material removal rates for improving sustainability, including optimizing power consumption. Only 9% discussed the drilling process for achieving sustainable machining. In a systematic review conducted by Rüstem et al. [8], a literature review of energy consumption studies on composite materials included CFRP composites and ceramic materials, without any reference to the use of GFRP composite materials. This indicates the need to study the power consumed in the machining of GFRP composites. Therefore, in addition to delamination, this article will investigate the correlation between the machining parameters and power consumption in drilling FRP composites.
Statistical experimental design methods are widely used academically and industrially in various fields for the purpose of examining, analyzing, improving processes, and controlling inputs to improve outputs [9]. Design of Experiments (DOEs) is an organized method that is used for determining the factors that control the process and the relationship between them and the outcome of that process, in addition to the interrelationship between control factors, and which then provides mathematical models to describe the experimental results [10]. For manufacturing processes, DOEs techniques are widely used in identifying the significance of processing parameters on process output such as forming processes [11], machined surface quality [12], assembled product characteristics during production [13], and chemical process yield [14]. Response surface methodology was used in different forms, such as the Box–Behnken design [15] and central composite design [16]. Throughout much research, RSM was used to characterize the drilling processes in many different materials [17,18,19,20].
Machine learning (ML) techniques and neural networks are increasingly used to build predictive models that serve many disciplines [21,22,23]. In sustainable manufacturing, ML use increases with the growing production demand. Outeiro, J., et al. [24] applied ML and DOEs for modeling and optimizing Ti-6Al-4V Titanium alloy machining. Various ML techniques have been applied in the research. Neural networks, evolutionary algorithms, and regression of response surface analysis (RSA) models are the most used methods [25,26].
NNs were employed in building predictive models in many disciplines [27,28]. In much research, neural networks are coupled with DOE techniques for developing predictive models [29,30,31]. ANNs were used in the evaluation of the drilling parameters of jute FRE, influencing the delamination factor [32]. The central composite design of RSM was used and ANNs were applied for validation of the experimental results and prediction of the composite structure behavior, depending on the drilling parameters [33]. Anarghya, A. et al. reported the prediction capability of both RSM and ANNs reinforced by the genetic algorithm regarding thrust force and torque in the drilling process of aramid FRE composites [34].
A permanent goal for improve thing manufacturing process is to increase productivity or reduce cost while maintaining the required quality. Hence, many researchers investigated the effect of drilling parameters and drilling tool features to determine the factors most affecting the different outputs of the drilling process, such as thrust force, torque, heat-affected zone, and delamination [32,33,35,36,37,38,39,40].
Predicting the FRP drilling process outcomes, especially power consumption and delamination damage, is a major issue that relates directly to the total production cost. Power consumption and delamination damage should be examined for improving the drilling process sustainability and products. However, in this regard, little research work has been reported [5,7]. Although numerical modeling is now routinely used in various fields of analytics, it still faces several limitations, such as model complexities that lead to increased simplification assumptions, limitations of plasticity theories, and inhomogeneities of fiber-reinforced composites, as well as high computing costs. Therefore, modeling techniques based on artificial intelligence and machine learning can be used as an effective alternative to overcome these obstacles [41].
The optimization process aims to find the optimal value or the best solution. Optimization problems involve finding the maximum or minimum value using a single or multiple objective. Multi-objective optimization refers to finding the optimal solution values for more than one desired objective. Multi-objective optimization became crucial as a problem-solving tool in industrial processes [42]. The controlled elitist multi-objective genetic algorithm was applied for optimizing cell size and density to produce foam with the best mechanical properties [43], in addition to using the finite element method in analyzing and improving the characteristics of operating processes [44].
Machining processes are responsible for a big part of the manufacturing environmental footprint, due to their power consumption. The cutting power could be minimized by optimizing the cutting condition in machining processes [45]. Thus, manufacturers can save money and gain safer sustainability by minimizing their power demands to a minimal level. Moreover, the quality of a product achieved by minimizing the delamination by controlling the drilling parameters will be improved, and reflects economic sustainability. To the author’s knowledge and in line with the literature review, an investigation of optimizing the drilling process of woven GFRP composites with a high-accuracy CNC machine by minimizing cutting power consumption with minimal delamination damage has not been addressed by controlling drilling parameters (feed and speed) with various drill point angles and for different thickness of laminates.
Statistical methods were used in analyzing the results of the full factorial experiments and extracting the regression models for process outcomes. The proposed machine learning model PSO-NN was trained and tested using the experimental data with an optimizing training process using the PSO algorithm. Different measures were used to evaluate the prediction accuracy of the models obtained.
In the end, the drilling operations were optimized in order to minimize the level of delamination and the power consumption in cutting with the lowest thrust force and maximum drilling torque by controlling the drilling operation parameters. The optimal operating parameters of the feed, spindle speed, angular drilling point, and lamination thickness of the woven GFRE material are thus determined.
2. Material and Methods
The samples used in the experiments were 3 laminates of woven GFRP fabricated by the hand lay-up technique, produced in different thicknesses of 2.6 mm, 5.3 mm, and 7.7 mm. The fiber volume fraction was 40% in the matrix fabricated from Araldite LY5138-2 epoxy polymer with the use of HY5138 Hardener. The specimens were prepared by cutting to standard dimensions using an abrasive water-jet CNC machine [46]. The tensile properties of the samples such as tensile strength, modulus of elasticity, and Poisson’s ratio were 203.86 MPa, 16.05 GPa, and 0.295, respectively.
Experiments were run by a DMG-CNC milling machine for drilling operations using the special ultrafine cemented carbide tip of two-flute twist drills. The used drill material characteristics are as follows: Material Grade (K200), ISO Code (K20~K40), WC (90%), Co (10%), Grain Size (0.5~0.8 µm), Density (14.4 g/cm3), Hardness (91.3 HRA), Rupture Strength Transverse (3920 MPa), KIC (10.5 MPa·m1/2), and its geometries are as follows: diameter (6 mm), flute length (28 mm), total length (66 mm); helix, rake, and clearance angles (30°, 30°, and 12°, respectively); three drills with point angles (100°, 118°, 140°), and length of chisel edge (0.3 mm). For clean manufacturing, experiments were conducted under dry-cutting conditions.
Full factorial design was used to plan experiments for four control factors (spindle speed, feed, drill point angle, and laminate thickness) within the given levels shown in Table 1. The experimental results extracted from [46] were used in the investigation of the effect of the mentioned machining parameters on the machinability proprieties, drilled hole quality, and cutting-power consumption.

Table 1.
Experimental design.
The delamination factors could be assessed by applying several methods [47]. In the current work, the peel-up and push-out surface delamination were assessed using the AutoCAD technique, which is appropriate for such materials under study, as they are quasi-transparent composite materials. This technique is reported in detail by [48,49].
The delamination factor Fd was evaluated by
where Do is the nominal hole diameter and Dmax is the maximum diameter of delamination that can be drawn from the center point of the Do.
The consumed cutting power shown in Table 2 was computed by applying the maximum drilling torque, measured by the Kistler dynamometer, in Equation (2).
where T is the torque (N.m), and s is the spindle speed (r/min).
Table 2.
The variation of torque, and cutting power.
PSO-NN Model
ANNs are known as an arrangement of mathematical algorithms mimicking the human brain in learning by applying simple computations. An ANN is a vigorous tool used in modeling non-linear relationships between the inputs and output(s) of the process [50], and it is one of the means of carrying out machine learning. As a most common type of feed-forward network, a multi-layer perceptron is used. It consists of three types of layers, the input, hidden, and output layers. Every layer consists of neurons containing weights, and biases. Activation functions such as linear, sigmoid, and logistic are used for converting inputs into outputs, as well as the learning algorithm [51].
To develop and apply ANN, three sequential processes are required, which are training, validation, and testing. Training the networks aims to find the optimum values of weights and biases through the network’s layers. The objective function used to find the optimum training result of ANN is minimizing mean square error (MSE), using Equation (3),
where I is the measured value as taken in the training data set and O is the ANN output, and n is the number of examples used in the training process.
The best trained network is selected for the minimal MSE between the measured and predicted responses. For evaluating the performance of the best-obtained network, the correlation coefficient (R) is applied between the actual and the predicted values.
PSO as a metaheuristic improvement technique simulates the behavior of birds while searching for food [52,53]; the PSO algorithm was simplified, and it was observed that it leads to improvement, by applying the intelligent swarm method.
Each particle stores in its own memory its best position, along with the global best position. Given that information and the particle’s velocity vi, the new particle’s position becomes . Inside the range of the search domain with upper (U) and lower (L) boundaries, the population set of moving particles is generated using Equation (4).
The particle’s velocity can be updated by applying Equation (5).
where w is the weight of inertia, c1 and c2 are the acceleration coefficients, r1 and r2 are random numbers, pBest and gBest are best particle position and best global solution, respectively, and the iteration number is k.
Then, determine the new particle’s position by applying Equation (6).
And then compute the fitness of each particle. After that, determine the pBest and the gBest. Repeat these steps until the preset parameter value is reached.
NN training is a miniaturization problem in which the network weights and biases are determined, to achieve minimal prediction error. Enhancing neural networks with methods such as metaheuristic optimization is often required to avoid the hurdles that classical training algorithms, face such as the possibility of long training time or deception at local minimum points, and thus improve the prediction performance of these integrated networks. The neural network is enhanced by the PSO algorithm. The PSO-NN is here to utilize the PSO algorithm in the optimization of the neural network performance by minimizing the prediction errors. That is performed by identifying the optimal both weight and bias values of the net. The minimal MSE expressed by Equation (2) is the objective function of the optimum performance of the trained neural network applying the PSO algorithm, which updates the neural network even until reaching the stop limit.
3. Results and Discussion
In this section, the focus is on analyzing the effect of processing parameters on the cutting power consumed, and comparing it with the torque generated by drilling, which has not been addressed in previous research. In addition, we present the performance results of predictive models using neural networks and comparing them with multiple regression models. Then the cutting power consumed is included as a new dimension in the multi-objective optimization process, the focus of this work.
3.1. Effect of Drilling Parameters on the Torque
It is evident from the torque main effects plot shown in Figure 1 that the torque is significantly increased by increasing the feed, due to the increase in the cross-sectional area of the uncut chip. It is decreased by 15% by increasing the spindle speed from 400 r/min to 1600 r/min.
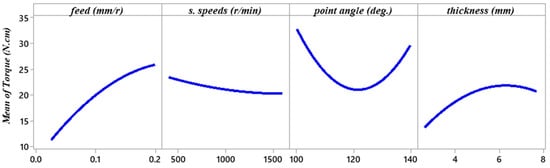
Figure 1.
Main effect plot for Torque (N.cm).
Meanwhile, the drill point angle influences the generated torque differently. The torque produced with the use of drill point angles 100° and 140° is higher than at drill point angle 118°. It means that the highest average torque is in the cases at the lower point angle (100°) and the lowest average torque is at the angle 118°. It is evident from Figure 1 that the effect of thickness on torque contrasts with that of the drill point angle. As shown, the thickness increase from 2.6 to 5.3 mm was accompanied by an increase in torque of ~45%, but as the thickness increased from 5.3 to 7.7 mm, the torque slightly decreased.
3.2. Effect of Drilling Parameters on Power Consumption
Ali Bastas, 2021 [7] examined 46 research articles targeting sustainable manufacturing, where it was noted that turning and milling are the most common manufacturing processes in sustainable manufacturing technology research, with 67% of the total examined articles. A total of 17% of research articles studied cutting condition optimization, in which the optimal parameters were investigated, including speed, feed, depth of cut, and material removal rates for improving sustainability, including optimizing power consumption. In general, energy consumption is reduced by reducing the thrust force and cutting torque [54].
Figure 2 shows a graph of the main effects of the power consumed, and it is observed from the curves represented in the figure that the behavior of the power function and torque function in Figure 1 are similar concerning the feed, the angle of the drilling point and the thickness of the laminate. This is due to the mathematical Equation (2) used to calculate the cutting power (P) for the drilling process, where the cutting power is proportional to the generated torque. The cutting power is significantly increased by increasing the feed. The computed cutting power at the use-of-drill point angles 100° and 140° is higher than at the use-of-drill point angle 118°. It means that the highest cutting power is at the case of the point angle of 100° and the lowest power is at the case of the point angle of 118°, while it is evident that the computed cutting power is linearly proportional to cutting speed, based on the formula used in computing the power. It can be observed that the lowest value of cutting power is generated at the lowest values of speed and feed. Similar results were reported in [55].
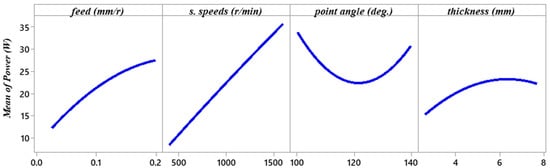
Figure 2.
Main effect plot for power (W).
Similar to torque, power consumption increases with more feed, while the power consumption differs from the torque with the increase in the spindle speed. In other words, as the spindle speed increases, the power consumption increases and the torque tends to decrease slightly.
Regression analysis and factorial interaction plots are used to examine the interaction between the torque and spindle speed, which is illustrated in Figure 3.
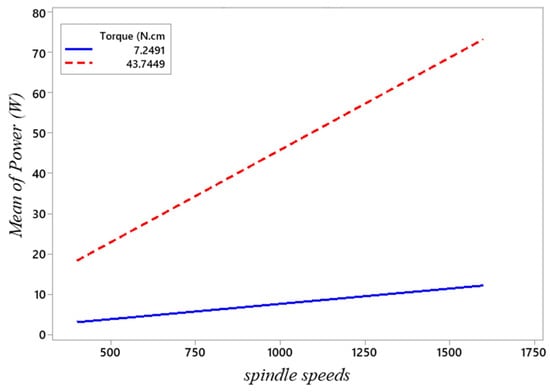
Figure 3.
Interaction plot of cutting power vs. torque and spindle speed.
Delamination of FRP composites affects the safety and reliability of any built structure. Therefore, the delamination induced during the drilling process has a significant economic impact, especially keeping in mind the different stages through which a component goes when it reaches the final assembly line. These defects that occurred during manufacturing could mean the loss of the sustainable advantage of FRP composites. This delamination exhibited a convoluted failure mode that was produced by a combination of thermal and mechanical damage. The delamination may be the entry (peel-up) or exit (push-down) of the composite laminate. Entry delamination occurs due to fracture modes II and III. Fractures of mode II occurs when the fibers of the upper layers are not sufficiently cut. Fractures of mode III occur when the twisted drill edges face the laminates and a peeling force is generated by the slope of the drill flute that separates the upper layers [4]. The bottom-surface exit delamination occurs due to both mode I and mode II of fracture, and is attributed to the exposure of the material to axial forces and bending forces. The previous literature showed that exit delamination is larger and more critical than entry delamination, due to the absence of backup support, which can neutralize thrust force during the permeation of the drill [44,45].
Figure 4 shows the main effect plot for Fd-exit. The Fd-exit factor is increased significantly by increasing feed, by reason of an increasing thrust force. Also, Fd-exit is increased by increasing the drill point angle.
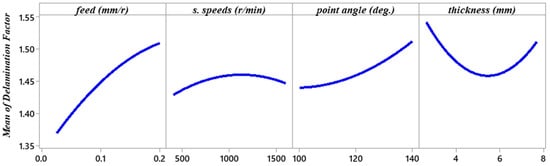
Figure 4.
Main effect plot for delamination factor.
Despite the thrust force associated with the 5.3 mm thickness being higher than that of the 2.6 mm laminate, the Fd-exit of the 2.6 mm laminate is higher than those of the 5.3 mm one. This result is attributed to the poor stiffness of the thinnest laminate, leading to a bending in the last layer larger than those in the thickness of 5.3 mm. In the reverse direction, the Fd-exit of the thicker specimen of 7.7 mm is larger than those of 5.3 mm. This result is due to the accumulation of thermal and mechanical damages together in the 7.7 mm specimen, and with the highest drilling temperature, as detailed in [43]. The effect of the feed rate may be due to the increase in chip area accompanying the increase in the feed rate, which increases the material’s resistance to cutting and thus the effort expended to remove the chip [56].
3.3. ANOVA
ANOVA tables are summarized in Table 3, as well as the R2 (coefficient of determination) value of each model. From ANOVA results, the influencing control factors and all terms of RSA models on the process outputs are evaluated by their contribution percentage in variation. The p-value infers the significance value of the model term’s effect on the responses if its value is less than 0.05, as in most experimental work. Consequently, the process parameters and other control factors studied influence the drilling process outcomes, as illustrated in Table 3.
Table 3.
Summaries of ANOVA results for contribution of control factors.
ANOVA analysis showed that feed rate has the greatest influence and participation in building the mathematical models obtained for the drilling process in glass fiber-reinforced polymer composites. The contribution of each main effect factor which resulted from the ANOVA of the general linear model of each response is shown in Figure 5. The feed participations were 84.6%, 43.5%, 15%, and 44.4% for thrust force, torque, power consumption, and delamination factor, respectively. The impact of the feed on power consumption is due to its proven effect on the drilling torque, which in turn is a key factor in computing the power consumed.
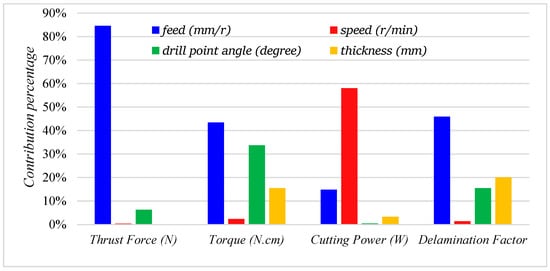
Figure 5.
Contribution of main factors to the drilling process attributes.
From all of the above, and in order to achieve a sustainable drilling process that takes into account the quality of the holes produced, represented by the delamination factor, and that it keeps the cost of the energy consumed low, controlling the feed rate and the cutting speed simultaneously is necessary to achieve this goal.
The correlation between drilling process responses and the different process control factors was evaluated utilizing RSA, which gave the mathematical equations of thrust force, torque, and delamination factor mentioned below. The significance index showed that the models obtained were statistically significant in analyzing each response, with a confidence level of 95% with acceptable goodness. As the parameters were in multiple levels, the used quadratic model was expressed as follows:
where Y refers to response, f, s, a and t are the control factors of experimental design, and the are the variation resource coefficients of the predictive model. The quadratic equations of thrust force, torque, and delamination factor are expressed by Equations (7)–(9).
The surface response for the drilling process properties can be plotted, and can predict the response values for any combination of the drilling parameters within the space of the designed experiment. In a later section, these predictive models will be compared to other models obtained using neural networks.
3.4. Predictive PSO-NN Models
The experimental data are used in training the proposed PSO-NN model. The PSO-NN model learns to estimate the relationship between drilling parameters (feed, cutting speed, drill point angle, and laminate thickness) and various responses (Ft, T, P, and Fd).
The data used in training are divided into the training dataset (70%) and the test dataset (30%). This distribution is applied for the thrust force, torque, cutting power, and exit delamination factor, and then the training is performed, utilizing the PSO algorithm to obtain optimal parameters for the neural network, which minimizes prediction errors. Increasing the number of neurons in the hidden layer reduces the error while taking care not to overfit [50].
The proposed PSO-NN structures are four inputs and eight neurons for one hidden layer, C1 and C2 are 1.4, and 2.5, respectively, and the search boundaries LB and UB are −1.273 and 1.273, respectively. Table 4 elucidates the performance of trained PSO-NN models, which are measured by MSE, along with the correlation coefficient (R) between predicted and measured values.
Table 4.
PSO-NN evaluation.
It is evident that the predicted data from trained PSO-NN models coincide with the experimental results in relation to all drilling properties under study. This is also illustrated by the strong correlation between measured and predicted responses for the four drilling properties represented by the scatter diagram shown in Figure 6.
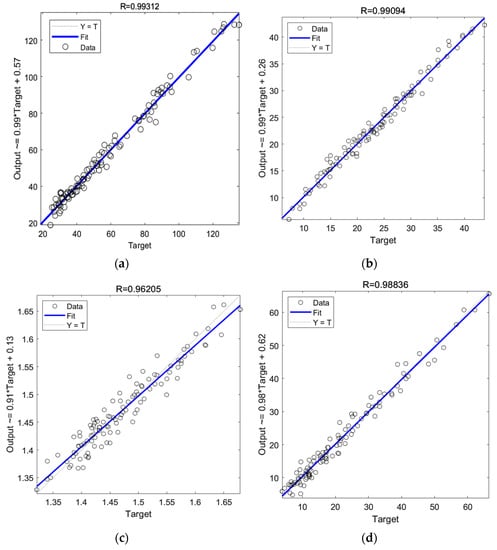
Figure 6.
Scatter plot of PSO-ANN model performance: (a) Thrust force, (b) Torque, (c) Delamination factor, and (d) Cutting power.
Figure 6a,b,d of the Thrust force, Torque, and Power PSO-NN models show high accuracy of the models, where the predicted values appear closely scattered around the straight line, while Figure 6c shows the accuracy of the Fd PSO-NN model is lower than the other models mentioned above. Nevertheless, the high values of R2 of 0.986, 0.982, 0.977, and 0.963 for Ft, T, P, and Fd, respectively, are higher than that obtained using the traditional training technique (the Levenberg–Marquardt algorithm), which was examined too.
The response surface can be plotted by applying the obtained predictive models and used in optimizing the drilling process by determining the optimal machining parameters. The ability of developed models to relearn for enhancing their predictive capability with increasing data enables them to facilitate the exploitation of artificial intelligence in the FRP manufacturing.
Figure 7, Figure 8 and Figure 9 show the response surface plots for the four drilling process characteristics plotted using the models obtained, using both RSA regression and PSO-NN as functions in the f, s, a, and t variables. These models can be used to estimate response values for any appropriate set of drilling parameters. On other hand, Figure 10 shows the response surface plot of cutting power versus feed, spindle speed, and drill point angle plotting by Equation (6).
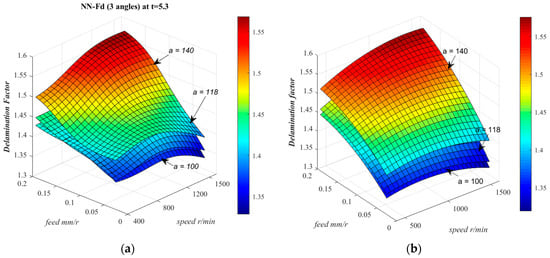
Figure 7.
Response surface plot of delamination factors vs. f, s, at t = 5.3 and a (100°, 118°, 140°) plotting by (a) PSO-NN model (b) RSA regression.
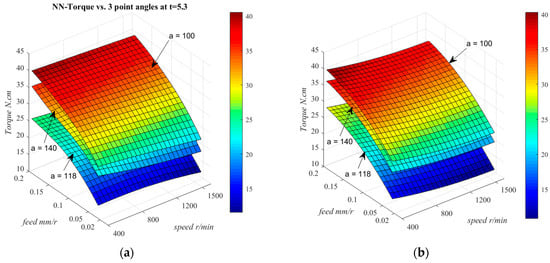
Figure 8.
Response surface plot of Torque vs. f, s, at t = 5.3 and a (100°, 118°, 140°) plotting by (a) PSO-NN model and (b) RSA.
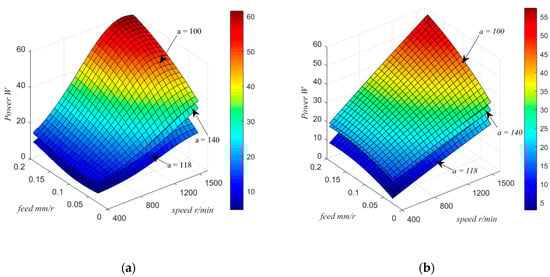
Figure 9.
Response surface plot of Power vs. f, s, and a at t = 5.3, plotting by (a) PSO-NN model and (b) RSA.
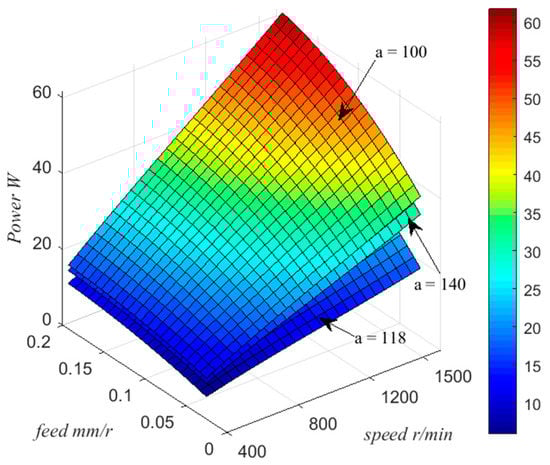
Figure 10.
Response surface plot of Power vs. f, s, and a at t = 5.3, plotting by Equation (6).
3.5. Comparison of the Obtained Predictive Models
Performance statistical measures: R2, MSE, and mean absolute percentage error (MAPE) of predictive models are used to evaluate and compare the two modeling techniques used. MAPE is calculated using Equation (10).
where and O are the measured and predicted results of i run, and n is the total number of runs.
These measures illustrated in Table 5 evidence the capability of obtained predictive models to describe the experimental results. The superiority of the PSO-NN models is evident.
Table 5.
Performance measures of predictive models.
Within the range of low error rates mentioned in Table 5, it can be said that the models successfully describe the drilling process and predict process responses with high accuracy, and can be used for optimization.
3.6. Optimizing Process Outputs
According to Table 6 and Figure 11, the optimal inputs of the drilling process of WGFRP (f = 0.025 mm/r, s = 655 rpm, a = 117.7°, and t = 3.88 mm) resulted in an optimal thrust force, torque, power consumption, and delamination factor of 32.3 N, 10.66 N.cm, 3.88 W, and 1.387, respectively, with the desirability of 0.91. Paying more attention to the quality of the hole produced and the power consumed, we find that the second solution is optimal for the application, resulting in thrust force, torque, power consumption, and delamination factors of 35.2 N, 15 N.cm, 2.3 W, and 1.35, respectively, at combination (f = 0.025 mm/r, s = 401 rpm, a = 112°, and t = 4.75 mm), with a desirability of 0.896. It is worth taking advantage of such models to decide which is the best thickness during the product design phase, as well as the best process plan for drilling holes in WGFRP composites.
Table 6.
Multi-response optimization for drilling process machinability and delamination.
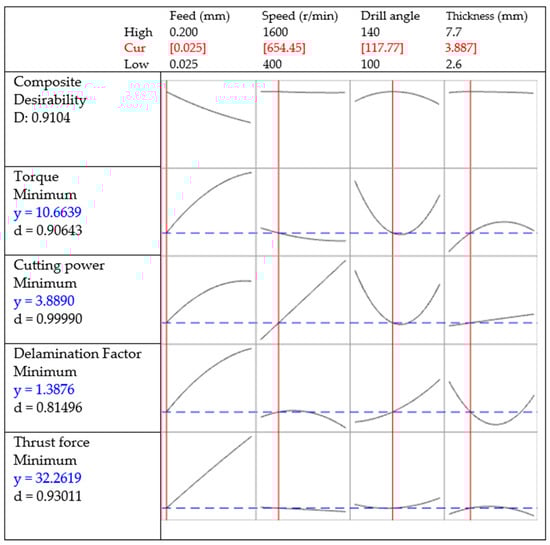
Figure 11.
Optimization plot of multi-response.
4. Conclusions
The impact of drilling parameter feed rate and cutting speed using different drill point angles through different laminate thicknesses on the power consumption during cutting, as well as delamination, were investigated. A machine learning model was developed based on an ANN enhanced by the PSO algorithm to predict the critical thrust force, drilling torque, delamination factor, and cutting power consumption. Predictive models developed were used in multi-responses optimization of the drilling process. The results of this study were as follows:
- Multivariate regression explains that the effect of feed rate on the power consumed is directly proportional.
- Feed rate is prevalent in influencing the delamination factor among the studied control factors, followed by drilling point angle. Also, the speed had a statistically significant effect on the delamination, but with a slight contribution.
- Obviously, a combination of a lower feed rate and a higher spindle speed reduces the delamination, as with the torque generated. On the contrary, however, the higher speed level increases the power consumption.
- The effect of feed rate came out on top for thrust force (84.6%), torque (43.5%), and delamination factor (44.4%). Meanwhile, it was found that the rotational speed provided the largest contribution to the power consumption, followed by the feed rate, due to the dependence of the calculated power on the rotational speed and the torque generated during cutting.
- It has been observed that the drill point angle has an effect on the critical thrust force, and hence this effect on the push-out delamination is amplified, especially with the highest feed rates and speeds.
- In order to achieve a sustainable drilling process that takes into account the quality of the holes produced, represented by the delamination factor, and keeps the cost of the energy consumed low, controlling the feed rate and cutting speed simultaneously is necessary.
- Models of RSA regression and PSO-NN developed were able to predict drilling process characteristics showing a very high consistency with the measured data. However, the PSO-NN models were more accurate than the others.
- An optimal combination of factors (f = 0.025 mm/r, s = 401 rpm, a = 112°, and t = 4.75 mm) was found to obtain the optimum produced hole quality as well as a low cutting power consumed, with an overall desirability factor of 91%.
Funding
This research was funded by the Institutional Fund Projects under grant no. IFPIP: 679-135-1443.
Data Availability Statement
Not applicable.
Acknowledgments
This research was funded by the Institutional Fund Projects under grant no. (IFPIP: 679-135-1443). The authors gratefully acknowledge technical and financial support provided by the Ministry of Education and King Abdulaziz University, DSR in Jeddah, Saudi Arabia.
Conflicts of Interest
The authors declare no conflict of interest.
References
- Reisgen, U.; Schiebahn, A.; Lotte, J.; Hopmann, C.; Schneider, D.; Neuhaus, J. Innovative joining technology for the production of hybrid components from FRP and metals. J. Mater. Process. Technol. 2020, 282, 116674. [Google Scholar] [CrossRef]
- Khashaba, U.A.; Othman, R.; Najjar, I.M.R. Effect of Water Absorption on the Impact Behaviors of CFRE Composites. Glob. J. Res. Eng. Mech. Mech. Eng. 2017, 17. [Google Scholar]
- De Zarate Knorr, B. Optimisation du Processus de perçage d’empilages Hybrides Composites/Titane. Master’s Thesis, ENSAM, Bordeaux, France, 2014. [Google Scholar]
- Girot, F.; Dau, F.; Gutiérrez-Orrantia, M.E. New analytical model for delamination of CFRP during drilling. J. Mater. Process. Technol. 2017, 240, 332–343. [Google Scholar] [CrossRef]
- Davim, J.P.; Reis, P. Drilling carbon fiber reinforced plastics manufactured by autoclave—Experimental and statistical study. Mater. Des. 2003, 24, 315–324. [Google Scholar] [CrossRef]
- Gaitonda, V.N.; Karnik, R.S.; Davim, J.P. Minimum Quantity Lubrication in Machining. In Sustainable Manufacturing; Davim, J.P., Ed.; Wiley-ISTE: Hoboken, NJ, USA, 2010. [Google Scholar]
- Bastas, A. Sustainable Manufacturing Technologies: A Systematic Review of Latest Trends and Themes. Sustainability 2021, 13, 4271. [Google Scholar] [CrossRef]
- Binali, R.; Patange, A.D.; Kuntoğlu, M.; Mikolajczyk, T.; Salur, E. Energy Saving by Parametric Optimization and Advanced Lubri-Cooling Techniques in the Machining of Composites and Superalloys: A Systematic Review. Energies 2022, 15, 8313. [Google Scholar] [CrossRef]
- Xu, J.; Li, L.; Geier, N.; Davim, J.P.; Chen, M. Experimental study of drilling behaviors and damage issues for woven GFRP composites using special drills. J. Mater. Res. Technol. 2022, 21, 1256–1273. [Google Scholar] [CrossRef]
- Montgomery, D.C. Design and Analysis of Experiments, 8th ed.; Wiley: Hoboken, NJ, USA, 2013. [Google Scholar]
- Tahboub, K.K.; Rawabdeh, I.A. A design of experiments approach for optimizing an extrusion blow molding process. J. Qual. Maint. Eng. 2004, 10, 47–54. [Google Scholar] [CrossRef]
- Khashaba, U.A.; Abd-Elwahed, M.S.; Ahmed, K.I.; Najjar, I.; Melaibari, A.; Eltaher, M.A. Analysis of the machinability of GFRE composites in drilling processes. Steel Compos. Struct. 2020, 36, 417–426. [Google Scholar] [CrossRef]
- El-Midany, T.T.; El-Baz, M.A.; Abdelwahed, M.S. Improve Characteristics of Manufactured Products Using Artificial Neural Network Performance Prediction Model. Int. J. Recent Adv. Mech. Eng. (IJMECH) 2013, 2, 23–34. [Google Scholar]
- Cathie Lee, W.P.; Mah, S.-K.; Leo, C.P.; Wu, T.Y.; Chai, S.-P. Phosphorus removal by NF90 membrane: Optimisation using central composite design. J. Taiwan Inst. Chem. Eng. 2014, 45, 1260–1269. [Google Scholar] [CrossRef]
- Alaoui, A.; El Kacemi, K.; El Ass, K.; Kitane, S. Application of Box-Behnken design to determine the optimal conditions of reductive leaching of MnO2 from manganese mine tailings. Russ. J. Non-Ferr. Met. 2015, 56, 134–141. [Google Scholar] [CrossRef]
- Abdelhaffez, G.S.; Abd-Elwahed, M.S.; Hefni, M. Controlling Grinding Process Parameters Using Central Composite Design to Reduce Slimes in Phosphate Ore Beneficiation. Rud.-Geol.-Naft. Zb. 2022, 37, 139–148. [Google Scholar] [CrossRef]
- Abd-Elwahed, M.S. Drilling Process of GFRP Composites: Modeling and Optimization Using Hybrid ANN. Sustainability 2022, 14, 6599. [Google Scholar] [CrossRef]
- Quadros, J.D.; Hanumanthraya; Suhas; Vaishak, N.L.; Balakrishna, S.S.; Davangeri, M.B. Analysis of Variance (ANOVA) and Response Surface Analysis of Thrust Force and Torque in Drilling Granite Fiber Reinforced Epoxy Composites by Using Multi Facet HSS Twist Drill. Procedia Mater. Sci. 2014, 5, 1660–1669. [Google Scholar] [CrossRef]
- Rajamurugan, T.V.; Shanmugam, K.; Rajakumar, S.; Palanikumar, K. Modelling and Analysis of Thrust Force in Drilling of GFRP Composites Using Response Surface Methodology (RSM). Procedia Eng. 2012, 38, 3757–3768. [Google Scholar] [CrossRef]
- Kilickap, E. Analysis and modeling of delamination factor in drilling glass fiber reinforced plastic using response surface methodology. J. Compos. Mater. 2010, 45, 727–736. [Google Scholar] [CrossRef]
- Haggerty, R.; Sun, J.; Yu, H.; Li, Y. Application of machine learning in groundwater quality modeling—A comprehensive review. Water Res. 2023, 233, 119745. [Google Scholar] [CrossRef]
- Debauche, O.; Mahmoudi, S.; Manneback, P.; Lebeau, F. Cloud and distributed architectures for data management in agriculture 4.0: Review and future trends. J. King Saud Univ.-Comput. Inf. Sci. 2022, 34, 7494–7514. [Google Scholar] [CrossRef]
- Shaban, M.; Alateyah, A.I.; Alsharekh, M.F.; Alawad, M.O.; BaQais, A.; Kamel, M.; Alsunaydih, F.N.; El-Garaihy, W.H.; Salem, H.G. Influence of ECAP Parameters on the Structural, Electrochemical and Mechanical Behavior of ZK30: A Combination of Experimental and Machine Learning Approaches. J. Manuf. Mater. Process. 2023, 7, 6279. [Google Scholar] [CrossRef]
- Outeiro, J.; Cheng, W.; Chinesta, F.; Ammar, A. Modelling and Optimization of Machining of Ti-6Al-4V Titanium Alloy Using Machine Learning and Design of Experiments Methods. J. Manuf. Mater. Process. 2022, 6, 58. [Google Scholar] [CrossRef]
- Sarıkaya, M.; Gupta, M.K.; Tomaz, I.; Krolczyk, G.M.; Khanna, N.; Karabulut, Ş.; Prakash, C.; Buddhi, D. Resource savings by sustainability assessment and energy modelling methods in mechanical machining process: A critical review. J. Clean. Prod. 2022, 370, 133403. [Google Scholar] [CrossRef]
- Khan, A.M.; Alkahtani, M.; Sharma, S.; Jamil, M.; Iqbal, A.; He, N. Sustainability-based holistic assessment and determination of optimal resource consumption for energy-efficient machining of hardened steel. J. Clean. Prod. 2021, 319, 128674. [Google Scholar] [CrossRef]
- Preez, A.d.; Oosthuizen, G.A. Machine learning in cutting processes as enabler for smart sustainable manufacturing. In Proceedings of the 16th Global Conference on Sustainable Manufacturing-Sustainable Manufacturing for Global Circular Economy, Lexington, KY, USA, 2–4 October 2018; pp. 810–817. [Google Scholar]
- Olanipekun, A.T.; Mashinini, P.M.; Owojaiye, O.A.; Maledi, N.B. Applying a Neural Network-Based Machine Learning to Laser-Welded Spark Plasma Sintered Steel: Predicting Vickers Micro-Hardness. J. Manuf. Mater. Process. 2022, 6, 91. [Google Scholar] [CrossRef]
- Flores, V.; Keith, B.; Leiva, C. Using Artificial Intelligence Techniques to Improve the Prediction of Copper Recovery by Leaching. J. Sens. 2020, 2020, 2454875. [Google Scholar] [CrossRef]
- Abdelwahed, M.S.; El-Baz, M.A.; El-Midany, T.T. A Proposed Performance Prediction Approach for Manufacturing Processes using ANNs. Int. J. Ind. Manuf. Eng. 2012, 6, 260–265. [Google Scholar] [CrossRef]
- Lalwani, V.; Sharma, P.; Pruncu, C.I.; Unune, D.R. Response Surface Methodology and Artificial Neural Network-Based Models for Predicting Performance of Wire Electrical Discharge Machining of Inconel 718 Alloy. J. Manuf. Mater. Process. 2020, 4, 44. [Google Scholar] [CrossRef]
- Tabet, Z.; Belaadi, A.; Boumaaza, M.; Bourchak, M. Drilling of a bidirectional jute fibre and cork-reinforced polymer biosandwich structure: ANN and RSM approaches for modelling and optimization. Int. J. Adv. Manuf. Technol. 2021, 117, 3819–3839. [Google Scholar] [CrossRef]
- Adda, B.; Belaadi, A.; Boumaaza, M.; Bourchak, M. Experimental investigation and optimization of delamination factors in the drilling of jute fiber–reinforced polymer biocomposites with multiple estimators. Int. J. Adv. Manuf. Technol. 2021, 116, 2885–2907. [Google Scholar] [CrossRef]
- Anarghya, A.; Harshith, D.N.; Rao, N.; Nayak, N.S.; Gurumurthy, B.M.; Abhishek, V.N.; Patil, I.G.S. Thrust and torque force analysis in the drilling of aramid fibre-reinforced composite laminates using RSM and MLPNN-GA. Heliyon 2018, 4, e00703. [Google Scholar] [CrossRef]
- Erturk, A.T.; Vatansever, F.; Yarar, E.; Guven, E.A.; Sinmazcelik, T. Effects of cutting temperature and process optimization in drilling of GFRP composites. J. Compos. Mater. 2020, 55. [Google Scholar] [CrossRef]
- Bayraktar, Ş.; Turgut, Y. Determination of delamination in drilling of carbon fiber reinforced carbon matrix composites/Al 6013-T651 stacks. Measurement 2020, 154, 107493. [Google Scholar] [CrossRef]
- Solati, A.; Hamedi, M.; Safarabadi, M. Comprehensive investigation of surface quality and mechanical properties in CO2 laser drilling of GFRP composites. Int. J. Adv. Manuf. Technol. 2019, 102, 791–808. [Google Scholar] [CrossRef]
- Rajaraman, G.; Agasti, S.K.; Jenarthanan, M.P. Investigation on effect of process parameters on delamination during drilling of kenaf-banana fiber reinforced in epoxy hybrid composite using Taguchi method. Polym. Compos. 2019, 41, 994–1002. [Google Scholar] [CrossRef]
- Kharwar, P.; Verma, R. Grey embedded in artificial neural network (ANN) based on hybrid optimization approach in machining of GFRP epoxy composites. FME Trans. 2019, 47, 641–648. [Google Scholar] [CrossRef]
- Wang, H.; Zhang, X.; Duan, Y. Effects of drilling area temperature on drilling of carbon fiber reinforced polymer composites due to temperature-dependent properties. Int. J. Adv. Manuf. Technol. 2018, 96, 2943–2951. [Google Scholar] [CrossRef]
- Abdelaoui, F.Z.E.; Jabri, A.; Barkany, A.E. Optimization techniques for energy efficiency in machining processes-a review. Int. J. Adv. Manuf. Technol. 2023, 125, 2967–3001. [Google Scholar] [CrossRef]
- Cerda-Flores, S.C.; Rojas-Punzo, A.A.; Nápoles-Rivera, F. Applications of Multi-Objective Optimization to Industrial Processes: A Literature Review. Processes 2022, 10, 133. [Google Scholar] [CrossRef]
- He, W.; Bagherzadeh, S.A.; Shahrajabian, H.; Karimipour, A.; Jadidi, H.; Bach, Q.-V. Controlled elitist multi-objective genetic algorithm joined with neural network to study the effects of nano-clay percentage on cell size and polymer foams density of PVC/clay nanocomposites. J. Therm. Anal. Calorim. 2019, 139, 2801–2810. [Google Scholar] [CrossRef]
- Koochaki, A.; Shahgholi, M.; Sajadi, S.M.; Babadi, E.; Inc, M. Investigation of the mechanical stability of polyethylene glycol hydrogel reinforced with cellulose nanofibrils for wound healing: Molecular dynamics simulation. Eng. Anal. Bound. Elem. 2023, 151, 1–7. [Google Scholar] [CrossRef]
- Kumar, R.; Jesudoss Hynes, N.R.; Pruncu, C.I.; Jennifa Sujana, J.A. Multi-objective optimization of green technology thermal drilling process using grey-fuzzy logic method. J. Clean. Prod. 2019, 236, 117711. [Google Scholar] [CrossRef]
- Khashaba, U.A.; Abd-Elwahed, M.S.; Eltaher, M.A.; Najjar, I.; Melaibari, A.; Ahmed, K.I. Thermo-Mechanical and Delamination Properties in Drilling GFRP Composites by Various Drill Angles. Polymers 2021, 13, 1884. [Google Scholar] [CrossRef]
- Szwajka, K.; Trzepieciński, T. Effect of tool material on tool wear and delamination during machining of particleboard. J. Wood Sci. 2016, 62, 305–315. [Google Scholar] [CrossRef]
- Khashaba, U.A.; El-Sonbaty, I.A.; Selmy, A.I.; Megahed, A.A. Machinability analysis in drilling woven GFR/epoxy composites: Part I–Effect of machining parameters. Compos. Part A Appl. Sci. Manuf. 2010, 41, 391–400. [Google Scholar] [CrossRef]
- Shyha, I.S.; Aspinwall, D.K.; Soo, S.L.; Bradley, S. Drill geometry and operating effects when cutting small diameter holes in CFRP. Int. J. Mach. Tools Manuf. 2009, 49, 1008–1014. [Google Scholar] [CrossRef]
- Haykin, S. Neural Networks and Learning Machines, 3rd ed.; Pearson Education Inc.: Upper Saddle River, NJ, USA, 2009. [Google Scholar]
- Cater, J.P. Successfully using of peak learning rates of 10 (and greater) in back-propagation networks with the heuristic learning algorithm. In Proceedings of the IEEE First International Conference on Neural Networks, San Diego, CA, USA, 21–24 June 1987; pp. 645–651. [Google Scholar]
- Shi, Y.; Eberhart, R. A modified particle swarm optimizer. In Proceedings of the 1998 IEEE International Conference on Evolutionary Computation Proceedings. IEEE World Congress on Computational Intelligence (Cat. No. 98TH8360), Anchorage, AK, USA, 4–9 May 1998; pp. 69–73. [Google Scholar]
- Kennedy, J.; Eberhart, R. Particle swarm optimization. In Proceedings of the ICNN′95-International Conference on Neural Networks, Perth, WA, Australia, 27 November–1 December 1995; Volume 944, pp. 1942–1948. [Google Scholar]
- Mudhukrishnan, M.; Hariharan, P.; Palanikumar, K.; Latha, B. Optimization and sensitivity analysis of drilling parameters for sustainable machining of carbon fiber–reinforced polypropylene composites. J. Thermoplast. Compos. Mater. 2018, 32, 1485–1508. [Google Scholar] [CrossRef]
- Khan, A.M.; Jamil, M.; Mia, M.; He, N.; Zhao, W.; Gong, L. Sustainability-based performance evaluation of hybrid nanofluid assisted machining. J. Clean. Prod. 2020, 257, 120541. [Google Scholar] [CrossRef]
- Belaadi, A.; Laouici, H.; Bourchak, M. Mechanical and drilling performance of short jute fibre-reinforced polymer biocomposites: Statistical approach. Int. J. Adv. Manuf. Technol. 2019, 106, 1989–2006. [Google Scholar] [CrossRef]


Disclaimer/Publisher’s Note: The statements, opinions and data contained in all publications are solely those of the individual author(s) and contributor(s) and not of MDPI and/or the editor(s). MDPI and/or the editor(s) disclaim responsibility for any injury to people or property resulting from any ideas, methods, instructions or products referred to in the content. |
© 2023 by the author. Licensee MDPI, Basel, Switzerland. This article is an open access article distributed under the terms and conditions of the Creative Commons Attribution (CC BY) license (https://creativecommons.org/licenses/by/4.0/).