Article

Design of Radial Flow Channel Proton Exchange Membrane Fuel Cell Based on Topology Optimization

1
School of Mechanical Engineering, Shandong Jianzhu University, Jinan 250101, China
2
Qingdao Automotive Research Institute, Jilin University, Qingdao 266101, China
3
School of Mechanical Engineering, Tianjin University, Tianjin 300350, China
*
Author to whom correspondence should be addressed.
Processes 2023, 11(8), 2482; https://doi.org/10.3390/pr11082482
Submission received: 23 July 2023 / Revised: 14 August 2023 / Accepted: 15 August 2023 / Published: 18 August 2023

Abstract

:
In this paper, the flow channel of the radial proton exchange membrane fuel cell (PEMFC) is optimized by the topological optimization method. Using the SNOPT algorithm, a two-dimensional stable constant temperature model is freely constructed in the cyclic sector design domain. Topology optimization aims to maximize the efficiency of PEMFC and minimize the energy dissipation of reaction gas. We analyze radial topology flow channels’ mass transfer capacity and cell performance with different maximum volume constraints. The results show that under high current density, the performance of the optimized channel is significantly better than that of the traditional channel. Increasing the maximum volume constraint is beneficial for improving the mass transfer of PEMFC. At 0.6 V, the cell performance of Scheme 4 is 14.9% higher than the serpentine flow channel and 9.5% higher than the parallel flow channel. In addition, in the optimal selection, 3D simulation modeling is carried out for more accurate verification.

1. Introduction

Proton exchange membrane fuel cell (PEMFC) characteristics, such as low pollution, high efficiency, and no noise, are favored by researchers worldwide [1,2]. The electrode plate is the supporting structure of PEMFC, and the flow channel of reaction gas and its surface flow channel design will directly affect the cell output performance of PEMFC [3]. Therefore, this article uses topology optimization methods to design the radial flow channel structure of PEMFC based on different maximum volume constraints.
Topology optimization (TOM) uses finite element analysis to achieve the optimal distribution of materials based on set constraints. TOM is widely used in various fields, such as machinery and aviation [4]. Golecki et al. [5] developed a new method for filtering white noise for random moving traffic loads. This can optimize bridge topology by directly minimizing response extremum to cope with random traffic loads. Pedro et al. [6] used TOM to design an aviation wing that maintained lift while reducing mass and proposed a modeling method to accelerate optimization convergence to discrete topology, saving the calculation cost. Wang et al. [7] used TOM in a porous medium, using local material density as the optimization unit, improving the calculation efficiency. To improve the passive aerodynamic shape self-adaptability of highly compliant wings at multiple operating points, Pedro et al. [8] proposed a density-based TOM strategy, which addresses some of the drawbacks of non-stiffness-based design and designs a high-speed compatible airfoil with high compliance. Polini [9] proposed a TOM optimization method for wind farm layout, highlighting the ability to find the optimal wind farm layout with smaller computational resources and time.
The literature indicates that the topology layer structure of fuel cells can effectively enhance the overall performance of PEMFC. Li et al. [10] used TOM in the microstructure of solid oxide fuel cells (SOFCs) cathodes, taking the minimum thermal mismatch as the target, obtaining two orthogonal microstructures, and obtaining a cathode structure with periodic fiber bundles, which have higher effective ionic conductivity than the typical cathode structure. At different temperatures, the thermal expansion coefficient of the microstructure is almost equal to the electrolyte layer’s thermal expansion coefficient, eliminating the thermal mismatch. Yang et al. [11] applied TOM to the end plate of PEMFC to reduce weight and improve the uniform pressure distribution on the gas diffusion layer (GDL). After simulation and experimental verification, it was found that TOM controlled the standard deviation of pressure at 83.4% when 86% of the material was used. Wang et al. [12] proposed a 3D thermal fluid-structure topology optimization method to improve the cooling performance of the coolant channel in PEMFC. The effects of volume fraction, power dissipation, structural displacement, and inlet velocity on topology optimization performance were studied through simulation analysis. Compared to traditional straight channels, the initial topology-optimized multi-channel achieves a maximum temperature reduction of 1.92 K and improved cooling performance by 15.22%. Reza et al. [13] designed an average depth model and applied TOM to 2D models, verifying that TOM can effectively improve the performance of PEMFC. However, there still needs to be more research on the topology optimization of flow channel structures, and the objective function is limited to studying cell efficiency, lacking research on energy dissipation of reaction gas. At the same time, the maximum volume constraint directly affects the structural distribution of the flow channel, but there is relatively little research on it.
Currently, the more commonly used flow channel structures include parallel flow channels, serpentine flow channels, and spiral flow channels. These flow channels are simple and easy to process, but there is still much room for improvement in reactant distribution uniformity, flow pressure drop, and drainage performance. Liu et al. [14] designed a spiral flow field for HT-PEMFCs, which utilizes the pressure difference between two adjacent channels to improve cell performance. Comparative verification shows that the best performance is achieved under a spiral flow field with a channel depth of 1.0 mm. Lu et al. [15] used Fluent to study and compare the mass transfer ability and cell performance of radial and parallel flow fields in different gradient channels. They obtained the oxygen concentration distribution, pressure drop, and temperature under different radial lengths. They studied the effects of gradient channels, gas supply methods, and radial lengths on cell performance. The results indicate that radial flow fields can provide more uniform oxygen distribution and lower pressure drop compared to parallel flow fields. Xie et al. [16] designed a new radial bionic flow channel for the spider web structure and obtained the optimal number of each rib and hole through comparative analysis.
This study simplifies the average depth model to a two-dimensional PEMFC model and uses TOM to design a radial channel model. The purpose of TOM is to maximize cell power consumption and reduce gas energy dissipation. We obtained topology optimization models with different maximum volume constraints and analyzed their mass transfer ability and cell efficiency. We compared and verified the simulation results of the 2D and 3D models to obtain a more accurate channel structure.

2. Materials and Methods

We studied the cathodic region where PEMFC undergoes reduction reactions and set other influencing factors as boundary conditions and feature settings. For ease of calculation, a two-dimensional model of PEMFC is constructed using the average depth model. COMSOL Multiphysics® (COMSOL, Burlington, MA, USA) [17] executes finite element and TOM simulation models and designs flow channel fuel cells. It returns a group of large equations in one iteration, solves all unknowns, and merges the multi-physical coupling between them. The convergence of the solution of the nonlinear equation is approximated iteratively by the solver. The topology of the flow channel in a circular PEM fuel cell was optimized using the optimization solver. The optimization iteration will stop when the number of iterations reaches the maximum number indicated in the fully coupled attribute node.

2.1. Model Assumptions

Assuming the PEMFC cathode GDL and channel model:
  • Research environment in steady-state, constant temperature, and laminar flow states;
  • Oxygen is a compressible gas at the inlet;
  • The single-phase weighted mixture model is adopted. Simplify water management issues due to the smaller height of each layer [18];
  • Porous medium is isotropic and has uniform porosity;
  • The membrane does not allow the permeation of reactive gases;
  • If the influence of water is added, the convergence of topology optimization will be more complex, and the computational complexity will also be more significant. For simplicity, we neglect the water transport through the membrane;
  • It is assumed that the reactant gas behaves as an ideal gas.

2.2. Simplified Model of Average Depth Model

This study uses 2D models with the depth averaging program to properly represent 3D models based on the same transmission conditions. Figure 1 shows the fuel cell layer considered in the depth averaging process to reduce the 3D model to 2D. According to the material characteristics of each layer of PEMFC, the equivalent porosity ( ϵ ), permeability ( κ ), and diffusion coefficient (D) of the porous channel (ch) or porous rib (rib) can be calculated as follows:
P a ¯ = P g d l H g d l + P a H a H c p ,   P = ϵ , κ , D ,   a = c h , r i b ,   H c p = H g d l + H c h ,   H g d l = H c h
where, H represents the height of the electrode plate and GDL, P ¯ represents average property.

2.2.1. Conservation of Mass and Momentum

The Brinkman equation used for the conservation of mass and momentum is as follows:
ρ v = 0
1 ϵ ( γ ) 2 ρ v v = p + 1 ϵ γ μ 2 v 12 μ H c p 2 v μ κ ( γ ) v
where, ρ represents the gas density, v represents the velocity vector, v represents the dynamic viscosity, and p represents the relative pressure. 12 μ H c p 2 v represents the normal velocity gradient of the 2D plane [19]. μ κ ( γ ) v represents the Darcy velocity of viscous resistance of fluid in porous medium. The Brinkman constant α ( γ ) is calculated as follows [20]:
α γ = μ κ ( γ )

2.2.2. Conservation of Species

The equation is calculated as follows:
H c p ρ v ω s = H c p j s γ + R s
ω s represents the mass fraction, s = { N 2 , O 2 , H 2 O } . j s γ represents the species diffusion mass flux, calculated as follows:
j s γ = D ( γ ) ( ρ D s m ω s + ρ D s m ω s M M )
Under isothermal and isobaric conditions, the Maxwell–Stefan equation [21] can calculate D s m in the Equation (6):
D s m = 1 ω s j s n s ω j D s j
where n s represents the number of species, D s j can be defined by reference values of binary diffusivities [22]:
D s j = D s j r e f ( P r e f p ) ( T T r e f ) 1.75
D s j r e f , P r e f and T r e f are provided in Table 1.
M is the average molar mass, calculated as follows:
1 M = s = 1 n s ω s M s
R s represents the consumption or manufacturing of species in Equation (5) [13]:
R s = ν s M s i l o c F n e
where, ν s represents the number of electrons, M s represents the molar mass of the species,   F represents the Faraday constant, and n e represents the stoichiometric coefficient of the reaction.

2.2.3. Reaction Kinetics

The PEMFC cathodic reduction reaction is as follows:
O 2 + 4 H + + 4 e 2 H 2 O
Due to the reduction reaction occurring in the catalytic layer of the PEMFC cathode, it is considered a boundary condition at the cathode boundary. R s serves as the boundary condition for electrochemical reactions. i l o c calculates the local current density based on the Butler–Volmer equation [13]:
i l o c B V = i 0 C O 2 C O 2 r e f ( exp α c T R g η c F exp α c 1 T R g η c F )
η c represents the cathode overpotential as follows:
η c = V o c V c e l l i l o c R l u m p
where, the lumped resistance R l u m p describes the voltage loss caused by charge transfer of the remaining parts of PEMFC. It is noteworthy that i l o c = i l o c B V . Equations (12) and (13) are highly nonlinear. The current density is solved using the additional differential equation solving as follows:
i l o c i = i l o c i l o c B V
Among them, i l o c is solved by the ODE interface in COMSOL.

2.3. Topological Optimization

We adopt gradient-based TOM methods to obtain the optimal flow channel design in the circulation zone. Sparse nonlinear optimization (SNOPT) is a gradient-based algorithm for TOM problems with nonlinear dependent design variables. The SNOPT solver terminates when the relative variation in all design variables is less than the selected optimality tolerance value or when the maximum number of iterations is reached [23]. The parameters associated with the algorithm are listed in Table 2. The result of TOM is the material output factor between 0 and 1, where 0 and 1 are specified as solid (porous rib) and fluid (porous channel), respectively.

2.3.1. Material Modeling and Regularization

This study uses density-based methods as well-known material models and uses specific types of methods for each design-related characteristic. Indicator γ represents a continuous design variable field used to interpolate ϵ ( γ ) ,   α ( γ ) and D ( γ ) .   γ [ 0 , 1 ] indicates solid {0}, fluid {1}, or fluid-structure interaction state (0, 1). The fluid-structure interaction state means that the average properties can vary continuously from the porous rib ( P r i b ) to the porous channel ( P c h ).
First, the porosity calculated by linear interpolation is as follows [13]:
ϵ γ = ϵ r i b + ( ϵ c h ϵ r i b ) γ
ϵ c h and ϵ r i b represent the porosity of porous ribs and channels providied by Table 1.
Then, the convex interpolation function [24] calculate the constant Brinkman α ( γ ) as follows:
α γ = α r i b + ( α c h α r i b ) 1 γ 1 + q γ
q represents an adjustable convexity factor, which is related to the reverse permeability of the interpolation function. The Brinkman constants α c h and α r i b are calculated by Equations (1) and (4).
Last, the solid isotropic material penalty (SIMP) method interpolates the diffusion coefficient factor D ( γ ) as follows:
D γ = D r i b + ( D c h D r i b ) γ p
where, p represents the penalty coefficient of SIMP. The diffusion coefficient factor D c h and D r i b providied by Table 1.
In addition, TOM problems that encounter board and grid dependencies can be solved with regularization techniques. The Helmholtz filter [25] used in this study solves this problem:
γ f = r m i n 2 2 γ f + γ
where, γ f represents the filtered design variables. r m i n represents the filter radius applied to the length scale. r m i n must not be smaller than the grid element. Filters can help solve TOM problems, but leave a significant area of non-material rationality in the design field. In order to eliminate gray areas containing non-physical intermediate values, the hyperbolic tangent projection technique is introduced as follows [26]:
γ h = tanh β θ β + tanh β ( γ f θ β ) tanh β θ β + tanh β ( 1 θ β )
γ h represents the projection design variable, θ β represents the projection point, and β represents the projection slope. A higher projection slope reduces the area of the intermediate state to a greater extent, but the convergence of the optimizer is more difficult. During optimization iteration, the continuation of β can help approximate the near-discrete solution slowly. The four values of β are defined as follows:
β = 3,6 , 9,12
The initial variable is set by γ 0 = 0.5 and β = 3 . The initial design variables β of the solver are updated to the previous calculated solution in each calculation. The maximum number of iterations per calculation is 100, with a total of 400 iterations.

2.3.2. Objective Function and Constraints

The multi-objective formula for TOM is as follows:
Objective   function   min γ : Ω V c e l l i l o c d Ω + Γ ( 1 2 ρ v 2 + p ) v n d Γ
Objective   constraints   Ω Υ i d Ω Ω 1 d Ω V m a x , 0 Υ i 1 , i 1,2 , 3 , , N
Equation (21) is the objective function for TOM, with the aim of maximizing the power generated by PEMFC while minimizing the power dissipated by the reaction gas. V c e l l i l o c represents the generated power by PEMFC, V c e l l represents the PEMFC voltage, and Ω is the electrode surface of PEMFC. i l o c is the power dissipation by the reaction gas at the entrance and exit. p represents the pressure and v represents the velocity. Γ is the boundary of the inlet and outlet. The ideal gas law ρ = P r e f M T R g defines and calculates the density of reaction gas, M calculated by Equation (9) represents the average molar mass, T represents the PEMFC temperature, and R g represents the general gas constant.
Equation (22) limits the maximum material volume fraction V m a x of porous channels within the design domain. Υ i represents an independent design variable. N represents the number of design variables.

2.3.3. TOM Process

This study establishes a 2D structural model completed in the COMSOL interface, including geometric modeling, coupling of physical field, setting of boundary conditions, and mesh generation, and the finite element analysis is carried out by adjusting the program flow through MATLAB control statements. SNOPT will gradually optimize and screen the most suitable TOM structure based on parameter settings. The process is iterative and is described by the following steps:
(a)
Define conservation of mass and momentum (Brinkman equation);
(b)
Define the transport of species (O2, H2O, N2);
(c)
Define reaction kinetics (Butler–Volmer) and local current density;
(d)
Solve the state equations coupled (Steps a, b, c);
(e)
Calculate the sensitivities of objective functions and constraints (Adjoint Method);
(f)
Update the design variable value ( Υ ) with an optimization algorithm (SNOPT);
(g)
Verify the stopping criteria.

3. Results

We optimized the radial flow channel of PEMFC according to the set steps. Then, using the maximum volume constraint as the design variable, we obtain different topological structures. We use a 60° radial flow field as the design domain for the convenience of simulation calculations. Then we validated and analyzed the model’s mass transfer ability and cell performance under different maximum volume constraints. Finally, the topology with the best performance was selected to discuss the post-processing scheme, and the three-dimensional model of the unit was validated.

3.1. Model Validation

We have preliminarily verified the realized model by replicating the serpentine PEM fuel cell issued by Behroo et al. [13]. Using the average depth model, we simplified and compared three-dimensional and two-dimensional single-channel serpentine flow channels with the same assumptions. The inlet velocity is 0.5 ms−1. The reactant gas is O2, N2, and H2O. The boundary conditions are the pressure inlet, the suppression of reflux, and the outlet without pressure. Table 1 provides other parameters for validation. The study found that these results are consistent with the content of the references, indicating that the finite element analysis of the cathode part of 2D PEMFC is reliable and can be used to study radial flow channels, as shown in Figure 2.
In Figure 2a, the maximum velocity ratio of 2D–3D is 70%. However, the average-maximum velocity ratio of Poiseuille fluid is 66.7%. We consider the velocity of the 2D model as the average velocity of the 3D model. In Figure 2b,c, the two models’ proportions of minimum oxygen concentration and maximum water concentration are 89.4% and 89.3%, respectively. At the same time, the two models’ maximum oxygen concentration and minimum water concentration are similar. We find an error of approximately 10% between oxygen and water concentrations. Based on the above verification results, using this 2D model can approximate the results of the 3D PEMFC model. Therefore, we can use a 2D model for topology optimization calculations.

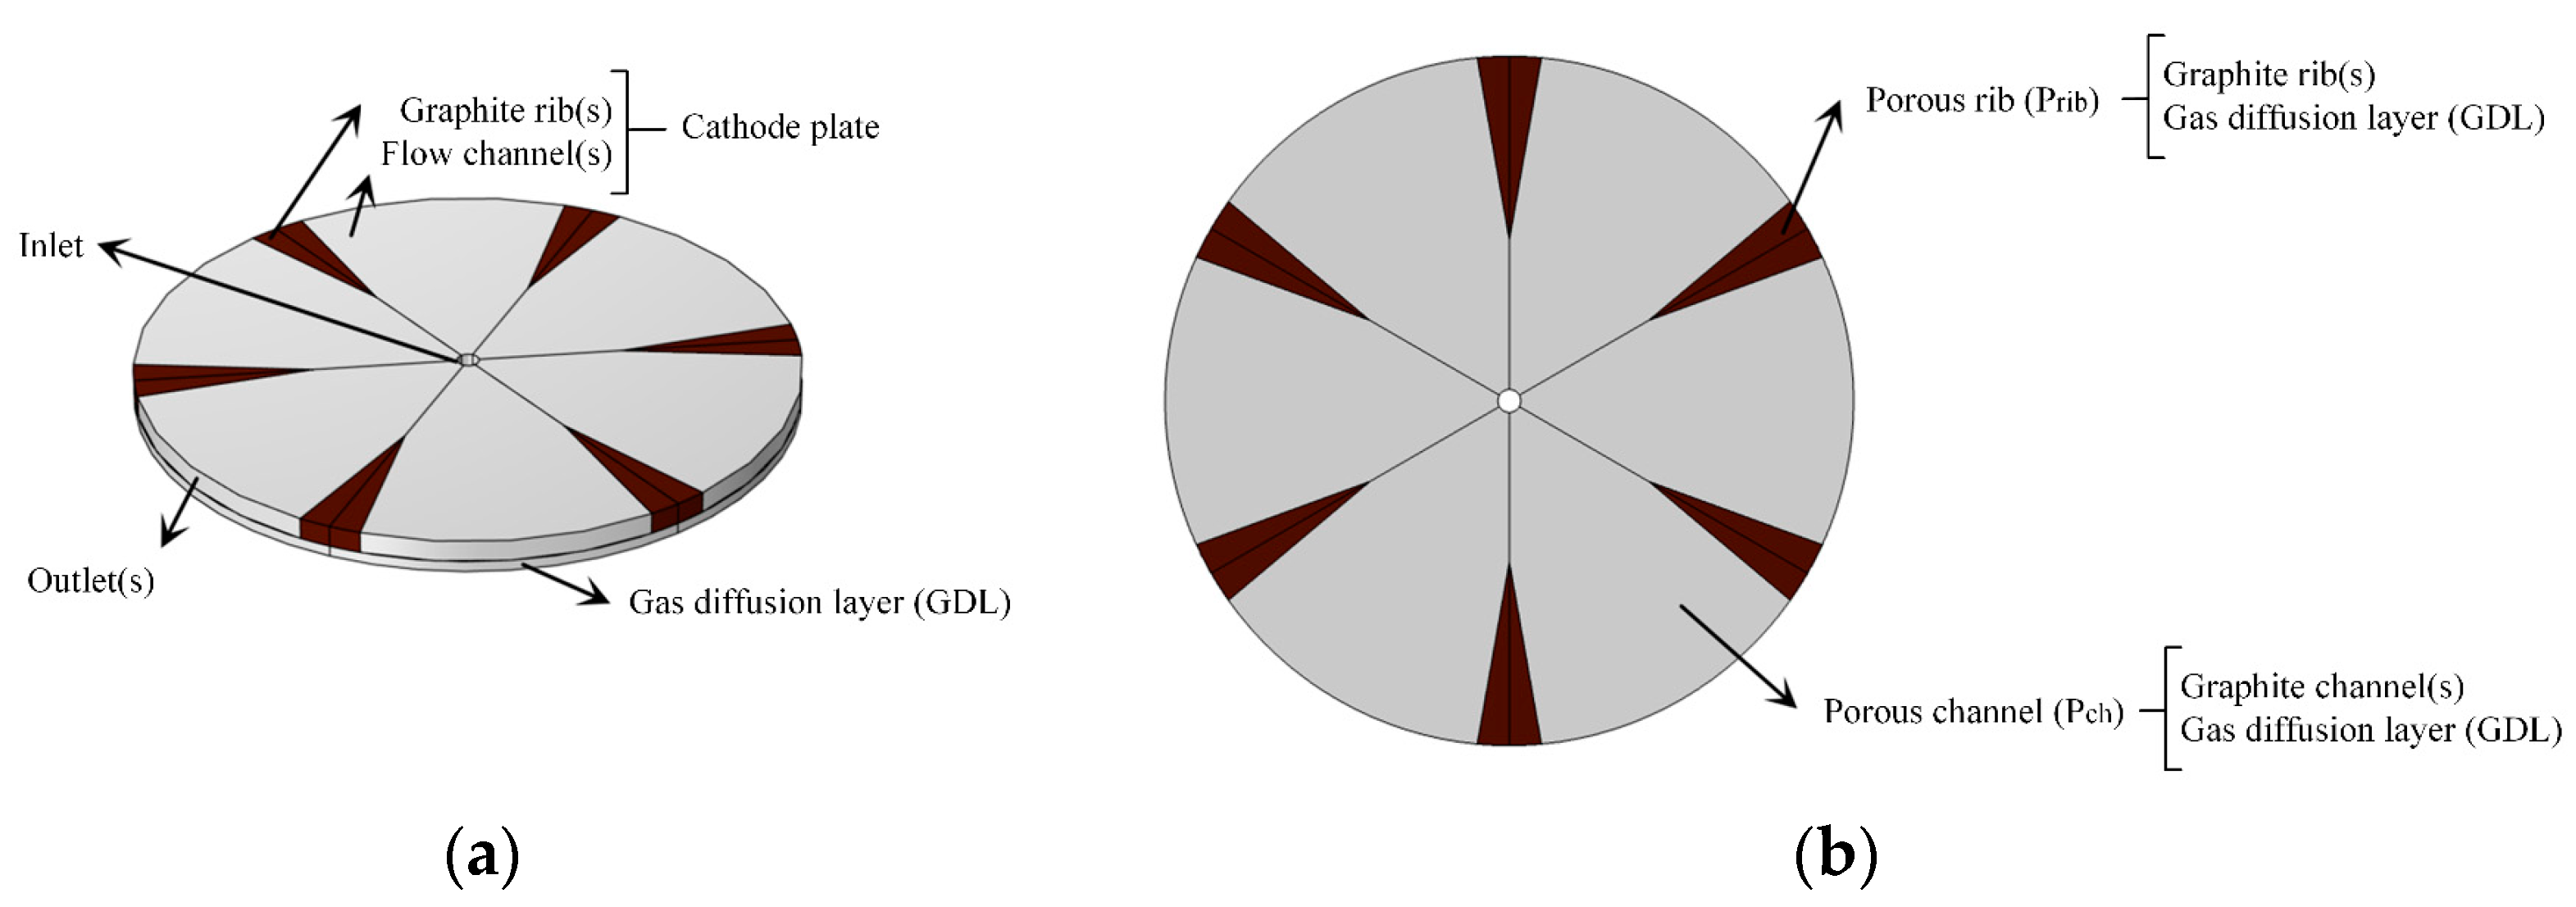
3.2. Design of Radial Flow Channel Model

This section shows the optimization of the flow channel of the fuel cell with circular geometry. To achieve a topology comparable to the traditional flow channel, the circular design domain has the same active area and function under the same conditions as the traditional square domain [13].
The pre-optimized radial flow channel also follows some parameters of the reference scheme. The inlet velocity and the mass fraction of O2, H2O, and N2 are provided in Table 1. The boundary has periodic conditions. The outlet considers a zero-stress condition and zero flux of the transported species.
The grid independence verification of this model is shown in Figure 3. Helmholtz filter helps COMSOL extract the grid information of the required element and filter the material volume factor by using the product of the minimum filter radius and the Laplace operator of the volume factor. So, the denser the grid, the smaller the minimum unit of the TOM structure filtered by the Helmholtz filter. Through the grid independence verification, the model adopts an extreme refinement hydrodynamic grid distribution with 20,751 unit structures.

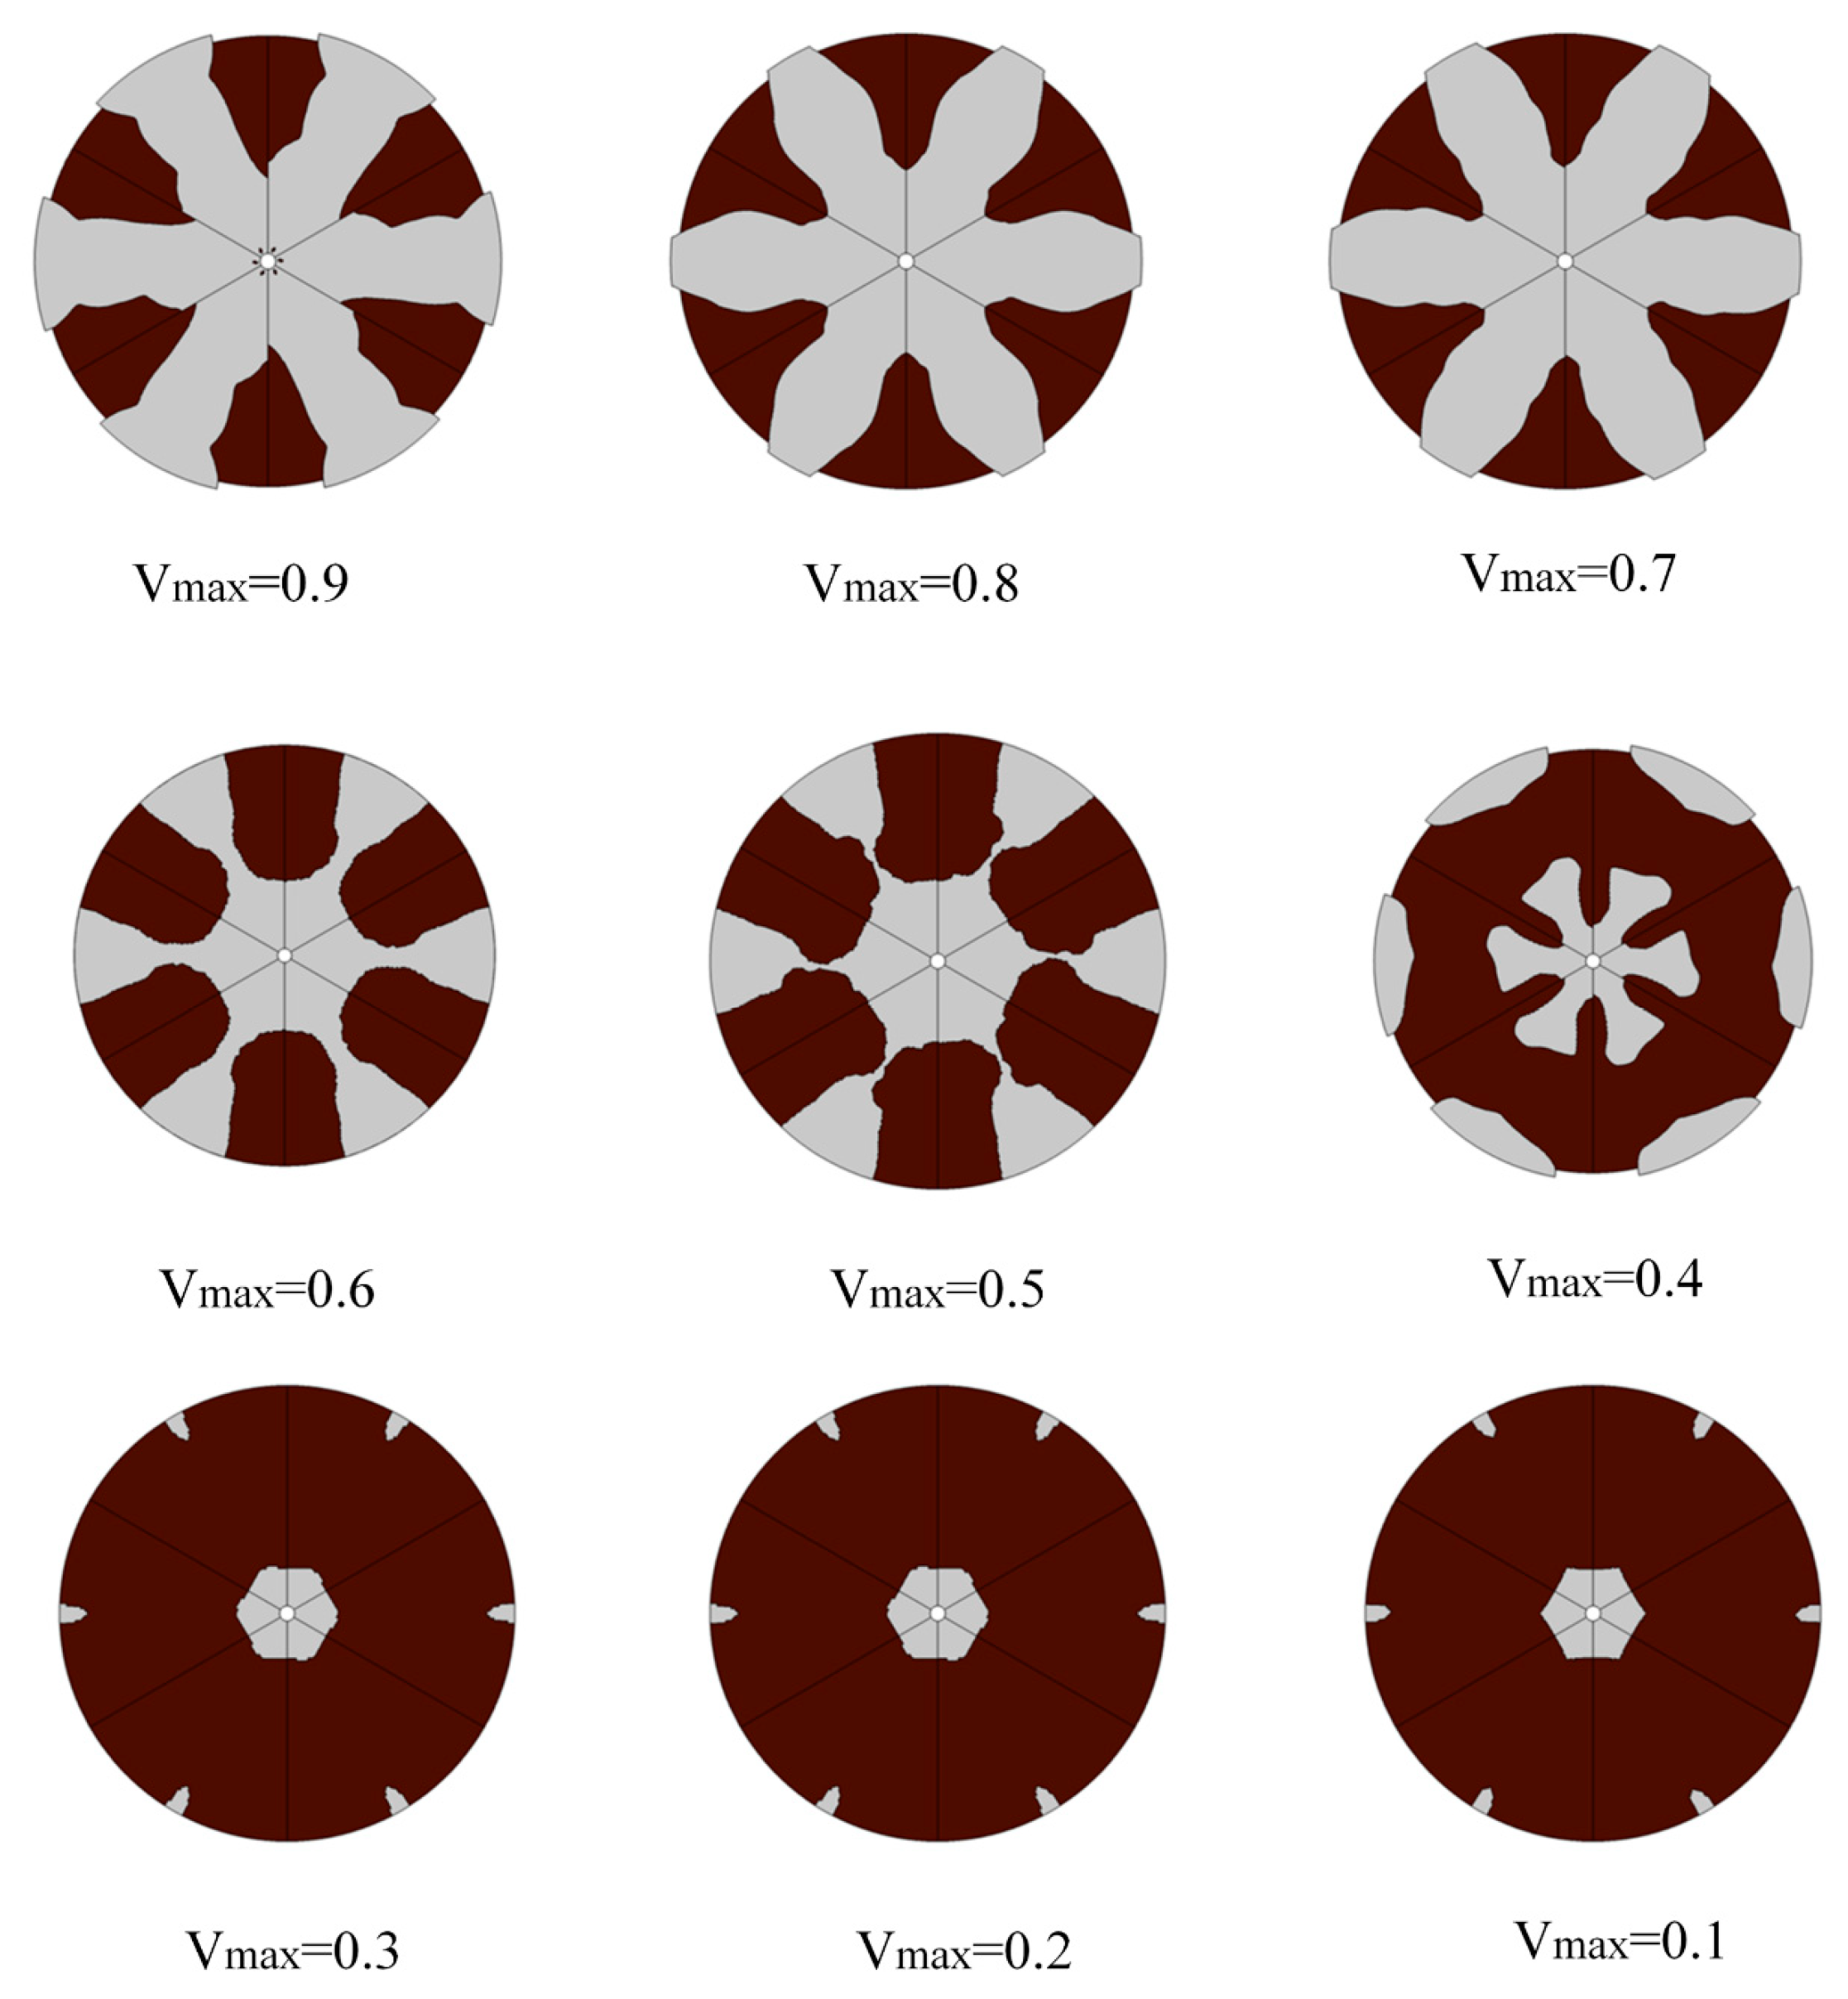
3.2.1. Model Optimization Analysis

We set the maximum volume constraints for TOM to ( V max = 0.1 ,   0.2 ,   0.3 ,   0.4 ,   0.5 ,   0.6 ,   0.7 ,   0.8 ,   0.9 ). Under different volume constraints, the TOM structure is also not identical. It is approximate under partial volume constraints but remarkably different under partial volume constraints, as shown in Figure 4.
As shown in Figure 4, when the maximum volume constraint is less than or equal to 0.4, the porous ribs cut off the inlet and outlet of the model, and the outlet is minimized as much as possible. The air inlet is approximately a regular hexagonal shape, with the corners directly opposite the air outlet. When the maximum constrained volume is equal to 0.4, the variation in the air outlet in optimization is relatively small, and the shape of the air inlet further develops based on the regular hexagon. It extends towards the direction of the air outlet. When the maximum volume constraint is greater than or equal to 0.5, the inlet and outlet of the entire model have been connected to form a channel. Reducing inlets is beneficial for reducing speed and energy loss. When the maximum constrained volume equals 0.4, 0.7, 0.8, and 0.9 due to the jagged structural boundary after TOM, the boundary will be discontinuous during the model construction process. Therefore, during model construction, we reduced the outer boundary of the perforated rib plate by 0.5 mm.
After comparing the complete TOM model, because some models are similar in shape, V max = 0.1 ,   0.4 ,   0.5 ,   0.8 ,   0.9 are screened as the research object, and their 2D PEMFC models are respectively simulated and analyzed, as shown in Figure 5.

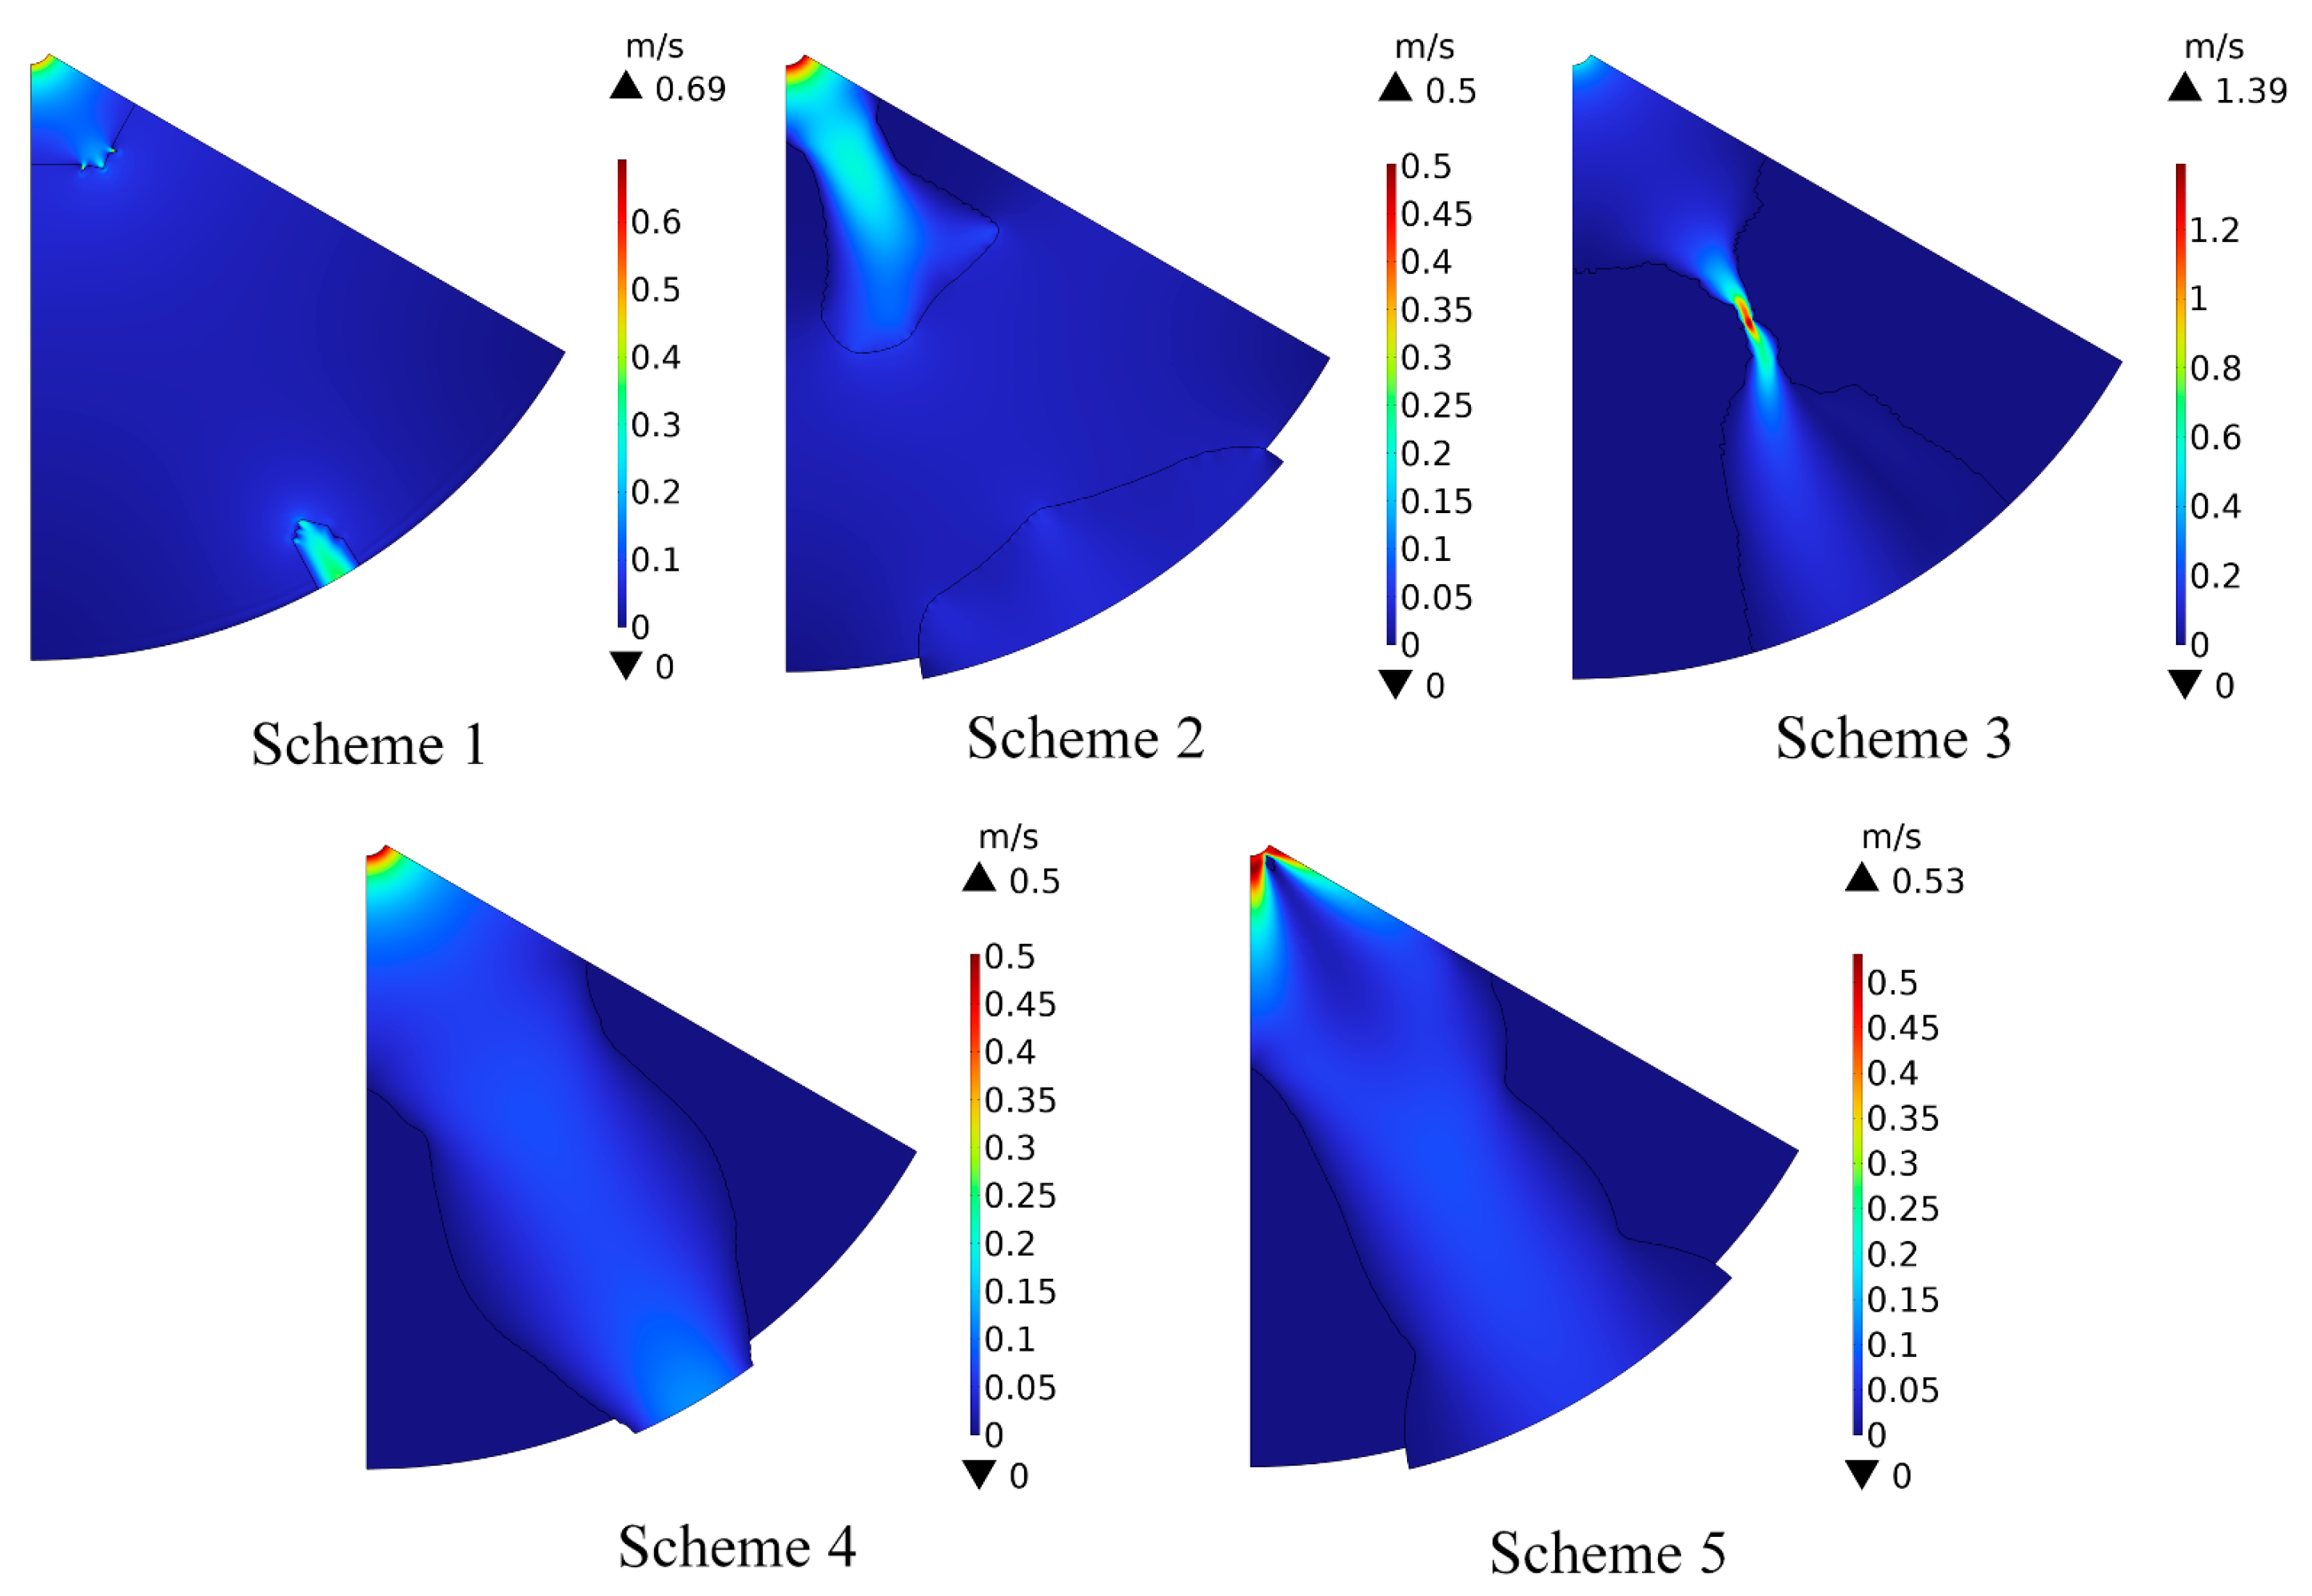
3.2.2. Velocity Field Analysis after TOM

It can be seen from Figure 6 that the velocity distribution of the model optimized by topology is uneven under different volume constraints. The velocity decreases in the expansion area of the flow channel and increases in the contraction area. Because under the TOM condition with multi-objective constraints, it is necessary to reduce the flow velocity at the outlet as much as possible. In Schemes 1 and 2, because only limited flow channel volume can be reserved, the perforated rib plate divides the entire flow channel, and the velocity loss is excellent at low permeability. When the volume of the flow passage can ensure the continuity of the whole flow passage, the flow rate will increase at the reduced part of the flow passage, even exceeding the initial flow rate. In Scheme 3, due to the narrow channel opening, the maximum flow rate can reach 1.37 m s−1. After passing through the reduced part of the flow passage, the gas will be discharged from the flow passage more evenly, and the minimum speed at the outlet is not less than 0.13 m s−1. The overall structure of Scheme 4 is complete, with a maximum speed of 0.5 m s−1 and a gradual decrease in the reaction gas velocity. The minimum outlet velocity is not less than 0.12 m s−1. The minimum outlet velocity is not less than 0.13 m s−1. In Scheme 5, there is a small block at the inlet, and the gas flows out of the whole model along the boundary of the block. Therefore, the airflow in Schemes 4 and 5 is the most uniform, as its channels are unobstructed and have no narrow spaces.

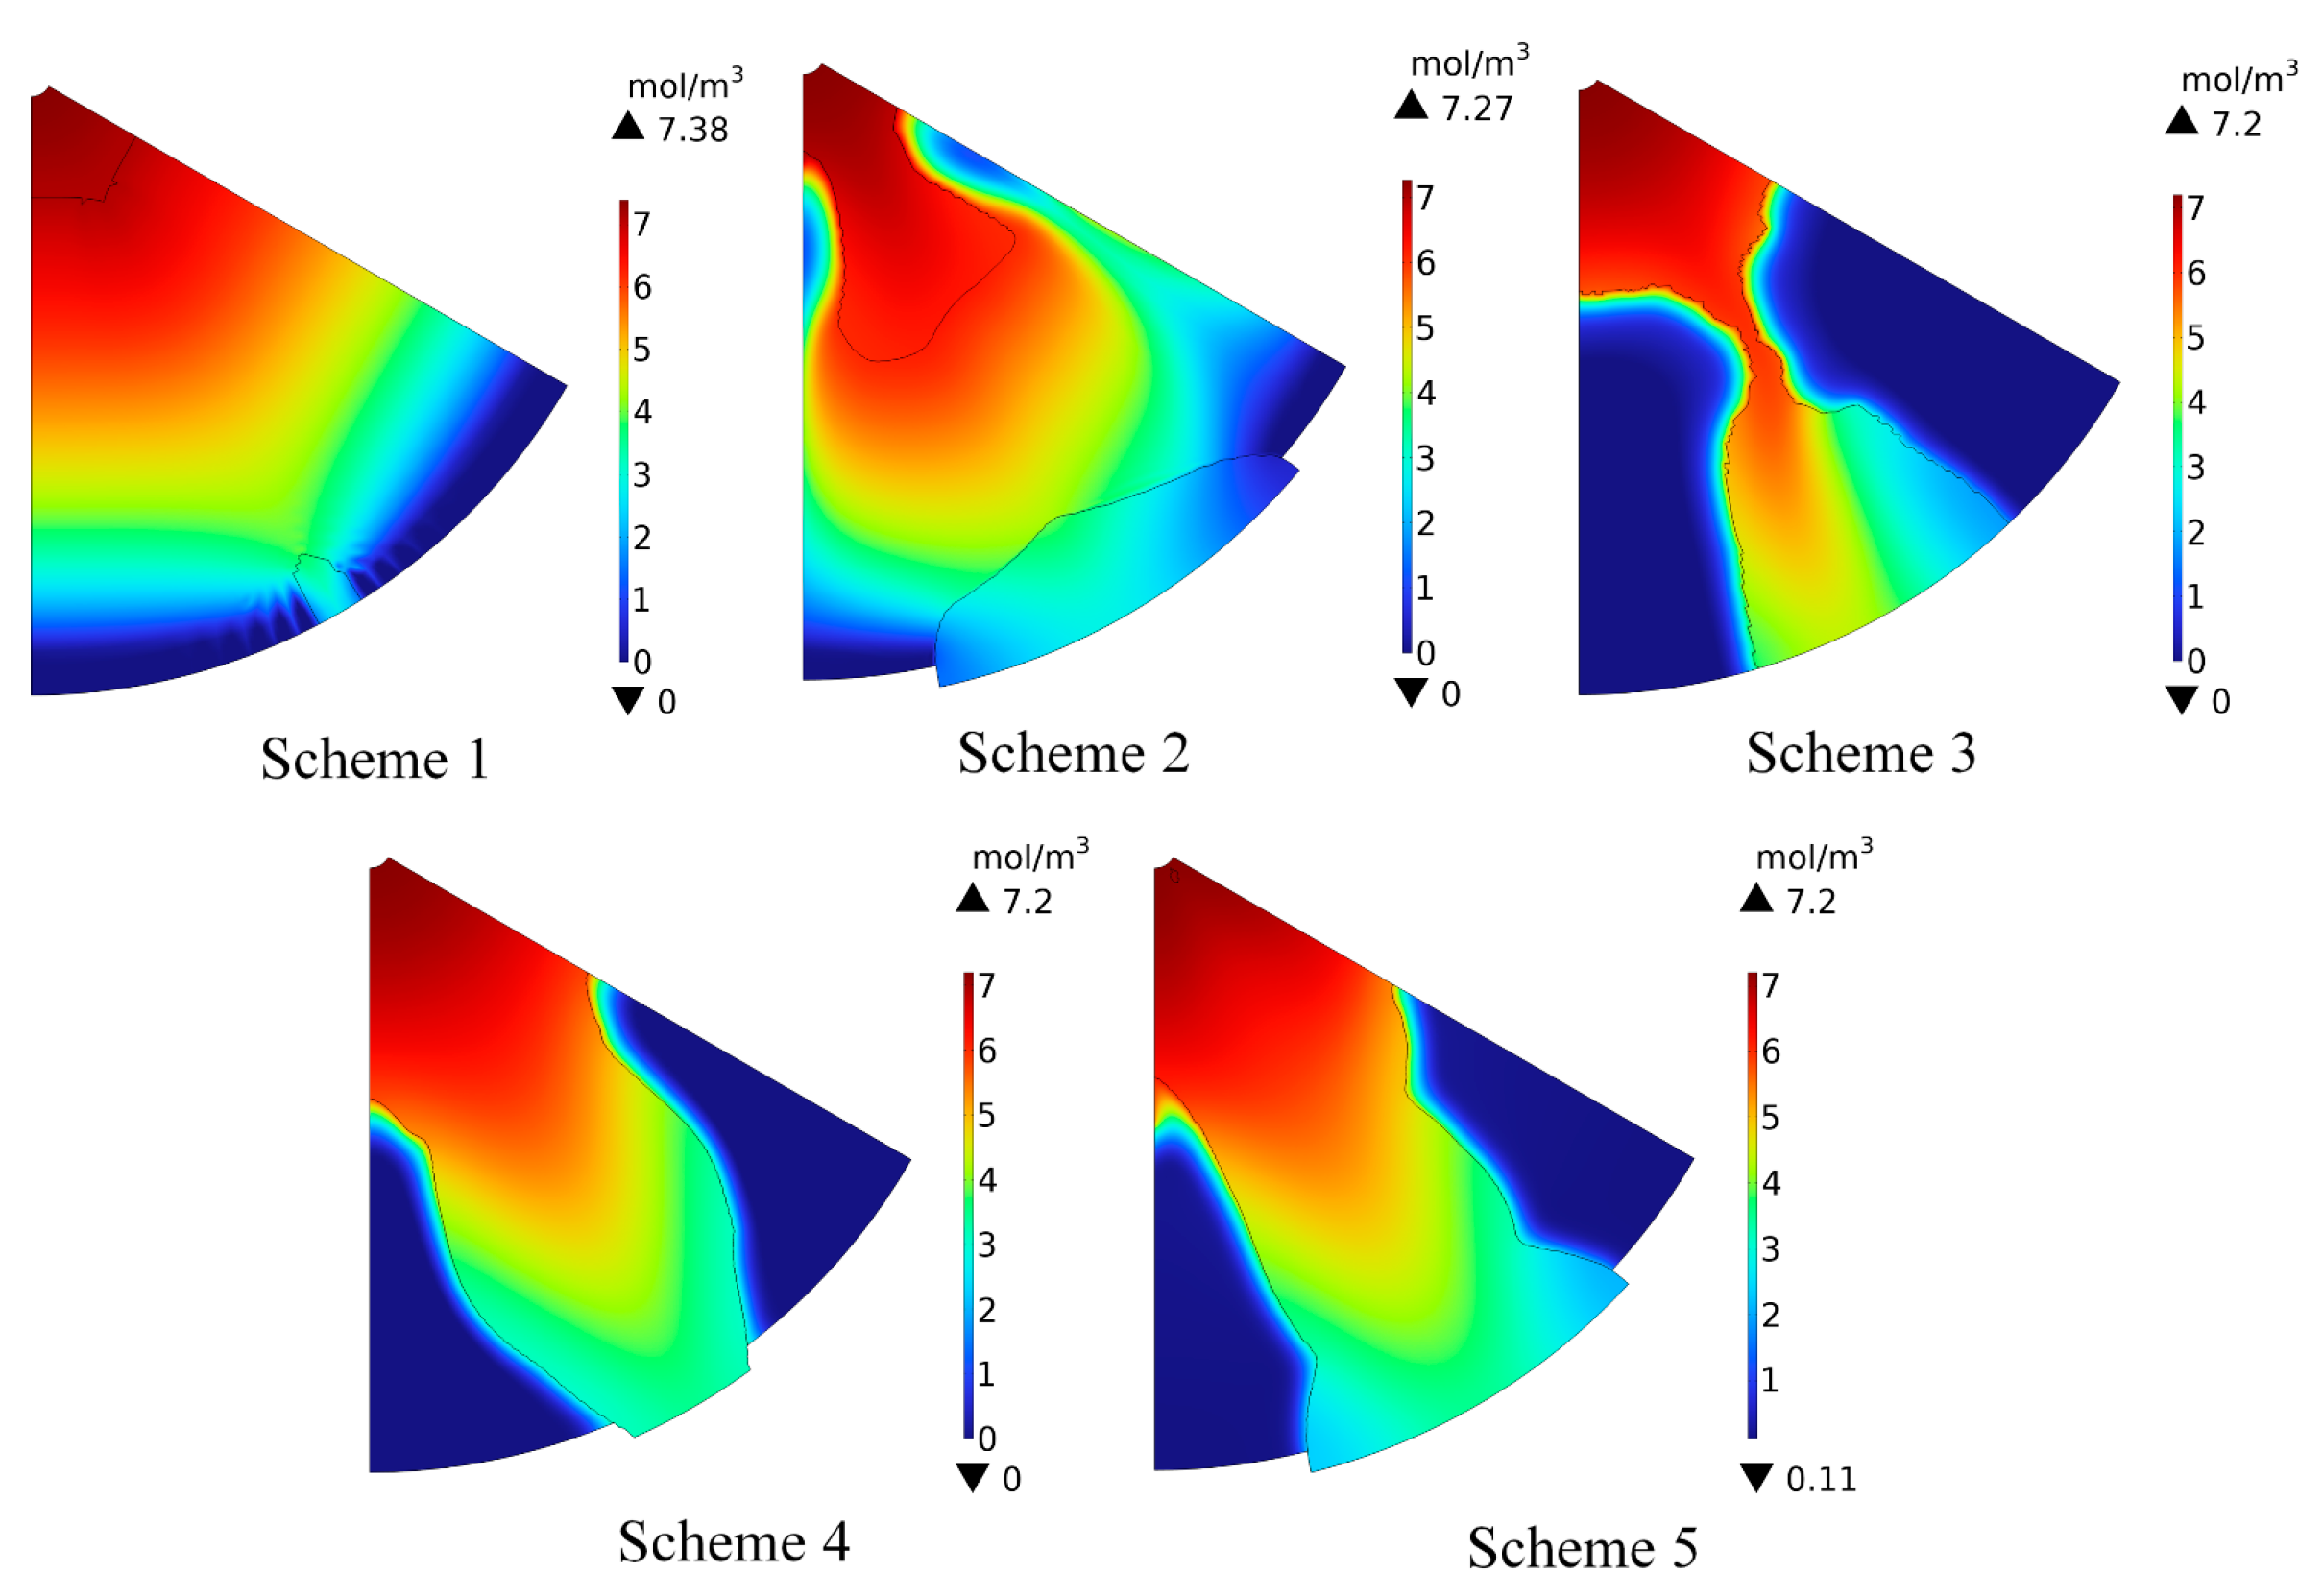
3.2.3. Oxygen Concentration Analysis after TOM

From Figure 7, in Schemes 1 and 2, oxygen is concentrated at the inlet of the porous channel cut off by the porous rib. At the porous rib, the reaction gas is difficult to pass smoothly, the overall gas distribution is uneven, and the utilization rate of the reaction gas is low. In Scheme 3, the space between the perforated ribs is narrow and tortuous, and there is a low oxygen concentration distribution area at the channel, so it is difficult for the reaction gas to pass through smoothly, and the oxygen concentration distribution of the model is uneven. In Schemes 4 and 5, the maximum oxygen concentration is 7.2 mol m−3, and the minimum is about 0 mol m−3. Therefore, the focus is to compare the uniformity of oxygen concentration distribution. The oxygen concentration distribution uniformity of Scheme 4 is more excellent than that of Scheme 5, so the optimization effect of Scheme 4 is more prominent.

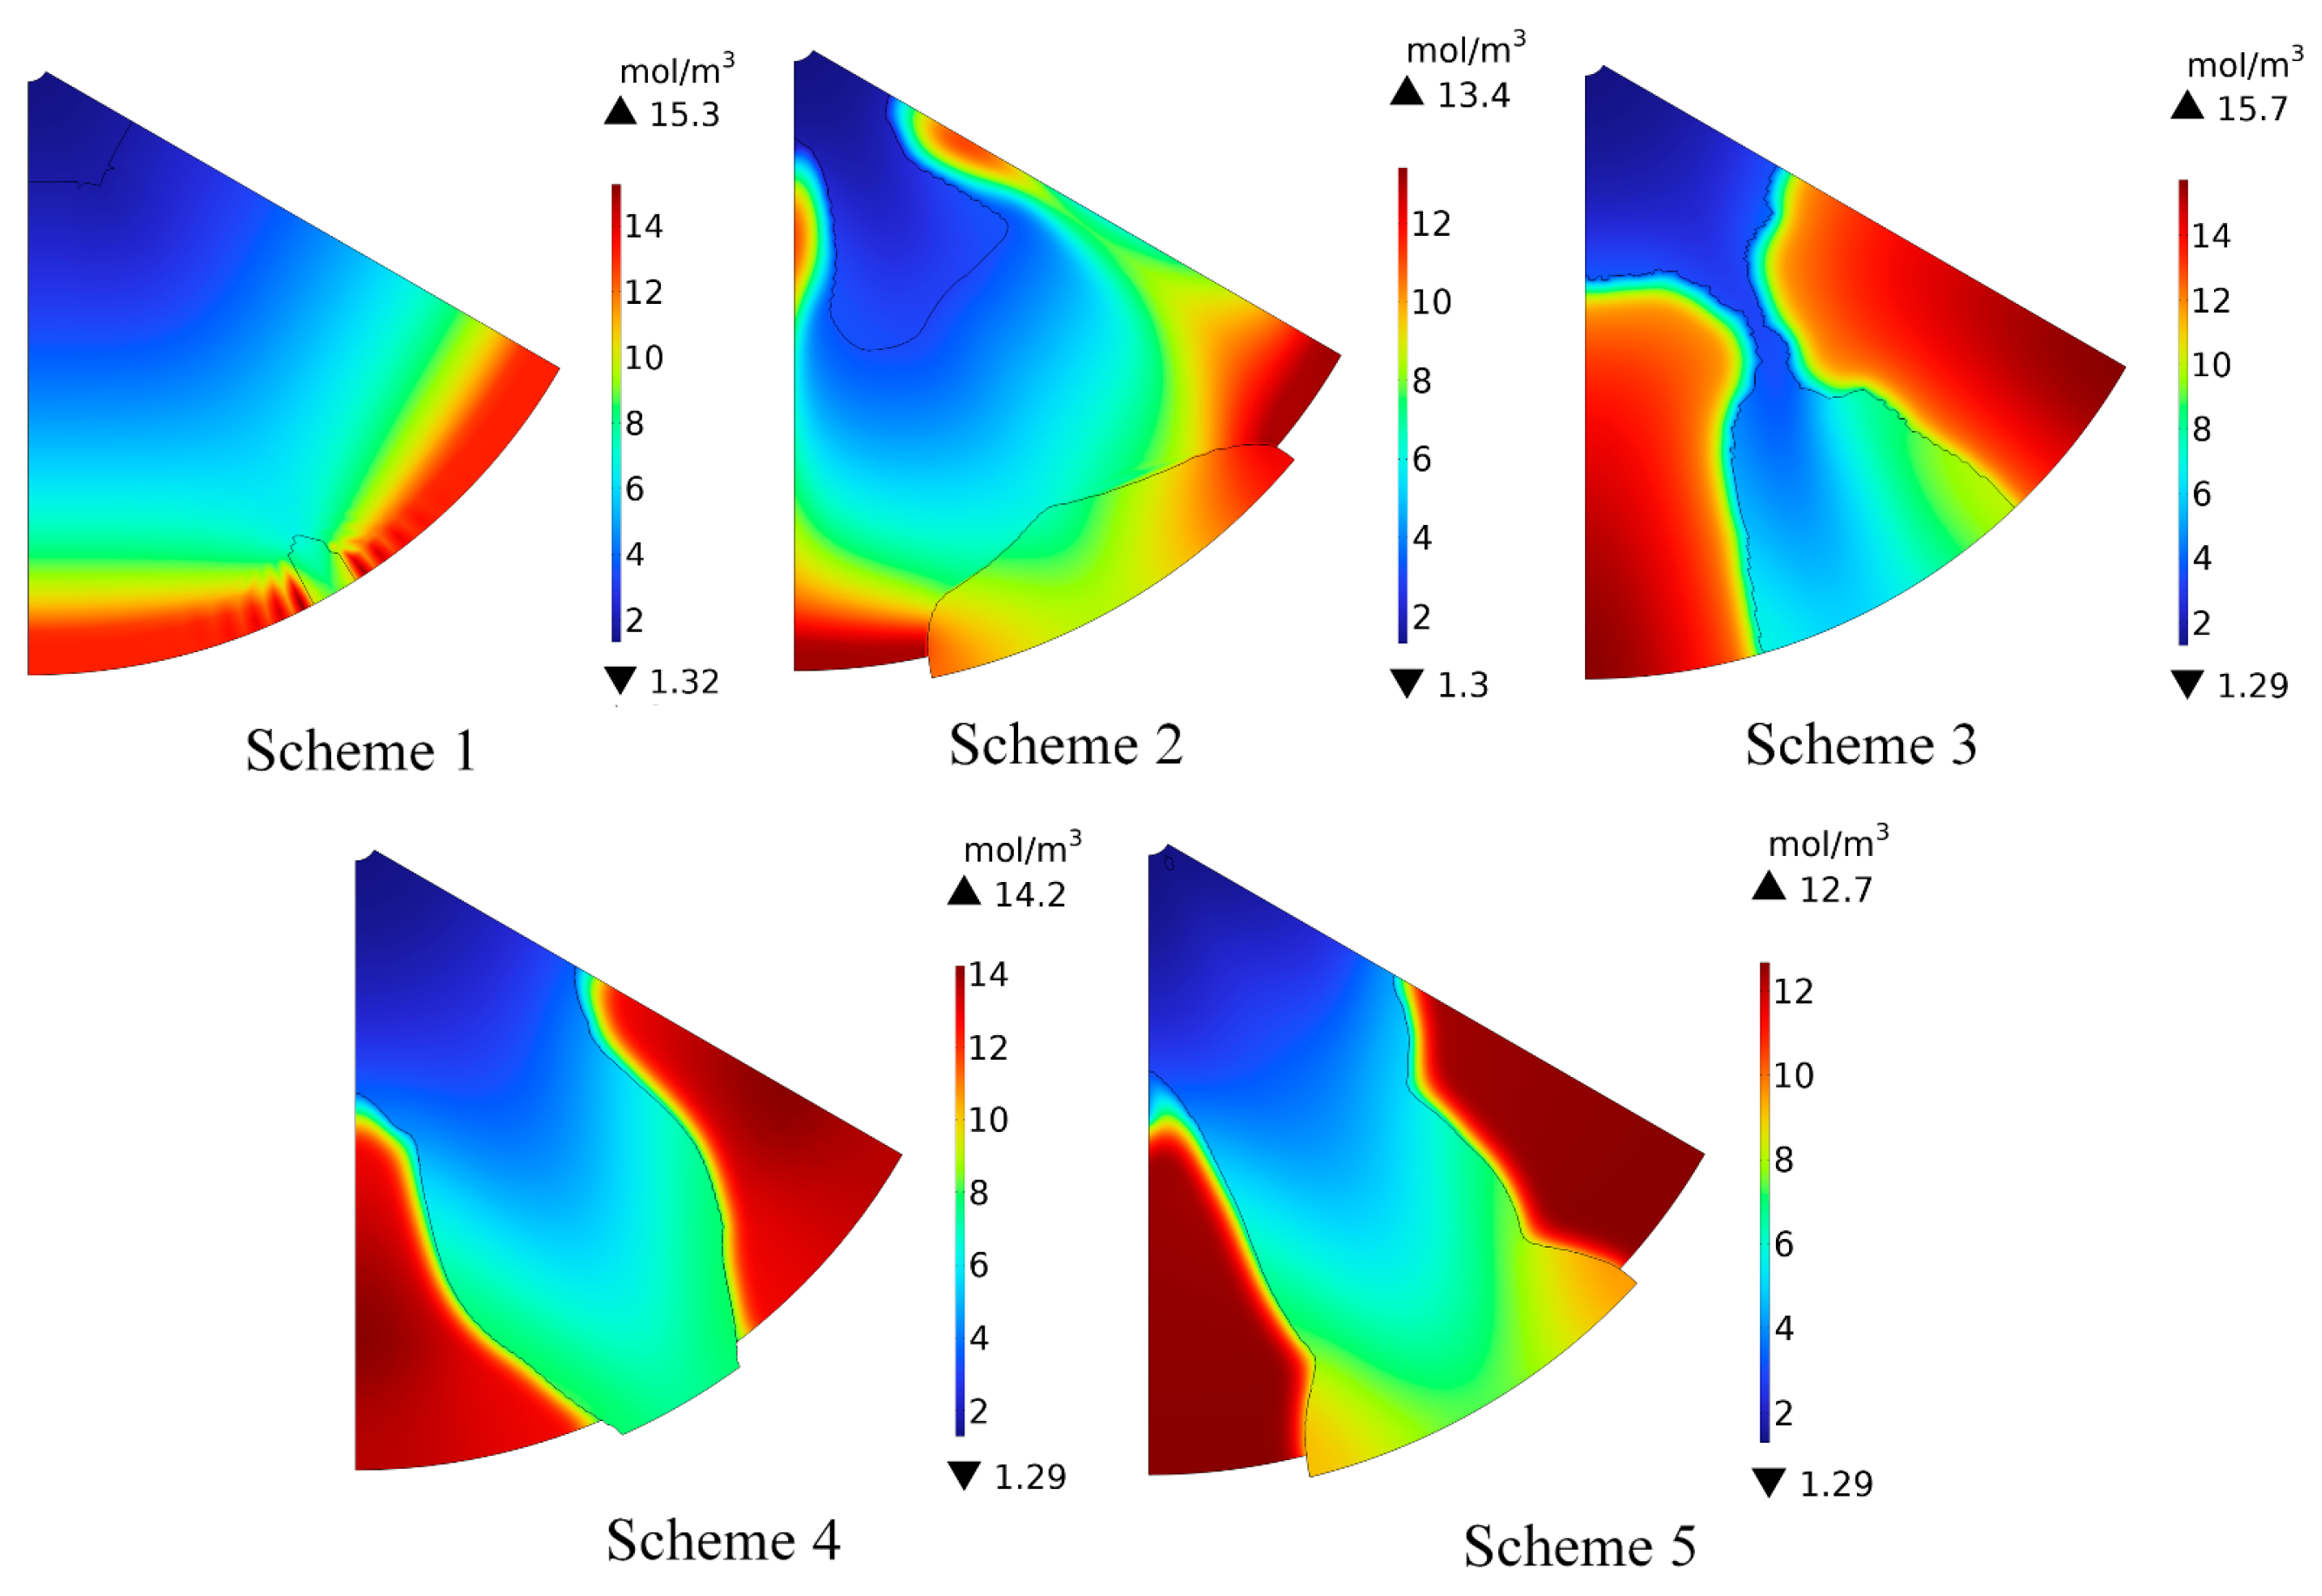
3.2.4. Water Concentration Analysis after TOM

Figure 8 shows that because of the low permeability of the porous rib, the product water should be discharged from the whole model along with the reaction gas from the porous channel. In Schemes 1 and 2, because the porous rib cuts off the porous channel, the product water cannot be discharged from the channel smoothly, and severe water flooding will occur between the porous channel and the porous rib. In Scheme 3, although the porous channels are already connected, the spacing between the channels is small, the reaction gas flow rate is high, and the channel structure is more complex, which is not conducive to drainage. The maximum water concentration is 15.7 mol m−3. In Scheme 4 and 5, the maximum water concentration peak of Scheme 5 is 13.4 mol m−3, 6% lower than Scheme 4 and 17.1% lower than Scheme 3. However, the minimum water concentration in each scheme is similar, so the hydrophobic ability of Scheme 4 and Scheme 5 is more substantial. By comparing the low water concentration areas, it is found that the low water concentration distribution area of Scheme 5 is more significant than that of Scheme 4. Hence, the drainage effect of Scheme 5 is better, and water flooding is hard to occur.

3.2.5. Analysis of Polarization Curve after TOM

The polarization curves of the average current density and power density for parallel channels, serpentine channels, and topological models are shown in Figure 9. TOM can effectively improve the working performance of PEMFC, with a more pronounced contrast in the medium to high current density region. However, because of the large area of the perforated rib plate and the poor gas permeability, the voltage and power of Schemes 1 and 2 are worse than those of Schemes 3–5 at medium and high current density. According to the almost identical polarization curves of Scheme 3, Scheme 4 and Scheme 5, we found that further increasing the maximum volume constraint has little effect on the cell performance of PEMFC when the maximum constraint volume exceeds 40%. However, increasing the maximum volume constraint is beneficial for enhancing the mass transfer ability of PEMFC. At 0.6 V, the average current density of Scheme 4 is 3026 A m−2, and the power density of Scheme 4 is 1815.6 W m−2, which is 14.9% higher than the serpentine flow channel, 9.5% higher than the parallel flow channel and 5% higher than Scheme 2. Therefore, the optimization effect of Scheme 4 is relatively excellent.

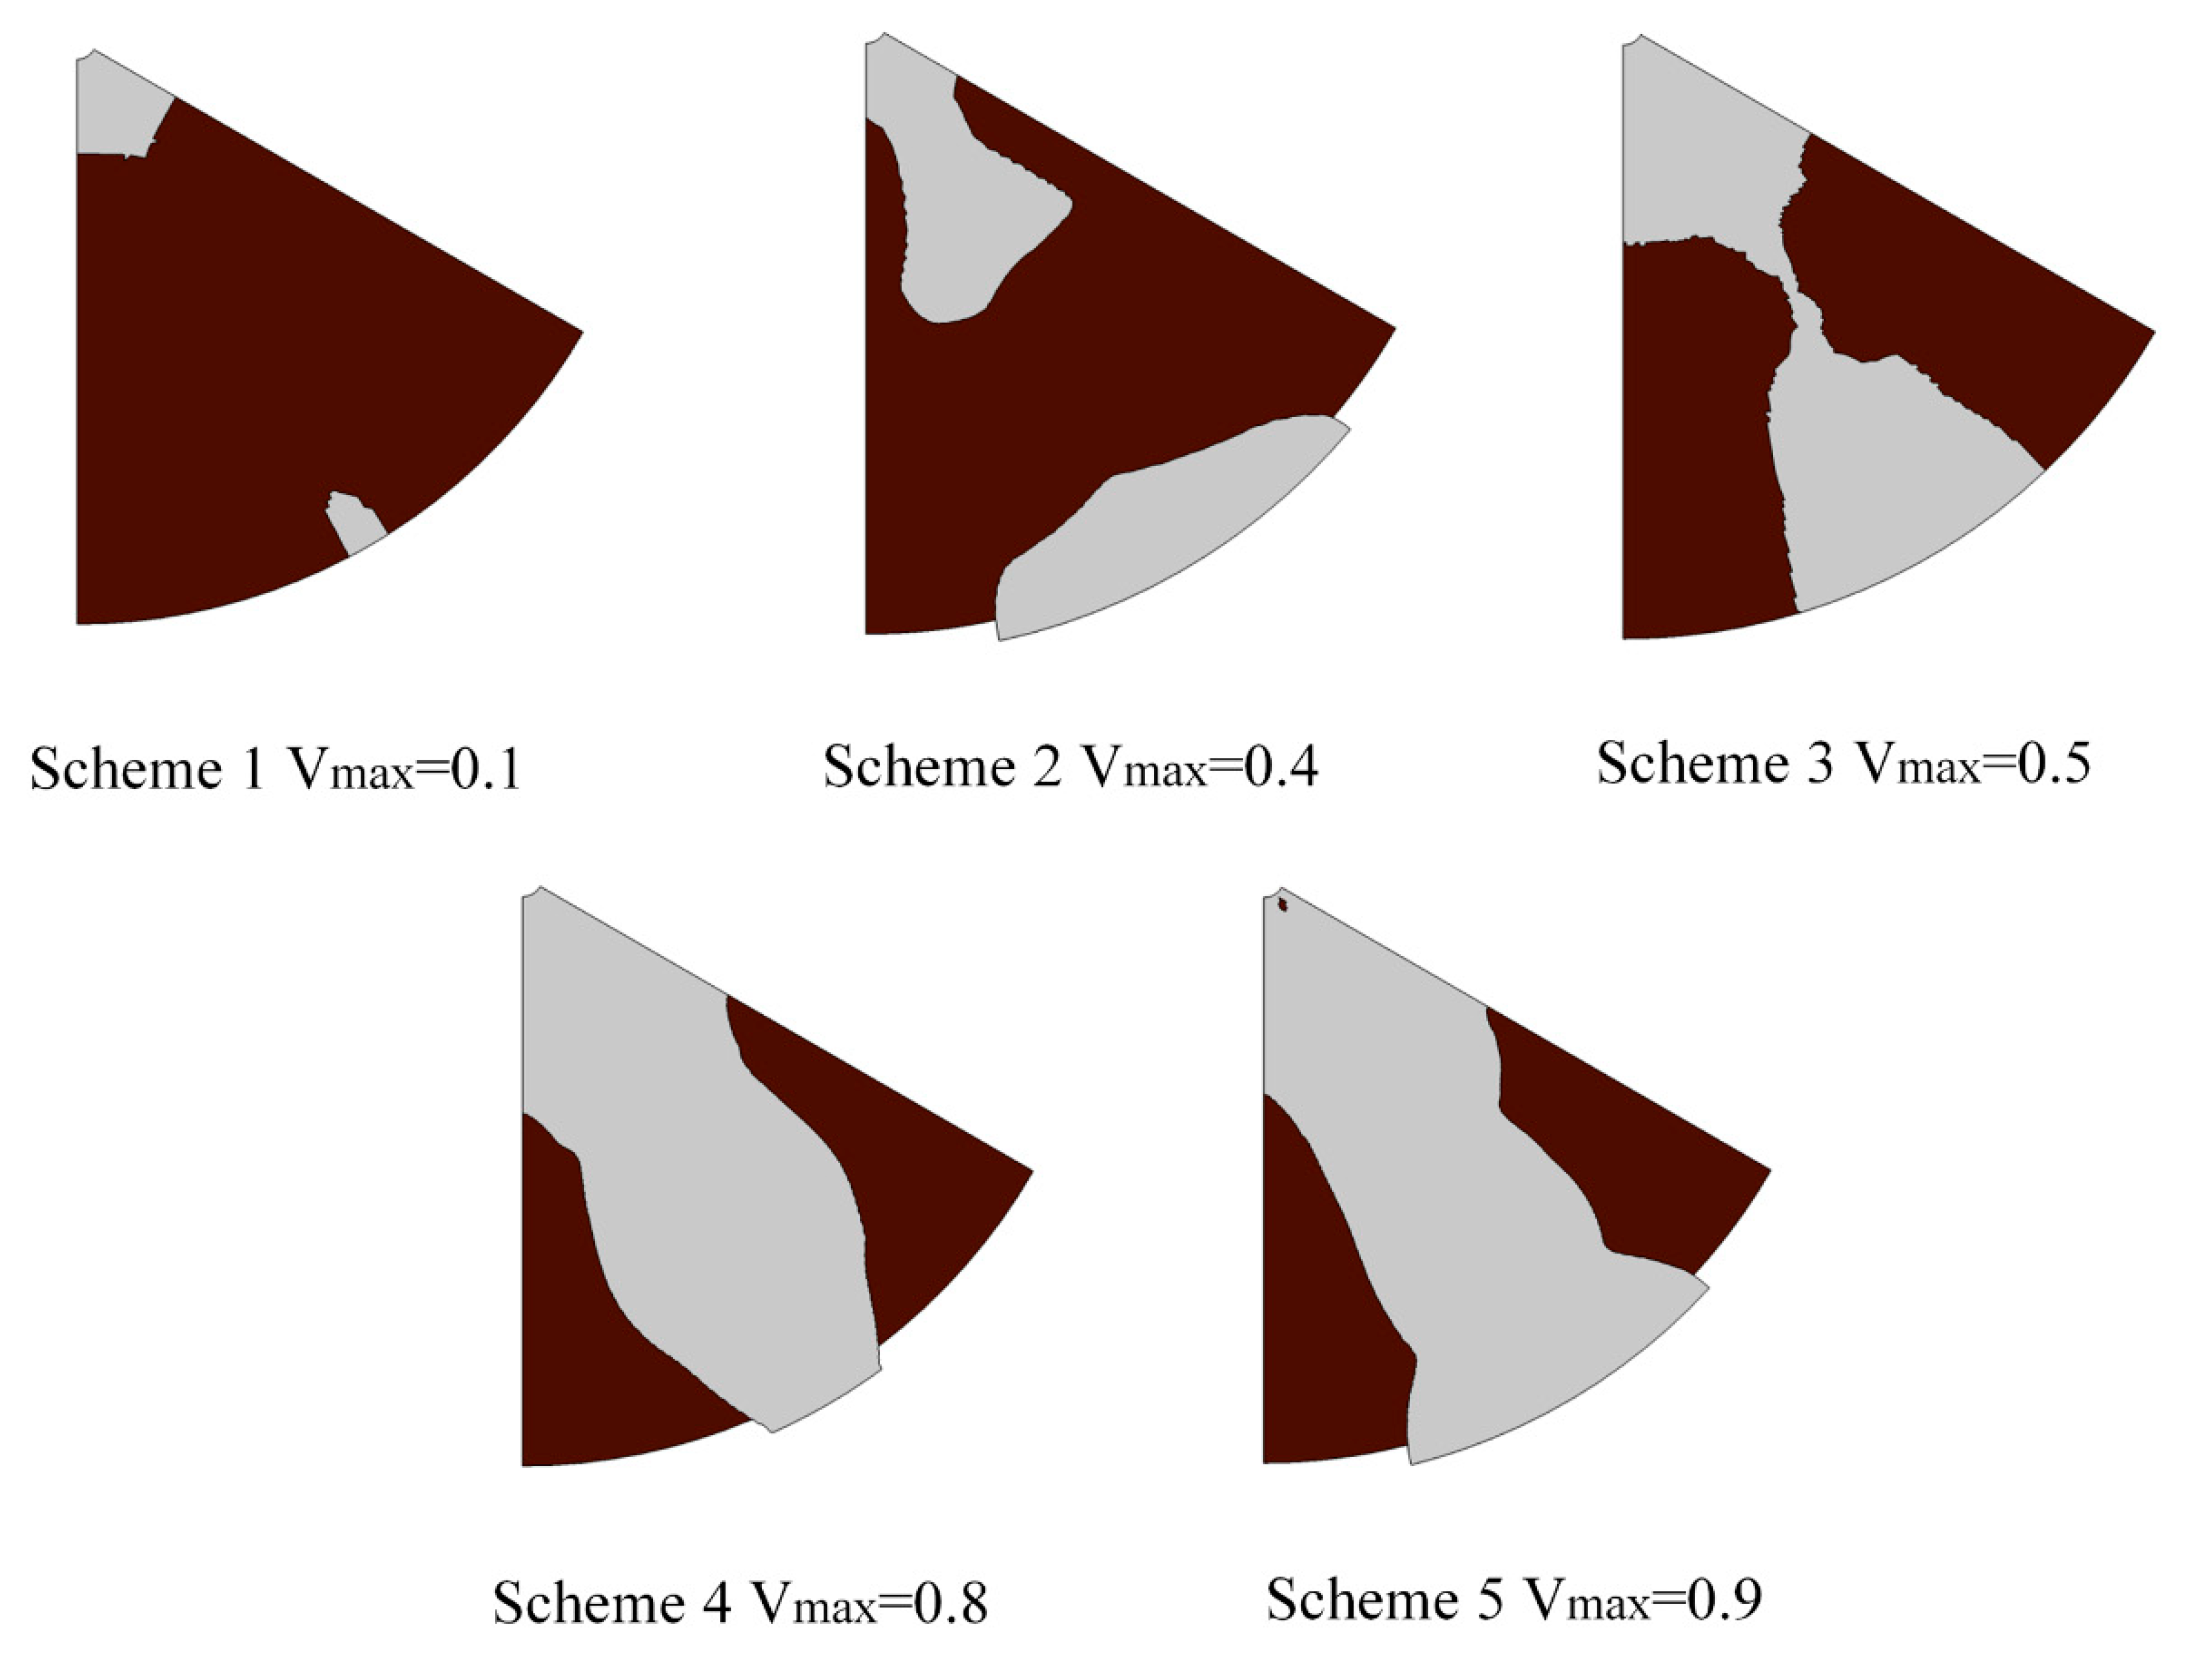
3.2.6. TOM Post-Processing and Model Verification

By comparing the velocity field, oxygen concentration, water concentration, and polarization curves obtained after TOM, it can be seen that Scheme 4 can have higher cell efficiency under medium and high current density, and the concentration distribution of reactants is relatively uniform, with better hydrophobic performance.
As shown in Figure 10, to verify the effectiveness of the results, a three-dimensional simulation was conducted on the optimized topology model of radial PEMFC (Scheme 4). Because there are materials between fluid and solid in TOM, which do not exist in actual production, it is necessary to use Helmholtz filters to filter the intermediate state structure as much as possible to obtain a more accurate model structure when constructing the model. When designing a 3D model, the threshold map optimized by topology is introduced into the geometric structure as grid part parameters and set as a channel structure. To ensure the accuracy of validation, the design parameters, boundary conditions, and assumptions of the 2D model are used when designing the 3D model.
By directly comparing the optimized 2D and 3D model graphs of TOM, as shown in Figure 11, it can be seen that the maximum speed ratio between 2D and 3D models is 70%, which is similar to the average-maximum velocity ratio of the Poiseuille fluid, as shown in Figure 11a. The maximum difference in oxygen concentration between the 2D model and the 3D model in Figure 11b is 0.03 mol m−3, and the oxygen concentration at the outlet of the 3D model shows a significant decrease compared to the 2D model. In Figure 11c, the water concentration distribution of the 3D model has a more considerable water concentration difference than that of the 2D model, and the water concentration of the 3D model at the outlet is significantly higher. Therefore, after verification, it was found that the post-processing model and the 2D model have good similarities in results.

4. Conclusions

We use topology optimization to design the PEMFC radial cathode model. The average depth program integrates cathode electrodes, GDL, and polar plates into the 2D cathode PEMFC model, and we verify its rationality with a single serpentine flow channel. Topology optimization adopts multi-objective constraints to maximize the power of PEMFC and minimize energy dissipation. We analyze topology models’ cell performance and mass transfer ability with different maximum volume constraints and reach the following conclusions.
(1)
Increasing the maximum volume constraint is beneficial for obtaining a complete topology model, enhancing the uniformity of oxygen distribution, and improving drainage performance.
(2)
The optimized radial PEMFC has higher voltage and power output than parallel and serpentine channels at medium to high current densities. Increasing the maximum volume constraint is beneficial for improving the cell performance of PEMFC. However, after the maximum volume constraint exceeds 40%, the cell performance difference of PEMFC is relatively small, and the topology has reached the optimal treatment of minimizing PEMFC power loss. Increasing the maximum volume constraint can reduce the energy loss of the gas, but it has little impact on the cell performance of PEMFC. Among all optimization schemes, Scheme 4 has a tremendous advantage.
(3)
By comparing the 3D model and 2D model under the same conditions, it is found that the model optimized by topological can accurately reflect the horizontal electrochemical reaction of the 3D model but cannot reflect the vertical change in PEMFC.
This article uses topology optimization to study the impact of different volume constraints on the optimization effect of the model. Due to the simplification of the model using the average depth approach, it is necessary to study direct topology optimization methods for 3D models to obtain more accurate models. In addition, this article takes permeability, porosity, and diffusivity as design parameters, but the selection range of design parameters can be broader. The topology optimization objectives of this article also require further research. In addition to cell efficiency and energy dissipation of reaction gases, we can use weighted methods to analyze the impact of different design objectives on the optimization effect of the model. The average depth model can also be applied to high-power PEMFC and the parameters of the 2D model can be adjusted based on experimental materials. The cell efficiency of the topology optimization model in this study still has a particular gap compared to high-power PEMFC, but updating and optimizing the model parameters can improve the cell efficiency. Therefore, there is still significant room for development in applying TOM in PEMFC.

Author Contributions

Conceptualization, C.Q. and Y.Z.; data curation, C.Q. and Y.Z.; methodology, C.Q.; project administration, M.Z.; resources, M.Z.; software, Z.Z.; supervision, M.Z.; validation, C.Q.; writing—original draft, C.Q.; writing—review and editing, C.Q. All authors have read and agreed to the published version of the manuscript.

Funding

This research was funded by Jinan ‘20 New Universities’ Introduction Innovation Team Project, the funding number 2021GXRC075.

Data Availability Statement

Not applicable.

Conflicts of Interest

The authors declare no conflict of interest.

References

  1. Bunyan, S.T.; Dhahad, H.A.; Khudhur, D.S.; Yusaf, T. The effect of flow field design parameters on the performance of PEMFC: A review. Sustainability 2023, 15, 10389. [Google Scholar] [CrossRef]
  2. Shang, Z.H.; Hossain, M.M.; Wycisk, R.; Pintauro, P.N. Poly(phenylene sulfonic acid)-expanded polytetrafluoroethylene composite membrane for low relative humidity operation in hydrogen fuel cells. J. Power Sources 2022, 535, 231375. [Google Scholar] [CrossRef]
  3. Linden, F.V.; Pahon, E.; Morando, S.; Bouquain, D. A review on the Proton-Exchange Membrane Fuel Cell break-in physical principles, activation procedures, and characterization methods. J. Power Sources 2023, 575, 233168. [Google Scholar] [CrossRef]
  4. Ibhadode, O.; Zhang, Z.D.; Sixt, J.; Nsiempba, K.M.; Orakwe, J.; Martinez-Marchese, A.; Ero, O.; Shahabad, S.I.; Bonakdar, A.; Toyserkani, E. Topology optimization for metal additive manufacturing: Current trends, challenges, and future outlook. Virtual Phys. Prototyp. 2023, 18, 2181192. [Google Scholar] [CrossRef]
  5. Golecki, T.; Gomez, F.; Carrion, J.; Spencer, B.F. Bridge topology optimization considering stochastic moving traffic. Eng. Struct. 2023, 292, 116498. [Google Scholar] [CrossRef]
  6. Gomesl, P.; Palacios, R. Aerostructural topology optimization using high fidelity modeling. Struct. Multidiscip. Optim. 2022, 65, 137. [Google Scholar] [CrossRef]
  7. Wang, J.P.; Wu, J.; Westermann, R. Stress topology analysis for porous infill optimization. Struct. Multidiscip. Optim. 2022, 65, 92. [Google Scholar] [CrossRef]
  8. Gomes, P.; Palacios, R. Aerodynamic-driven topology optimization of compliant airfoils. Struct. Multidiscip. Optim. 2020, 62, 2117–2130. [Google Scholar] [CrossRef]
  9. Pollini, N. Topology optimization of wind farm layouts. Renew. Energy 2022, 195, 1015–1027. [Google Scholar] [CrossRef]
  10. Li, Q.Q.; Cao, G.L.; Zhang, X.W.; Li, G.J. Topology optimization of the microstructure of solid oxide fuel cell cathodes. Acta Mater. 2020, 201, 278–285. [Google Scholar] [CrossRef]
  11. Yang, D.J.; Hao, Y.; Li, B.; Ming, P.W.; Zhang, C.M. Topology optimization design for the lightweight endplate of proton exchange membrane fuel cell stack clamped with bolts. Int. J. Hydrogen Energy 2022, 47, 9680–9689. [Google Scholar] [CrossRef]
  12. Wang, H.; Wang, Z.L.; Zhu, J.H.; Zhang, W.H.; Ming, P.W. Thermal-fluid-structural topology optimization of coolant channels in a proton exchange membrane fuel cell. Int. Commun. Heat Mass Transfer 2023, 142, 106648. [Google Scholar] [CrossRef]
  13. Behrou, R.; Pizzolato, A.; Forner-Cuenca, A. Topology optimization as a powerful tool to design advanced pemfcs. Int. J. Heat Mass Transfer 2019, 135, 72–92. [Google Scholar] [CrossRef]
  14. Liu, F.; Kvesic, M.; Wippermann, K.; Reimer, U.; Lehnert, W. Effect of spiral flow field design on performance and durability of HT-PEFCs. J. Electrochem. Soc. 2013, 160, 892–897. [Google Scholar] [CrossRef]
  15. Lu, J.Z.; Xia, Y.Z.; Hu, Y.W.; Wang, Z.C.; Lei, H.W.; Hu, G.L. Study on transport phenomena and performance of proton exchange membrane fuel cell with radial flow fields. Eng. Appl. Comput. Fluid Mech. 2023, 17, 2156925. [Google Scholar] [CrossRef]
  16. Xie, Q.Z.; Zheng, M.G. CFD Simulation and Performance Investigation on a Novel Bionic Spider-Web-Type Flow Field for PEM Fuel Cells. Processes 2021, 9, 1526. [Google Scholar] [CrossRef]
  17. Comsol Multiphysics, v. 5.3a; Comsol Ab: Stockholm, Sweden, 2017. Available online: www.comsol.com(accessed on 14 December 2017).
  18. Wang, C.; Zhang, Q.L.; Shen, S.Y.; Yan, X.H.; Zhu, F.J.; Cheng, X.J.; Zhang, J.L. The respective effect of under-rib convection and pressure drop of flow fields on the performance of pem fuel cells. Sci. Rep. 2017, 7, 43447–43455. [Google Scholar] [CrossRef] [PubMed]
  19. Olesen, L.H.; Okkels, F.; Bruus, H. A high-level programming-language implementation of topology optimization applied to steady-state navier–stokes flow. Int. J. Numer. Methods Eng. 2006, 65, 975–1001. [Google Scholar] [CrossRef]
  20. O’hayre, R.P.; Cha, S.W.; Colella, W.G.; Prinz, F.B. Fuel Cell Fundamentals; John Wiley & Sons: New York, NY, USA, 2016. [Google Scholar]
  21. Kee, R.J.; Coltrin, M.E.; Glarborg, P. Chemically Reacting Flow: Theory and Practice; John Wiley & Sons: New York, NY, USA, 2005. [Google Scholar]
  22. Cussler, E.L. Diffusion: Mass Transfer in Fluid Systems; Cambridge University Press: Cambridge, UK, 2009. [Google Scholar]
  23. Sun, L.; Shen, J.; Hua, Q.S.; Lee, K.Y. Data-driven oxygen excess ratio control for proton exchange membrane fuel cell. Appl. Energy 2018, 231, 866–875. [Google Scholar] [CrossRef]
  24. Alexandersen, J.; Aage, N.; Andreasen, C.S.; Sigmund, O. Topology optimization for natural convection problems. Int. J. Numer. Methods Fluids 2014, 76, 699–721. [Google Scholar] [CrossRef]
  25. Lazarov, B.S.; Sigmund, O. Filters in topology optimization based on helmholtz-type differential equations. Int. J. Numer. Methods Eng. 2011, 86, 765–781. [Google Scholar] [CrossRef]
  26. Wang, F.W.; Lazarov, B.S.; Sigmund, O. On projection methods, convergence and robust formulations in topology optimization. Struct. Multidiscip. Optim. 2011, 43, 767–784. [Google Scholar] [CrossRef]
Figure 1. Single cathode PEMFC. (a) 3D model; (b) 2D model.
Processes 11 02482 g001
Figure 2. Model validation of 2D and 3D single serpentine flow channel. (a) Velocity field; (b) oxygen concentration diagram; (c) water concentration distribution diagram.
Processes 11 02482 g002
Figure 3. Optimization model setup and grid independence verification. (a) Basic structure of the model; (b) grid independence verification.
Processes 11 02482 g003
Figure 4. Topological models of radial PEMFC under different maximum volume constraints.
Processes 11 02482 g004
Figure 5. Local model structure of filtered radial PEMFC under different maximum volume constraints.
Processes 11 02482 g005
Figure 6. Velocity distribution of each scheme.
Processes 11 02482 g006
Figure 7. Oxygen concentration distribution of each scheme.
Processes 11 02482 g007
Figure 8. Distribution of water concentration of each scheme.
Processes 11 02482 g008
Figure 9. Polarization curves and power curves of each scheme. (a) Average current density polarization curve; (b) power density polarization curve; (c) average current density for Scheme 3, 4, and 5 at voltages from 0.6 to 0.8 V; (d) power density for Scheme 3, 4, and 5 at voltages from 0.6 to 0.8 V.
Processes 11 02482 g009
Figure 10. Post-processing model.
Processes 11 02482 g010
Figure 11. Verification of distribution diagrams of post-processing model. (a) Velocity field; (b) oxygen concentration diagram; (c) water concentration distribution diagram.
Processes 11 02482 g011
Table 1. Modeling parameters of PEMFC.
ParameterValue
Inlet radius of flow channel R i n 5 × 10 4 /m
Outlet radius of flow channel R o u t 1.5 × 10 2 /m
Flow channel height H c h 1 × 10 3 /m
GDL height H g d l 3.8 × 10 4 /m
Sector design domain angle θ 60/deg
PEMFC working voltage V c e l l 0.6/V
PEMFC open-circuit voltage V o c 1.23/V
PEMFC temperature T343.15/K
Reference temperature T r e f 298.15/K
Reference pressure P r e f 1/atm
Lumped resistance R l u m p 7 × 10 5 / Ω m 2
Inlet velocity U i n 0.5/m s−1
Permeability of GDL κ 1.38 × 10 11 / m 2
Porosity of GDL ϵ 0.8
Entrance oxygen mass fraction ω O 2 i n 0.228
Entrance water mass fraction ω H 2 O i n 0.023
Entrance nitrogen mass fraction ω N 2 i n 0.749
Oxygen reference concentration C O 2 r e f 30/mol m−3
Cathode transfer coefficient α c 0.5
Exchange current density i 0 0.17/A m−2
Number of species n s 3
Number of electrons n e 4
Water molar mass M H 2 O 0.018/kg mol−1
Nitrogen molar mass M N 2 0.028/kg mol−1
Oxygen molar mass M O 2 0.032/kg mol−1
Water chemometric coefficient ν H 2 O 2
Nitrogen chemometric coefficient ν N 2 0
Oxygen chemometric coefficient ν O 2 −1
Oxygen diffusion coefficient in water D O 2 , H 2 O r e f 2.64 × 10 5 /m2 s−1
Nitrogen diffusion coefficient in water D N 2 , H 2 O r e f 2.64 × 10 5 /m2 s−1
Oxygen diffusion coefficient in nitrogen D O 2 , N 2 r e f 2.07 × 10 5 /m2 s−1
Equivalent permeability (porous ribs) κ r i b 3.8 × 10 12 /m2
Equivalent permeability (porous channels) κ c h
Equivalent porosity (porous ribs) ϵ r i b 0.22029
Equivalent porosity (porous channels) ϵ c h 0.94493
Equivalent diffusion coefficient (porous ribs) D r i b 0.19703
Equivalent diffusion coefficient (porous channels) D c h 0.92167
Dynamic viscosity μ 2.07 × 10 5 /Pa s
Reactive gas density ρ 1/kg m−3
Universal gas constant R g 8.3144/J mol−1 k−1
Faraday constant (constant) F 96,485.3/C mol−1
Table 2. TOM parameters.
ParameterValue
Convex factor q 1
Penalty factor p 2
Filter radius τ m i n 3.5 × 10 4 /m
Projection slope β 3 , 6 , 9 , 12
Projection point θ β 0.5
Initial value of control variable γ 0 0.5
Maximum volume fraction V m a x 0.1, 0.2, 0.3, 0.4, 0.5, 0.6, 0.7, 0.8, 0.9
Optimum tolerance t o p t 1 × 10 7
Maximum number of model evaluations e v m a x 5000
Internal tolerance factor t i n 0.001
Constrained penalty factor C i 1000
Maximum internal iteration N i n 10
Disclaimer/Publisher’s Note: The statements, opinions and data contained in all publications are solely those of the individual author(s) and contributor(s) and not of MDPI and/or the editor(s). MDPI and/or the editor(s) disclaim responsibility for any injury to people or property resulting from any ideas, methods, instructions or products referred to in the content.

