Article

Study on Efficient Removal Method of Fine Particulate Dust in Green Metallurgy Process

College of Metallurgy and Energy, North China University of Science and Technology, Tangshan 063000, China
*
Authors to whom correspondence should be addressed.
Processes 2023, 11(9), 2573; https://doi.org/10.3390/pr11092573
Submission received: 31 July 2023 / Revised: 19 August 2023 / Accepted: 25 August 2023 / Published: 28 August 2023
(This article belongs to the Special Issue Renewable Energy and Green Metallurgy Technology)

Abstract

:
In order to solve the problem of the low removal efficiency of fine particles in the flue gases of the metallurgy process, a chemical agglomeration pretreatment method was studied. The coagulant solution of xanthan gum, konjac gum, and their mixtures was selected to research the reunion effects of and the efficiency of gravitational dust removal of fine dust in the gas of the converter flue using a self-built experimental platform. Moreover, the effects of wetting agent type, dust concentration, pressure, and flue gas velocity on the fine grain removal efficiency were investigated. The results showed that the mixed solution of 1 g/L mixed gum and 0.5 g/L SDS had the most obvious effect on the particle size increasing of fine dust particles and the best removal effect when the flue gas velocity was 10 m/s. There was a peak particle size of 85.32 μm increased about eight times larger, and the removal efficiencies reached 51.46% for PM2.5 and 53.13% for PM10. The Box–Behnken experimental design combined with a response surface analysis method was used to optimize the parameters of the mixed gum concentration, pressure, and flue gas velocity. The optimal removal conditions were 1 g/L, 0.4 MPa, and 10 m/s. The results of this study can provide efficient methods and technical support for pre-processing and efficient removal of fine particles in heavy-polluting industries such as steel making. This will promote the green development of the metallurgical industry.

1. Introduction

Fine particulate dust is one of the main pollutants causing atmospheric pollution [1]. Since particles with small particle sizes can stay in the atmosphere for a longer period of time, they are thus the cause of hazy weather and reduced visibility. In addition, it poses a serious risk to public health, such as lung cancer and cardiovascular diseases [2]. According to the previous research, fine particulates in China mainly come from industrial production processes such as iron and steel. Currently, industries mainly use bag filters and electrostatic precipitators to remove particulate matter from dust [3], and the comprehensive removal efficiency is more than 99%. However, the collection performance of fine particles, such as PM2.5 and PM10, is still unsatisfactory with the removal efficiencies being below 50% [4,5]. Therefore, how to improve the fine particle removal effect is the key challenge currently.
To improve the removal efficiency of fine particulate dust, researchers have proposed coagulation and agglomeration to increase larger particle size through physical and chemical action and then removing them by dust collectors, which has achieved certain results in practice [6]. The main current agglomeration techniques are acoustic, turbulent, electrical, and chemical [7,8,9,10]. Among them, chemical agglomeration technology was a very promising pretreatment means, and researchers have studied enhanced dust removal from coal-fired power plants [11] and sintering processes [12]. Liu [13] analyzed the effects of the operating parameters, such as the species and concentration of the agglomeration solution, flue gas temperature, pH value of the agglomeration solution, and diameter of the spray droplets, on the fine particle removal efficiency. The results show that increasing the agglomerate concentration facilitates agglomerate size growth. However, as the concentration increases, the viscosity also increases. At the same time, this leads to the deterioration of atomization performance and negatively affects the removal of fine particles. Therefore, the addition of wetting agents is necessary to improve the agglomerate removal effect. The main function of the wetting agent is to reduce the surface tension of the agglomerate; at this time, the agglomerate is easier to flow, so it also plays a role in reducing viscosity. In order to reduce the fugitive emission of fine particles from open-pit lignite mines, Yang [10] developed a lignite dust suppressant by using a mixture of 0.7% guar gum and 0.1% Triton X-100. At present, researchers have extensively studied the wetting performance of coal dust in coal-fired power plants [14,15,16] and found that wetting agents can effectively reduce surface tension and settling time, which in turn improves the wetting effect of coal dust. Ding [14] investigated the effect of different surfactants on dust suppression efficiency, and the results showed that the addition of anionic and nonionic surfactants effectively improved the average suppression efficiency to 50.07%–70.57%. Zhou [15] conducted a chemical agglomeration experiment on a simulated coal-fired furnace and discussed the effect of air pressure on the chemical agglomeration performance. The results showed that increasing the air pressure was beneficial to produce small droplets, and the collision and collection of droplets on fine particles could be greatly improved. However, the effect of coupling agglomeration on the removal of fine particles in flue gas in the iron and steel industry has not been studied.
In this paper, fine particulate dust in the converter flue gas was selected to study the reduction in PM2.5 and PM10 emission based on the preparation of coupled agglomerator solution by combining agglomerator and wetting agent.

2. Materials and Methods

2.1. Experimental Setup

A gas-liquid two-phase flow nozzle atomization was used to construct the chemical agglomeration apparatus test bench shown in Figure 1. The experimental setup included the simulated flue gas system, the nozzle atomization system, the dust agglomeration system, the sampling and measurement system, and the waste liquid collection and treatment system. The simulated flue gas system consists of three parts: an air preheater, a blower, and a powder feeder. The dust agglomeration system mainly consisted of nozzles and agglomeration chambers. Among them, the nozzle adopts a gas–liquid two-phase flow nozzle, in which one side is introduced into high-pressure nitrogen, and the other side is introduced with water or agglomerate solution. The two fluids collide at the nozzle, crushing the agglomerate solution and atomizing it into droplets. The reunification chamber consists of four 10 × 100 × 0.5 cm high-temperature acrylic plates flanked by conical stainless steel inlets and outlets. The sampling device is located at the end of the entire apparatus. A fiberglass membrane is used to collect dust at the end. Finally, the waste liquid flows into a special collection unit for recycling so as not to harm the environment. The test was repeated three times to ensure accuracy.

2.2. Experimental Reagent

In the chemical agglomeration process, agglomerating agents can increase the adhesion between particles, and wetting agents can increase the wettability of dust. Under the action of agglomerating and wetting agents, fine particles agglomerate to form large particles. The non-toxic and non-hazardous xanthan gum, konjac gum two agglomerating agents, anionic sodium dodecyl sulfate (SDS) and sodium dodecyl benzene sulfonate (SDBS), nonionic Tween 20 (TW-20) and Tralatone 100 (TX-100) four wetting agents, and deionized water were selected during the experiment.

2.3. Experimental Method

During the experiment, the viscosity of the agglomerating agents was measured using the viscometer (Shanghai Lichen, NDJ-5S type, Shanghai, China). The contact angle of the agglomerate containing the wetting agent on the dry dust was measured using the contact angle meter (Shanghai Yinuo Precision Instruments, CA 100B type, Shanghai, China), and the filming opportunity was immediately analyzed and measured in the automatic image analysis system by computer to obtain the contact angle. The zeta potential was measured using a zeta potential meter (Malvern, UK, Zeta sizer Mano zs9003030810 type), and the selected experimental objects were consistent with the contact angle experiments conducted. To illustrate the effect of composite agglomerate on dust, the composite agglomerate solution was characterized by a viscometer, contact angle meter, and zeta potential meter.
The dust particles before and after agglomeration, and analysis of the volume distribution, were examined by the laser particle size analyzer (Mastersizer 2000). The agglomeration efficiency was expressed by η :
η = φ i n φ o u t φ i n × 100 %
where φ i n is the volume fraction of particles before agglomeration, and φ o u t is the volume fraction of particles after agglomeration.

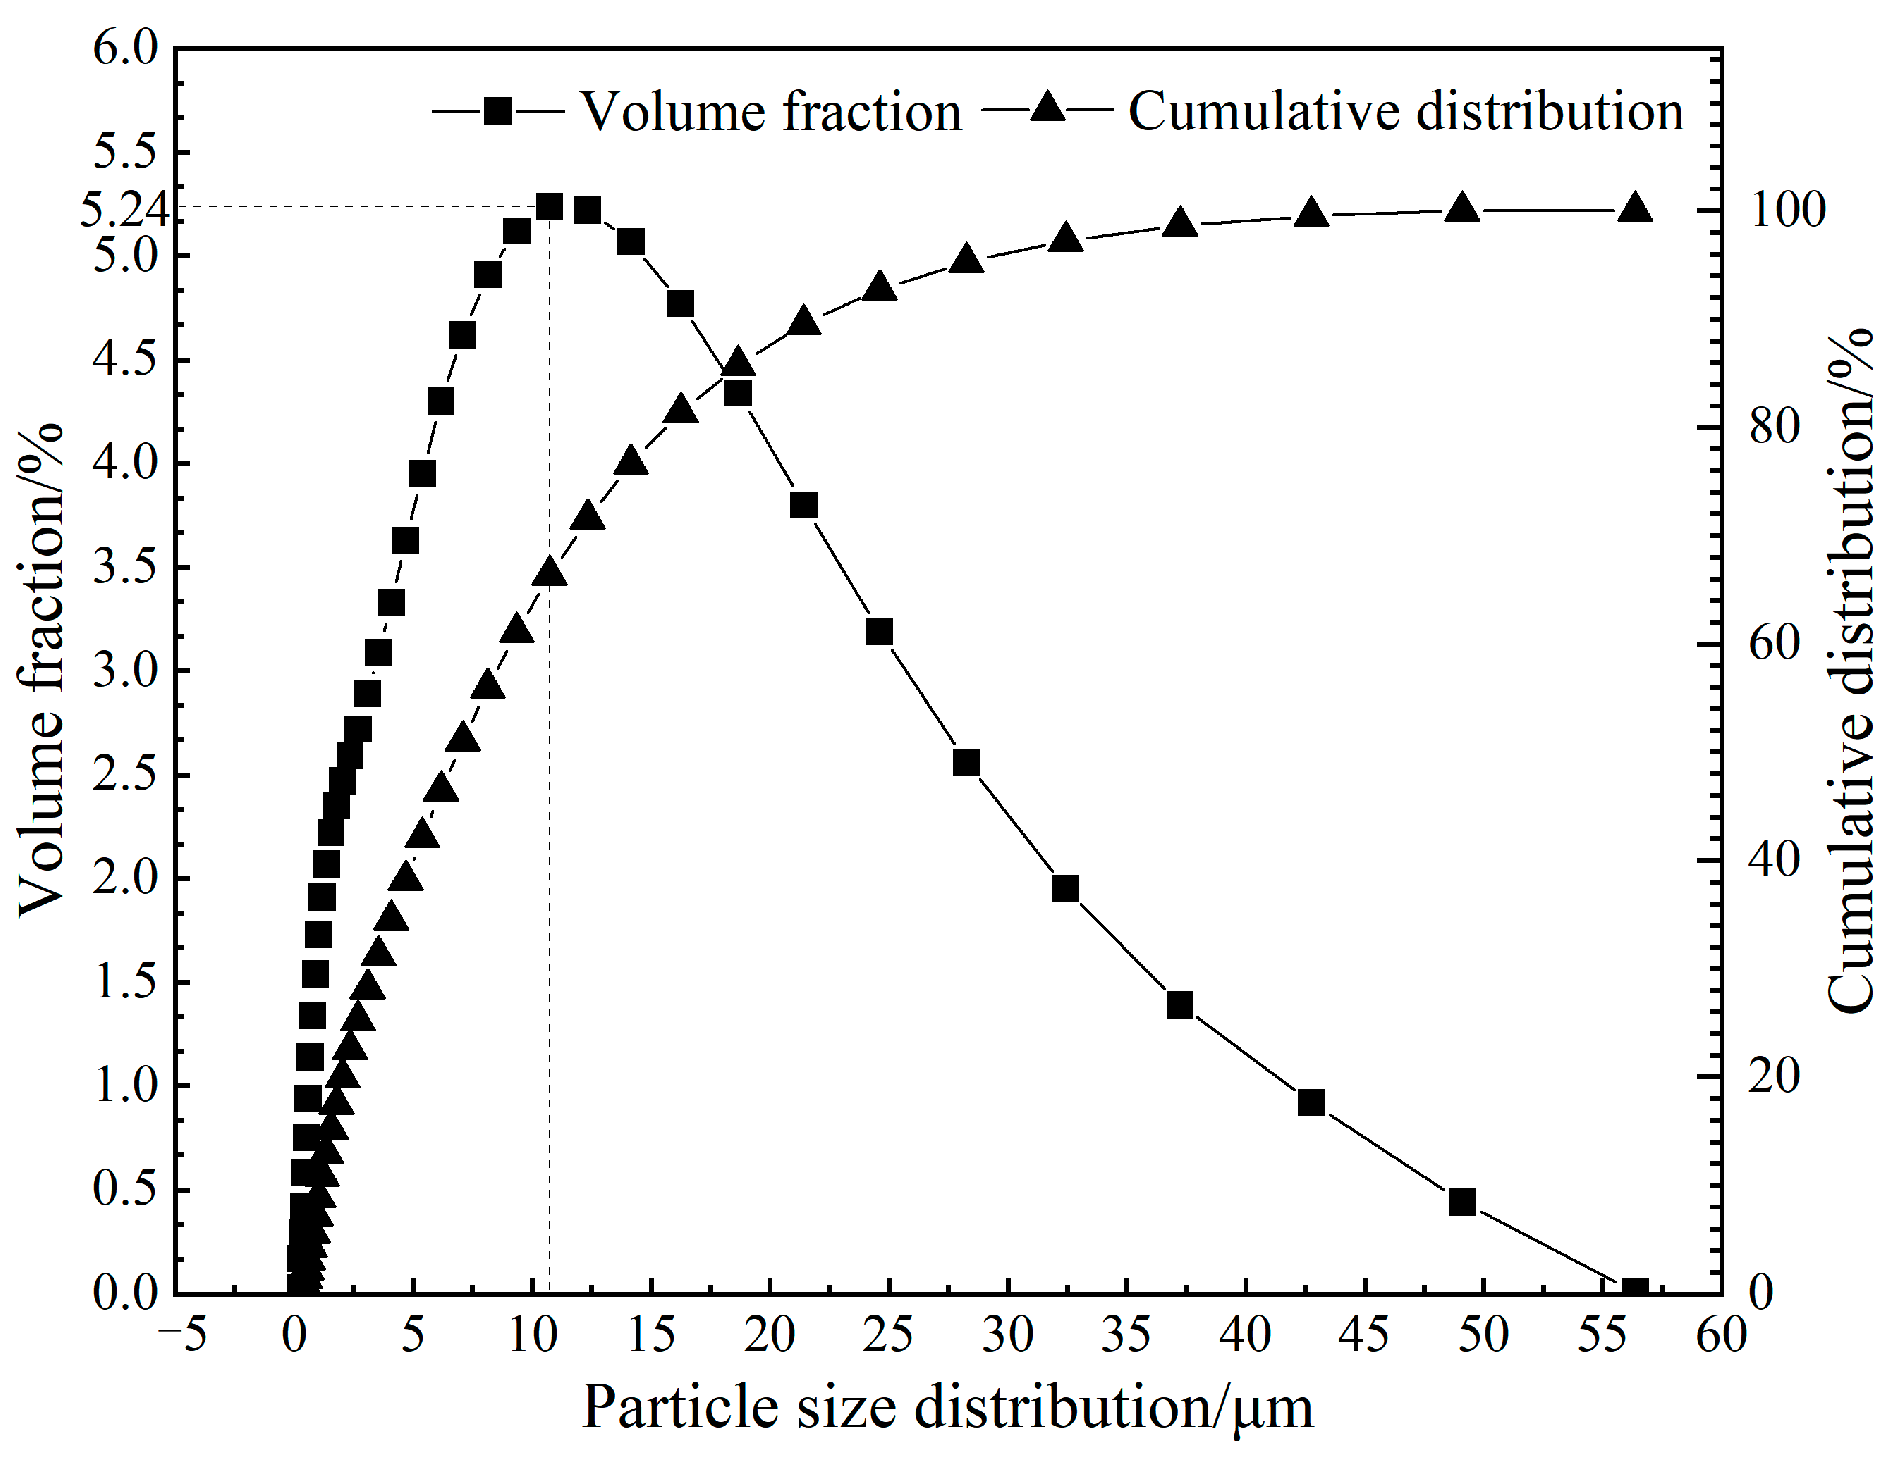
2.4. Size Distribution of Raw Dust

The experimental dust samples were obtained from the converter process at a steel plant in Hebei Province, China. The particle size distribution was examined by a laser particle size analyzer. The results are shown in Figure 2. From the results shown, the dust particle size ranges from 0 to 60 μm and the trend has a single-peak distribution. There is a peak at 10.74 μm and it accounts for 5.24%. At this point, at the peak granularity position, the cumulative distribution reaches nearly 70%. The volume fractions of PM2.5 and PM10 are 22.54% and 61.1%, respectively. The results show that the dust collector is not effective in capturing the fine particles in the flue gas.

2.5. Response Surface Test Design

Based on the results of the single-factor test, mixed gum concentration (A), nitrogen pressure (B), and flue gas flow rate (C) were selected as independent variables, and PM2.5 and PM10 removal rates (η1 and η2) were used as response values. The Box–Behnken 3-factor, 3-level response surface design was performed using Design-Expert 8.0.6 software. The results are presented in Table 1. The response surface test investigated the effect of each factor on the response values, and the data were analyzed to optimize the determination of the optimal process conditions.

3. Results and Discussion

3.1. Effect of the Agglomerator Solutions on Fine Dust Particles

Konjac gum, xanthan gum, and konjac gum and xanthan gum mixed solution with deionized water were selected during the agglomeration experiment. The experimental results of raw dust (agglomeration-less process), deionized water (agglutinant-free), and agglomerating agent are shown in Figure 3. The deionized water and agglomerating agent are sprayed using a two-phase flow nozzle. Fine particles adhere and agglomerate through the combined effect of van der Waals and liquid bridge forces. This improves cohesion between particles and enables fine particles to grow into larger ones, resulting in an increase in peak particle size. As seen in Figure 3, when the concentration is kept constant, the agglomeration effect of dust is mixed gum > xanthan gum > konjac gum > deionized water, and mixed gum has the best effect. This is due to the increased force of liquid bridge formation between the particles. Under the action of mixed gum agglomerating agent, the peak particle size of the grown dust is 49.1 μm, and the removal efficiencies of PM2.5 and PM10 were 42.6% and 46.43%, respectively.
From Figure 4, the viscosity of the gum-containing solution is higher than that of deionized water. As the temperature increases, the viscosity of the agglomerate solution tends to decrease. The reason is that as the temperature increases, the molecular spacing of the liquid becomes larger, the activity of the polymer chain is increased, and the ability to restrain the molecular motion is weakened, so the viscosity decreases. The viscosity of the mixed gum is highest at 30 °C and is more than six times higher than that of deionized water. Combined with Figure 3, it is shown that the higher viscosity of the mixed gum liquid is more conducive to the adhesion and growth of microfine dust and higher dust removal efficiency.

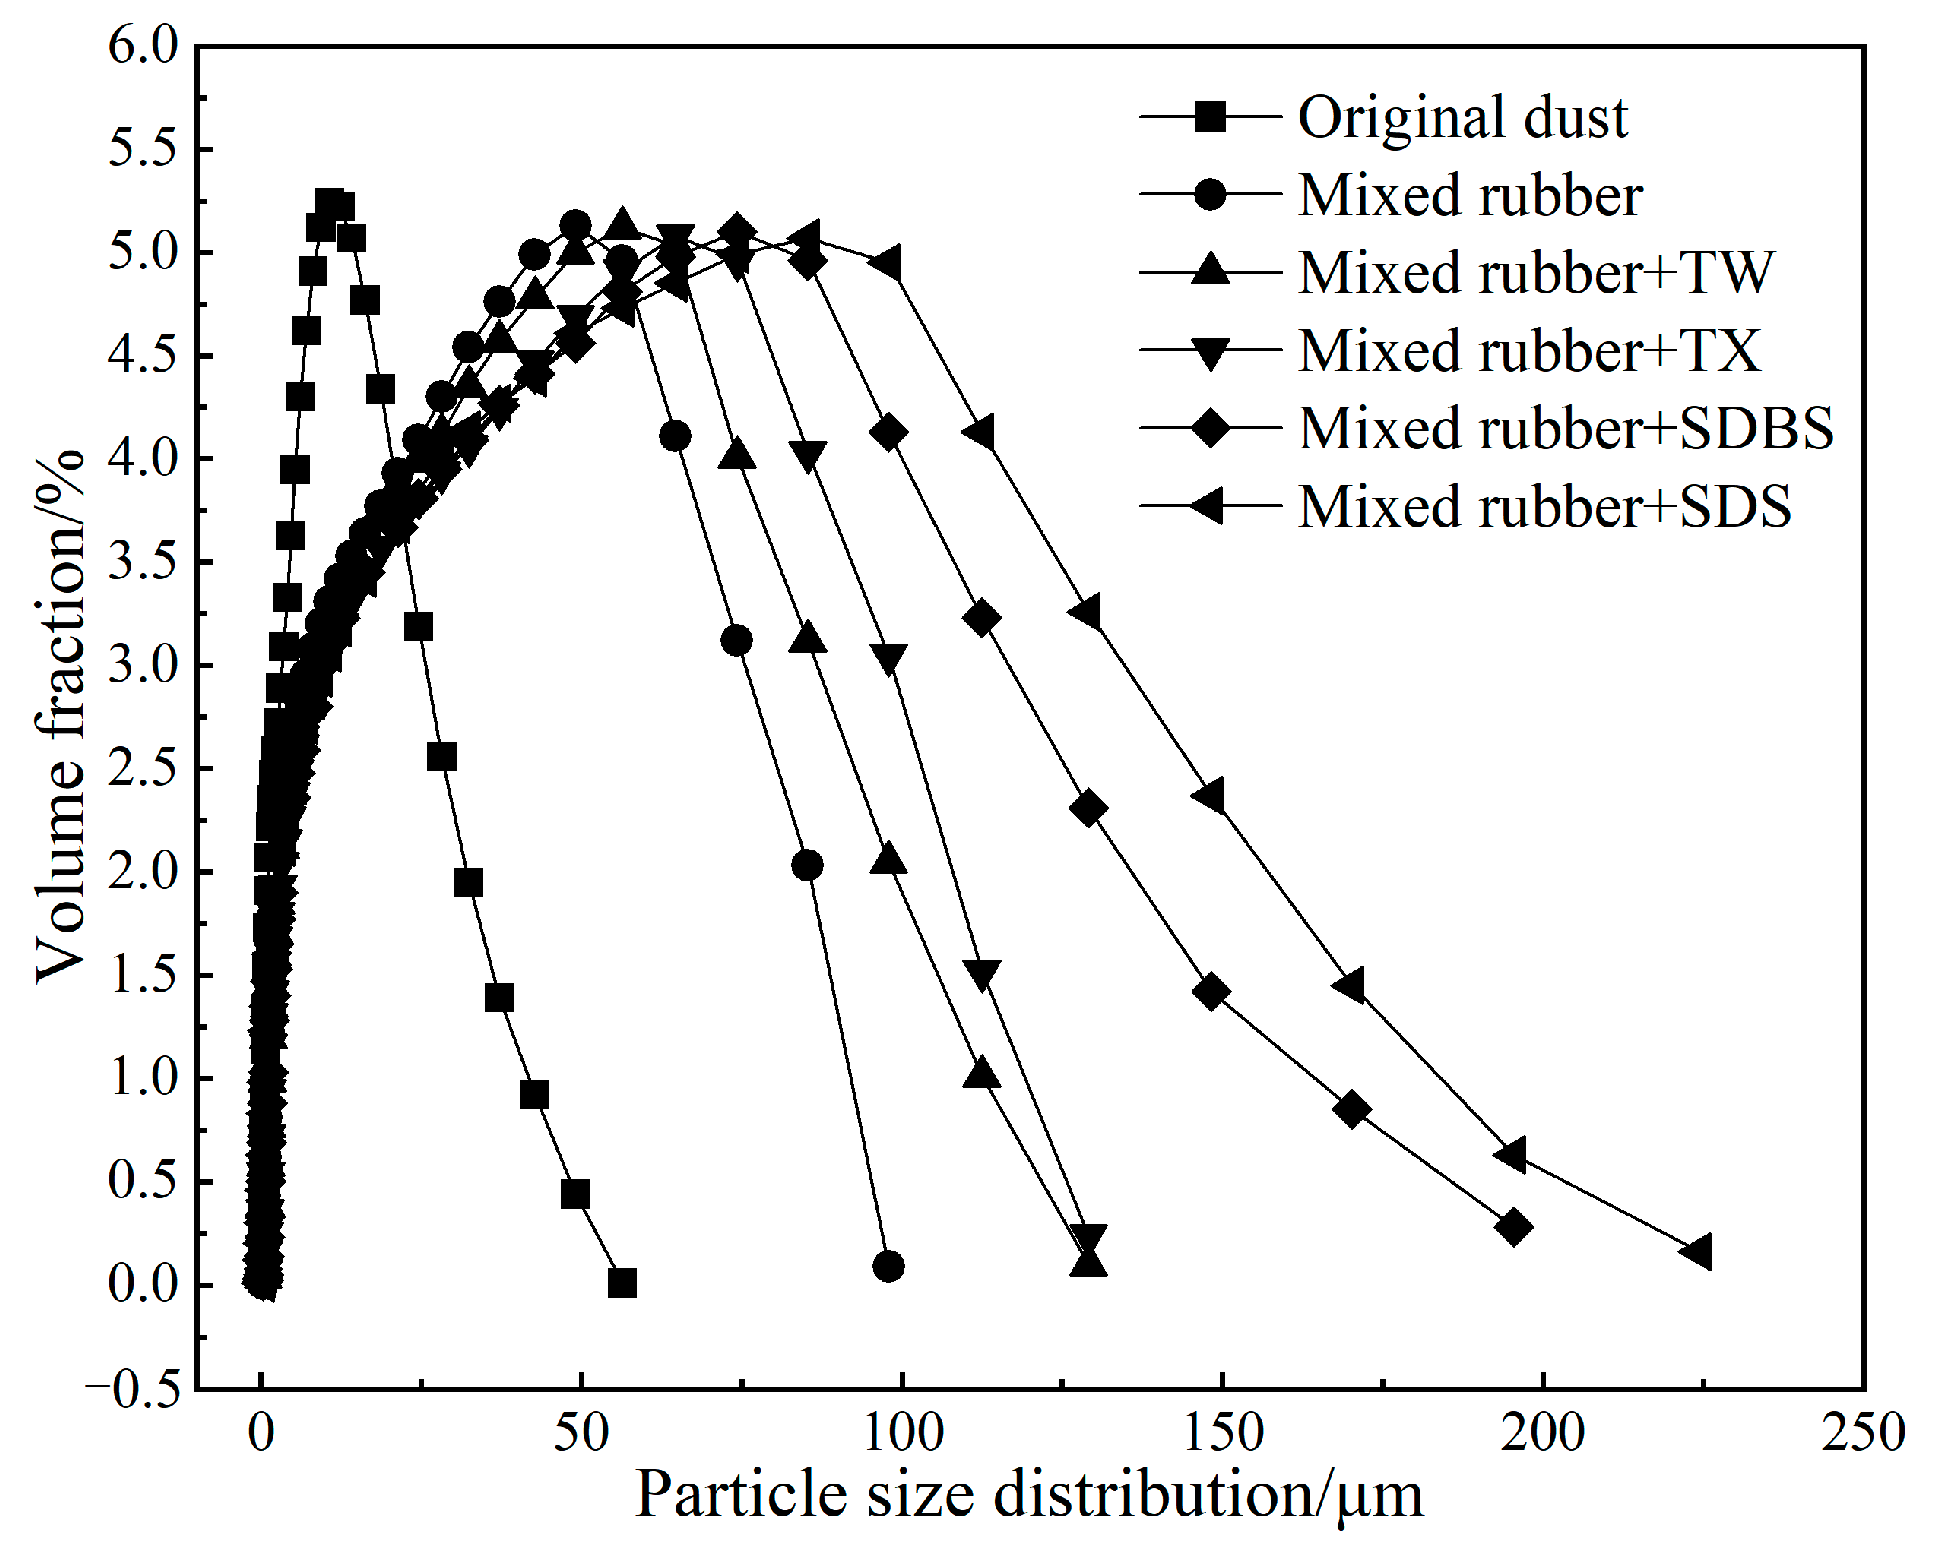
3.2. Effect of Different Coupled Agglomerates on Fine Dust Particles

The agglomerating agent will make the surface tension of the solution too high and reduce the wetting effect on dust, which in turn will affect the dust removal effect. Therefore, a combination of agglomerating agent and wetting agent was used for the experiment. As shown in Figure 5, the particle size distribution shifted to the right after the wetting agent was added. This indicates that the agglomerated droplets are more likely to adhere to the fine particles after wetting, and the adsorption reaction between the fine particles leads to further growth of the particles. The results are consistent with the study of Zhou [10]. Wetting agents improve the wetting ability of dust. Comparing the effect of the four wetting agents on particle growth, SDS has the largest right shift and the best effect. The particles grow significantly after agglomeration, with a peak particle size of 85.32 μm, which is about eight times larger. The wetting agents contributed to the particle growth, and the removal rates of PM2.5 and PM10 were improved to 51.46% and 53.13%, respectively.
The coupling agglomerating agent promotes fine dust with obvious effect under the action of the wetting agent. The wetting agent can reduce the surface tension of the droplets, which makes it easier for the droplets to unfold on the solid surface and the particles to agglomerate and condense [13]. On the other hand, the wetting agent adsorbed on the dust surface changes the charge state of the dust and increases the electrostatic force between the fine dust, which promotes the agglomeration of dust particles. As shown in Figure 6, the contact angle was reduced when the wetting agent was added to the agglomerate. In addition, the absolute value of the zeta potential increased when the nonionic wetting agent was added and decreased when the anionic wetting agent was added. The lower contact angle indicates that coupling agglomerate solution with dust wetting performance has the best SDS wetting effect. Zeta potential evaluates the strength of the interaction between particles. The higher the absolute value, the more stable the particle solution and the less likely aggregation is to occur. It can be inferred that the suspensions with lower zeta potential exhibited have better fine particle removal efficiency [17]. Comparing the zeta potential of the mixed gum solution of SDBS and SDS, it was found that the absolute value of the mixed gum solution of SDS was the smallest; therefore, the mixed gum solution of SDS was the easiest to coalesce.

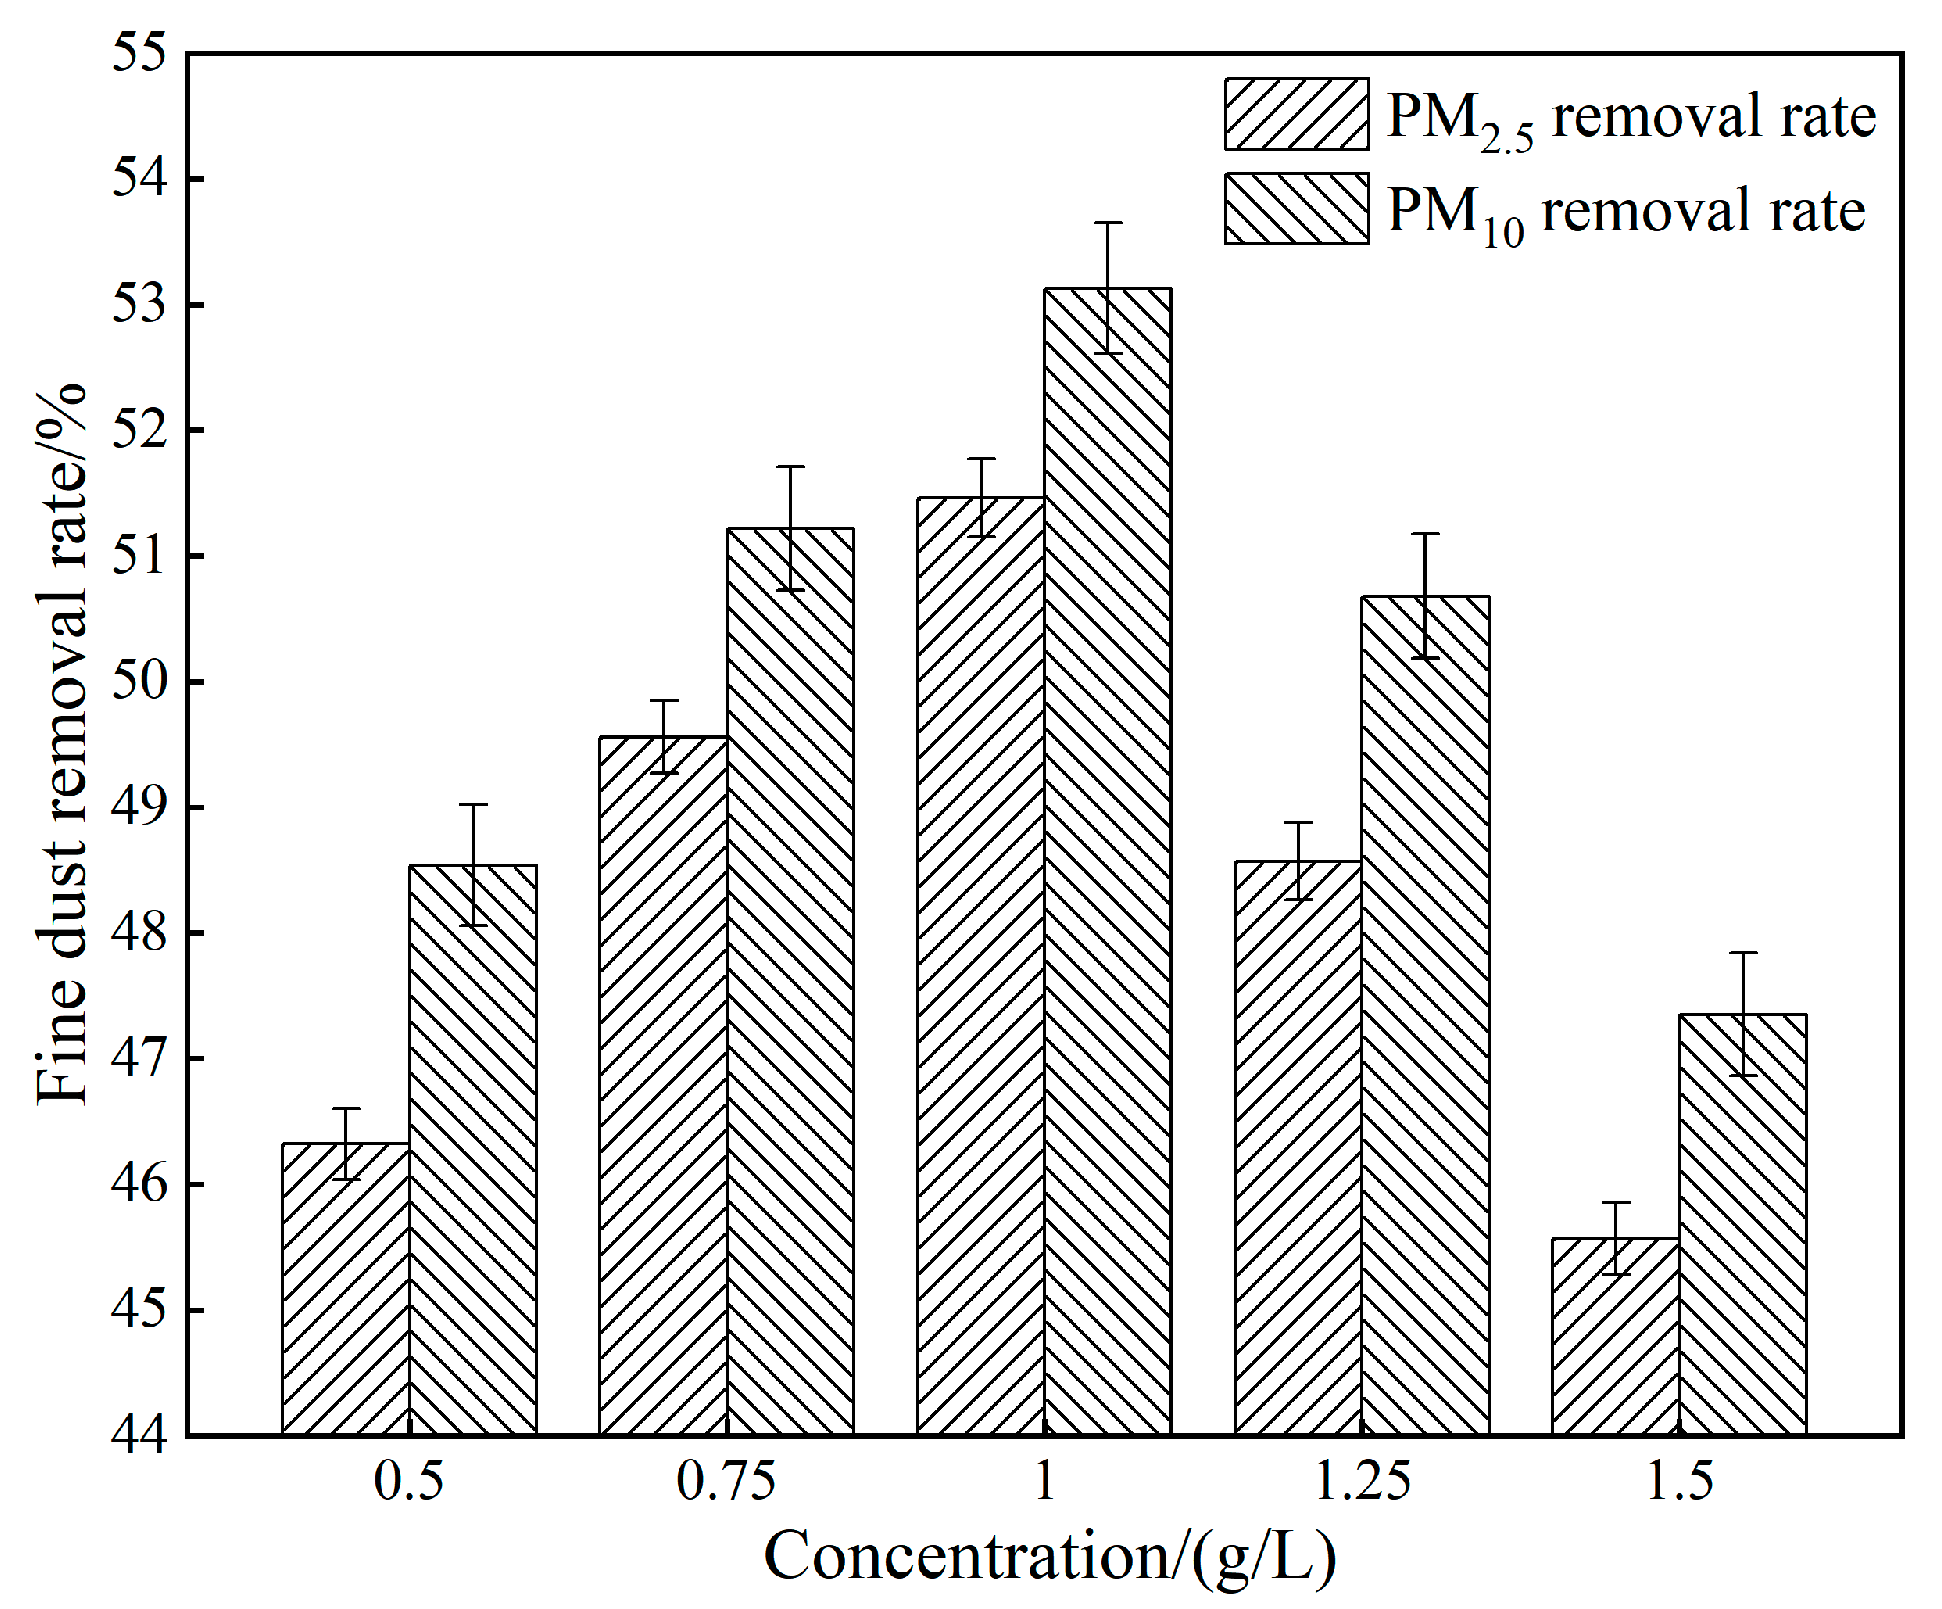
3.3. Effect of Mixed Gel Concentration on Fine Dust Particles

The effect of mixed gel concentration on fine dust particles is shown in Figure 7. As the agglomerate concentration increases, the dust removal efficiency shows an increase and then a decrease. This is because as the agglomerate concentration increases, the number of agglomerate molecules contained in the agglomerate droplets increases and the adhesion capacity to the dust increases, while the collision probability between the droplets and the dust also increases, which promotes dust agglomeration and thus improves the dust removal efficiency [15]. When the content of mixed gum is too high, it leads to an increase in the diameter of the agglomerate atomized droplets and thus a decrease in the number and difficulty in the expansion of macromolecular chains after adsorption on the particles [11]. This also leads to a low number of surface adsorption sites and thus a weakening of the positive effect of liquid bridge force formation, affecting fine particle agglomeration [18]. In conclusion, the optimal concentration of mixed gum solution is 1.0 g/L, corresponding to the highest efficiency of fine dust removal.

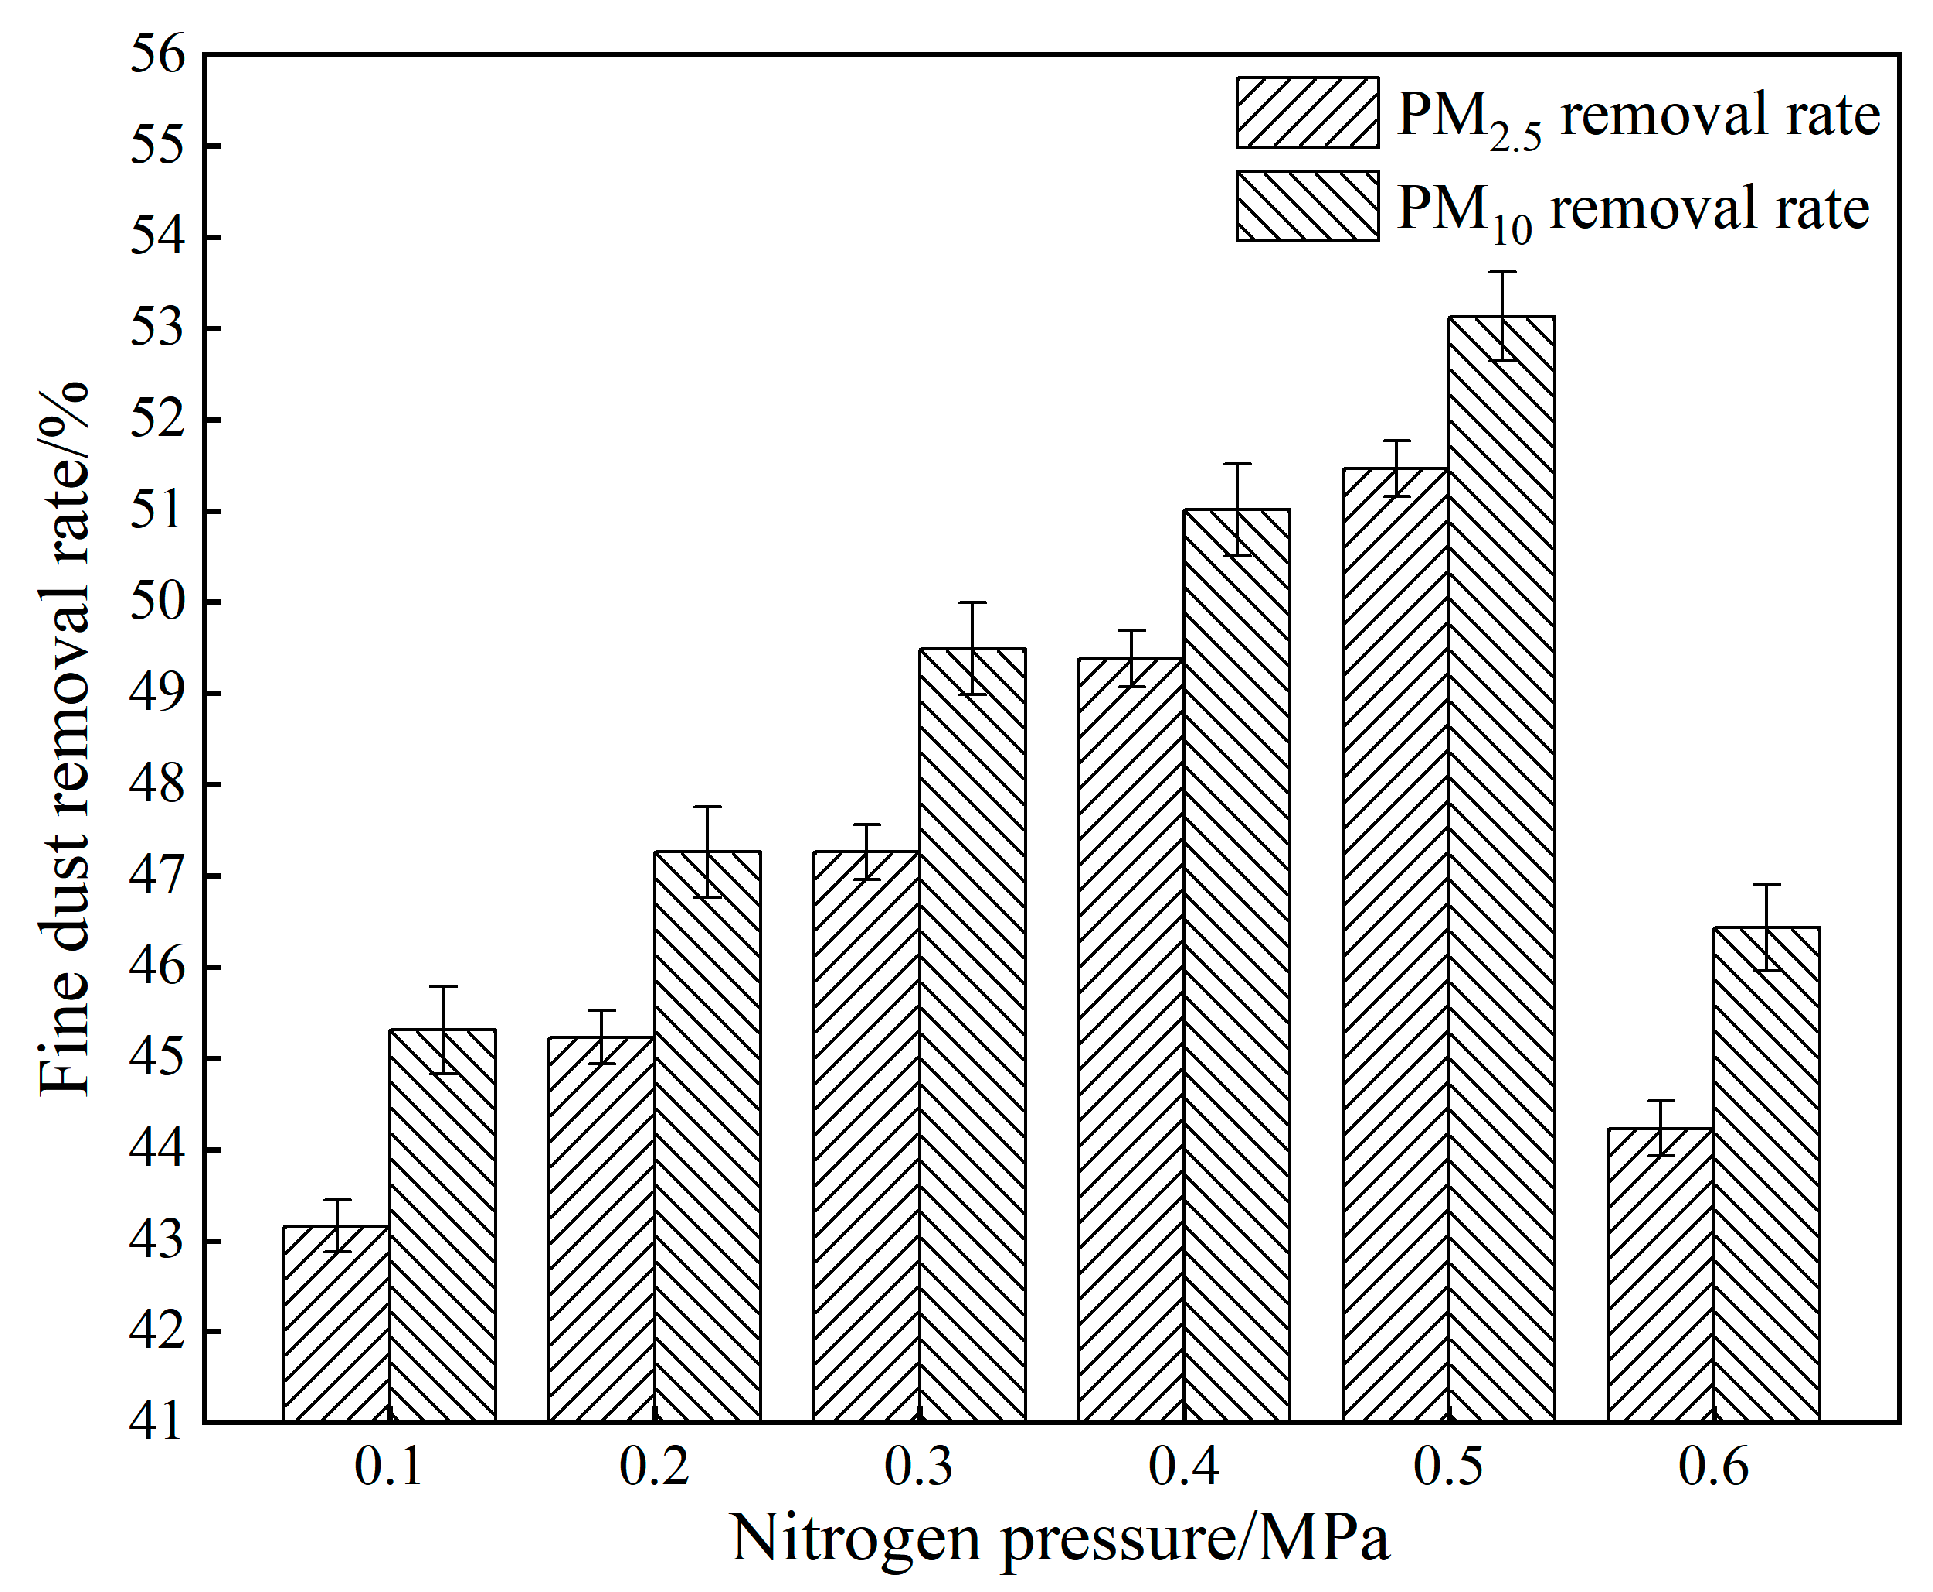
3.4. Effect of Gas Pressure on Fine Dust Particles

The interaction force between nitrogen and the agglomerate solution was utilized to break the solution into fine droplets using a two-phase flow nozzle. Therefore, the nitrogen pressure affects the atomization effect of the fluid and also plays a crucial role in the removal of fine dust. It can be seen in Figure 8 that as the pressure increases from 0.1 to 0.5 MPa, the removal rate of fine dust also increases, among which the removal rate of PM2.5 and PM10 increases from 43.16% to 51.46% and from 45.31% to 53.13%, respectively. However, when the pressure is higher than 0.5 MPa, the fine dust removal rate decreases significantly. The reason for this is that the increase in pressure is conducive to the generation of fine droplets, the possibility of collision and collection of droplets on fine particles is greatly enhanced, and the particle growth effect is more obvious. However, when the pressure reaches a critical value or is too high, on the one hand, the gas strongly cuts the solution, leading to the deterioration of the nozzle atomization droplets; on the other hand, it changes the agglomeration chamber disturbance velocity, resulting in an increased disturbance effect unfavorable to the adhesion between particles [15].

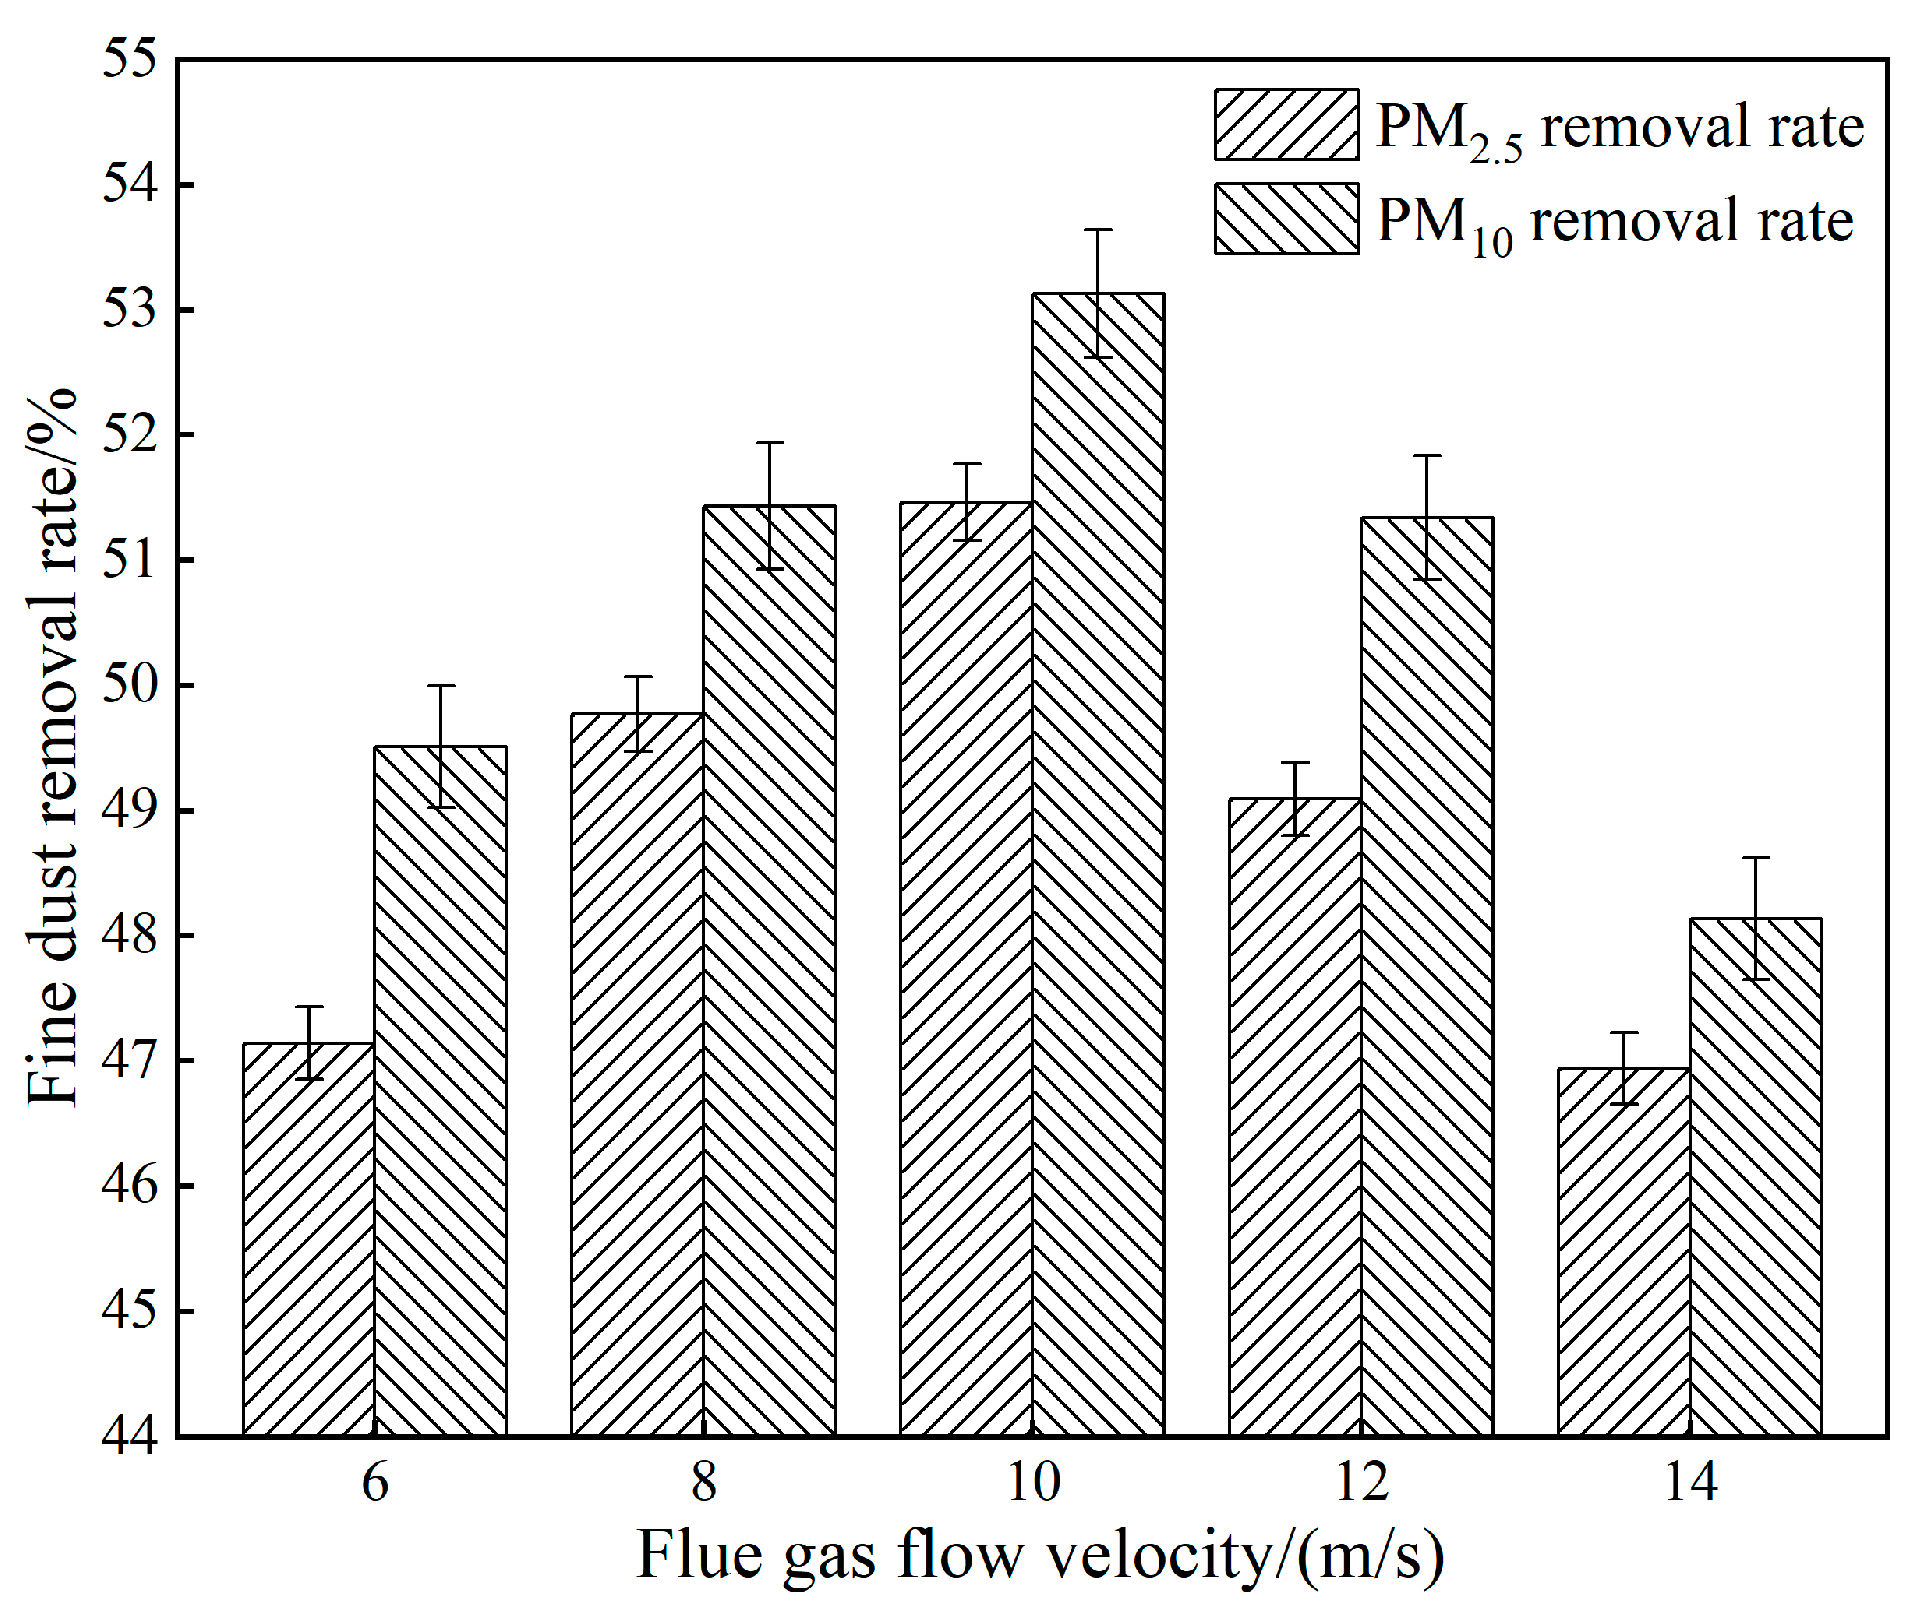
3.5. Effect of Flue Gas Flow Rate on Fine Dust Particles

From Figure 9, the fine dust removal rate increases and then decreases with the increase in the flue gas velocity, and the dust removal effect is generally poor on both sides. The reason is that as the flue gas velocity increases, the disturbance effect in the agglomeration chamber increases, leading to an increase in the probability of particle–droplet collision. When the flue gas velocity is higher than 10 m/s, the velocity of dust and agglomerate droplets decreases their reaction time in the agglomeration chamber [13], which leads to the decrease in particle capture by droplets. The highest dust removal rate was achieved when the flue gas flow rate was 10 m/s. Finally, the removal rates of PM2.5 and PM10 reached 51.46% and 53.13%, respectively.

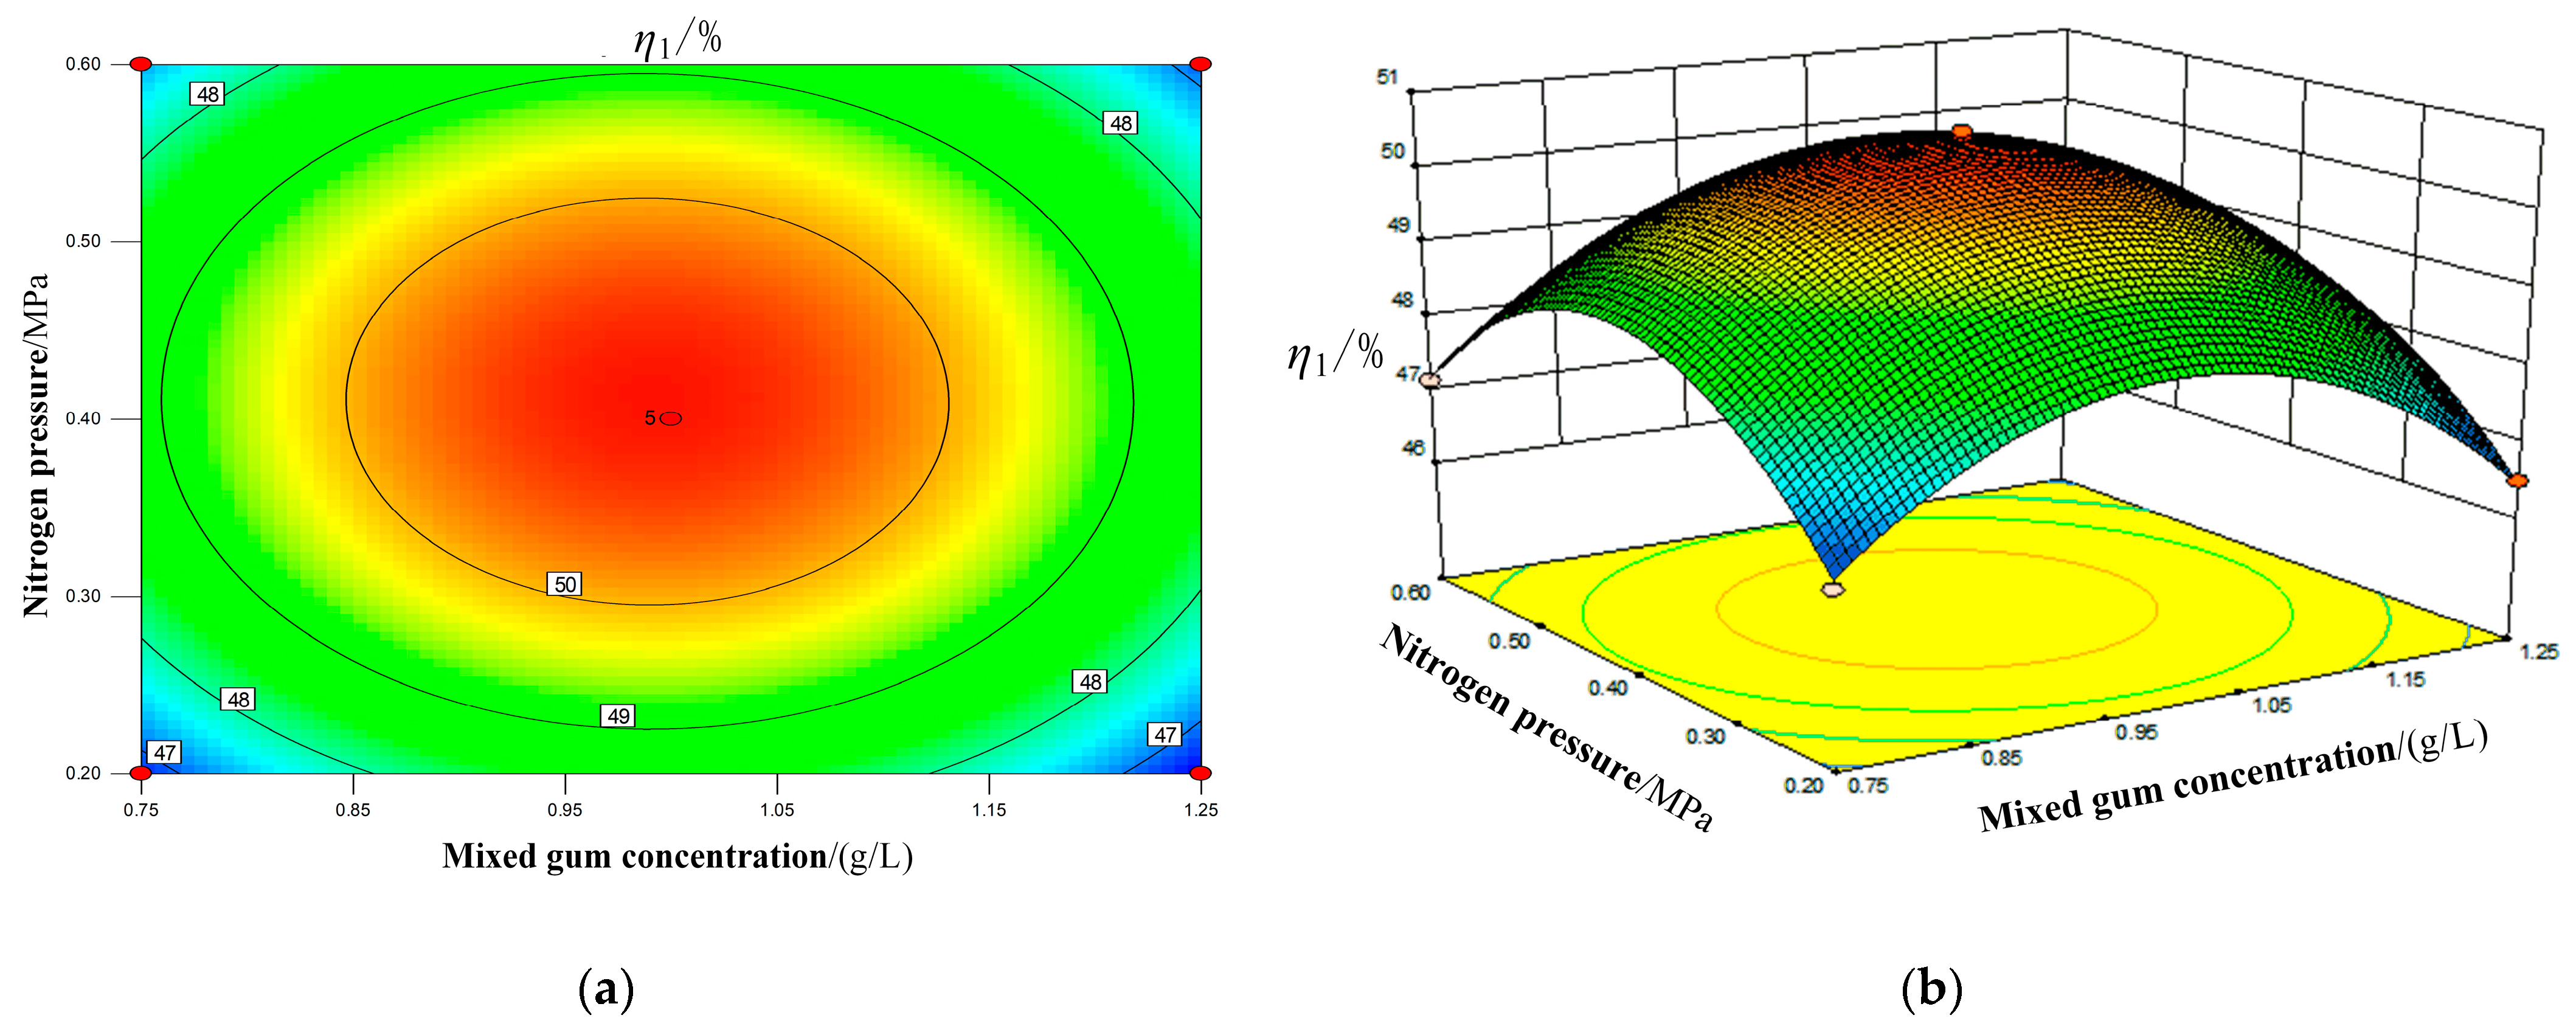
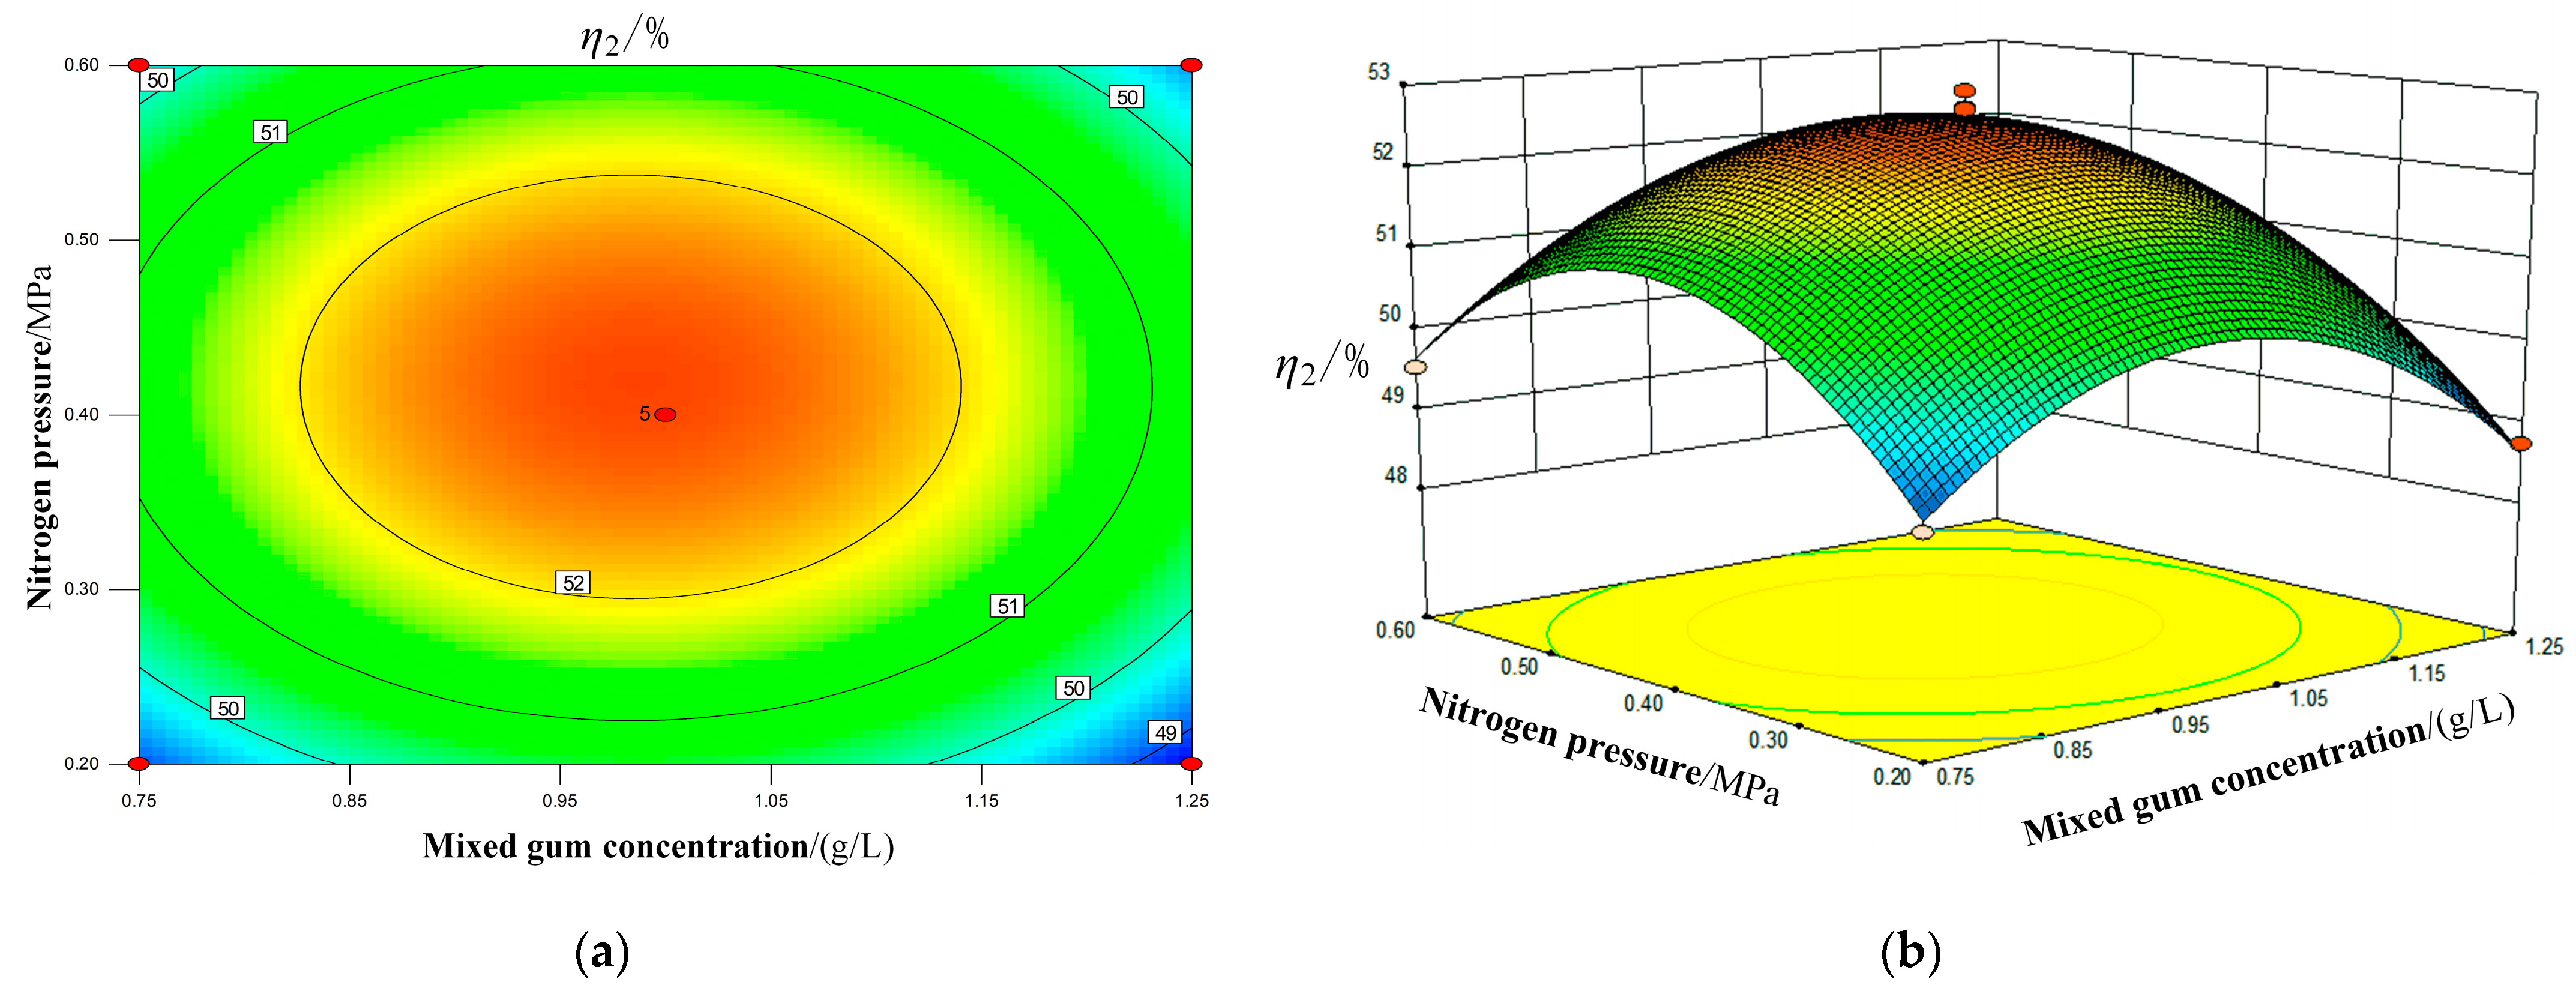
3.6. Response Surface Experiments

In order to find the optimal process conditions, the response surface experiments were conducted. Based on the experimental results, a three-factor, three-level response surface experiment was designed using Design-Expert. The mixed gel concentration (A), nitrogen pressure (B), and flue gas flow rate (C) were selected as independent variables by single-factor experiments, and PM2.5 and PM10 removal rates (η1 and η2) were used as response values, and their experimental protocols and results are shown in Table 2.
The results of the mathematical and statistical analysis of the experimental results using Design-Expert 8.0.6 software are shown in Table 3 and Table 4. After fitting, the regression equation with the dust removal rate as the response value was obtained as
η1 = 50.62 − 0.17 × A + 0.19 × B + 0.15 × C − 0.028 × A × B − 0.76 × A × C − 0.050 × B × C − 1.93 × A2 − 1.90 × B2 − 1.37 × C2
η2 = 52.65 − 0.22 × A + 0.30 × B − 0.081 × C − 7.500 × 10⁻³ × A × B − 0.047 × A × C − 0.15 × B × C − 1.70 × A2 − 1.83 × B2 − 1.60 × C2
As shown in Table 3, the PM2.5 model F = 107.41, p < 0.0001, indicating that the model is highly significant. The out-of-fit term F = 4.04, p = 0.1054 (>0.05), indicating that the regression equation is a good fit for the actual. In this case, B, AC, A2, B2, and C2 are the significant model terms. From Table 4, the PM10 model F = 40.04, p < 0.0001, indicating that the model is highly significant. The out-of-fit term F = 2.5, p = 0.1651 (>0.05), indicating that the regression equation is a good fit for the actual. In this case, B, A2, B2, and C2 are the significant model terms. From the data F-values in the table, it is known that the order of the intensity of each response factor on PM2.5 and PM10 removal efficiency is B (nitrogen pressure) > A (mixed gel concentration) > C (flue gas flow rate).
The response surface is a three-dimensional surface plot of the response values against each factor (A, B, C), in which the interaction of mixed gel concentration and nitrogen pressure has the most significant effect on PM2.5 and PM10 removal efficiency, as shown in Figure 10 and Figure 11. Figure 10 shows that the PM2.5 removal efficiency increases with the increase in mixed gel concentration and nitrogen pressure, and the best point changes to the mixed gel concentration of 0.99 g/L and nitrogen pressure of 0.41 MPa and reaches the maximum around this point. The PM2.5 removal efficiency starts to decrease when the parameters are increased again. Figure 11 shows that the PM10 removal efficiency increases with the increase in mixed gel concentration and nitrogen pressure, and the optimum point is near the mixed gel concentration of 0.98 g/L and nitrogen pressure of 0.42 MPa and reaches the maximum around this point. Then, the PM10 removal efficiency starts to decrease with the increase in parameter.
The optimal process parameters were obtained by Design-Expert 8.0.6 software, and the optimal process parameters were mixed gel concentration of 0.99 g/L, nitrogen pressure of 0.41 MPa, flue gas flow rate of 10.03 m/s, and the predicted PM2.5 and PM10 removal efficiencies of 50.63% and 52.67%. To verify the applicability of this model equation, the flue gas flow rate was set to 10 m/s, and the nitrogen pressure was set to 1 g/L and 0.40 MPa. To verify the applicability of this model equation, verification tests were conducted according to the optimized process parameters, and after three verification tests, we found that the optimized process parameters achieved 50.68% and 52.73% PM2.5 and PM10 removal efficiency. The experimental results are very close to the expected results, indicating that the applicability of the model equation is reliable and feasible.

4. Conclusions

To enhance the removal effect of chemical agglomeration on fine particulate matter in converter flue gas, the impact of different factors on the removal efficiency of PM2.5 and PM10 was studied during the experiment. The findings of the study are as follows:
(1) The best results in single chemical agglomeration experiments were achieved by using a mixed gum solution of xanthan gum and konjac gum, which produced a peak particle size of 49.1 μm, over twice as large as deionized water.
(2) In the wetting agent coupling screening experiment, a combination of 0.5 g/L SDS and 1 g/L mixed gum solution was the best agglomerator concentration since it provided the most effective dust wetting, thus promoting dust agglomeration and growth. The maximum particle size is 85.32 μm, about eight times greater. During this time, the PM2.5 and PM10 removal efficiency reached 51.46% and 53.13%, respectively.
(3) The Box–Behnken model was utilized to optimize the effects of the coupling agglomerator. The primary factors that influenced the PM2.5 and PM10 removal rates were identified. Additionally, the optimal process conditions were obtained with a mixed gel concentration of 1 g/L, nitrogen pressure of 0.4 MPa, and flue gas flow rate of 10 m/s. The model was tested and found to agree well with reality.

Author Contributions

Conceptualization, H.L. and H.X.; methodology, H.L.; software, H.X.; validation, H.L., G.Z., H.X. and J.Z.; formal analysis, H.X.; investigation, J.Z.; resources, H.L.; data curation, H.X.; writing—original draft preparation, H.X.; writing—review and editing, H.L.; supervision, G.Z.; project administration, H.L.; funding acquisition, H.L. All authors have read and agreed to the published version of the manuscript.

Funding

This research was supported by the Natural Science Foundation of Hebei Province (E2022209138) and Tangshan Science and Technology Plan Project (No.: 21130231C).

Data Availability Statement

The data that support the findings of this study are available from the corresponding author, upon reasonable request.

Acknowledgments

Thanks to the editors and reviewers of the journal for their suggestions on this article.

Conflicts of Interest

The authors declare no conflict of interest.

References

  1. Atkinson, R.W.; Mills, I.C.; Walton, H.A.; Anderson, H.R. Fine Particle Components and Health-a Systematic Review and Meta-Analysis of Epidemiological Time Series Studies of Daily Mortality and Hospital Admissions. J. Expo. Sci. Environ. Epidemiol. 2015, 25, 208–214. [Google Scholar] [CrossRef] [PubMed]
  2. Knaapen, A.M.; Borm, P.J.A.; Albrecht, C.; Schins, R.P.F. Inhaled Particles and Lung Cancer. Part A: Mechanisms. Int. J. Cancer 2004, 109, 799–809. [Google Scholar] [CrossRef] [PubMed]
  3. Chen, D.L.; Wu, K.; Mi, J.C. Experimental Investigation of Aerodynamic Agglomeration of Fine Ash Particles from a 330 Mw Pc-Fired Boiler. Fuel 2016, 165, 86–93. [Google Scholar] [CrossRef]
  4. Asanakham, A.; Kiatsiriroat, T. Use of Bluff Body for Enhancing Submicron Particle Agglomeration in Plasma Field. Part. Sci. Technol. 2018, 36, 123–130. [Google Scholar] [CrossRef]
  5. Yang, Z.D.; Cai, Y.X.; Li, Q.Y.; Li, H.Q.; Jiang, Y.; Lin, R.Y.; Zheng, C.H.; Sun, D.S.; Gao, X. Predicting Particle Collection Performance of a Wet Electrostatic Precipitator under Varied Conditions with Artificial Neural Networks. Powder Technol. 2021, 377, 632–639. [Google Scholar] [CrossRef]
  6. Wang, Y.; Yu, J.L.; Wang, Z.H.; Liu, Y.X.; Zhao, Y.C. A Review on Arsenic Removal from Coal Combustion: Advances, Challenges and Opportunities. Chem. Eng. J. 2021, 414, 128785. [Google Scholar] [CrossRef]
  7. Zu, K.; Yao, Y.; Cai, M.; Zhao, F.; Cheng, D.L. Modeling and Experimental Study on Acoustic Agglomeration for Dust Particle Removal. J. Aerosol Sci. 2017, 114, 62–76. [Google Scholar] [CrossRef]
  8. Sun, Z.K.; Yang, L.J.; Chen, S.; Wu, X. Promoting the Removal of Fine Particles by Turbulent Agglomeration with the Coupling of Different-Scale Vortexes. Powder Technol. 2020, 367, 399–410. [Google Scholar] [CrossRef]
  9. Luo, Z.Y.; Chen, H.; Wang, T.; Zhou, D.; Lu, M.S.; He, M.C.; Fang, M.X.; Cen, K.F. Agglomeration and Capture of Fine Particles in the Coupling Effect of Pulsed Corona Discharge and Acoustic Wave Enhanced by Spray Droplets. Powder Technol. 2017, 312, 21–28. [Google Scholar] [CrossRef]
  10. Zhou, L.; Liu, Y.; Luo, L.Y.; Yuan, Z.L.; Yang, L.J.; Wu, H. Improving the Removal of Fine Particles by Chemical Agglomeration During the Limestone-Gypsum Wet Flue Gas Desulfurization Process. J. Environ. Sci. 2019, 80, 35–44. [Google Scholar] [CrossRef] [PubMed]
  11. Shen, X.K.; Sun, D.S.; Liu, Y.L.; Yu, Y.; Yan, P.L. Agglomeration and removal of coal-fired particulate matter under the action of chemical agglomeration agent. Environ. Sci. Technol. 2017, 40, 111–116. [Google Scholar]
  12. Dai, M.B.; Ruan, Z.Y.; Geng, Y.; Li, W.C.; Mu, G.T.; Chun, T.J. Study on removal of PM10/2.5/1.0 based on chemical agglomerated iron ore sintering process. J. Iron Steel Res. 2021, 33, 385–393. [Google Scholar]
  13. Liu, Y.; Hu, B.; Zhou, L.; Jiang, Y.Z.; Yang, L.J. Improving the Removal of Fine Particles with an Electrostatic Precipitator by Chemical Agglomeration. Energy Fuels 2016, 30, 8441–8447. [Google Scholar] [CrossRef]
  14. Ding, X.H.; Wang, D.F.; Luo, Z.M.; Wang, T.; Deng, J. Multi-Scale Study on the Agglomerating and Wetting Behaviour of Binary Electrolyte-Surfactant Coal Dust Suppression Based on Multiple Light Scattering. Fuel 2022, 311, 122515. [Google Scholar] [CrossRef]
  15. Zhou, L.; Chen, W.; Wu, H.; Shen, A.; Yuan, Z.L.; Yang, L.J. Investigation on the Relationship of Droplet Atomization Performance and Fine Particle Abatement During the Chemical Agglomeration Process. Fuel 2019, 245, 65–77. [Google Scholar] [CrossRef]
  16. Shi, G.Q.; Qi, J.M.; Wang, Y.M.; Shen, H.Y. Synergistic Influence of Noncationic Surfactants on the Wettability and Functional Groups of Coal. Powder Technol. 2021, 385, 92–105. [Google Scholar] [CrossRef]
  17. Guo, Y.Q.; Zhao, Y.C.; Wang, S.L.; Jiang, C.; Zhang, J.Y. Relationship between the Zeta Potential and the Chemical Agglomeration Efficiency of Fine Particles in Flue Gas During Coal Combustion. Fuel 2018, 215, 756–765. [Google Scholar] [CrossRef]
  18. Guo, Y.Q.; Zhang, J.Y.; Zhao, Y.C.; Wang, S.L.; Jiang, C.; Zheng, C.G. Chemical Agglomeration of Fine Particles in Coal Combustion Flue Gas: Experimental Evaluation. Fuel 2017, 203, 557–569. [Google Scholar] [CrossRef]
Figure 1. Diagram of chemical agglomeration experimental device. 1—air preheating chamber; 2—blower; 3—electromagnetic vibration powder feeder; 4—buffer premixing chamber; 5—gas–liquid two-phase flow nozzle; 6—chemical agglomeration chamber; 7—dust particles; 8—agglomerated liquid droplets; 9—waste liquid collection device; 10—sampling device; 11—nitrogen bottle; 12—agglomerate solution pool; 13—liquid flow meter; 14—centrifugal pump; 15—rotary screw valve; and 16—pressure gauge.
Processes 11 02573 g001
Figure 2. Particle size distribution of raw dust.
Processes 11 02573 g002
Figure 3. Effect of agglomerating agent on dust.
Processes 11 02573 g003
Figure 4. Effect of temperature on solution viscosity.
Processes 11 02573 g004
Figure 5. Effect of different coupling agglomerates.
Processes 11 02573 g005
Figure 6. Zeta potential and contact angle of the solution.
Processes 11 02573 g006
Figure 7. Dust removal rate of different solution concentrations.
Processes 11 02573 g007
Figure 8. Dust removal rates for different nitrogen pressures.
Processes 11 02573 g008
Figure 9. Dust removal rate with different flue gas flow rates.
Processes 11 02573 g009
Figure 10. (a) Contour plot of PM2.5 where mixed glue concentration and nitrogen pressure interact with each other; (b) response surface diagram of PM2.5 where mixed glue concentration and nitrogen pressure interact with each other.
Processes 11 02573 g010
Figure 11. (a) Contour diagram of PM10 where mixed glue concentration and nitrogen pressure affect each other; (b) response surface diagram of PM10 where mixed glue concentration and nitrogen pressure affect each other.
Processes 11 02573 g011
Table 1. Box–Behnken test factors and levels.
LevelFactor
A, Mixed Gel Concentration
/(g/L)
B, Nitrogen Pressure
/MPa
C, Flue Gas Flow Velocity
/(m/s)
10.750.28
010.410
−11.250.612
Table 2. Box–Behnken test protocol and response values.
Serial NumberA, Mixed Gum Concentration/(g/L)B, Nitrogen Pressure/MPaC, Flue Gas Flow Velocity/(m/s)η1/%η2/%
10.750.21046.6148.92
21.250.21046.4948.73
30.750.61047.1449.53
41.250.61046.9149.31
50.750.4846.5149.97
61.250.4847.5249.37
70.750.41248.6349.43
81.250.41246.5948.64
910.2847.1548.63
1010.6847.5449.52
1110.21247.2549.24
1210.61247.4449.53
1310.41050.3752.41
1410.41050.6152.76
1510.41050.6952.97
1610.41050.6852.37
1710.41050.7352.75
Table 3. Analysis of PM2.5 regression equation variance.
Variance SourceSum of SquaresDegree of FreedomMean SquareF-ValueProb > FSignificance
Model46.2795.14107.41<0.0001Significant
A0.2410.244.970.0610
B0.2910.296.110.0427Significant
C0.1810.183.700.0959
AB3.025 × 10−3 13.025 × 10−30.0630.8087
AC2.3312.3348.590.0002Significant
BC0.01010.0100.210.6615
A215.69115.69327.85<0.0001Significant
B215.17115.17316.90<0.0001Significant
C27.9417.94165.83<0.0001Significant
Residual0.3470.048
Loss of proposed project0.2530.0844.040.1054Insignificant
Table 4. Analysis of PM10 regression equation variance.
Variance SourceSum of SquaresDegree of FreedomMean SquareF-ValueProb > FSignificance
Model42.5794.7340.04<0.0001Significant
A0.4110.413.430.1065
B0.7010.705.940.0449Significant
C0.05310.0530.450.5252
AB2.250 × 10−412.250 × 10−41.90 × 10−30.9664
AC9.025 × 10−319.025 × 10−30.0760.7902
BC0.0910.090.760.4117
A212.22112.22103.42<0.0001Significant
B214.04114.04118.82<0.0001Significant
C210.73110.7390.77<0.0001Significant
Residual0.8370.12
Loss of proposed project0.5730.192.900.1651Insignificant
Disclaimer/Publisher’s Note: The statements, opinions and data contained in all publications are solely those of the individual author(s) and contributor(s) and not of MDPI and/or the editor(s). MDPI and/or the editor(s) disclaim responsibility for any injury to people or property resulting from any ideas, methods, instructions or products referred to in the content.

