Article

The Adhesion Strength of Semi-Clathrate Hydrate to Different Solid Surfaces

1
State Key Laboratory of Heavy Oil Processing, China University of Petroleum-Beijing at Karamay, Karamay 834000, China
2
College of Mechanical and Transportation Engineering, China University of Petroleum-Beijing, Beijing 102249, China
3
State Key Laboratory of Heavy Oil Processing, China University of Petroleum-Beijing, Beijing 102249, China
4
PetroChina Research Institute of Petroleum Exploration and Development, Beijing 100083, China
*
Author to whom correspondence should be addressed.
Processes 2023, 11(9), 2720; https://doi.org/10.3390/pr11092720
Submission received: 5 August 2023 / Revised: 29 August 2023 / Accepted: 9 September 2023 / Published: 12 September 2023
(This article belongs to the Section Chemical Processes and Systems)

Abstract

:
The adhesion between a hydrate and a pipe wall is the main cause of hydrate deposition and blockage. In this study, the adhesion strength of semi-clathrate hydrate (tetrabutylammonium bromide hydrate) to four kinds of solid surfaces (E235B carbon steel, E355CC low alloy steel, SUS304 stainless steel, and polytetrafluoroethylene) was measured. This investigation reveals that the adhesion strength of the hydrate to a solid surface is negatively correlated with the wettability of the solid surface, which suggests that hydrophobic materials effectively reduced the hydrate adhesion to the pipe wall. The surface roughness showed different effects on the adhesion of the hydrate to hydrophilic or hydrophobic surfaces. To be specific, when the surface roughness increased from 3.2 µm to 12.5 µm, the hydrate adhesion strength to the hydrophilic surface of SUS304 increased by 123.6%, whereas the hydrate adhesion strength to the hydrophobic surface of polytetrafluoroethylene only increased by 21.5%. This study shows that low wettability and low surface roughness effectively reduce the critical rate required to remove hydrate deposition, which achieves the self-removal of hydrates. At the same time, it was found that the adhesion strength of the hydrate to surfaces increases with increasing subcooling. This investigation holds significant theoretical implications for designing self-cleaning surfaces for oil and gas pipes.

1. Introduction

Natural gas hydrates are non-stoichiometric crystalline compounds formed by small gas molecules (methane, ethane, propane, carbon dioxide, hydrogen sulfide, etc.) and water molecules under low-temperature and high-pressure conditions [1,2,3]. The water molecules are bonded together under the interaction of hydrogen bonds, and the gas molecules are trapped in the cavities by Van der Waals forces [4]. Hydrates have a wide range of applications in the field of energy based on their physical and chemical properties [5,6,7,8]. But hydrates also have some negative effects on the energy industry. The pipe blockage caused by hydrates is a common problem in oil/gas fields. The adhesion of hydrates to the pipe’s inner surface causes the blockage of the pipe, which reduces the efficiency of oil/gas transportation [9,10,11]. The mechanism of hydrate blockage in pipes can be divided into three types according to the transport medium. The three types are gas-dominated, water-dominated, and oil-dominated systems.
For gas-dominated systems [12,13,14], a four-stage conceptual model is used to describe the hydrate formation and blockage mechanism, as shown in Figure 1: A hydrate forms on the inner surface of the pipe and gradually enlarges until the entire pipe wall is covered in the hydrate. Then, the hydrate in the pipe is accompanied by a radial growth process, which leads to a reduction in the throughflow area of the pipe. The reduction in the throughflow area causes an increase in the velocity of the gas flow, which leads to an increase in the shear force on the hydrate layer, and that results in part of the hydrate being stripped away from the wall. Finally, the exfoliated hydrate adheres to the inner surface of the pipe and forms a blockage.
For water-dominated systems [15,16], a three-stage conceptual model is used to describe the hydrate formation and blockage mechanism. Under the effects of gas–liquid entrainment and mass transfer, the hydrate slurry forms a homogeneous flow in the pipe. With an increasing volume of hydrate fraction, the flow pattern of the hydrate slurry changes from a homogeneous flow to a heterogeneous flow in the pipe. Finally, the hydrate blocks the pipe due to the adhesion and deposition of the hydrate to the pipe.
For oil-dominated systems [17,18], a four-stage conceptual model is used to describe the hydrate formation and blockage mechanism: Under the shearing of a moving fluid, water droplets are emulsified, resulting in the formation of water-in-oil emulsions. Hydrate particles are formed at the droplet—oil interface. Particle aggregation occurs as a result of the adhesive forces acting between individual particles, causing them to form aggregates that hydrate. Hydrate agglomeration occurs along the inner surface of the pipe, leading to the gradual constriction of the flow path, ultimately resulting in the hydrate blockage in the pipe. In summary, hydrate deposition is primarily caused by the adhesion of hydrate particle-to-particle and the adhesion of hydrate particle-to-pipe inner surface. The adhesion strength of the hydrate particle-to-particle and the adhesion strength of the hydrate particle-to-pipe inner surface provide an essential insight into the mechanism of hydrate deposition and blockage.
Hydrate particle-to-particle adhesion has been the focus of research in the past [19,20]. Micromechanical measuring methods are the main way to measure the adhesion strength of hydrate particle-to-particle adhesion. The adhesion strength of cyclopentane (CyC5) hydrate particle-to-CyC5 hydrate particle and the adhesion strength of CyC5 hydrate particle-to-quartz calcite minerals were separately determined by Aman et al. using a micromechanical force gauge. The results show that a change in the substrate properties will lead to a change in the adhesion strength between the hydrate and substrate surface [21]. The micromechanical force method was used to measure the adhesion strength of tetrahydrofuran hydrate particle-to-CyC5 hydrate particle in the presence of hydrate inhibitors. Zhang et al. [22] studied the wall adhesion strength of the hydrate by spraying a coating on the substrate surface. The results suggest that the CeO2/pDA@X80 coating can drastically avoid the influence of a deposited water drop on the hydrate adhesion of X80. Aspenes et al. [23] investigated the adhesion forces between CyC5 hydrates and solid surfaces as a function of the solid material, the presence of water, and the presence of petroleum acids in the oil phase. The results indicated that the adhesion force between the hydrate and the solid surface was more than 10 times larger than the hydrate–hydrate adhesion forces. Nicholas et al. [24] measured the adhesive forces between CyC5 hydrates and carbon steel. They found that these forces were found to be substantially lower than the CyC5 hydrate–CyC5 hydrate particle measurements.
In addition to the application of micromechanical measuring instruments, some researchers have employed self-built apparatus to quantify hydrate adhesion strength: Matsumoto et al. conducted experiments on the adhesion of tetrabutylammonium bromide (TBAB) hydrate to copper surfaces under horizontal conditions using a self-constructed apparatus to study the effect of temperature on the adhesion strength. The results indicated that the shearing stress did not depend on the type of TBAB hydrate crystal [25]. Therefore, a semi-clathrate hydrate of TBAB can be used as a substitute for the study of a natural gas hydrate. A self-built shear strength measuring device was used to investigate the effect of subcooling, the reaction time, the surface roughness, and the solid surface energy on the adhesion strength of the CyC5 hydrate [26]. Subcooling is the difference between the experimental temperature and the hydrate equilibrium temperature. They found that the required critical velocity to remove the hydrate deposition corresponding to the sintered hydrate was much higher compared with the settling-down hydrate [27]. Therefore, it is particularly important to further clarify the corresponding relationship between the adhesion strength of the sintered hydrate and the wall surface. However, few attempts have been made in the literature to investigate the adhesion force between the hydrate layer and the pipe wall [28]. In addition, computational simulation would be a valuable method in further studies due to the lower cost and faster results of computational simulation [29,30].
In this investigation, a self-built tension meter was employed to measure the adhesion strength of semi-clathrate hydrates to different solid surfaces under various conditions of surface wettability, roughness, and subcooling. The basic data of the adhesion strength between the hydrate layer and the solid surface will be supplemented through this study. At the same time, a new measurement method is also proposed. TBAB hydrate was used in this study due to the fact that TBAB is the most commonly used research object under atmospheric pressure. The results of this investigation provide detailed awareness regarding the adhesion strength of hydrate to the walls. The hydrate adhesion mechanism was fundamentally explored, and this investigation holds significant theoretical implications for designing self-cleaning surfaces for oil and gas pipes.

2. Materials and Methods

2.1. Materials

In this work, TBAB with a purity of 99 mass% was purchased from Shanghai Aladdin Biochemical Technology Co., Ltd. (Shanghai, China). The solution was prepared with deionized water made by a Smart-Q15 ultrapure water machine produced by Hitech Instruments Co., Ltd. (Shanghai, China), and the concentration of the TBAB solution used in this work was 35 mass%. The resistivity of the deionized water was 18 MΩ·cm. The solid surface materials are available in four different kinds of specimens, which are Q235B carbon steel (ISO: E235B [31]), Q345B low alloy steel (ISO: E355CC [31]), 06cr19ni10 stainless steel (SUS304), and polytetrafluoroethylene (PTFE). The specimens have a diameter of 10 mm and a length of 200 mm. For each kind of surface material, there are three different surface roughness. E235B: Ra 0.8 µm, Ra 3.2 µm, and Ra 12.5 µm. E355CC: Ra 3.2 µm, Ra 6.3 µm, and Ra 12.5 µm. SUS304: Ra 3.2 µm, Ra 6.3 µm, and Ra 12.5 µm. PTFE: Ra 3.2 µm, Ra 6.3 µm, and Ra 12.5 µm. The specimens are manufactured by Beijing Yongruida Technology Trade Co., Ltd. (Beijing, China). The surface roughness was measured at different parts of the specimens by a roughness tester model KH-100 to ensure the accuracy of the roughness.

2.2. Experimental Apparatus

Figure 2 illustrates the schematic diagram of the self-built apparatus utilized for measuring the adhesion strength of the hydrate to the solid surface. The apparatus is comprised of four major systems, which are the hydrate formation system, the adhesion strength testing system, the temperature control system, and the data acquisition system. The hydrate formation system comprises a reaction cell, a magnetic stirrer, and a magneton. The reaction cell (45 mm × 55 mm × 90 mm) has good visibility, and it is made of a polymethyl methacrylate material. The adhesion testing system includes a lifting platform, a clamping device, and a tension transducer. The tension transducer model is ZP100 (Shenzhen Ailigu Instrument Co., Ltd., Shenzhen, China). The clamping device, which clamps one end of the specimen to maintain a stable vertical position, is attached to the bottom of the extensometer. The lifting platform is used to move the tension transducer and specimen vertically. The adhesion testing system is placed in an air bath (Beijing Yongruida Technology Trade Co., Ltd., Beijing, China). The experimental temperature is controlled by an air bath and a controller. The Pt100 platinum resistance is used to measure the temperature. The PT100 platinum resistance was calibrated within the temperature range of 273.15~293.15 K using the YQ170 temperature scaling device manufactured by Hubei Jianghan Petroleum Instrument & Meter Co., Ltd., Wuhan, China. The absolute error between the calibrated temperature measurements and the standard values provided by the calibration device was kept within 0.05 K. The data acquisition system mainly includes a computer and a paperless recorder.

2.3. Experimental Procedure

The specific operation steps were as follows: First, the TBAB solution was made with deionized water. Next, 100.0 mL of the prepared solution was transferred into the reaction cell. Second, the magnetically stirred reaction cell was fixed on the stationary table of the lifting platform. Simultaneously, the specimen was kept vertically using the gripper of the tensiometer. The height of the solution was kept at 5.0 mm higher than the bottom of the specimen using the lifting platform. Third, the air bath kept the temperature of the system at the experimental temperature. Once the temperature of the system reached the target experimental temperature, the magnetic stirrer was turned on. The hydrate formed rapidly after the induction period. The adhesion measurement was carried out after the hydrate was formed in 350 min. Fourth, the tensiometer was turned on to record the data, and the specimen was pulled out of the hydrate. The highest reading displayed by the sensor represented the adhesion strength of the hydrate to the solid surface.

3. Results and Discussion

3.1. The Temporal Evolution of Temperature during the Adhesion Measurement

Figure 3 illustrates the temporal evolution of the temperature during the adhesion measurement of the TBAB hydrate to the surface. The line between A and B shows the solution temperature during the process of cooling. The solution temperature was decreased to the experimental temperature over a period of 93 min (Dotted line 2). The line between B and C shows the solution temperature during the process of hydrate formation induction. The TBAB hydrate induction time is between 120 min and 180 min under atmospheric pressure. The line between C and D shows the solution temperature during the process of rapid hydrate formation. The hydrate formation and exotherm caused the temperature to rise rapidly, and the temperature curve shows an obvious exothermic peak (Dotted line 1). The line between D and E shows the solution temperature change during the process of slow hydrate formation. As the hydrate formation rate and heat exotherm decreased, the temperature decreased to the experimental temperature. The line between E and F shows the solution temperature during the process of stabilization. The system remained in a stable state after the hydrate formation was completed. The adhesion force was measured at this stage. The line between F and G shows the solution temperature during the process of hydrate dissociation. The hydrate dissociated by increasing the system temperature after the adhesion force measurement. When the time exceeds 520 min, the hydrate has been completely dissolved.

3.2. The Effect of Solid Surface Wettability on Hydrate Adhesion Strength

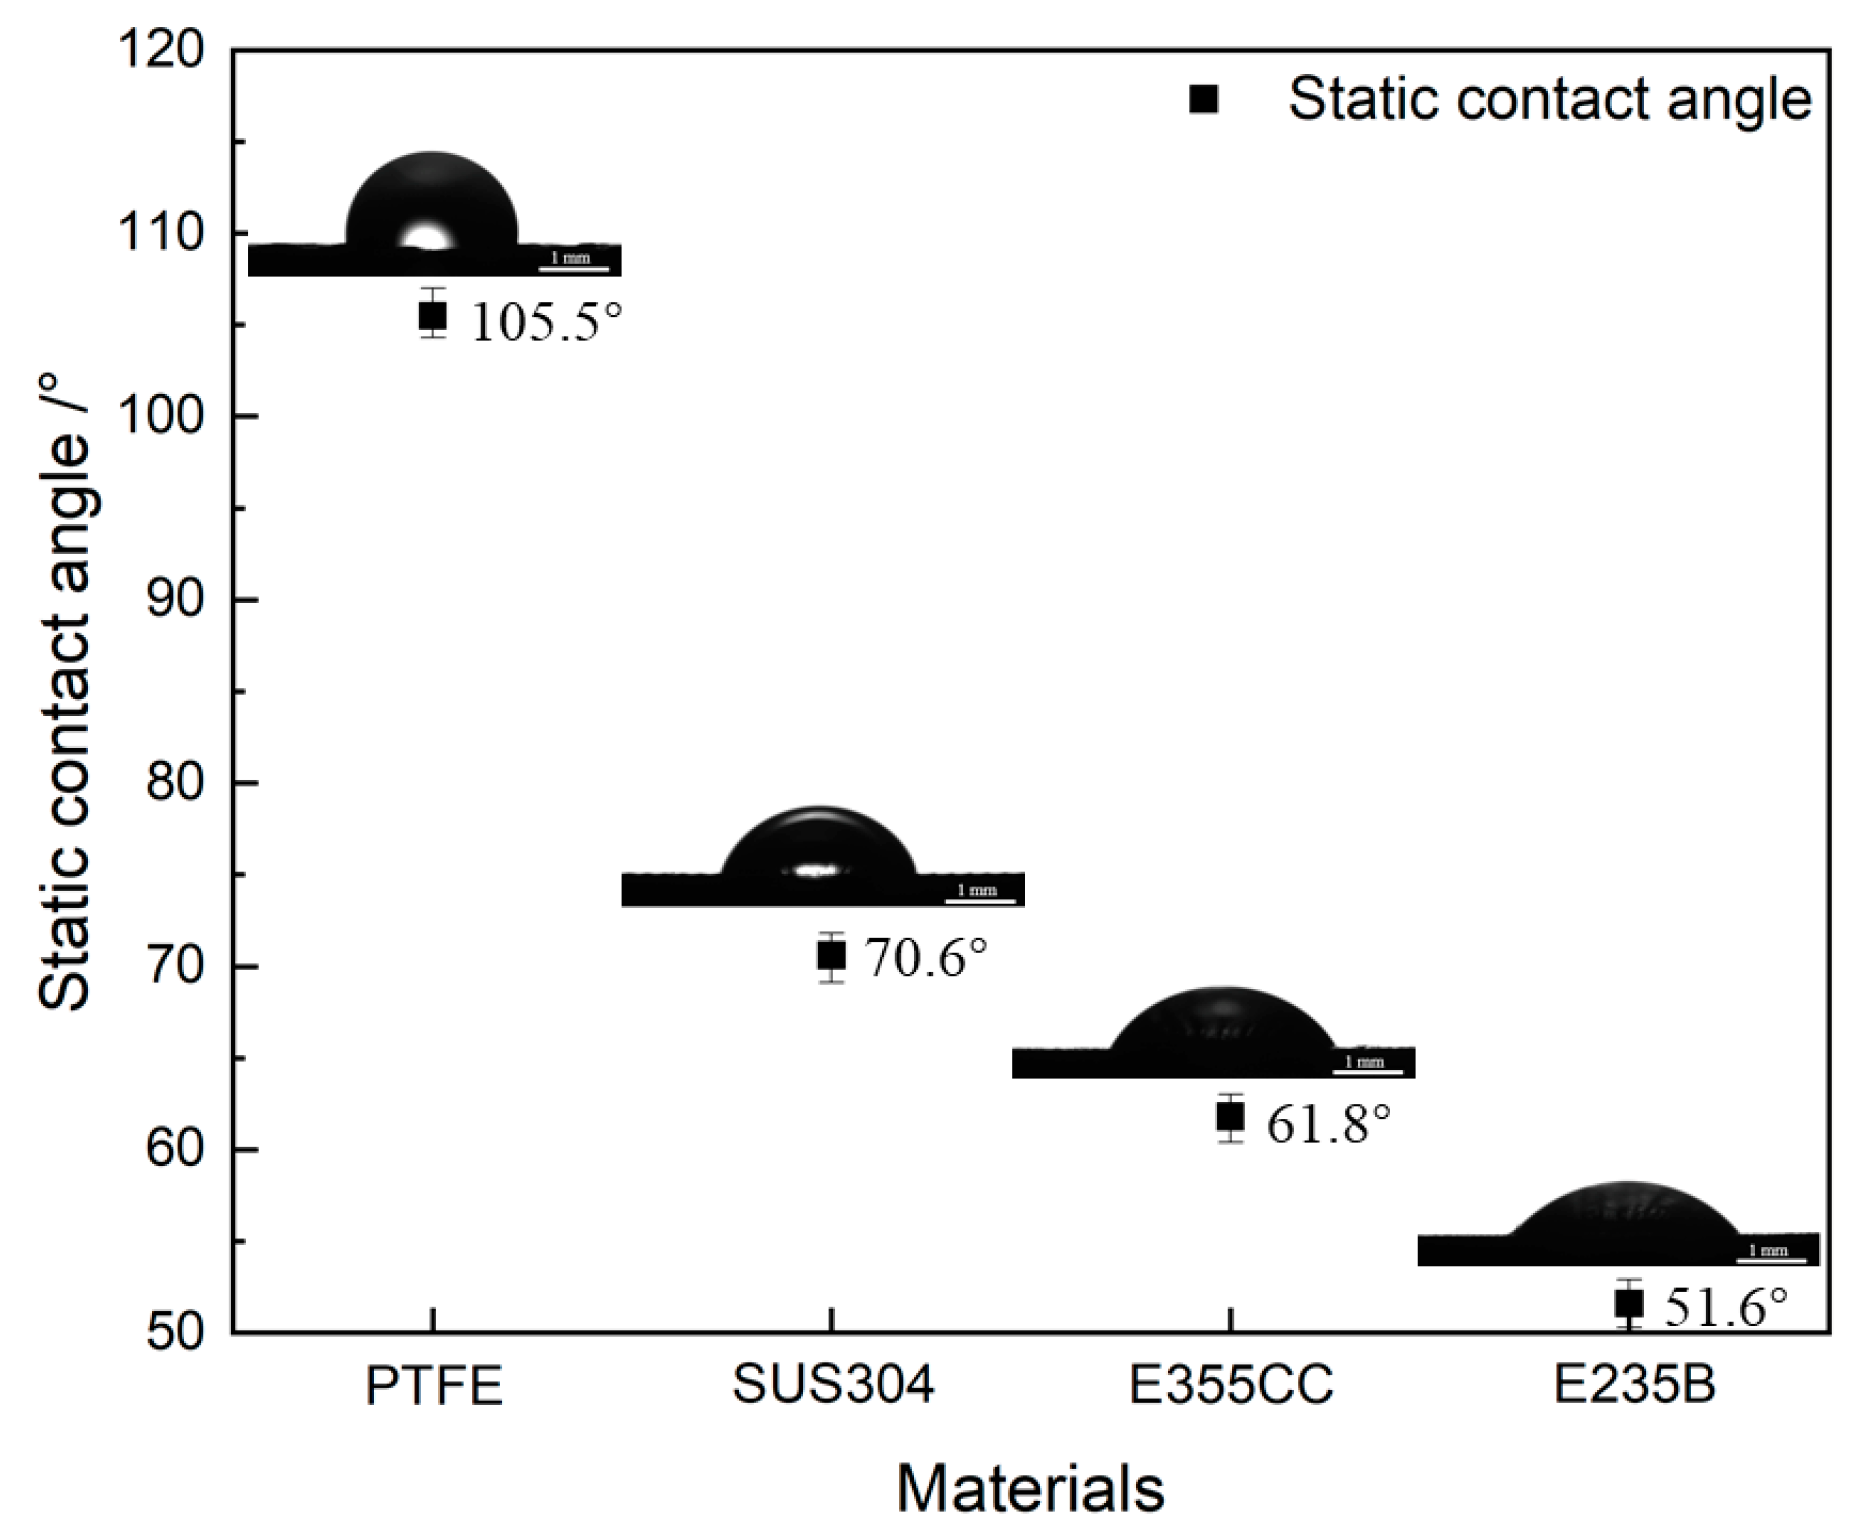
In the present study, the adhesion strengths of the TBAB hydrate to the surfaces of four different materials (E235B; E355CC; SUS304; PTFE) were measured at a temperature of 279.15 K. The roughness of each of the four different surfaces was 3.2 µm. The concentration of the TBAB was 35 mass% in the aqueous solution. The four different surfaces have different wettability. The static contact angles ( θ ) of water droplets on the four different surfaces are shown in Figure 4. The θ was determined using an Attension Theta optical contact angle meter at a temperature of 293.15 K. The drop volume was 6.5 µL. The measurements were performed three times for each data group, and the central value was selected as the representative value.
The experimental results in Figure 4 show that the order of the static contact angle size is PTFE > SUS304 > E355CC > E235B. PTFE is determined as a hydrophobic material according to the fact that the contact angle of the water droplets on a PTFE solid surface is greater than 90°. SUS304 stainless steel, E355CC low alloy steel, and E235B carbon steel are hydrophilic. Based on the relationship between the contact angle and wettability, the order of the wettability is E235B > E355CC > SUS304 > PTFE. Among the four kinds of surfaces, PTFE exhibited the poorest surface wettability by a contact angle of 105.5°, while E235B had the highest wettability by a contact angle of 51.6°.
The adhesion strengths of the TBAB hydrate to four different surfaces are illustrated in Table 1 and Figure 5. The adhesion strength of the hydrate to each surface was measured three times. The experimental results in Table 1 and Figure 5 show that the order of the hydrate adhesion strength to the different surfaces is as follows: E235B > E355CC > SUS304 > PTFE. Interestingly, the order of the adhesion strength of the hydrate to the surfaces is the same as the order of the wettability of these surfaces. The adhesion strength of the hydrate to the E235B carbon steel is 5.35 times greater than that of the adhesion strength of the hydrate to the PTFE surface. E235B carbon steel is a hydrophilic material with a strong affinity for water molecules. Consequently, the surface of E235B carbon steel is easily wetted by water. Under the effect of the capillary bridge of water, the hydrate adhesion strength on the E235B surface is 362.54 kPa. In contrast, the surface of PTFE is not easily wetted. For that reason, the average adhesion strength of hydrate to the PTFE surface is only 67.82 kPa.
Some researchers believe that the higher the surface energy of the material, the stronger the hydrate adhesion to the surface [23]. To further investigate the relationship between the hydrate adhesion strength and the surface energy of the material, the Fowkes surface energy component approach was adopted to calculate the surface energy based on Young’s equation, as shown in Equation (1) [32].
γ l v cos θ = γ s v γ s l
where γ l v , γ s v and γ s l denote the liquid surface energy, solid surface energy, and solid-liquid interfacial energy, respectively. θ is the contact angle. The surface energy component model is introduced for further calculation. The Fowkes surface energy component formula is [33]:
γ s l = γ s v + γ l v 2 ( γ s v d γ l v d ) 1 / 2
where γ s v d and γ l v d denote the dispersion component of the solid and liquid surface energies, respectively. Equation (3) is obtained by combining Equations (1) and (2).
γ l v cos θ = γ l v + 2 ( γ s v d γ l v d ) 1 / 2
where γ s v = γ s v d . γ l v = 72.80 mJ/m2, γ l v d = 21.80 mJ/m2. The surface energy of a solid can be calculated from the above equation. From the results obtained in Table 2, for either deionized water or the 35 mass% TBAB solution, the order of the surface energy between the liquid and solid is as follows: PTFE < SUS304 < E355CC < E235B, which is the same as the order of the hydrate adhesion strength to the four different surfaces. The surface energy between the water and PTFE (Hydrophobic) is 32.63 mJ/m2, and the surface energy between the water and E235B carbon steel (Hydrophilic) is 159.73 mJ/m2. Compared to the E235B solid surfaces with high wettability, the hydrate adhesion strength to PTFE solid surfaces with low wettability was found to decrease considerably. The surface contact angle and surface energy data support this conclusion. The adhesion strength of the hydrate to the solid surface increased with an increase in the solid surface wettability. This finding offers a novel strategy for hydrate management: The hydrate adhesion to the pipe can be adjusted by reducing the wettability of the pipe’s inner wall.

3.3. The Effect of Solid Surface Roughness on Hydrate Adhesion Strength

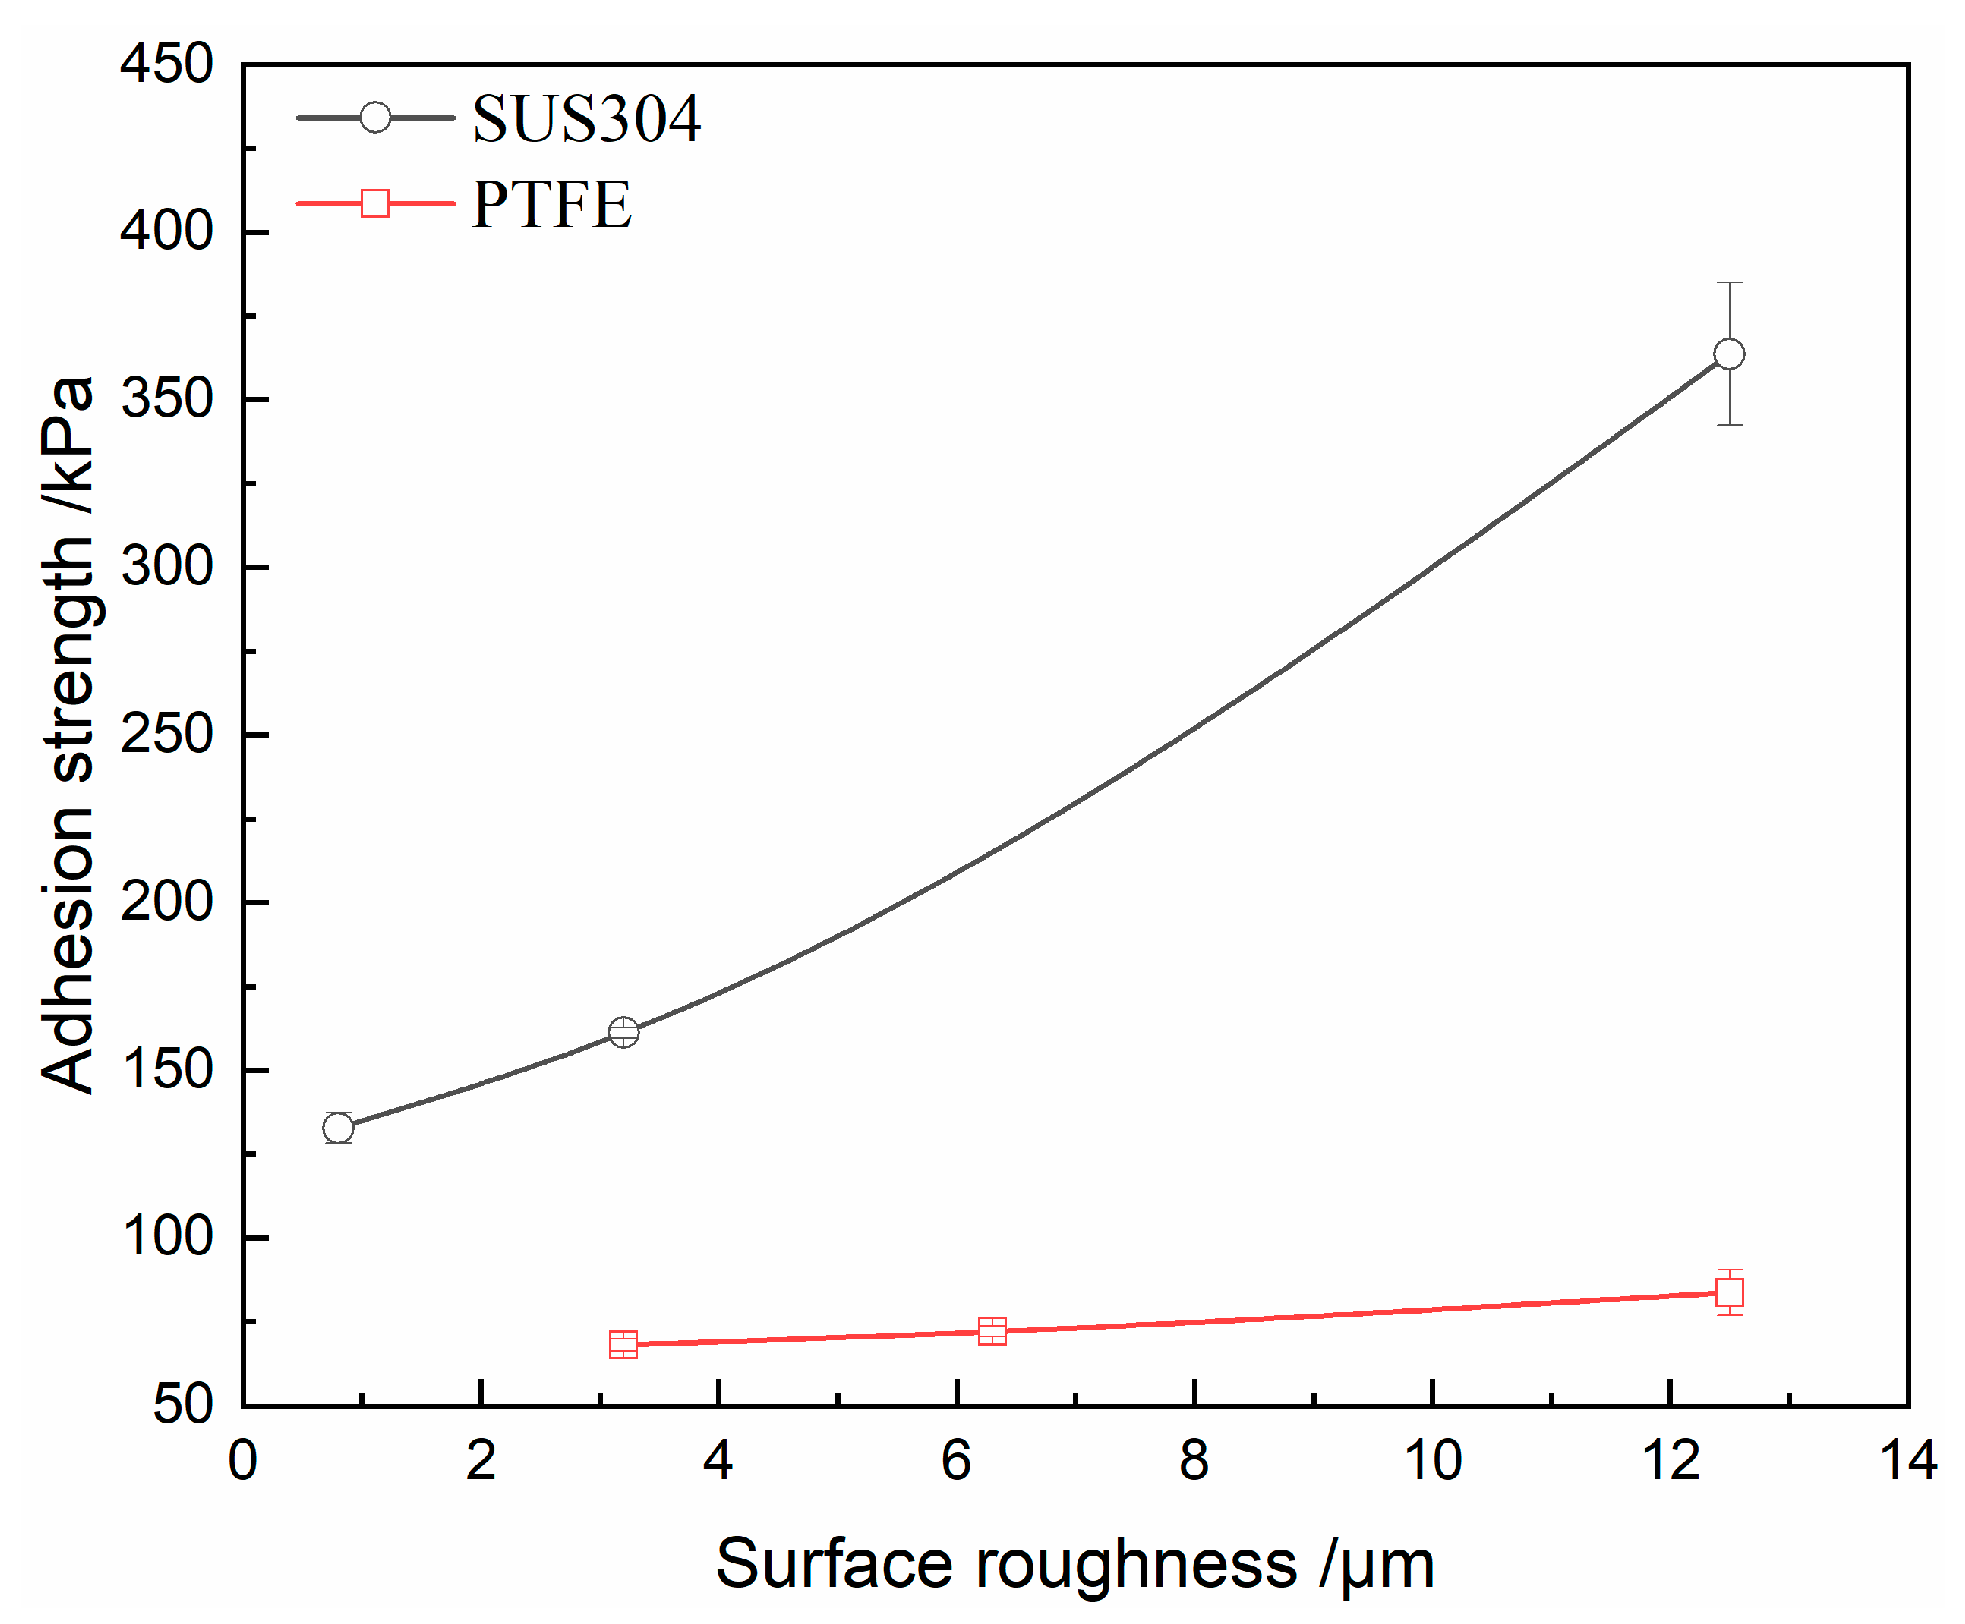
In this trial, the effect of surface roughness on the hydrate adhesion strength to the solid surface was investigated. A previous study suggests that surface roughness plays a crucial role in the ice adhesion strength to walls [34]. Surface roughness is a microscopic geometry error. Taking the difference between the hydrophilic surface and the hydrophobic surface into consideration, the hydrophilic material of the SUS304 stainless steel and the hydrophobic material of the PTFE with different surface roughness were used in this part of the study. The surface roughness of each of the four kinds of substrates was 0.8 μm, 3.2 μm, 6.3 μm, and 12.5 μm, respectively.
The experimental results indicate that the adhesion strengths of the TBAB hydrates to the surfaces of the SUS304 and PTFE are different, as listed in Table 3 and Figure 6. Upon increasing the roughness of the SUS304 surface from 3.2 μm to 12.5 μm, the adhesion strength increased by 186%. Upon increasing the roughness of the PTFE surface from 3.2 μm to 12.5 μm, the adhesion strength only increased by 22%, which was only 2/17 of that observed on the SUS304 surface. The main reason for this difference is that the effects of surface roughness on the hydrate adhesion to surfaces mainly come from two aspects. The change in the surface roughness causes a change in the solid surface wettability and the shear resistance.
For hydrophilic surfaces of SUS304, as the roughness increases, both the wettability and the shear resistance increase. For hydrophobic surfaces of TPFE, as the roughness increases, the wettability decreases, and the shear resistance increases. That may be because:
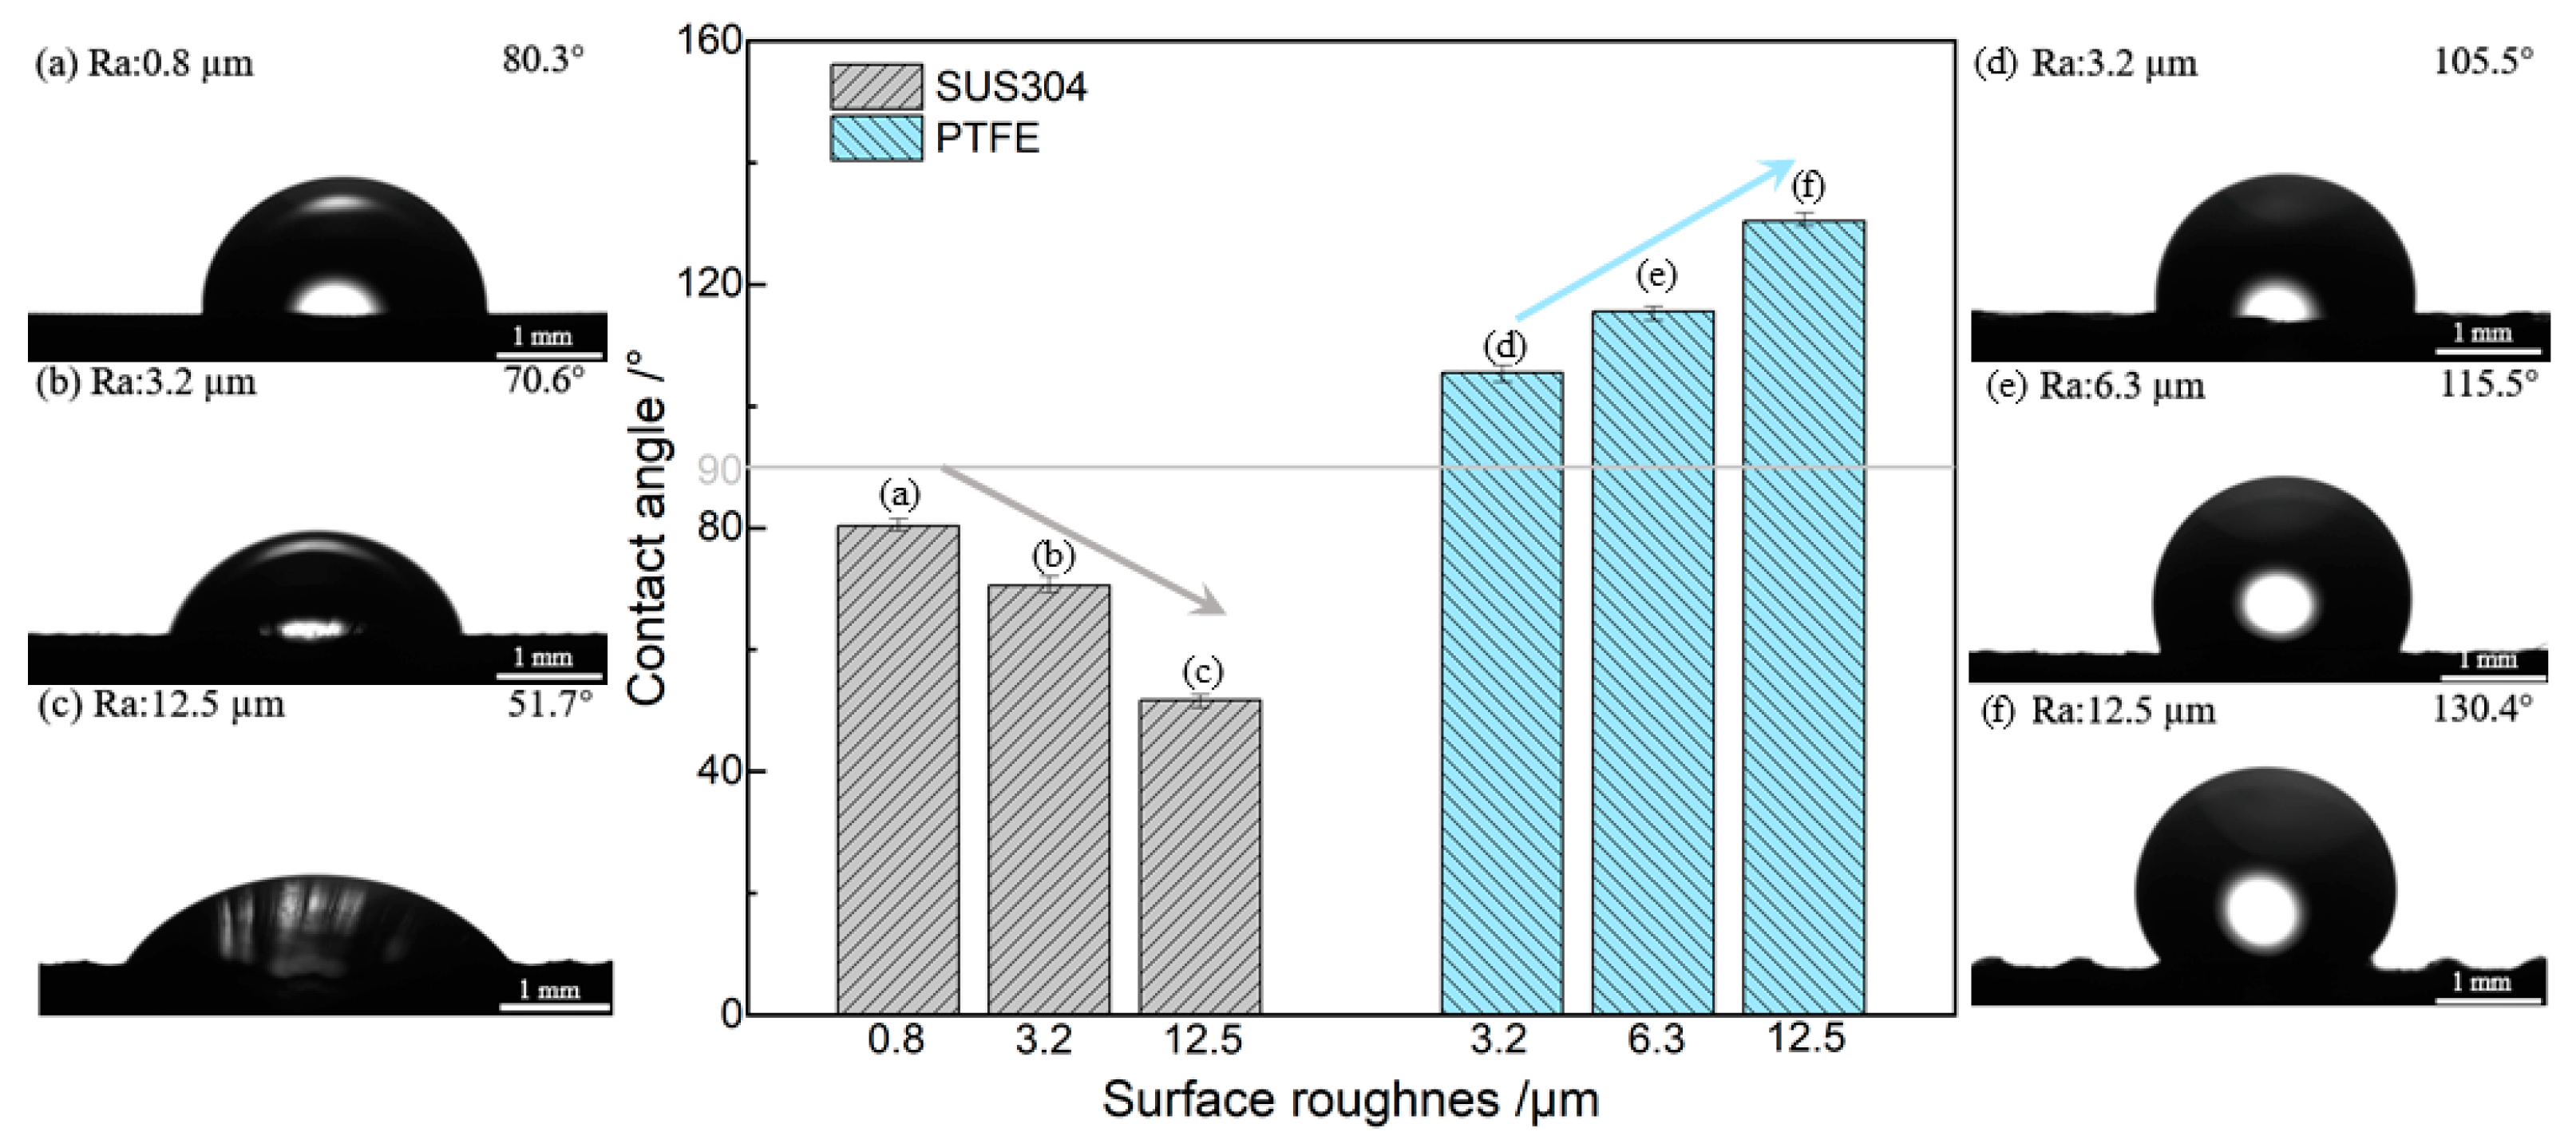
(i) As shown in Figure 7, with increasing roughness, the wettability of the SUS304 surface increases according to the fact that the contact angle decreases from 80.3° to 51.7° with an increase in the roughness from 0.8 μm to 12.5 μm. But with increasing roughness, the wettability of the PTFE surface decreases due to the fact that the contact angle increases from 105.3° to 130.4° with an increase in the roughness from 3.2 μm to 12.5 μm. Wenzel’s theory can describe this phenomenon [35]. The contact angle decreases as the roughness increases when the contact angle θ is lower than 90°, whereas it increases with increasing roughness when θ is higher than 90°. As the roughness of the substrate surface increases, the hydrophilic material of the SUS304 becomes more hydrophilic, whereas the hydrophobic material of the PTFE becomes more hydrophobic. Therefore, the difference in wettability change with increasing roughness is the main factor for the difference in the trend of hydrate adhesion change for the SUS304 and PTFE surfaces.
(ii) Higher roughness suggests greater microscopic unevenness of the solid surface. Droplets are squeezed onto the solid surface microstructure by capillary action, and then they develop into hydrates, which increases the contact area between the hydrate and the substrate. The shear resistance strength is significantly increased as the hydrate and the solid surface microstructure engage together like a saw tooth. At the same time, the shear strength of the hydrate itself also leads to an increase in the adhesion strength of the hydrate to the surface. This pattern also occurs in the CyC5 hydrate system [27]. In a pipe system, the increase in shear resistance due to the increased roughness is the controlling factor for the hydrate adhesion strength on the wall.

3.4. The Effect of Subcooling on Hydrate Adhesion Strength

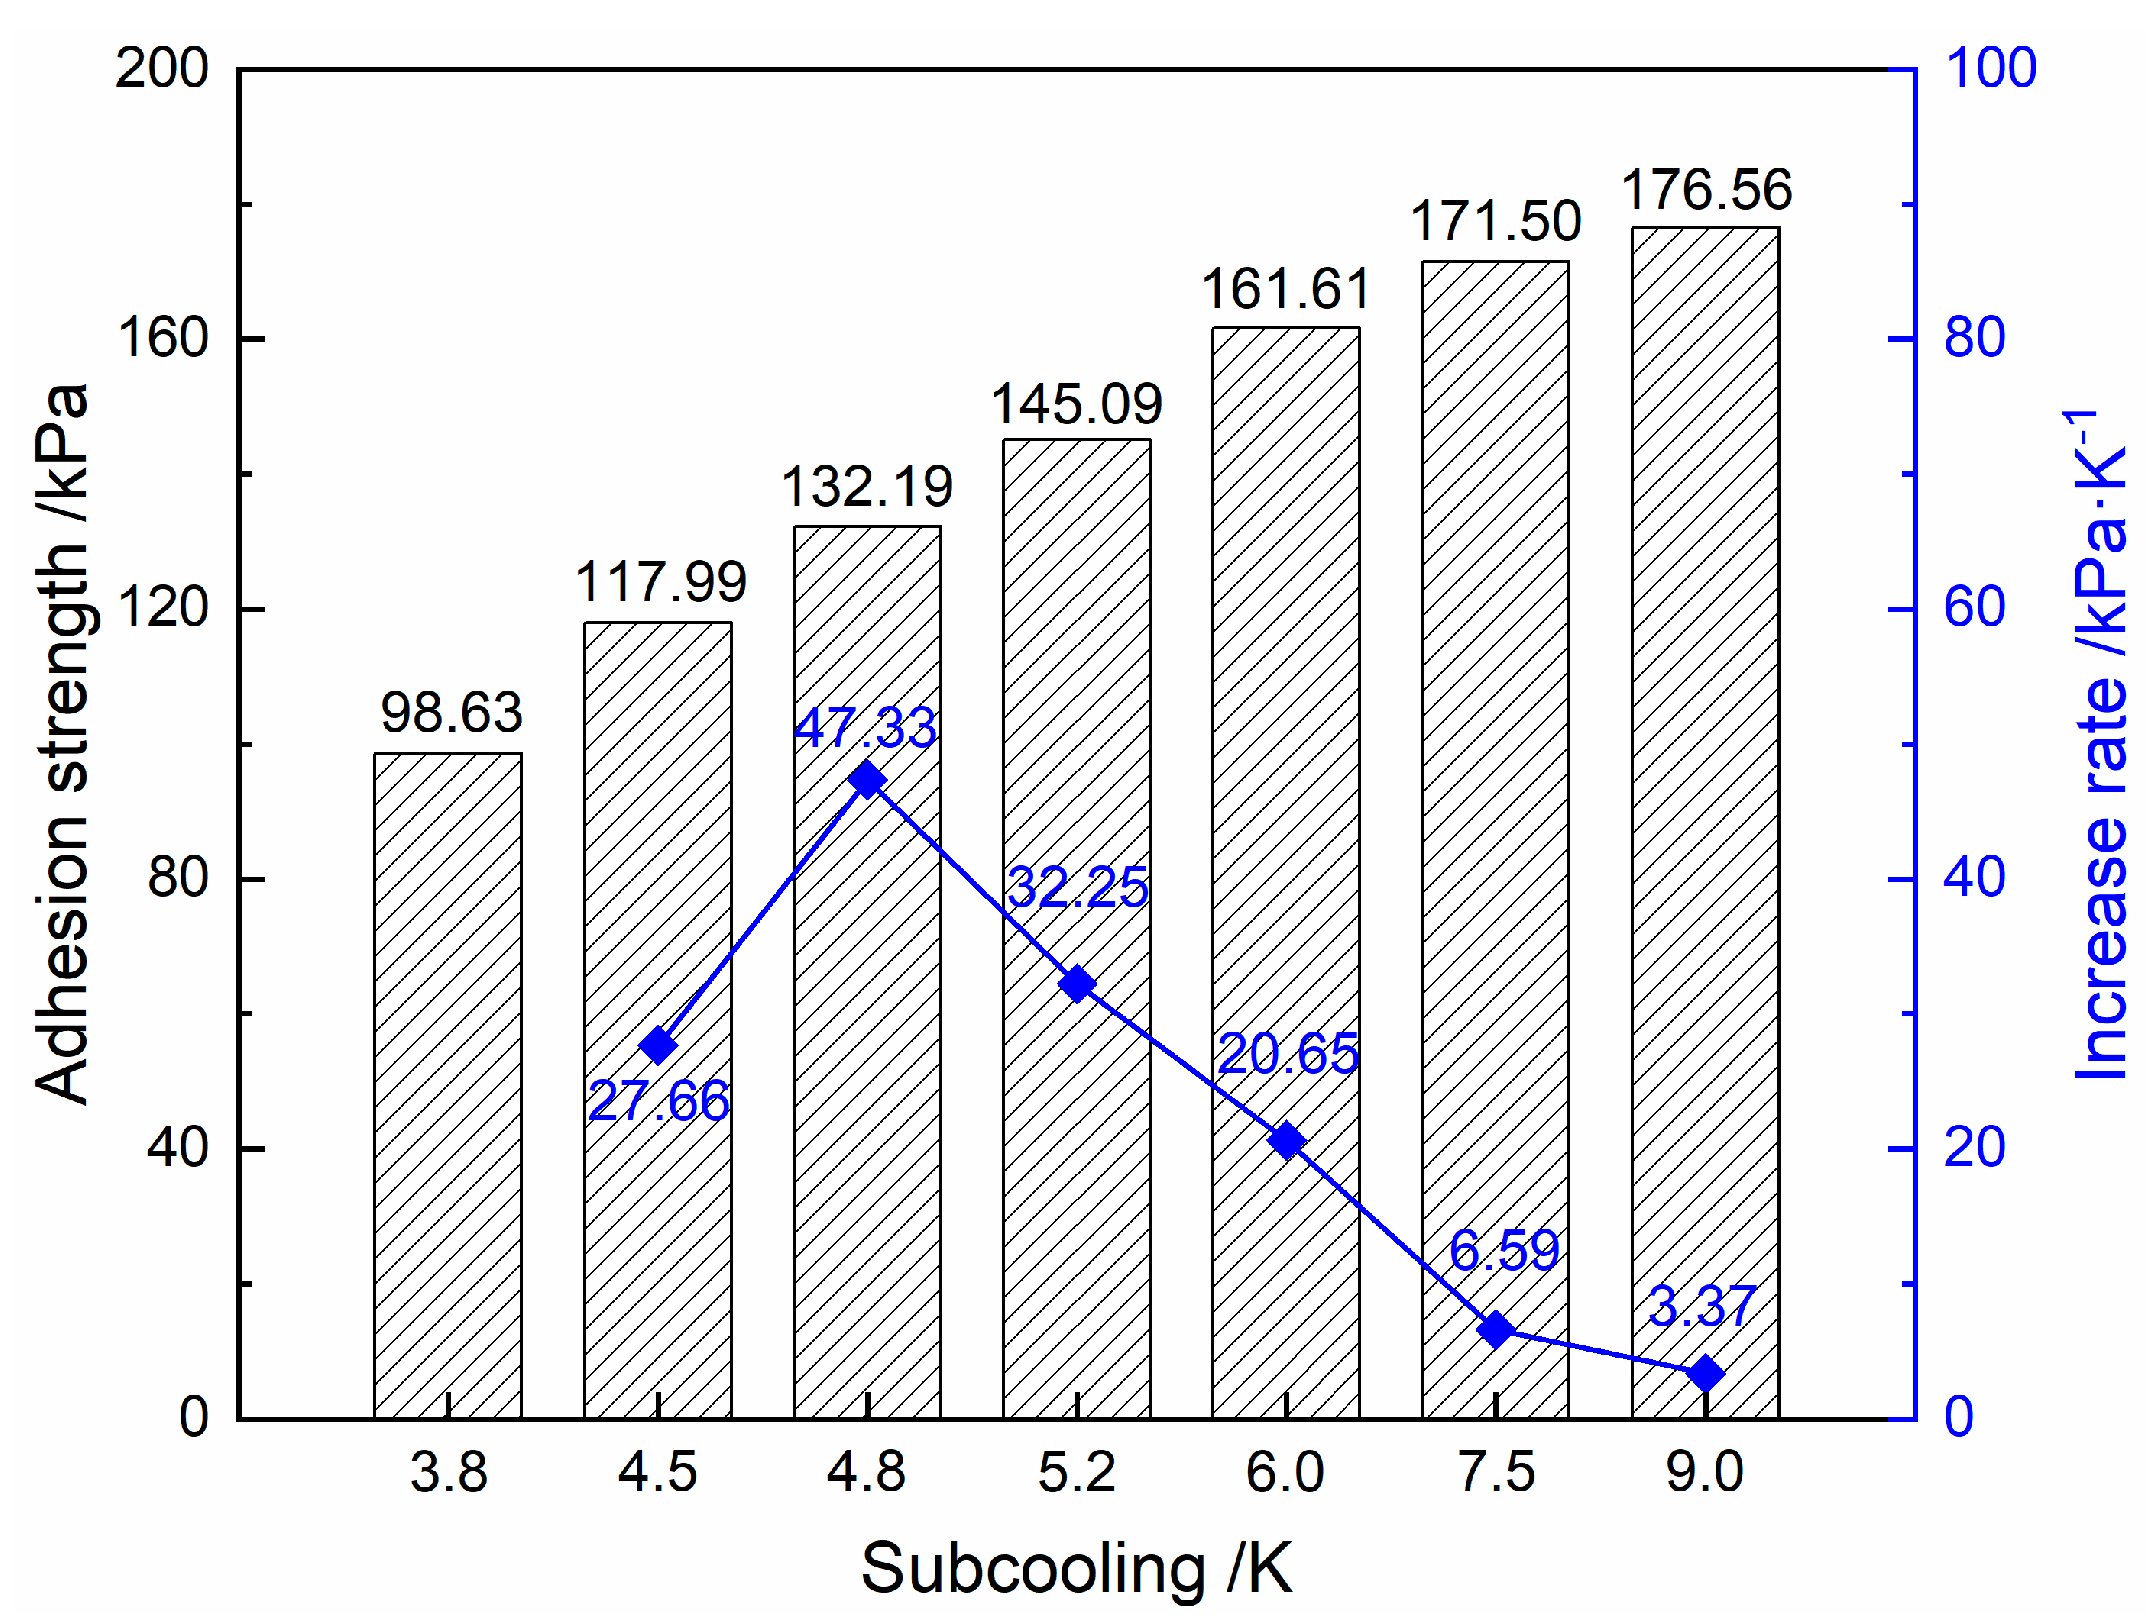
As the subcooling increases, the thermodynamic driving force of hydrate formation increases, further accelerating the rate of hydrate formation. In the present work, the variation in the TBAB hydrate adhesion strength on the SUS304 stainless steel surface with subcooling was investigated, and the results are shown in Figure 8.
As can be seen from Figure 8, the adhesion strength of the TBAB hydrate to the SUS304 stainless steel surface shows an upward trend with an increase in subcooling. When the subcooling increases from 3.8 K to 9.0 K, the adhesion strength increases from 98.63 kPa to 176.56 kPa. This trend is consistent with the trend in the adhesion strength of the Cyc5 hydrate to steel substrates [27]. This is due to the fact that subcooling is the main factor influencing the rate of hydrate formation, and a different formation rate results in a different hydrate state on the solid surface. As the subcooling degree is increased, the heat exchange rate in the system increases. The high rate of heat exchange allows the heat released by hydrate formation to be released more quickly. In addition, the difference in the subcooling leads to a difference in the morphology of the hydrate. During the experiment, with an increase in subcooling, the volume expansion of the hydrate is enhanced like the ice freezing process, which results in a high adhesion strength of the hydrate to the surface. However, the rate of increment in the adhesion strength diminishes from 47.33 kPa·K−1 to 3.37 kPa·K−1 when the subcooling increases from 4.8 K to 9.0 K. This is due to the fact that mass transfer is constrained.
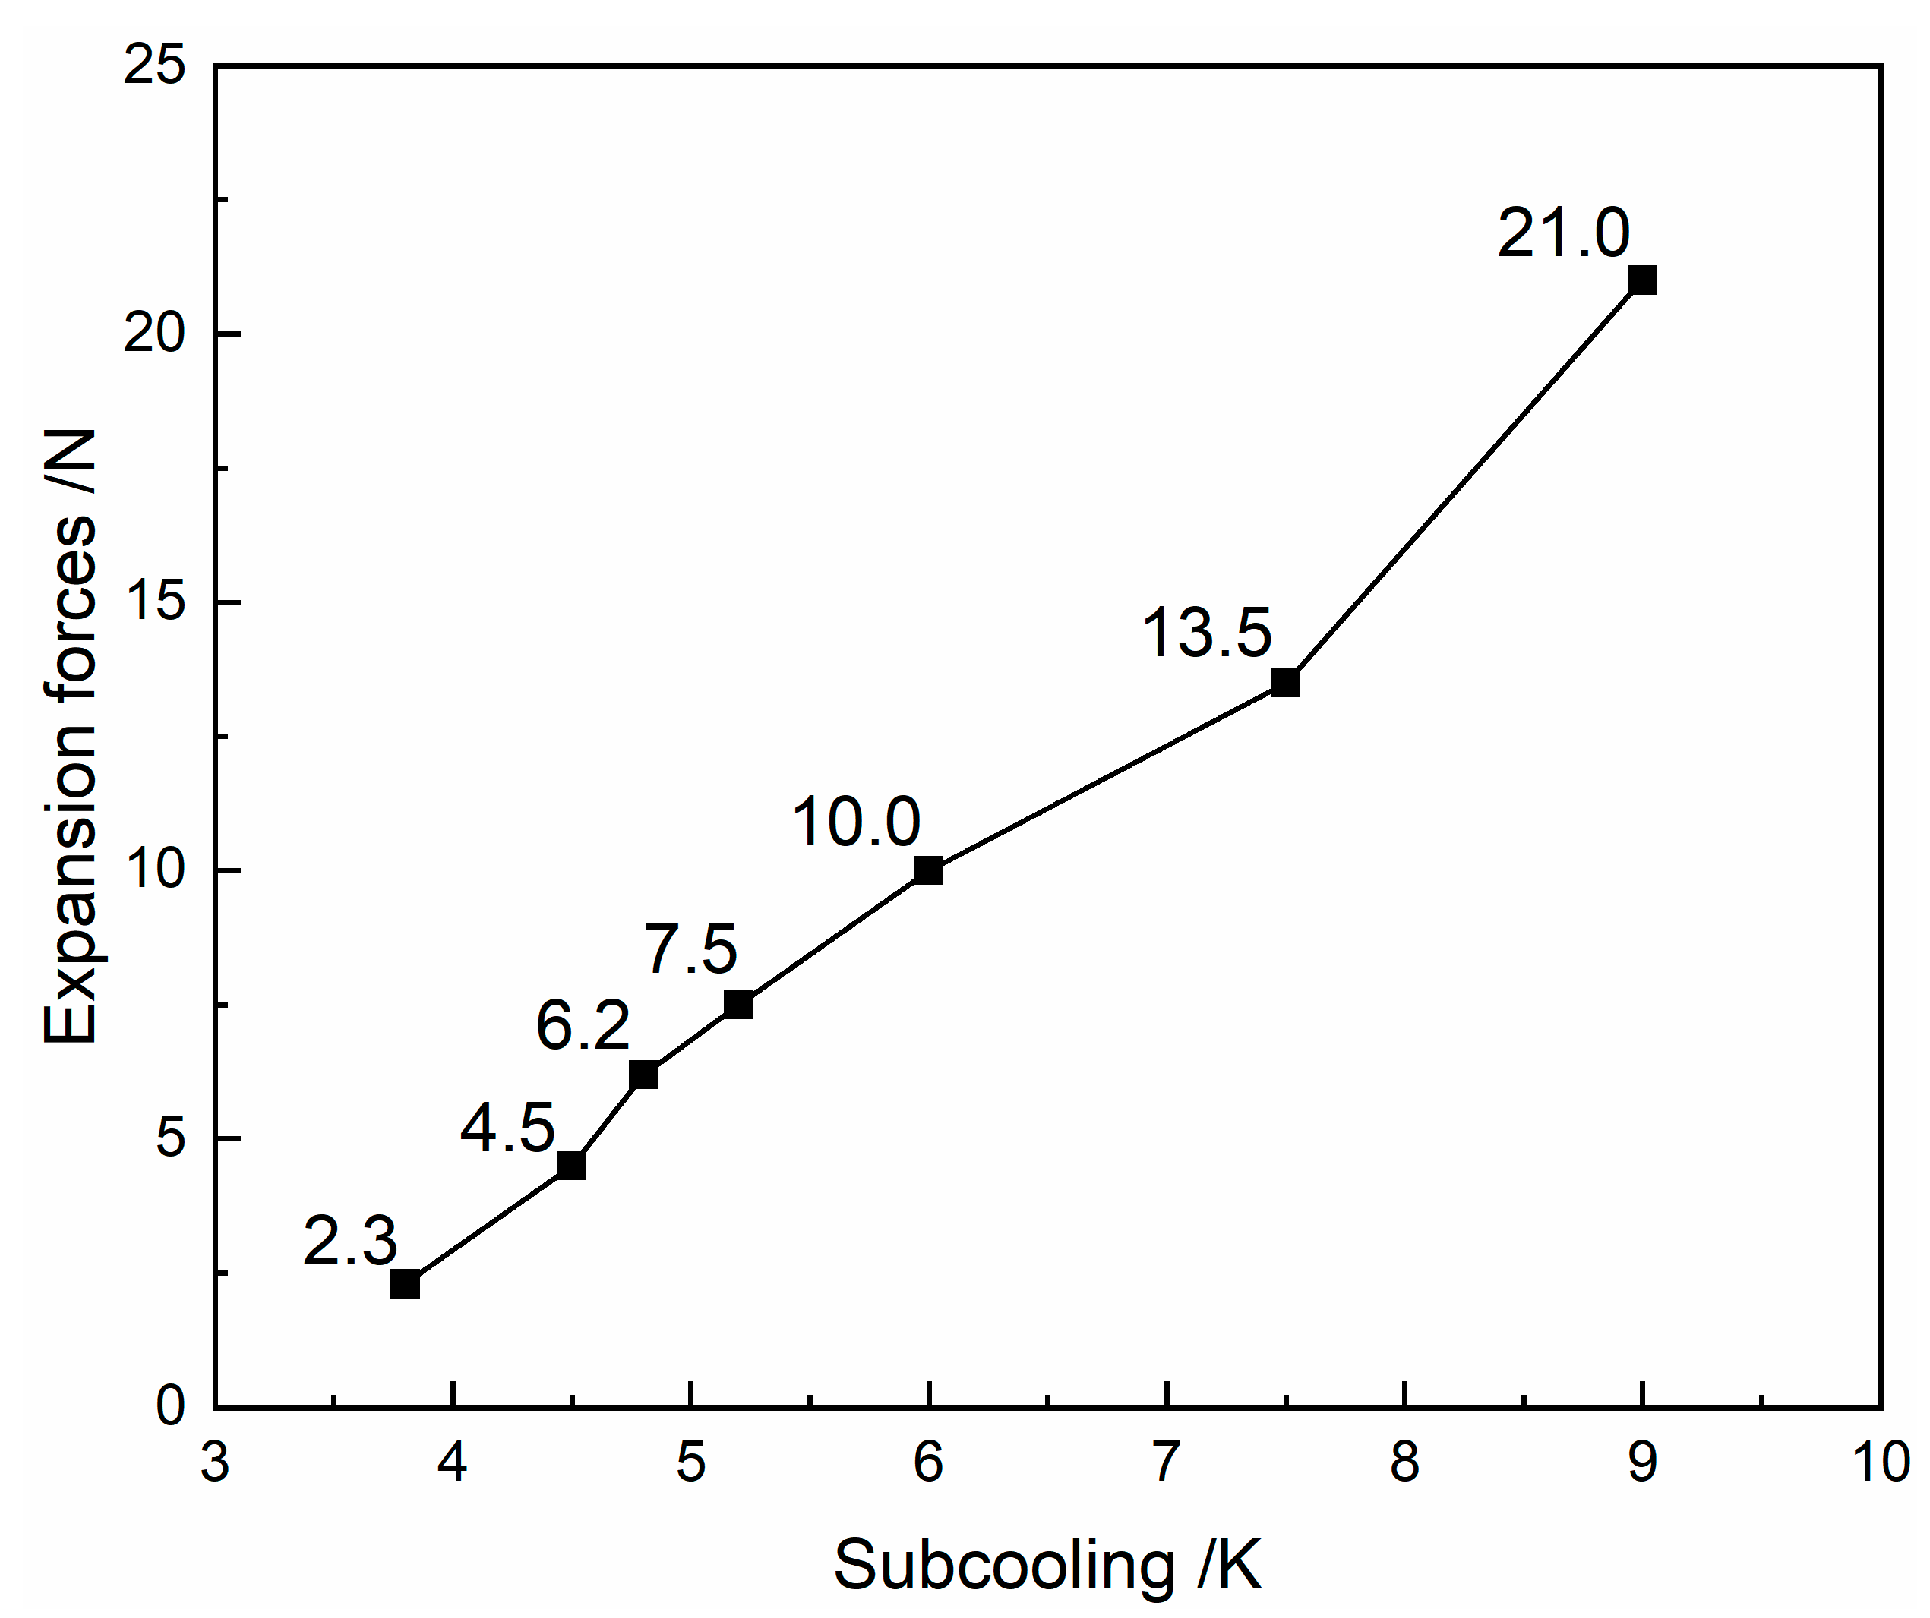
The phase change process of the hydrates undergoes volume expansion. The expansion increases the radial squeezing pressure of the hydrate to the pipe’s inner wall. The increase in the radial squeezing pressure results in an increase in the adhesion strength of the hydrate to the wall. The relationship between the expansion degree and subcooling was measured by an experiment. Tension recording software recorded the force during the process of hydrate formation. The final values of the tension forces are shown in Figure 9. The results indicate that during hydrate formation, an expansion force is generated. The degree of hydrate expansion increases with an increase in subcooling. As the subcooling increases from 3.8 K to 9.0 K, the expansion force increases from 2.3 N to 21.0 N. The expansion force is increased 9.13 times. The adhesion between the hydrate and the solid surface is affected by the degree of subcooling. The greater the degree of subcooling, the greater the hydrate adhesion to the wall surface.

4. Conclusions

This study investigated the effects of surface wettability, roughness, and subcooling on the adhesion strength of TBAB hydrate to a solid surface. The adhesive properties were quantified using a self-built shear strength measurement apparatus.
The results indicated that the adhesion strength of the TBAB hydrate to the solid surface decreases as the surface wettability decreases. The effect of surface roughness on the adhesion strength of hydrates to surfaces was primarily attributed to changes in wettability and shear resistance. For the hydrophilic surface of SUS304, both the wettability and the shear resistance increased with increasing roughness, whereas for the hydrophobic surface of PTFE, as the roughness increased, the wettability decreased, and the shear resistance increased. The difference in the wettability variation emerged as a critical factor contributing to the divergence in the adhesion tendency observed between the SUS304 and PTFE surfaces. Reducing the wettability and roughness can effectively reduce the critical velocity required for removing hydrate deposits and facilitate the self-removal of hydrates. The adhesion strength increases with an increase in subcooling, primarily due to the elevated hydrate formation rate and expansion rate resulting from subcooling. This investigation provides exclusive insights into the mechanism underlying hydrate adhesion to pipe walls.

Author Contributions

Z.X.: conceptualization, methodology, formal analysis, data curation, writing—original draft, writing—review and editing; L.Z.: methodology, data curation; Z.D.: methodology; A.L.: writing—review and editing; Y.W.: writing—review and editing, project administration, funding acquisition; Q.S.: writing—original draft, resources, writing—review and editing; J.C.: resources, supervision; X.G.: resources, writing—review and editing, supervision. All authors have read and agreed to the published version of the manuscript.

Funding

This research was funded by Basic Research Funds for Universities of Xinjiang Uygur Autonomous Region (XJEDU2022P152), the National Natural Science Foundation of China (22008257, 22278424), and the Distinguished Youth Foundation of the Tianshan Program of Xinjiang Uygur Autonomous Region (2022TSYCJC0013).

Data Availability Statement

All the data generated or analyzed during this study are included in this article.

Conflicts of Interest

The authors declare no conflict of interest.

References

  1. Song, S.; Fu, S.; Liao, Q.; Shi, B.; Chen, H.; Gong, J. Investigations on methane hydrate formation, dissociation, and viscosity in gas-water-sand system. Petrol. Sci. 2022, 19, 2420–2430. [Google Scholar] [CrossRef]
  2. Sun, Y.; Cao, B.; Chen, H.; Liu, Y.; Zhong, J.; Ren, L.; Chen, G.; Sun, C.; Chen, D. Influences of pore fluid on gas production from hydrate-bearing reservoir by depressurization. Petrol. Sci. 2023, 20, 1238–1246. [Google Scholar] [CrossRef]
  3. Zhang, S.; Wang, L. Rotational failure analysis of spherical-cylindrical shell pressure controllers related to gas hydrate drilling investigations. Petrol. Sci. 2023, 20, 482–494. [Google Scholar] [CrossRef]
  4. Liu, J.; Wang, J.; Dong, T.; Liang, D. Effects of wax on CH4 hydrate formation and agglomeration in oil–water emulsions. Fuel 2022, 322, 124128. [Google Scholar] [CrossRef]
  5. Liu, S.; Han, T.; Fu, L. Laboratory insights into the effects of methane hydrate on the anisotropic joint elastic-electrical properties in fractured sandstones. Petrol. Sci. 2023, 20, 803–814. [Google Scholar] [CrossRef]
  6. Liu, H.; Li, H.; Yao, D.; Guo, P.; Wen, L. The research on the natural gas hydrate dissociation kinetic from hydrate-sediments/seawater slurries. Chem. Eng. J. 2022, 435, 135127. [Google Scholar] [CrossRef]
  7. Li, S.; Zhang, G.; Dai, Z.; Jiang, S.; Sun, Y. Concurrent decomposition and replacement of marine gas hydrate with the injection of CO2-N2. Chem. Eng. J. 2021, 420, 129936. [Google Scholar]
  8. Chen, J.; Zeng, Y.; Yu, X.; Yuan, Q.; Wang, T.; Deng, B.; Yan, K.; Jiang, J.; Tao, L.; Chen, C. A covering liquid method to intensify self-preservation effect for safety of methane hydrate storage and transportation. Petrol. Sci. 2022, 19, 1411–1419. [Google Scholar] [CrossRef]
  9. Gao, Y.; Xu, Y.; Song, K.; Li, Q.; Yao, H.; Chen, H.; Wang, W.; Li, Y. A New Calculation Method and Model of Hydrate Slurry Flow of The Multiphase Pipe in Deep Water Gas Field. J. Pipe. Sci. Eng. 2022, 3, 100104. [Google Scholar] [CrossRef]
  10. Chen, L.; Koh, C.; Sun, B. Insight into the plugging mechanism in water-continuous hydrate slurries. Fuel 2022, 316, 123360. [Google Scholar] [CrossRef]
  11. Liu, Y.; Lv, X.; Ma, Q.; Zhou, S.; Shi, B.; Du, H.; Lei, Y.; Yu, P.; Song, S.; Gong, J.; et al. Investigation on Synergistic Deposition of Wax and Hydrates in Waxy Water-in-Oil (W/O) Flow Systems. Petrol. Sci. 2022, 19, 1840–1852. [Google Scholar] [CrossRef]
  12. Lingelem, M.N.; Majeed, A.I.; Stange, E. Industrial Experience in Evaluation of Hydrate Formation, Inhibition, and Dissociation in Pipe Design and Operation. Ann. Ny Acad. Sci. 1994, 715, 75–93. [Google Scholar] [CrossRef]
  13. Wang, Z.; Zhang, J.; Sun, B.; Chen, L.; Zhao, Y.; Fu, W. A new hydrate deposition prediction model for gas-dominated systems with free water. Chem. Eng. Sci. 2017, 163, 145–154. [Google Scholar] [CrossRef]
  14. Wang, Z.; Yu, J.; Zhang, J.; Liu, S.; Gao, Y.; Xiang, H.; Sun, B. Improved thermal model considering hydrate formation and deposition in gas-dominated systems with free water. Fuel 2018, 236, 870–879. [Google Scholar] [CrossRef]
  15. Huang, L.; Kang, J.; Shen, X.; Sun, J.; Meng, Q.; Chen, Q.; Hu, G.; Liu, C.; Wu, N. Experimental investigation of hydrate formation in water-dominated pipe and its influential factors. China Geol. 2022, 5, 310–321. [Google Scholar]
  16. Chen, Y.; Gong, J.; Shi, B.; Yao, H.; Liu, Y.; Fu, S.; Song, S.; Lv, X.; Wu, H.; Lou, X. Investigation into methane hydrate reformation in water-dominated bubbly flow. Fuel 2020, 263, 116691. [Google Scholar] [CrossRef]
  17. Song, G.; Li, Y.; Wang, W.; Jiang, K.; Ye, X.; Zhao, P. Investigation of hydrate plugging in natural gas + diesel oil + water systems using a high-pressure flow loop. Chem. Eng. Sci. 2017, 158, 480–489. [Google Scholar] [CrossRef]
  18. Chen, J.; Yan, K.; Chen, G.; Sun, C.; Liu, B.; Ren, N.; Shen, D.; Niu, M.; Lv, Y.; Li, N.; et al. Insights into the formation mechanism of hydrate plugging in pipelines. Chem. Eng. Sci. 2015, 122, 284–290. [Google Scholar] [CrossRef]
  19. Taylor, C.J.; Dieker, L.E.; Miller, K.T.; Koh, C.A.; Sloan, E.D. Micromechanical adhesion force measurements between tetrahydrofuran hydrate particles. J. Colloid Interf. Sci. 2007, 306, 255–261. [Google Scholar] [CrossRef]
  20. Liu, C.; Li, Y.; Wang, W.; Dong, S.; Li, M. Modeling the micromechanical interactions between clathrate hydrate particles and water droplets with reducing liquid volume. Chem. Eng. Sci. 2017, 163, 44–55. [Google Scholar] [CrossRef]
  21. Aman, Z.M.; Leith, W.J.; Grasso, G.A.; Sloan, E.D.; Sum, A.K.; Koh, C.A. Adhesion force between cyclopentane hydrate and mineral surfaces. Langmuir 2013, 29, 15551–15557. [Google Scholar] [CrossRef] [PubMed]
  22. Zhang, W.; Fan, S.; Wang, Y.; Lang, X.; Li, G. Preparation and performance of biomimetic superhydrophobic coating on X80 pipe steel for inhibition of hydrate adhesion. Chem. Eng. J. 2021, 419, 129651. [Google Scholar] [CrossRef]
  23. Aspenes, G.A.; Dieker, L.E.; Aman, Z.M.; Høiland, S.; Sum, A.K.; Koh, C.A.; Sloan, E.D. 2010. Adhesion force between cyclopentane hydrates and solid surface materials. J. Colloid Interf. Sci. 2010, 343, 529–536. [Google Scholar] [CrossRef] [PubMed]
  24. Nicholas, J.W.; Dieker, L.E.; Sloan, E.D.; Koh, C.A. Assessing the feasibility of hydrate deposition on pipe walls—Adhesion force measurements of clathrate hydrate particles on carbon steel. J. Colloid Interf. Sci. 2009, 331, 322–328. [Google Scholar] [CrossRef]
  25. Matsumoto, K.; Murase, M.; Ehara, K.; Sakamoto, J.; Ueda, J. Investigation on adhesion force of TBAB hydrate to cooling copper surface. Int. J. Refrig. 2017, 78, 121–127. [Google Scholar] [CrossRef]
  26. Liu, C.; Yang, L.; Zhou, C.; Wang, Z.; Li, M. Effects of hydrate inhibitors on the adhesion strengths of sintered hydrate deposits on pipe walls. J. Colloid Interface Sci. 2022, 624, 593–601. [Google Scholar]
  27. Liu, C.; Wang, Z.; Tian, J.; Yan, C.; Li, M. Fundamental investigation of the adhesion strength between cyclopentane hydrate deposition and solid surface materials. Chem. Eng. Sci. 2020, 217, 115524. [Google Scholar]
  28. Liu, F.; Li, A.; Qing, S.; Luo, Z.; Ma, Y. Formation kinetics, mechanism of CO2 hydrate and its applications. Renew. Sus. Energ. Rev. 2022, 159, 112221. [Google Scholar] [CrossRef]
  29. Ammarullah, M.I.; Hartono, R.; Supriyono, T.; Santoso, G.; Sugiharto, S.; Permana, M.S. Polycrystalline Diamond as a Potential Material for the Hard-on-Hard Bearing of Total Hip Prosthesis: Von Mises Stress Analysis. Biomedicines 2023, 11, 951. [Google Scholar] [CrossRef]
  30. Ammarullah, M.I.; Santoso, G.; Sugiharto, S.; Supriyono, T.; Kurdi, O.; Tauviqirrahman, M.; Winarni, T.I.; Jamari, J. Tresca stress study of CoCrMo-on-CoCrMo bearings based on body mass index using 2D computational model. J. Tribologi. 2022, 33, 31–38. [Google Scholar]
  31. ISO 630-1995; Structural Steels—Plates, Wide Flats, Bars, Sections and Profiles. ISO: Geneva, Switzerland, 1995.
  32. Young, T. An essay on the cohesion of fluids. Phil. Trans. R. Soc. Lond. 1805, 95, 65–87. [Google Scholar]
  33. Fowkes, F.M. Attractive forces at interfaces. Ind. Eng. Chem. 1964, 56, 40–52. [Google Scholar] [CrossRef]
  34. Good, R.J. Contact angle, wetting, and adhesion: A critical review. J. Adhes. Sci. Technol. 1992, 6, 1269–1302. [Google Scholar] [CrossRef]
  35. Wenzel, R.N. Resistance of solid surfaces to wetting by water. Ind. Eng. Chem. 1936, 28, 988–994. [Google Scholar] [CrossRef]
Figure 1. Conceptual mechanism for hydrate plugging formation in gas-dominant systems [13].
Processes 11 02720 g001
Figure 2. The experimental apparatus. (a) Schematic diagram and (b) Physical diagram.
Processes 11 02720 g002
Figure 3. The temperature change during the adhesion measurement.
Processes 11 02720 g003
Figure 4. Static contact angle of water droplets on the four different surfaces.
Processes 11 02720 g004
Figure 5. The effect of the material of the solid surface on adhesive force between TBAB hydrate and solid surface.
Processes 11 02720 g005
Figure 6. Adhesion strengths of TBAB hydrate to different roughness solid surfaces.
Processes 11 02720 g006
Figure 7. The effect of the roughness on the wettability of hydrophilic/hydrophobic substrates.
Processes 11 02720 g007
Figure 8. Variation in the TBAB hydrate adhesion strength to SUS304 surface versus subcooling.
Processes 11 02720 g008
Figure 9. Expansion forces under different subcooling conditions.
Processes 11 02720 g009
Table 1. The adhesion force between TBAB hydrate and solid surface.
Solid Surface MaterialRa (µm)Adhesion Force F (kPa)
PTFE 67.30
3.2069.85
66.31
SUS304 162.60
3.20159.60
160.55
E355CC 328.19
3.20306.58
311.96
E235B 384.92
3.20342.33
360.36
u(Ra) = 0.10 µm, u(F) = 0.10 kPa.
Table 2. The surface energy of the materials.
MediumSolid Surface Materials θ (°) γ s v (mJ/m2)
H2OE235B51.60159.73
E355CC61.80131.79
SUS30470.60107.86
PTFE105.5032.63
35 mass% TBABE235B47.00171.95
E355CC55.00150.49
SUS30464.10125.47
PTFE81.3080.56
u( θ ) = 0.10°, u( γ s v ) = 0.10 mJ/m2.
Table 3. The adhesion strength of TBAB hydrate to surfaces under different roughness.
Solid SurfaceSurface Roughness Ra (μm)Adhesion Force F (kPa)
SUS3040.80137.23
128.19
3.20162.60
159.61
12.50384.92
342.33
PTFT3.2066.31
69.85
6.3073.67
70.56
12.5076.90
90.53
u(Ra) = 0.10 µm, u(F) = 0.10 kPa.
Disclaimer/Publisher’s Note: The statements, opinions and data contained in all publications are solely those of the individual author(s) and contributor(s) and not of MDPI and/or the editor(s). MDPI and/or the editor(s) disclaim responsibility for any injury to people or property resulting from any ideas, methods, instructions or products referred to in the content.