Article

Prediction and Diagnosis of Electric Vehicle Battery Fault Based on Abnormal Voltage: Using Decision Tree Algorithm Theories and Isolated Forest

National Engineering Research Center of Electric Vehicles, School of Mechanical Engineering, Beijing Institute of Technology, Beijing 100081, China
*
Author to whom correspondence should be addressed.
Processes 2024, 12(1), 136; https://doi.org/10.3390/pr12010136
Submission received: 6 December 2023 / Revised: 22 December 2023 / Accepted: 27 December 2023 / Published: 5 January 2024

Abstract

:
Battery voltage is a pivotal parameter for evaluating battery health and safety. The precise prediction of battery voltage and the implementation of anomaly detection are imperative for ensuring the secure and dependable operation of battery systems. Nevertheless, during the actual operation of electric vehicles, battery performance is subject to the influence of the vehicle's operational state and battery characteristic parameters, introducing challenges to safety alerts. In order to address these challenges and achieve precise battery voltage prediction, this paper comprehensively considers the battery characteristics and driving behavior of electric vehicles in both charging and operational states. Mathematical processing, including averaging and variance calculation, is applied to the battery characteristic parameter data and driving behavior data. By integrating historical voltage data and employing a modified gradient boosting decision tree algorithm (GBDT), a fast and accurate online voltage prediction method is proposed. Hyperparameter optimization is employed to minimize prediction voltage errors. The accuracy and timeliness of the predictions are validated through a comprehensive evaluation and comparison of the forecasted voltages. To diagnose anomalies in battery voltage, the paper proposes a fault diagnosis method that combines the Isolation Forest and Boxplot techniques. Finally, utilizing authentic electric vehicle data for validation, the research underscores the capability of the proposed method to achieve accurate voltage predictions six minutes in advance and provide effective fault diagnosis. This investigation carries substantial practical implications for fortifying battery management and optimizing the performance of electric vehicles.

1. Introduction

1.1. Motivations

In recent years, global issues related to fuel supply and environmental pollution have become increasingly prominent. Reducing carbon emissions is a goal that countries around the world are striving for. Against this backdrop, major global economies have successively put forward their carbon neutrality goals. Given that the transportation sector contributes significantly to global carbon emissions, the application of new energy vehicles will effectively reduce the consumption of fossil fuels and enhance energy efficiency, and the development of new energy vehicles has become one of the crucial global strategies for promoting carbon reduction. In recent years, the market share of electric vehicles worldwide has grown rapidly, driven by technological advancements [1]. The power battery system constitutes a pivotal element in electric vehicles, exerting substantial influence over their driving performance, safety, and longevity. Despite noteworthy enhancements in battery energy density and lifespan in recent decades, issues related to battery safety persist, forming a focal point for rigorous investigation. In recent years, there have been hundreds of incidents of thermal runaway in electric vehicles, posing threats to the safety of passengers and property [2]. In the actual operation of electric vehicles, the state of the battery is continually influenced by various random factors, including the environment, driving behavior, and weather. Battery cells or accessories may incur diverse faults owing to the aging process or misuse during practical application. Numerous studies highlight that voltage abnormalities can precipitate various battery faults, broadly categorized into four types: overvoltage, undervoltage, rapid voltage fluctuations, and inadequate battery voltage uniformity. For instance, overvoltage suggests potential issues such as overcharging in the battery system and the deactivation of charging protection circuits. When a battery pack experiences overcharging, it triggers an overvoltage fault, and the cell with the highest voltage will be the first to be overcharged. Excessive energy is then fed into some cells within the battery pack, potentially leading to thermal runaway more intensively than in other abusive conditions. Due to the hazards of overcharging, scholars have conducted detailed studies on the occurrences of side reactions, temperature changes, gas generation, and other aspects during the overcharging process [3]. Saito et al. [4] demonstrated through experimental research that the heat generated by the battery is positively correlated with the charging current, indicating that Ohmic heating is a significant heat source during the overcharging process. Lin et al. [5] revealed the mechanism of side reactions induced by overcharging. Initially, lithium dendrites form on the surface of the anode. Subsequently, excessive lithium ion deposition causes the collapse of the cathode structure, generating a large amount of heat and O2. Simultaneously, the release of O2 accelerates the decomposition of the electrolyte, producing a significant amount of gas and leading to an increase in internal battery pressure, resulting in expansion or explosion. Undervoltage signifies over-discharging of the battery system or internal short circuits. When an internal short circuit fault occurs in the power battery pack, with the generation of a large current, the temperature of the battery pack rises rapidly within a short period, leading to severe thermal runaway [6,7]. Some researchers have employed methods such as mechanical penetration, compression, implantation of shape memory alloys, and extreme temperature testing to obtain the dynamic characteristic parameters of internal short circuit faults. They have also constructed models for internal short-circuit faults in lithium-ion batteries [8,9,10]. Furthermore, voltage abnormalities imply the potential occurrence of more severe faults. Due to the inconsistency in the voltage of the battery pack, when the battery management system fails to effectively monitor the individual voltages of power battery cells, the cell with the lowest voltage will experience over-discharge first. The mechanism of over-discharge is different from other types of misuse, and its potential danger is often overlooked. In a series-connected battery pack, cells with voltages below the cutoff voltage are forcibly discharged, leading to a magnetic pole reversal, the battery voltage becoming negative, and consequently causing abnormal heating of the battery. During the over-discharge process, excessive lithium removal from the anode leads to the dissolution of the SEI membrane, generating CO or CO2 gas and causing cell expansion. When the over-discharged battery is recharged, a new SEI membrane will form on the anode surface. At the same time, the regenerated SEI membrane alters the electrochemical characteristics of the anode, resulting in an increase in cell impedance and a decrease in capacity [11]. Additionally, the dissolution of the copper foil, internal migration, and deposition of copper not only lead to a decrease in battery capacity but may also trigger internal short circuits, thereby causing thermal runaway. Undetected faults may negatively impact battery safety, and under extreme conditions, they may escalate into thermal runaway within the battery system [12,13]. Incidents of fire in electric vehicles pose a substantial threat to human life and property [14,15]. Consequently, timely and precise voltage prediction and fault diagnosis assume paramount importance in ensuring the secure operation of vehicles and furnishing decision-making support for battery management.

1.2. Lithium-Ion Power Battery Overview

Lithium-ion power batteries are primarily composed of a positive electrode, a negative electrode, a separator between the positive and negative electrodes, a lithium salt electrolyte, a positive temperature coefficient (PTC) element, and a safety valve. The positive electrode typically provides sites for the acceptance and diffusion paths of lithium ions, largely determining the overall performance of the power battery. Currently, the most common positive electrode materials include LiCoO2, LiMn2O4, LiFePO4, and ternary materials composed of various metal oxides. The negative electrode's active material is usually a paste-like substance composed of carbon materials, binders, and organic solvents coated on a copper base in a thin layer. In addition, some new types of fast-charging batteries use Li4Ti5O12 as the negative electrode material. The separator is used to isolate the flow of electrons between the positive and negative electrodes, allowing only lithium ions to pass through. It is generally made of microporous films of polyethylene or polypropylene. The electrolyte is responsible for ion transmission and is typically a lithium salt electrolyte with high capacitance mixed with organic solvents. The electrolyte must exhibit chemical stability with the active material and adapt well to the intense oxidation–reduction reactions that occur during the charge and discharge processes. To ensure safety during use, lithium-ion power batteries typically incorporate a cutoff device for abnormal currents, usually a PTC component. Despite this, abnormal increases in internal battery pressure may still occur during use. To address this situation, the installation of a safety valve can effectively release high-pressure gas, preventing the power battery from rupturing.
The differences in the positive and negative electrode materials, electrolyte materials, and production processes of lithium-ion power batteries result in batteries exhibiting different performances and having different names. Currently, lithium-ion power batteries on the market are often named based on the positive electrode material. The common abbreviations, positive electrode material, and performance characteristics of lithium-ion power batteries are listed in Table 1.

1.3. Research Review

Presently, numerous scholars have devoted substantial efforts to diagnosing and predicting faults in battery systems, resulting in a considerable repository of literature. This body of literature introduces a plethora of fault diagnosis methods, primarily categorized into three groups: knowledge-based, model-based, and data-driven fault diagnosis approaches [16].
Knowledge-based diagnostic methods leverage the knowledge of battery systems and are particularly suitable for nonlinear and complex lithium-ion battery systems without the need for developing mathematical models. The most widely used knowledge-based approaches include methods based on graph theory, fuzzy logic, and the expert system. Specifically, by employing graph theory, such as directed graphs [17] and fault mode and effect analysis [18], it is possible to construct a fault diagnosis network based on the fault propagation relationships among various components in the system. Relevant search theory is then applied to locate faults. The expert system is a computer program designed to simulate the reasoning and decision-making of human experts [19]. Knowledge and rules are established using the rich experience of historical databases and domain experts. Fuzzy logic, through the use of fuzzy parameters, fuzzy models, and fuzzy thresholds, can be applied to fault diagnosis. Xia et al. [20] designed an external short-circuit experiment for lithium-ion batteries, proposing a fundamental logical framework for diagnosing external short-circuit faults based on parameters that significantly change during external short-circuit processes: temperature change rate, battery threshold, and voltage threshold. Duan et al. [21], based on the standard deviation of selected indicators calculated using information entropy, set certain thresholds to assess individual inconsistency.
Model-based methods involve constructing a model that can simulate the dynamic characteristics of a battery, accurately depicting the evolution of the battery state under normal or faulty conditions. The model's estimated values are then compared with the actual values from the operation of a real vehicle to form a residual signal [22], with the size of the residual determining whether the battery is faulty [23]. Son et al. [24] devised a two-step stochastic fault detection and diagnosis algorithm for lithium-ion batteries, aiming to refine the model of lithium-ion battery units and identify anomalous operations within standard operating conditions. Dey S et al. [25] proposed a diagnostic algorithm for thermal faults in lithium-ion batteries, leveraging a two-state thermal model that captures the dynamics of battery surface and cell temperature with the goal of diagnosing various battery faults. Yang et al. [26] introduced a fractional-order model and a first-order RC model to characterize the electrical response of battery units during external short-circuit faults in lithium-ion batteries. Zhang H et al. [27] suggested a recursive least squares algorithm for parameter identification, incorporating memory constraints to address and eliminate the occurrence of “imaginary” parameters. This method is applied to identify the resistance in parallel battery packs. Gong et al. [28] presented a data-driven, bidirectional modeling approach for lithium-ion batteries. Additionally, Kim et al. [29] outlined a fault safety design methodology for lithium-ion battery systems, offering precise fault localization and utilizing easily measurable signals at module terminals for fault assessment. Li et al. [30] proposed a joint estimation strategy for battery capacity and state of charge (SOC) based on a first-order RC model. This method optimally combines the strengths of both the RC model and SOC joint estimation, ensuring accuracy without imposing stringent requirements on environmental temperature distribution. Wang et al. [31] introduced a model-based fault diagnosis approach for evaluating the insulation status of battery packs. Similarly, Liu et al. [32] presented a model-based scheme for detecting and isolating sensor faults in series battery packs. They employed adaptive extended Kalman filtering to estimate the state of each unit, generating residual signals by comparing estimated voltage values with measured voltage values. In essence, model-based methods offer a precise depiction of the battery's evolution under both normal and faulty conditions.
Numerous studies have suggested the effective application of data-driven techniques in the domain of power battery fault diagnosis and prediction. Hong et al. [33], through continuous monitoring of battery temperature during vehicle operation, achieve simultaneous diagnosis and prediction of thermal runaway resulting from temperature faults. Additionally, a safety management strategy for thermal runaway is proposed using the Z-score method. Zhang et al. [34] utilize a multidimensional fault diagnosis approach for the quantitative analysis of the complete lifecycle data from real thermal runaway vehicles. This approach involves diagnostics for battery voltage range, identification of abnormal cells, voltage jump diagnosis, and temperature range diagnosis, with the goal of uncovering potential faults in the power battery. Li et al. [35], through the integration of LSTM and CNN, propose a heat runaway prediction model based on abnormal heating. This model facilitates an 8-min advance prediction of battery temperature, offering drivers ample reaction time.
Li et al. [36] introduced a multi-fault online diagnostic method that integrates non-redundant measurement topology and weighted Pearson correlation coefficients. The approach identifies diverse circuit faults by assigning different forgetting factors to measurement data. Yang et al. [37], utilizing cyclic experimental data from automotive lithium batteries, proposed a gray model algorithm to predict battery capacity degradation. Zhao et al. [38] developed a fault prediction model using capacity degradation data from lithium-ion batteries. The model, based on LSTM neural networks, estimates pseudo-fault life upon reaching the fault threshold. Kang et al. [39] introduced a multi-fault online diagnostic method that employs non-redundant cross-type measurement circuits and an enhanced correlation coefficient approach. The method discriminates unit faults from other faults by analyzing the correlation coefficients of adjacent voltages with fault indicators. Moreover, it isolates connection faults and voltage sensor faults by examining the correlation coefficients of adjacent voltage differences and current. Hu et al. [40] devised a method for predicting the health of electric vehicle batteries through sample entropy and sparse Bayesian prediction modeling. Nevertheless, stability concerns persist in an online vehicle environment.
In summary, existing research has several shortcomings in the following aspects: Graph theory has explicit causal relationships, and its diagnostic results are easy to interpret. However, a thorough understanding of the fault mechanism is required for graph theory, and the complex fault mechanism of battery systems makes it difficult to establish an accurate diagnostic network. Expert system methods do not need to be based on a physical model; however, when applied to battery systems, there are also some problems, such as difficulties in knowledge acquisition and inaccurate knowledge representation. Some fuzzy parameters of battery faults can be addressed using fuzzy logic methods, but formulating effective rules remains a significant challenge. Model-based methods generally have the following disadvantages: First, diagnosis heavily depends on modeling techniques and requires high model accuracy; Second, in many studies, these models are only applicable to certain types of faults; Third, it is difficult to present appropriate thresholds; and thresholds are often influenced by various factors, including modeling errors, random disturbances, and system inputs and outputs. Data-driven methods based on battery temperature characteristics typically have the following drawbacks: First, calculating temperature differences between batteries often takes a long time, posing inherent latency issues; Second, temperature sensors are uniformly distributed in lithium-ion batteries, not equipped with sensors for each battery, making it impossible to locate specific faulty batteries. Data-driven methods based on voltage prediction can achieve multi-step predictions, but as the number of prediction steps increases, the prediction accuracy significantly decreases. Moreover, a large number of manually optimized hyperparameters make the model less versatile.

1.4. Contributions

This article contributes in the following aspects:
(1)
New Voltage Prediction Method: The article introduces an innovative battery voltage prediction approach based on the modified GBDT. This method facilitates swift and precise voltage prediction for multiple battery cells. Its exceptional training capability and heightened predictive accuracy have been validated.
(2)
Comprehensive Consideration of Vehicle States: In this study, diverse intrinsic factors of the vehicle in both operational and charging states are examined. These factors encompass battery total current, probe temperature, insulation resistance, and SOC. Additionally, factors pertaining to driving behavior, such as speed and operational smoothness, are taken into consideration. The comprehensive evaluation of these multidimensional factors augments the precision and comprehensiveness of battery voltage prediction in this paper.
(3)
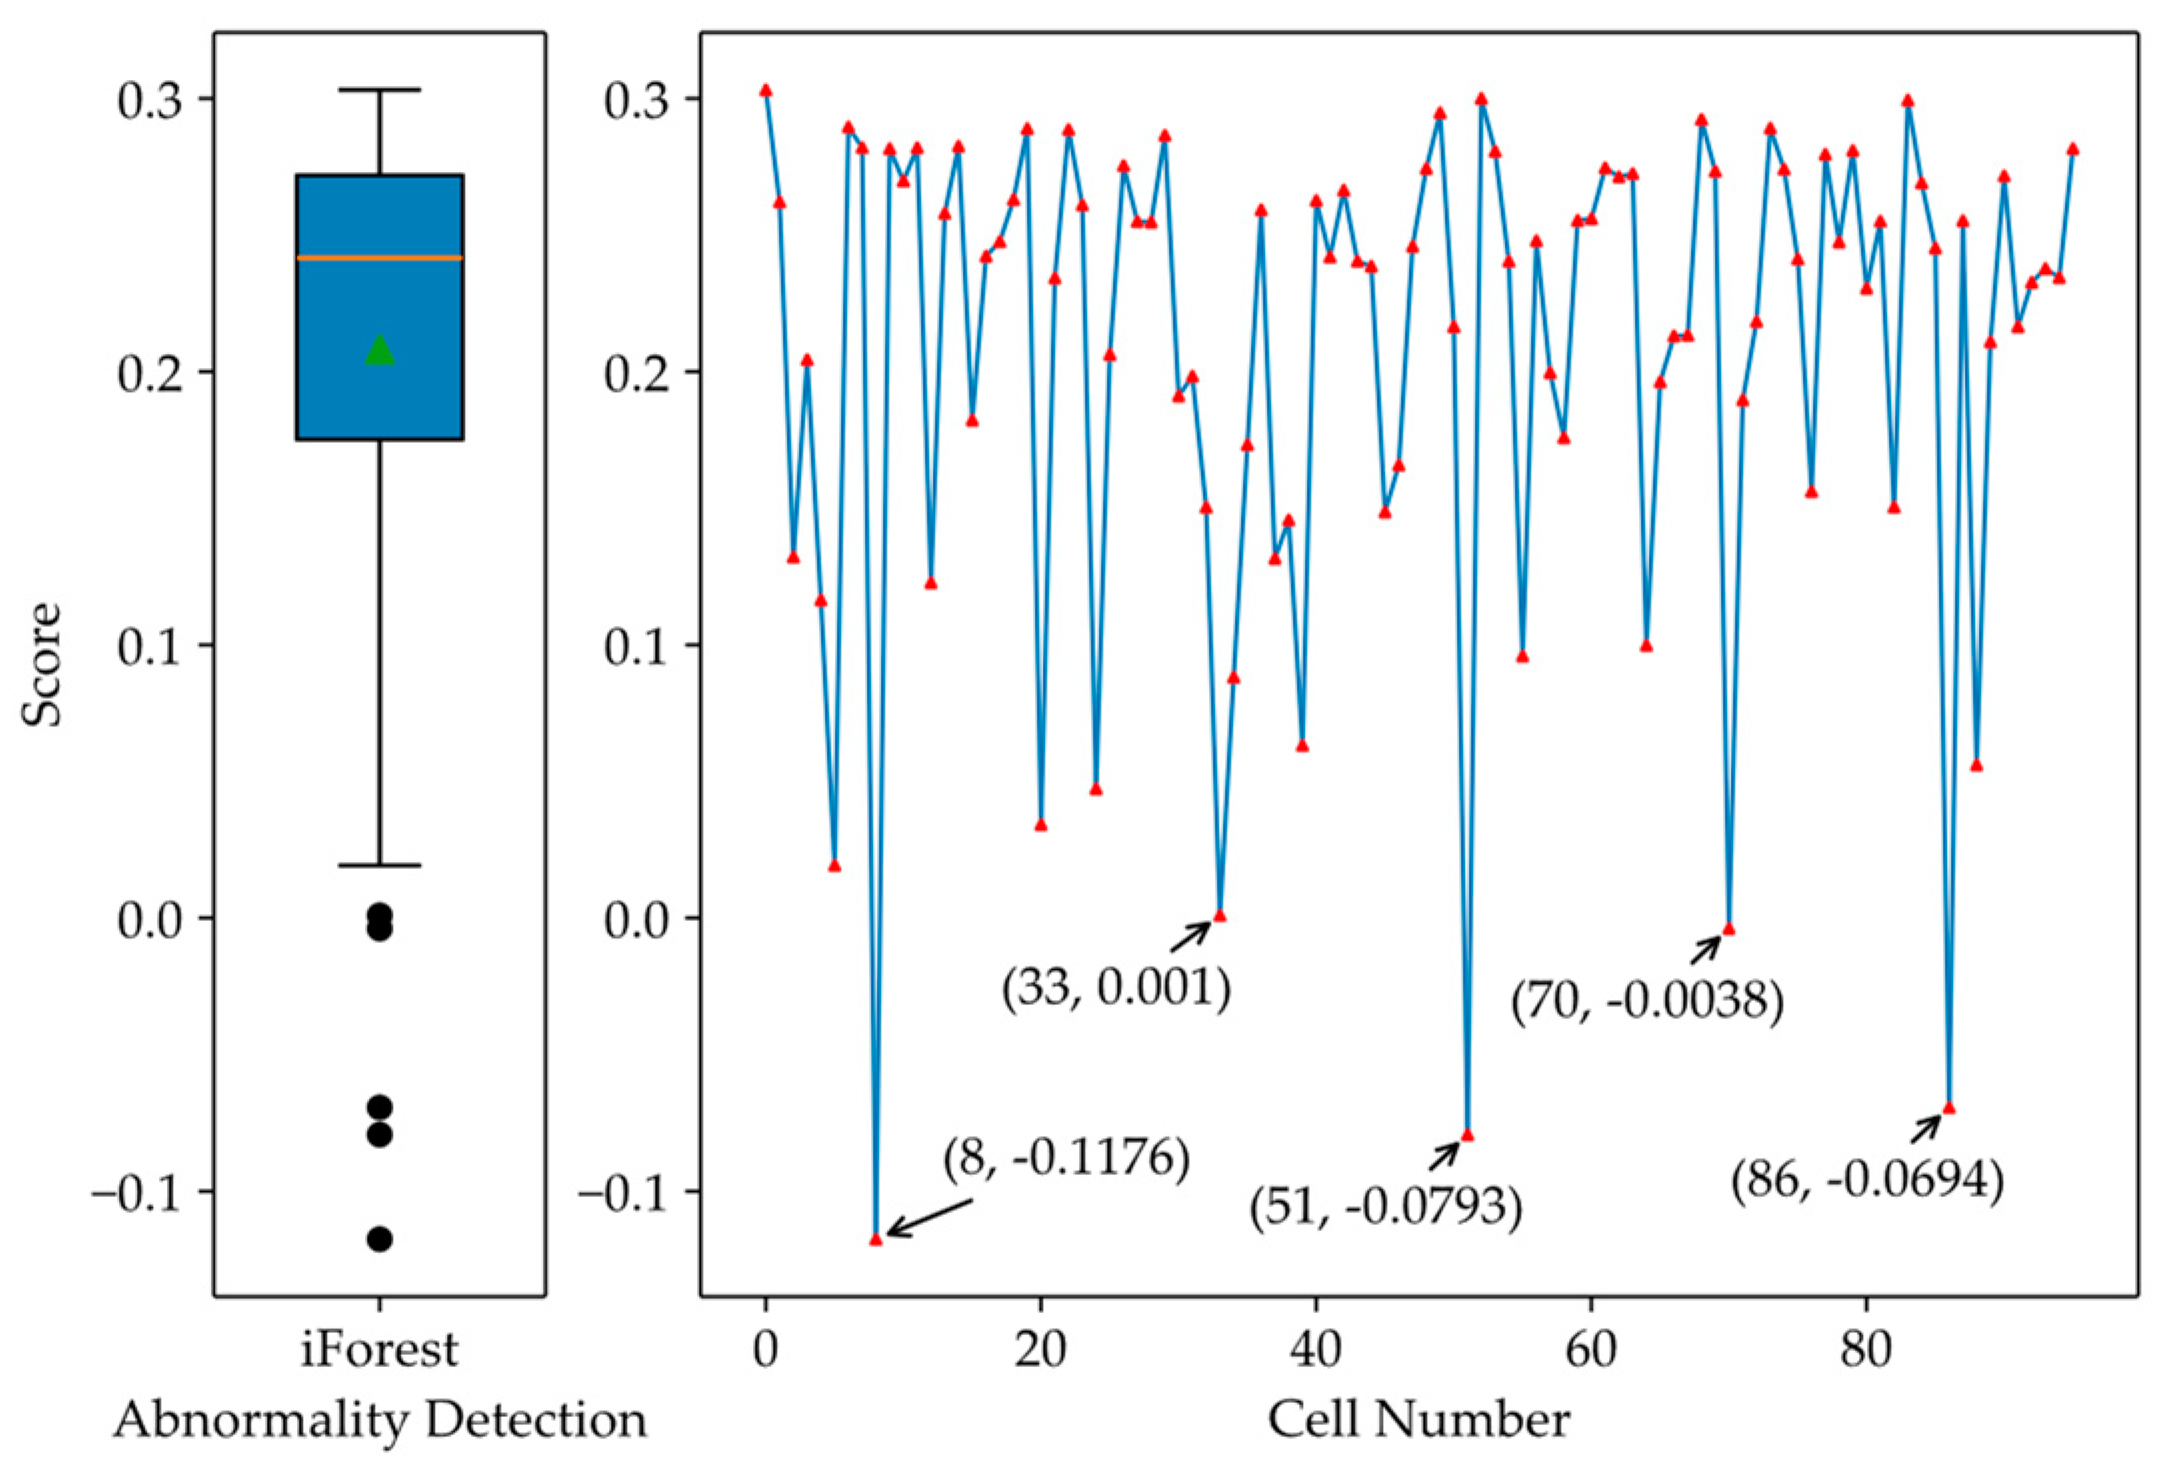
Anomaly Detection: iForest is used to calculate the abnormal score of each battery cell, and then Boxplot is used to diagnose the above-obtained scores; the abnormal cells are identified based on the scores. iForest and Boxplot are used for joint fault diagnosis to reduce the false alarm rate of abnormality detection and improve the accuracy of power battery abnormality prediction.
Through these enhancements, the abnormal battery voltage prediction method in this paper can more precisely anticipate potential battery faults, showcasing broad applicability in practical scenarios.

1.5. Organization of Paper

This article’s second section provides a brief overview of actual vehicle operational data gathered from the National Monitoring and Management Center for New Energy Vehicles (NMMCNEV), along with details on data preprocessing methods. The third section introduces the proposed power battery voltage prediction method, fault diagnosis method, and specific process in detail. In the fourth section, the voltage prediction results are presented, followed by a comprehensive discussion and validation to assess the method's robustness and adaptability. The fifth section explains real-world power battery fault diagnosis results and verifies effectiveness. Finally, the sixth section summarizes key findings, and the overall framework of this paper is shown in Figure 1.

2. Data Description and Processing

In this study, the data were acquired from the National Monitoring and Management Center for New Energy Vehicles (NMMCNEV). NMMCNEV is a big data platform established for administrative supervision and management of new energy vehicles in China. The data include voltage data for individual battery cells, total current, SOC, probe temperature, and other parameters. This study specifically utilizes data from vehicles with identified faults to conduct research. The electric vehicle model selected in this paper is the announced model BJ7000C5E4-BEV, which is manufactured by BAIC Motor Co., Ltd. (Beijing, China), as shown in Figure 2. The relevant parameters of the vehicle are presented in Table 1. The power battery type is NMC, characterized by high energy density, high specific capacity, and good cycling performance. The battery capacity typically decreases to 80% of the initial capacity after more than 500 cycles, as indicated in Table 2.
This dataset is employed for training and validating the proposed battery anomaly prediction method presented in this paper, assessing both its effectiveness and timeliness.
The operating data matrix of electric vehicles collected in NMMCNEV can be expressed as Formula (1):
P = T i m e , A , S , T , a 1 , a 2 , , a n ,
Among these, P denotes the structured data matrix, encompassing essential parameters such as time, total current, total voltage, SOC, probe temperature, vehicle status, charging status, and more. a n signifies the data vector of the n -th data item. Illustratively, considering T i m e matrix, total voltage matrix A , the vehicle status parameter matrix S , and probe temperature matrix T , the specific expression matrix of each dataset item is as shown in Formulas (2)–(5):
T i m e = t i m e 1 , t i m e 2 , , t i m e i , , t i m e j T ,
where t i m e i means at data collection time i ( i = 1 , 2 , 3 , , j ) .
A = U 1 , 1 U 1 , 2 U 1 , k U 2 , 1 U 2 , 2 U 2 , k U t , h U j , 1 U j , 2 U j , k ,
where k is the number of battery cells, j is the number of rows corresponding to different sampling times, and U t , h represents the voltage value of the battery cell h ( h = 1 , 2 , 3 , , k ) at time t ( t = 1 , 2 , 3 , , j ) .
S = I 1 v 1 s o c 1 r 1 I t v t s o c t r t I j v j s o c j r j ,
where I t , v t , s o c t , r t represent the total current value of the battery pack, vehicle driving speed, SOC, and insulation resistance value at time t ( t = 1 , 2 , 3 , , j ) .
T = T 1 , 1 T 1 , 2 T 1 , m T 2 , 1 T 2 , 2 T 2 , m T t , l T j , 1 T j , 2 T j , m ,
where m is the number of temperature probes, j is the number of rows corresponding to different sampling times, and T t , l represents the temperature value of the temperature probe l ( l = 1 , 2 , 3 , , m ) at time t ( t = 1 , 2 , 3 , , j ) .
During vehicle operation, external factors influencing data are challenging to fully control, resulting in potential anomalies like missing or inaccurate data within the collected raw data. In response to these challenges, this study extracts and integrates data, employing linear interpolation to supplement partially missing or inaccurate data. Concurrently, consecutive frames containing missing or inaccurate data are eliminated to improve data accuracy and reliability. These data processing methods contribute significantly to subsequent analytical and research endeavors. The methods are shown below:
(1)
Linear interpolation method processing:
If P i is part of the data that is missing or wrong, it will be processed using linear interpolation:
P i = P i 1 + ( t i m e i t i m e i 1 ) P i + 1 ( t i m e i t i m e i 1 ) P i 1 ( t i m e i + 1 t i m e i 1 ) ,
(2)
Deletion method:
If P represents continuous data with missing values and errors, this part of the data will be deleted directly.

3. Battery Fault Diagnosis Model Combining the Modified GBDT and iForest-Boxplot

In this study, we develop a novel model for predicting faults in battery systems by combining the modified GBDT with the iForest-Boxplot method. The model comprises two primary steps. First, the modified GBDT predicts the voltage of individual battery cells. Second, the iForest-Boxplot method is applied to detect anomalies in the predicted voltages. Specifically, iForest calculates anomaly scores for each individual battery cell, followed by the utilization of a Boxplot to identify anomalous cells. This research aims to improve the fault diagnosis capability of battery systems, offering effective safeguards for their safety and reliability.

3.1. Battery Cell Voltage Prediction Model Based on the Modified GBDT

GBDT is an ensemble learning method based on decision trees. Its core idea involves introducing new decision trees iteratively, with each tree correcting the errors of the previous one, gradually improving the overall accuracy of the model [41]. The algorithm uses gradient descent during the training process to minimize the loss function, combined with decision trees for modeling. Specifically, in each training round, the residuals from the previous round are used as the target to train a new round of CART trees, i.e., to fit the residuals. Typically, overfitting the training set can lead to a decrease in the model’s generalization ability. Regularization, by constraining the fitting process, can reduce the impact of overfitting. In this study, a regularization term is added to the original GBDT algorithm, as shown in formula (d) in Algorithm 1. The core idea is not to rely on a single decision tree but to consider each tree as capturing local information about the true relationship. Therefore, when stacking models, only the local contributions of each tree are accumulated. This approach, by collectively learning from multiple trees to compensate for their respective shortcomings, reduces the model’s complexity and has a stronger overfitting prevention effect compared to the original algorithm.
Algorithm 1. The Modified GBDT
  • Initialize f 0 ( x ) = arg min γ i = 1 N L ( y i , γ ) .
  • For m = 1 to M :
    (a)
    For i = 1 , 2 , , N compute
    r i m = [ L ( y i , f ( x i ) ) f ( x i ) ] f = f m 1
    (b)
    Fit a regression tree to the targets r i m giving terminal regions R j m , j = 1 , 2 , , J m .
    (c)
    For j = 1 , 2 , , J m compute
    γ j m = arg min γ x i R j m L ( y i , f m 1 ( x i ) + γ ) .
    (d)
    Update f m ( x ) = f m 1 ( x ) + λ j = 1 J m γ j m I ( x R j m ) .
    λ is learning rate, 0 < λ 1 .
  • Output f ( x ) ^ = f M ( x ) .
In order to comprehensively consider the impact of multiple characteristic parameters of the vehicle and battery on the battery voltage, this paper selects a series of key parameters as inputs to the model. These parameters encompass battery voltage, current, vehicle speed, SOC, insulation resistance, and probe temperature. Moreover, to consider the impact of smooth driving on battery voltage, we incorporate the average and variance of current and vehicle speed within specific time intervals as supplementary input features for a more precise representation of the vehicle’s operational condition. The average values of SOC and insulation resistance within specific time intervals serve as input features. For probe temperature, we utilize the average temperature from each probe and then aggregate these averages within specific time intervals as input features. By incorporating these comprehensive parameters, we can more fully capture the operational states of both the vehicle and the battery, thereby enhancing the accuracy of battery voltage prediction. The probe temperature matrix is processed as follows:
T a v g = T a v g , 1 , T a v g , 2 , , T a v g , t , , T a v g , j T ,
where
T a v g , t = l = 1 m T t , l m ,
where T a v g , t is the average value of m probe temperature at time t ( t = 1 , 2 , 3 , , j ) .
Take the average of T a v g , t during time period j :
T a v g = t = 1 j T a v g , t j ,
The state characteristic matrix B of electric vehicles in each sampling time period:
B n × k = I a v g I var v a v g v v a r s o c r T a v g × k ,
Among them, I a v g and I v a r represent the mean and variance of the total current during sampling time period j . v a v g and v v a r represent the mean and variance of the vehicle speed during sampling time period j , thereby indicating the driving behavior of the vehicle. s o c and r , respectively, represent the mean values of the battery state of charge and insulation resistance during the sampling time period j .
In summary, the input matrix of the voltage prediction model based on the modified GBDT is as follows:
C ( j + n ) × k = A B ,
In order to achieve power battery voltage prediction, the output matrix of the model is as follows:
D p × k = U j + 1 , 1 U j + 1 , 2 U j + 1 , k U j + 2 , 1 U j + 2 , 2 U j + 2 , k U j + t , h U j + p , 1 U j + p , 2 U j + p , k ,
where p is the prediction time steps (PTS), and U j + t , h is the voltage of the battery cell h at the time step t in the future predicted by the modified GBDT.

3.2. Anomaly Detection Based on iForest-Boxplot

Isolation Forest (iForest) [42] distinguishes itself from traditional methods that rely on metrics like distance and density for assessing the isolation among samples. Instead, it identifies anomalous data points by isolating individual samples. Unlike algorithms such as KMeans and DBSCAN, iForest does not necessitate the computation of distance- or density-related metrics. This lack of requirements significantly enhances speed and reduces system overhead. iForest can be viewed as an ensemble of multiple isolation trees (iTree):
I F = t 1 , t 2 , , t T ,
where T is the number of iTree.
The recognition process involves utilizing random hyperplanes to partition the data space, ensuring that each subspace accommodates only one data point. Anomalous points swiftly get allocated to a subspace, whereas denser normal data points necessitate multiple divisions. Points in the dataset exhibiting a shorter average search path length h ( x ) will be classified as anomalous.
h ( x ) = 1 T t I F h t ( x ) ,
where h t ( x ) is the number of iterations needed to isolate the sample x in the t -th isolated tree.
For real-time anomaly detection, the variable x denotes the voltage values of individual battery cells in the GBDT model's output matrix D . This yields the average search path length for each battery cell in the Isolation Forest model, denoted as the matrix H :
H k = h ( c e l l 1 ) , h ( c e l l 2 ) , , h ( c e l l i ) , , h ( c e l l k ) ,
where h ( c e l l i ) is the average search path length of the i-th battery cell within the iForest.
In this study, Boxplot is employed to detect the average search path length of each battery cell within iForest, identifying anomalous cells, and completing the anomaly detection for the power battery.

4. Voltage Prediction and Fault Diagnosis Results and Discussion

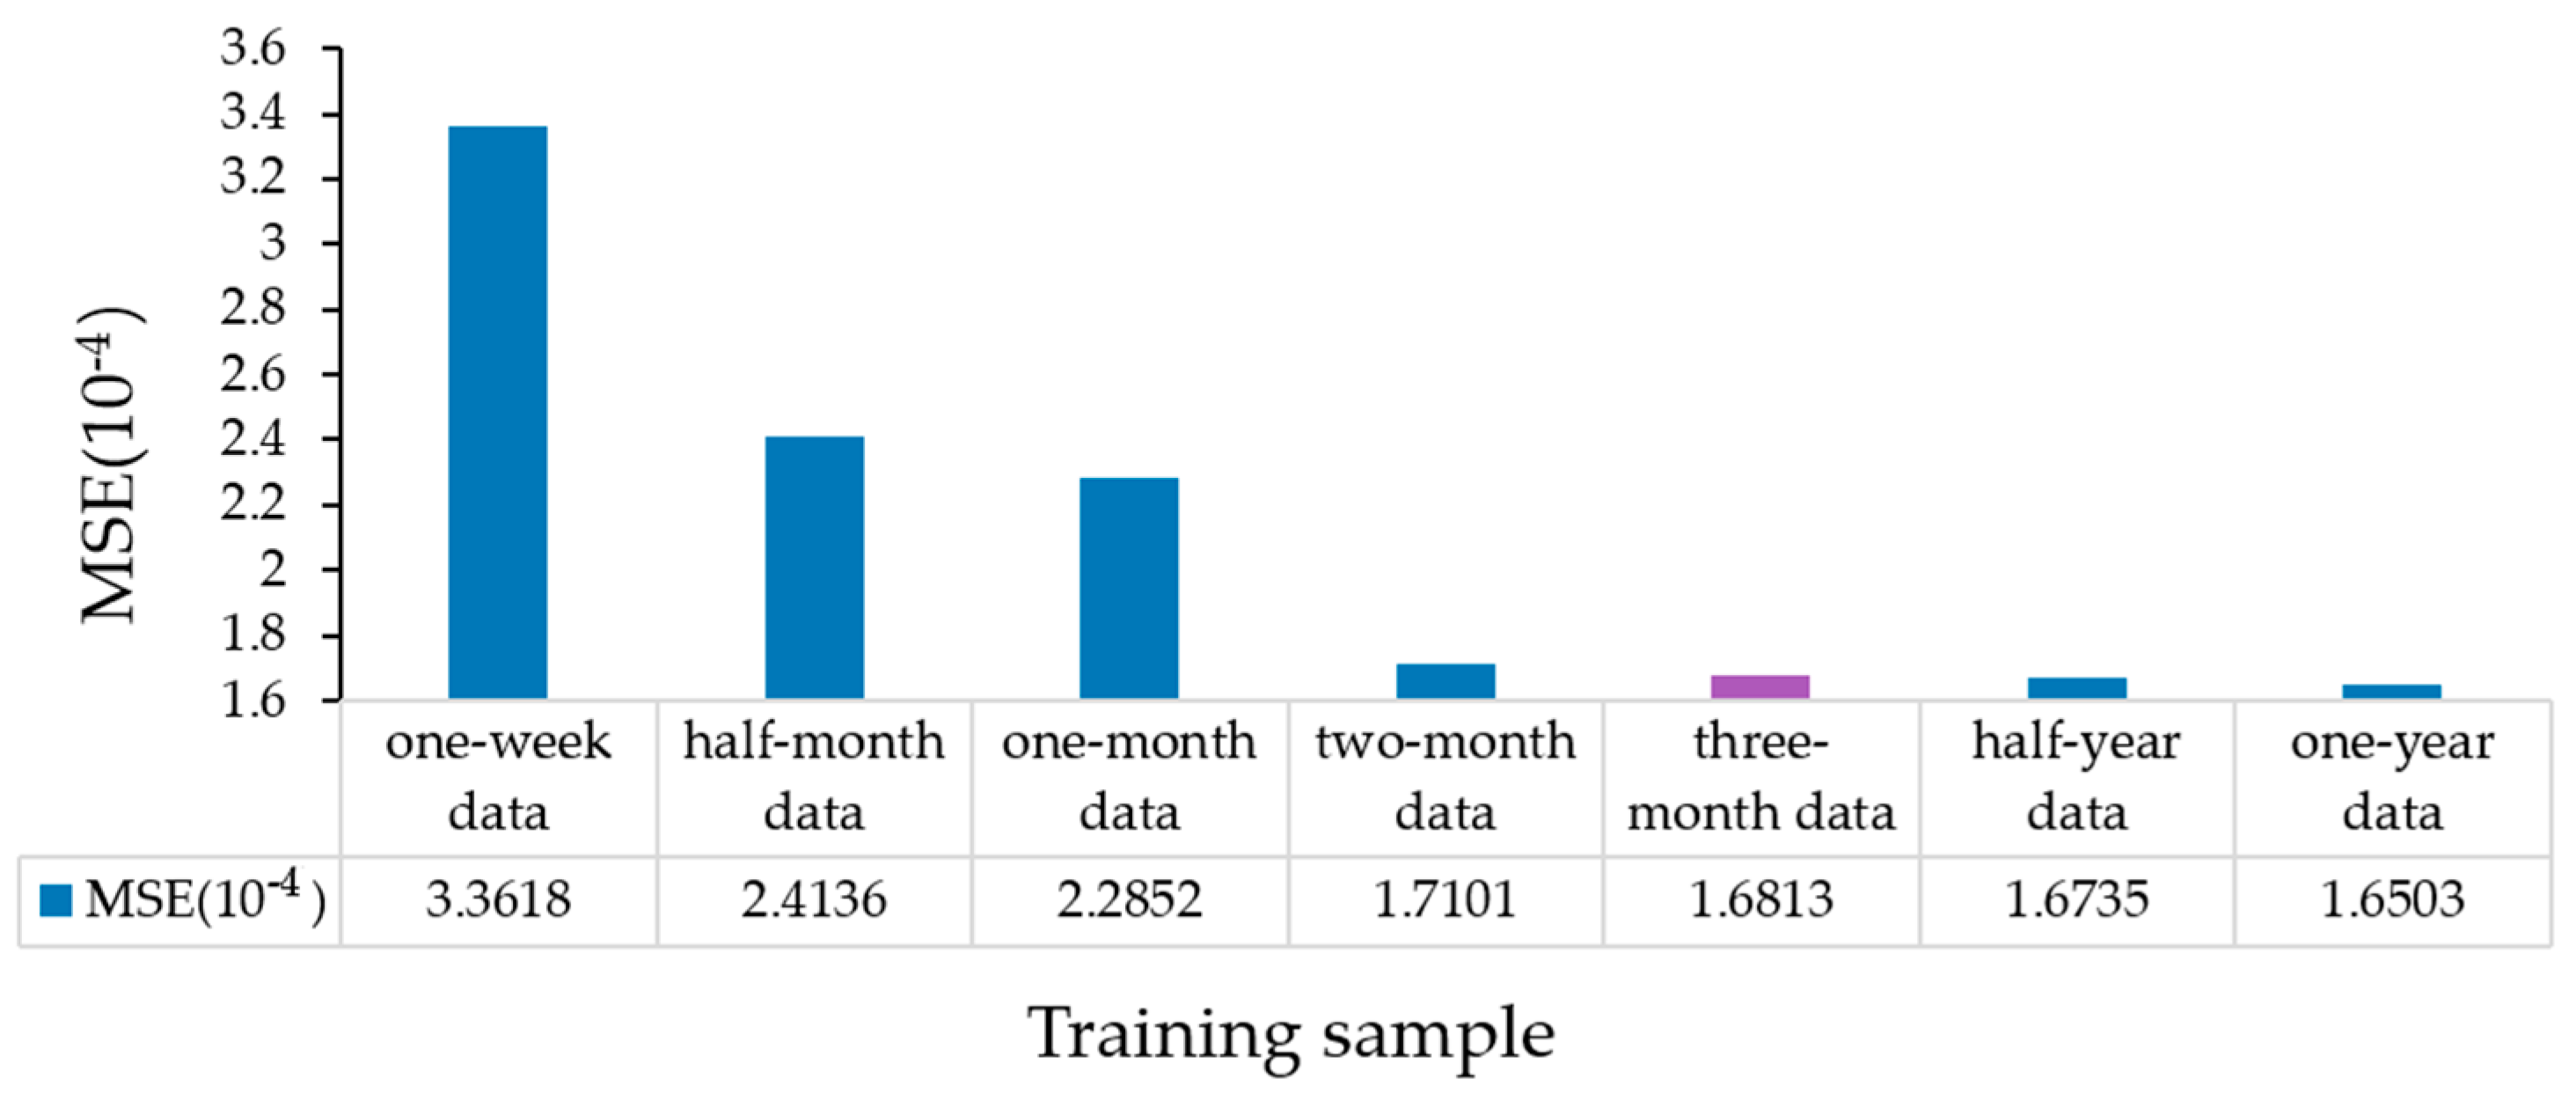
4.1. Optimization of Training Samples and Hyperparameters

During the training phase of the GBDT model, numerous parameters require configuration and optimization. However, this process is time-consuming, particularly when handling extensive datasets. Hence, this study initially defines a set of hyperparameters based on experience and progressively refines them to enhance the model. To verify and ensure model stability, 10-fold cross-validation is employed. For assessing the prediction efficacy of the trained GBDT model, mean square error (MSE) is chosen as the evaluation metric. The MSE formula in this study is expressed as:
M S E = 1 n i = 1 n ( U h U h ^ ) 2 ,
where n is the count of training or testing samples, U h and U h ^ denote the actual and predicted voltage values of the battery system. MSE is employed in this study to assess the prediction outcomes of each cross-validation iteration on the test data. The ultimate training MSE is the mean MSE derived from ten cross-validation models. Through MSE computation, we gauge the predictive efficacy of the model and ascertain the optimal parameter configurations.
The GBDT model’s loss function and learning rate serve as hyperparameters during the training process. With an increase in the learning rate, the model undergoes phases of under-fitting, optimal fitting, and over-fitting, causing the MSE to decrease and subsequently increase after reaching its minimum. Hence, selecting the appropriate learning rate and loss function is crucial, as depicted in Figure 3. The corresponding MSE for different learning rates and loss functions is presented in the figure. Notably, when the loss function is the absolute error and the learning rate (denoted as λ ) is set to 0.12, the MSE reaches its minimum, signifying the optimal performance of the GBDT voltage prediction model.
To ensure the accuracy and timeliness of the prediction model, optimizations are conducted for the training sample, training time step, and predicting time step (PTS). Initially, the training sample is set to one month of data, the training time step is set to 180, representing half-hourly data, and PTS is set to 30, corresponding to five-minute data. The proposed GBDT model is trained using the training data of the first group of vehicles. To facilitate the comparison of training effects with different training sample sizes based on preset hyperparameters, various-sized training samples from the first group of data are input into the GBDT model for pre-training. The prediction results of battery voltage are then validated through 10-fold cross-validation. Based on the data shown in Figure 4, the following observations can be made: When the size of the training sample exceeds three months of data, meaning the training data cover a longer period of historical records, the MSE shows no significant change. This implies that adding more training samples does not notably improve the predictive performance of the model. However, when the training sample is less than three months of data, indicating that the training data cover only a short period of historical records, the MSE value significantly increases. This indicates that with fewer training samples, the model fails to fully learn the battery voltage characteristics under different vehicle states, leading to a decrease in predictive performance.
In summary, considering the trend of MSE changes and the balance between the time and accuracy of model training, we can conclude that a three-month training dataset can effectively cover various vehicle states and is selected as the training sample in this study to achieve better battery voltage prediction performance.

4.2. Comparison of Different PTSs

To achieve timely and accurate prediction of power battery anomalies, two factors need to be considered. On the one hand, to maximize the accuracy of voltage prediction, provide more precise data for voltage anomaly diagnosis, thereby enhancing the accuracy of safety warnings. On the other hand, while ensuring the accuracy of predictions, the PTS of GBDT should be as long as possible. This gives the driver more time to respond to impending anomalies. Therefore, this paper conducted MSE comparative experiments with different PTSs. The experiments included 10 different PTSs, denoted as PTS = 6, 12, 18, 24, 30, 36, 42, 48, 54, and 60, corresponding to predicting battery voltage for the next 1, 2, 3, 4, 5, 6, 7, 8, 9, and 10 min, respectively. As shown in Figure 5, when PTS is too long, it results in a larger MSE, making precise battery voltage prediction unattainable. Conversely, when PTS is too short, timely alarms cannot be achieved. Considering both factors, this paper selects PTS = 36, where the MSE is 1.6959 × 10⁻⁴.

4.3. Comparison of Different Training Time Steps

The initially set hyperparameters of the model indicate that the initial training time step is configured as 180, representing half-hourly battery voltage data. For the sake of prediction accuracy and timeliness, a further comparison of MSE is conducted with time steps set at 60, 90, 120, 180, 240, and 300. This implies inputting historical data of 10, 15, 20, 30, 40, and 50 min into the modified GBDT model, respectively. The MSE results are depicted in Figure 6. When time steps are set to 60 and 90, the model’s predicted mean squared error (MSE) is relatively high, indicating lower accuracy in voltage prediction. As the time steps increase to 120, there is a noticeable decrease in MSE, signifying improved accuracy in voltage prediction. Beyond 120 time steps, the change in MSE becomes less pronounced. However, with an increase in time steps, the model training time also increases, leading to a decrease in timeliness. In summary, setting time steps to 120 achieves a balance between accuracy in voltage prediction and meeting timeliness requirements.

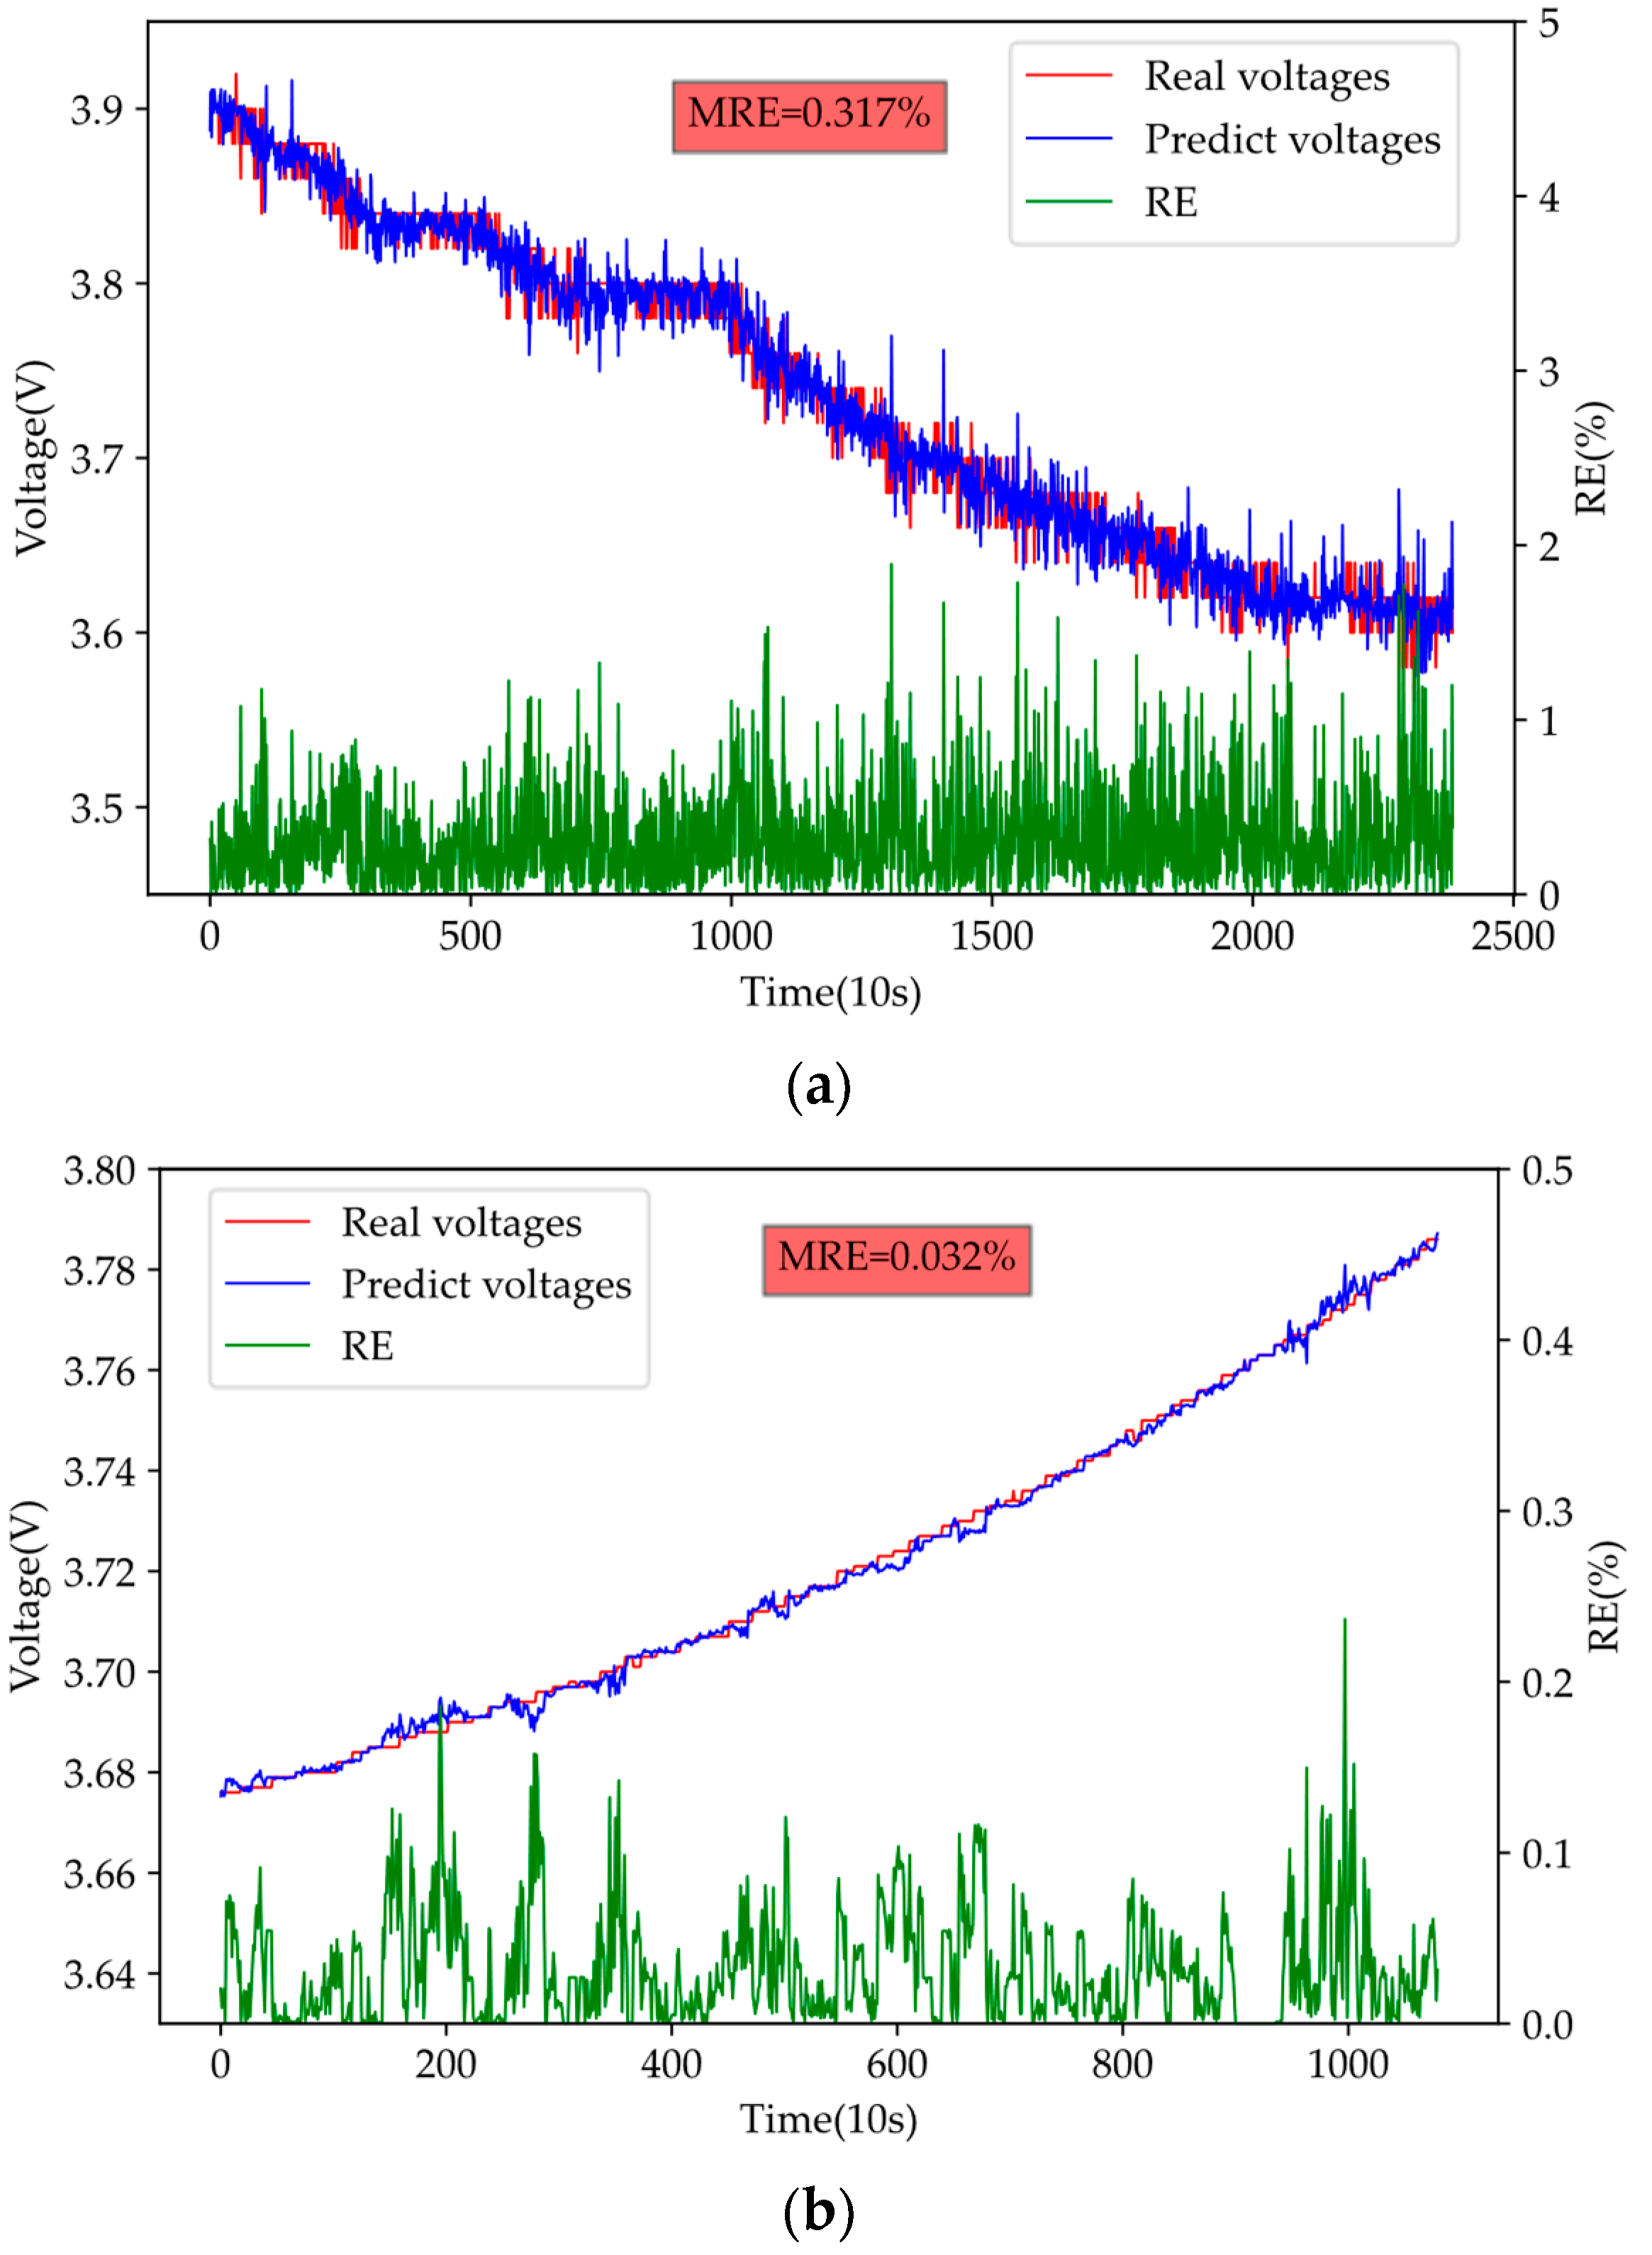
4.4. Battery Voltage Prediction Results and Discussion

Based on the model hyperparameters determined in the previous three sections, we chose a training sample of 3 months of data, a PTS of 36, and a training time step of 120 for voltage prediction. To validate the accuracy of the model for battery voltage, we conducted 10-fold cross-validation and experiments for parameter tuning. When evaluating prediction errors, we employed the relative error (RE) to measure the accuracy of predictions for each time step, which can be described as follows:
R E = | U h U h ^ | U h × 100 % ,
For the visualization of the model’s voltage prediction outcomes, we input the validation data from the faulty vehicle into the GBDT model. Figure 7 presents a comparative display of the predicted voltage and RE. The chart distinctly demonstrates that GBDT attains accurate voltage predictions for the identical vehicle, exhibiting an MRE of 0.321% during this timeframe. MRE is defined as:
M R E = 1 n i = 1 n R E i

4.5. Validate Robustness and Adaptability with Real-World Vehicle Data

An effective battery voltage prediction method should be applicable to a broader range of vehicles and diverse vehicle states. Therefore, the robustness and adaptability of this model are validated using data from other vehicles of the same model. The vehicle data are categorized into two states: the vehicle operational state and the parked charging state. The MREs for these two states are 0.317% and 0.032%, respectively. The actual voltage values and predicted voltage values for each state are depicted in Figure 8. The sufficiently small RE and MRE indicate that the voltage prediction model performs well in predicting voltages for 36-time steps across vehicles with the same specifications.

4.6. Algorithm Superiority Verification

In order to assess the effectiveness of the proposed voltage prediction method, MSE is chosen as the comparative metric. The comparative analysis involves assessing the model against linear regression, random forest, support vector machine (SVM), LightGBM, and XGBoost models. The results of the comparative analysis are detailed in Table 3. The results indicate that the method proposed in this paper demonstrates the lowest MSE, signifying a high level of precision in voltage prediction. Notably, this method outperforms other approaches, particularly in the domain of timely voltage prediction.
Existing efforts to predict future battery states mainly rely on the characteristics of current battery parameters, rarely directly predicting future parameters, as shown in [33]. Some of them estimate the current parameter state or predict the next parameter state. The proposed GBDT model can achieve real-time prediction. Therefore, the prediction results of the proposed GBDT model at PTS = 1 are taken as the comparison object. It is compared with other algorithms mentioned in the literature, as shown in Table 4. The comparative results in Table 4 indicate that the proposed predictive model in this paper has competitive predictive performance compared to other methods.

5. Real-World Power Battery Anomaly Prediction Results and Verification

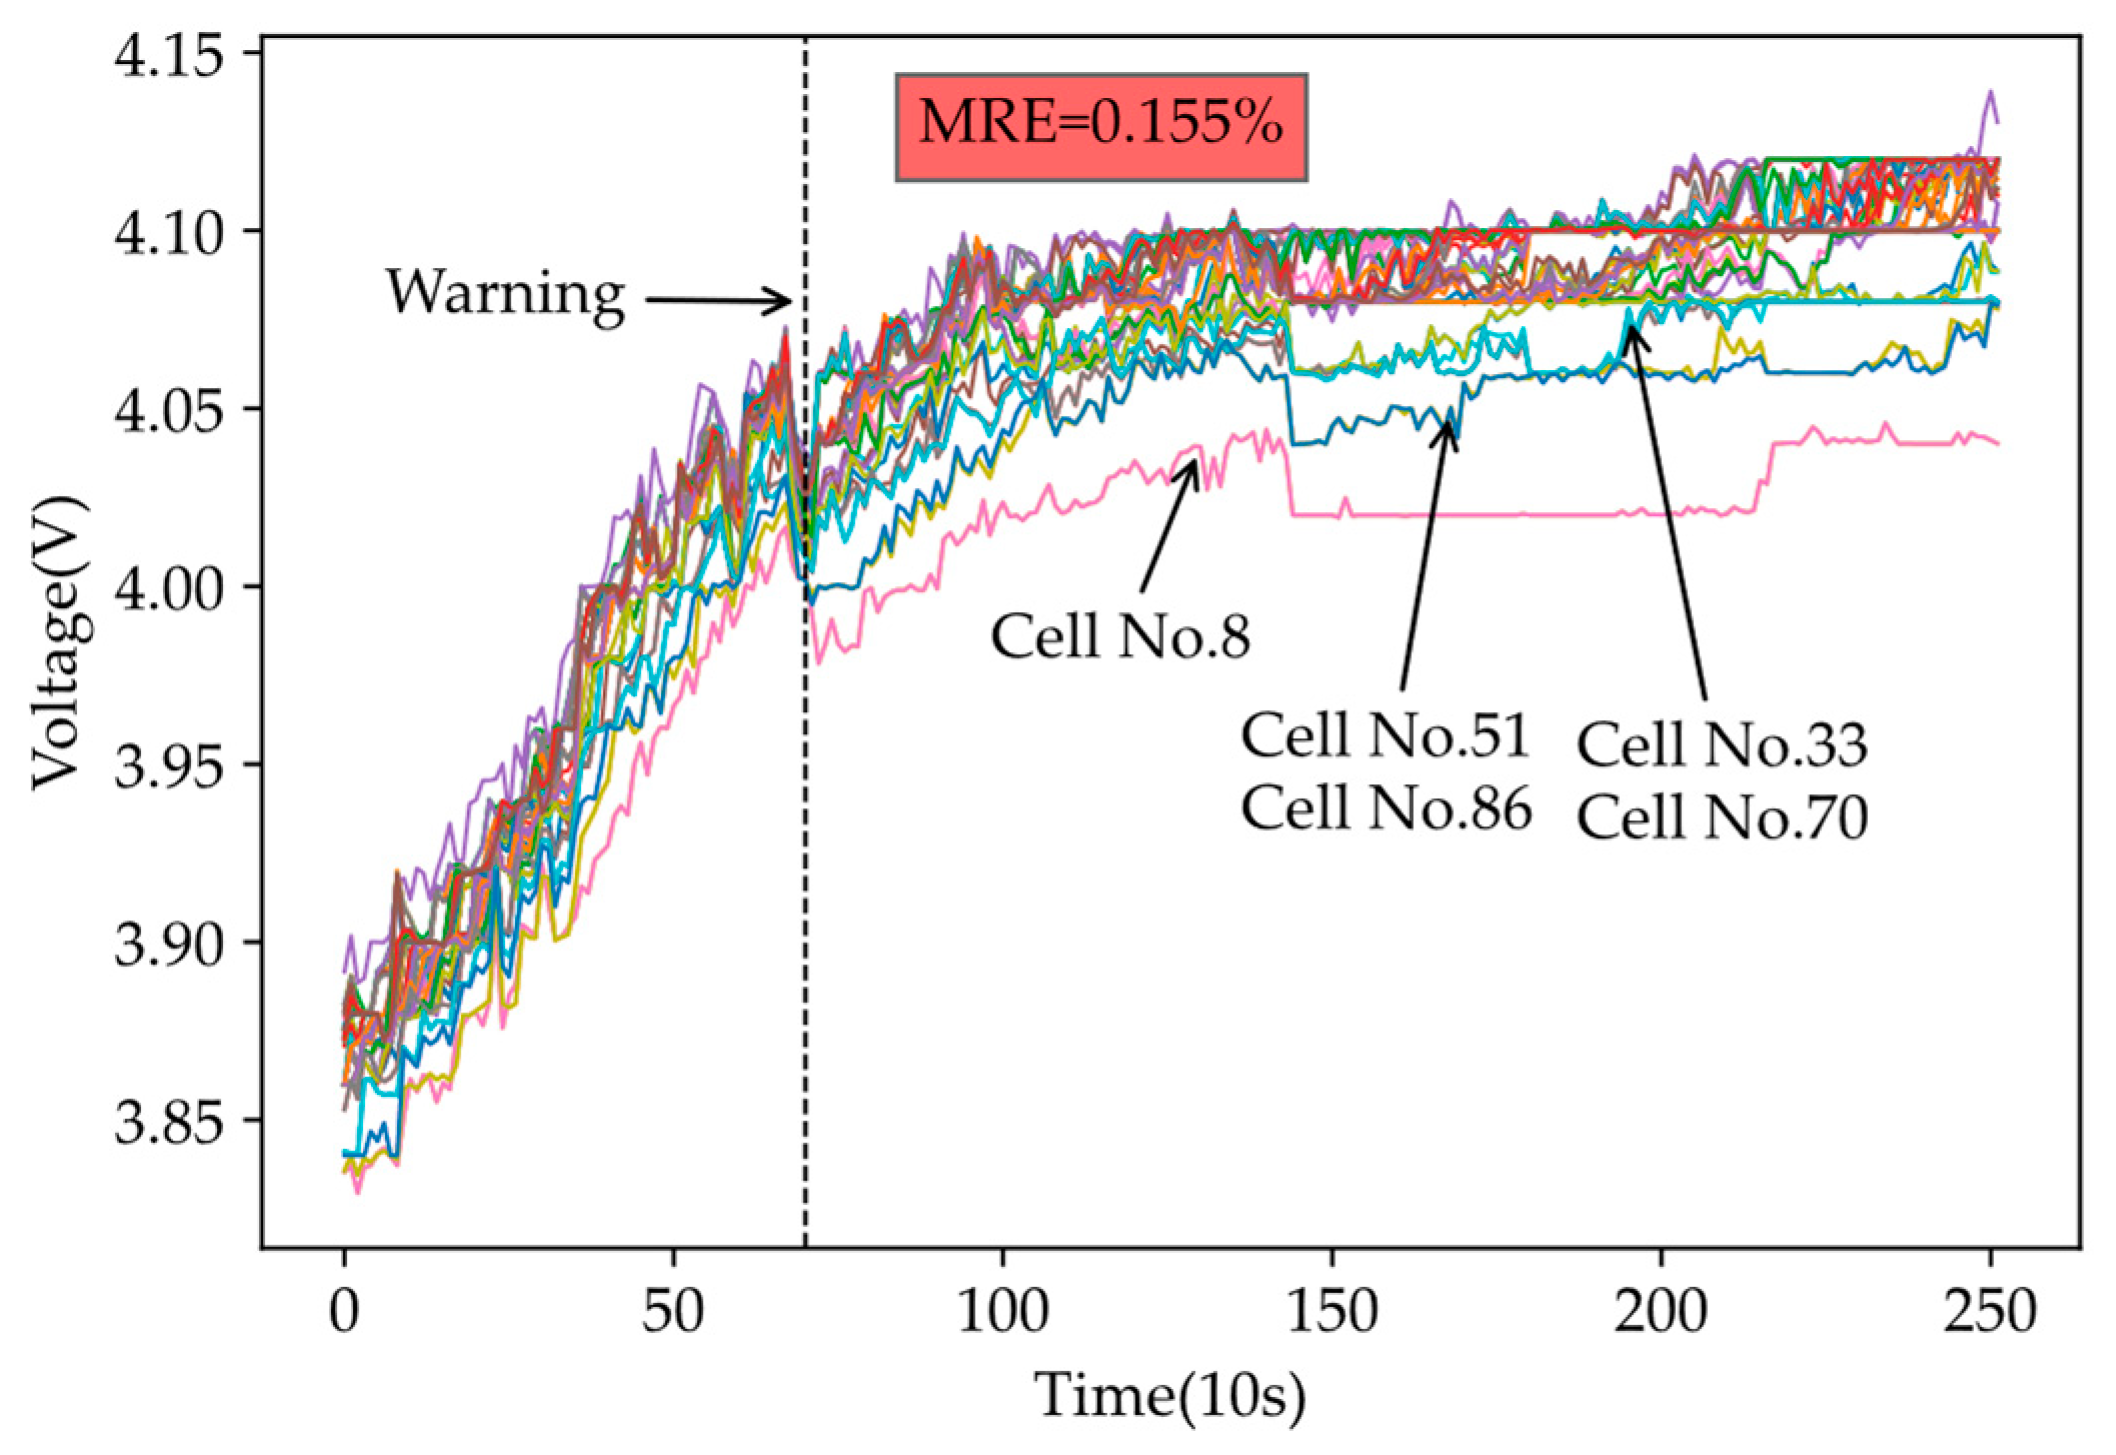
5.1. Abnormal Voltage Prediction

To validate the effectiveness of the proposed power battery abnormal voltage prediction, data from the malfunctioning vehicle before the occurrence of the fault are input into the voltage prediction model proposed in this paper. The predicted voltages for all battery cells are shown in Figure 9. Cells NO.8, NO.51, and NO.86 exhibit severe inconsistency issues; cells NO.33 and NO.70 show a moderate degree of inconsistency. The voltages of these cells show an expanding trend of anomalies, and the MRE between all predicted and actual voltages is 0.155%. This indicates that the proposed method can achieve early prediction of abnormal power battery voltages.

5.2. Fault Diagnosis Result and Discussion Based on iForest-Boxplot

Predicted voltages from Section 5.1 are input into the isolated forest, yielding the average search path length for each battery cell. This length, considered the score, is subsequently analyzed using a box plot to identify and diagnose abnormal battery cells, as illustrated in Figure 10. When the abnormality level of a battery cell is not exceedingly high, this method can effectively predict battery anomalies, thus validating the efficacy of the proposed approach. Moreover, the method avoids false alarms for other normal cells, confirming the reliability of the proposed approach.

6. Conclusions

This paper introduces a power battery anomaly prediction method, GBDT-iForest-Boxplot, designed to overcome the limitations associated with traditional methods of fault diagnosis. To validate the efficacy and feasibility of our method, we employ a real-world dataset of electric vehicles from NMMCNEV as the research foundation. The approach entails the swift and real-time prediction of battery cell voltage and anomaly detection, leveraging vehicle sensor data. Compared to traditional simulated and experimental data, our approach rectifies the limitations inherent in these datasets, leading to more accurate and reliable predictions of battery anomalies.
Additionally, this study comprehensively considers the influence of various states and multidimensional vehicle factors on battery voltage. We consider factors including the vehicle's charging status, operational status, and driving behavior, enhancing the applicability of our method. Integrating these factors enables a more precise prediction of future battery voltage. Ultimately, employing the Isolation Forest and Boxplot methods allows for anomaly detection in individual battery cells. The robustness and effectiveness of our anomaly prediction method were verified using electric vehicle data from NMMCNEV, offering enhanced decision support for drivers.
In summary, the battery fault diagnosis method proposed in this paper based on GBDT-iForest-Boxplot demonstrates significant innovation and contributions. By addressing the shortcomings of traditional methods, considering multiple states and multidimensional factors comprehensively, and emphasizing practical application needs, this method can provide robust support for the improvement and optimization of electric vehicle safety warning systems.

Author Contributions

Conceptualization, Z.Z. and S.D.; methodology, S.D.; software, S.D.; validation, S.D.; formal analysis, Z.Z. and D.L.; investigation, S.D.; resources, Z.Z., P.L. and Z.W.; data curation, S.D.; writing—original draft preparation, S.D.; writing—review and editing, D.L.; visualization, S.D.; supervision, Z.Z.; project administration, Z.Z. and D.L.; funding acquisition, Z.Z., P.L. and Z.W. All authors have read and agreed to the published version of the manuscript.

Funding

This research was funded by the National Natural Science Foundation of China (52172398) and the Science and Technology Project of State Grid (5700-202315287A-1-1-ZN).

Data Availability Statement

No new data were created or analyzed in this study. Data sharing is not applicable to this article.

Conflicts of Interest

The authors declare no conflicts of interest.

References

  1. Zhang, W.; Li, X.; Li, X. Deep learning-based prognostic approach for lithium-ion batteries with adaptive time-series prediction and on-line validation. Measurement 2020, 164, 108052. [Google Scholar] [CrossRef]
  2. Xiong, R.; Cao, J.Y.; Yu, Q.Q.; He, H.; Sun, F.C. Critical Review on the Battery State of Charge Estimation Methods for Electric Vehicles. IEEE Access 2017, 6, 1832–1843. [Google Scholar] [CrossRef]
  3. Leising, R.A.; Palazzo, M.J.; Takeuchi, E.S.; Takeuchi, K.J. Abuse testing of lithium-ion batteries: Characterization of the overcharge reaction of LiCoO2 graphite cells. J. Electrochem. Soc. 2001, 148, A838. [Google Scholar] [CrossRef]
  4. Saito, Y.; Takano, K.; Negishi, A. Thermal behaviors of lithium-ion cells during overcharge. J. Power Sources 2001, 97, 693–696. [Google Scholar] [CrossRef]
  5. Lin, C.K.; Ren, Y.; Amine, K.; Qin, Y.; Chen, Z.H. In situ high-energy X-ray diffraction to study overcharge abuse of 18650-size lithium-ion battery. J. Power Sources 2013, 230, 32–37. [Google Scholar] [CrossRef]
  6. Yang, B.; Cui, N.; Wang, M. Internal Short Circuit Fault Diagnosis for Lithiumion Battery Based on Voltage and Temperature. In Proceedings of the 2019 3rd Conference on Vehicle Control and Intelligence (CVCI), Hefei, China, 21–22 September 2019; pp. 1–6. [Google Scholar]
  7. Wu, C.; Zhu, C.B.; Ge, Y.W.; Zhao, Y.P. A Review on Fault Mechanism and Diagnosis Approach for Li-Ion Batteries. J. Nanomater. 2015, 2015, 631263. [Google Scholar] [CrossRef]
  8. Cai, W.; Wang, H.; Maleki, H.; Howard, J.; Lara-Curzio, E. Experimental simulation of internal short circuit in Li-ion and Li-ion-polymer cells. J. Power Sources 2011, 196, 7779–7783. [Google Scholar] [CrossRef]
  9. Orendorff, C.J.; Roth, E.P.; Nagasubramanian, G. Experimental triggers for internal short circuits in lithium-ion cells. J. Power Sources 2011, 196, 6554–6558. [Google Scholar] [CrossRef]
  10. Larsson, F.; Mellander, B.E. Abuse by External Heating, Overcharge and Short Circuiting of Commercial Lithium-Ion Battery Cells. J. Electrochem. Soc. 2014, 161, A1611–A1617. [Google Scholar] [CrossRef]
  11. Li, H.F.; Gao, J.K.; Zhang, S.L. Effect of overdischarge on swelling and recharge performance of lithium ion cells. Chin. J. Chem. 2008, 26, 1585–1588. [Google Scholar] [CrossRef]
  12. Li, J.Q.; Sun, D.N.; Jin, X.; Shi, W.T.; Sun, C. Lithium-ion battery overcharging thermal characteristics analysis and an impedance-based electro-thermal coupled model simulation. Appl. Energy 2019, 254, 113574. [Google Scholar] [CrossRef]
  13. Feng, X.N.; Lu, L.G.; Ouyang, M.G.; Li, J.Q.; He, X.M. A 3D thermal runaway propagation model for a large format lithium-ion battery module. Energy 2016, 115, 194–208. [Google Scholar] [CrossRef]
  14. Ren, D.; Feng, X.; Liu, L.; Hsu, H.; Lu, L.; Wang, L.; He, X.; Ouyang, M. Investigating the relationship between internal short circuit and thermal runaway of lithium-ion batteries under thermal abuse condition. Energy Storage Mater. 2021, 34, 563–573. [Google Scholar] [CrossRef]
  15. Jindal, P.; Bhattacharya, J. Review-Understanding the Thermal Runaway Behavior of Li-Ion Batteries through Experimental Techniques. J. Electrochem. Soc. 2019, 166, A2165–A2193. [Google Scholar] [CrossRef]
  16. Hu, X.S.; Zhang, K.; Liu, K.L.; Lin, X.K.; Dey, S.; Onori, S. Advanced Fault Diagnosis for Lithium-Ion Battery Systems: A Review of Fault Mechanisms, Fault Features, and Diagnosis Procedures. IEEE Ind. Electron. Mag. 2020, 14, 65–91. [Google Scholar] [CrossRef]
  17. Yang, F.; Xiao, D. Model and Fault Inference with the Framework of Probabilistic SDG. In Proceedings of the 2006 9th International Conference on Control, Automation, Robotics and Vision, Singapore, 5–8 December 2006; pp. 1–6. [Google Scholar]
  18. Held, M.; Brönnimann, R. Safe cell, safe battery? Battery fire investigation using FMEA, FTA and practical experiments. Microelectron. Reliab. 2016, 64, 705–710. [Google Scholar] [CrossRef]
  19. Filippetti, F.; Martelli, M.; Franceschini, G.; Tassoni, C. Development of expert system knowledge base to on-line diagnosis of rotor electrical faults of induction motors. In Proceedings of the Conference Record of the 1992 IEEE Industry Applications Society Annual Meeting, Houston, TX, USA, 31 December 1992; Volume 1, pp. 92–99. [Google Scholar]
  20. Xia, B.; Chen, Z.; Mi, C.; Robert, B. External short circuit fault diagnosis for lithium-ion batteries. In Proceedings of the 2014 IEEE Transportation Electrification Conference and Expo (ITEC), Beijing, China, 31 August–3 September 2014; pp. 1–7. [Google Scholar]
  21. Duan, B.; Li, Z.Y.; Gu, P.W.; Zhou, Z.K.; Zhang, C.H. Evaluation of battery inconsistency based on information entropy. J. Energy Storage 2018, 16, 160–166. [Google Scholar] [CrossRef]
  22. Isermann, R. Model-based fault-detection and diagnosis—Status and applications. Annu. Rev. Control 2005, 29, 71–85. [Google Scholar] [CrossRef]
  23. Hwang, I.; Kim, S.; Kim, Y.; Seah, C.E. A Survey of Fault Detection, Isolation, and Reconfiguration Methods. IEEE Trans. Control Syst. Technol. 2010, 18, 636–653. [Google Scholar] [CrossRef]
  24. Son, J.; Du, Y. Model-Based Stochastic Fault Detection and Diagnosis of Lithium-Ion Batteries. Processes 2019, 7, 38. [Google Scholar] [CrossRef]
  25. Dey, S.; Biron, Z.A.; Tatipamula, S.; Das, N.; Mohon, S.; Ayalew, B.; Pisu, P. Model-based real-time thermal fault diagnosis of Lithium-ion batteries. Control Eng. Pract. 2016, 56, 37–48. [Google Scholar] [CrossRef]
  26. Yang, R.X.; Xiong, R.; He, H.W.; Chen, Z.Y. A fractional-order model-based battery external short circuit fault diagnosis approach for all-climate electric vehicles application. J. Clean. Prod. 2018, 187, 950–959. [Google Scholar] [CrossRef]
  27. Zhang, H.; Pei, L.; Sun, J.; Song, K.; Lu, R.; Zhao, Y.; Zhu, C.; Wang, T. Online Diagnosis for the Capacity Fade Fault of a Parallel-Connected Lithium-Ion Battery Group. Energies 2016, 9, 387. [Google Scholar] [CrossRef]
  28. Gong, X.; Xiong, R.; Mi, C.C. A Data-Driven Bias-Correction-Method-Based Lithium-Ion Battery Modeling Approach for Electric Vehicle Applications. IEEE Trans. Ind. Appl. 2016, 52, 1759–1765. [Google Scholar]
  29. Kim, G.H.; Smith, K.; Ireland, J.; Pesaran, A. Fail-safe design for large capacity lithium-ion battery systems. J. Power Sources 2012, 210, 243–253. [Google Scholar] [CrossRef]
  30. Li, X.Y.; Wang, Z.P.; Zhang, L. Co-estimation of capacity and state-of-charge for lithium-ion batteries in electric vehicles. Energy 2019, 174, 33–44. [Google Scholar] [CrossRef]
  31. Wang, Y.J.; Tian, J.Q.; Chen, Z.H.; Liu, X.T. Model based insulation fault diagnosis for lithium-ion battery pack in electric vehicles. Measurement 2019, 131, 443–451. [Google Scholar] [CrossRef]
  32. Liu, Z.T.; He, H.W. Sensor fault detection and isolation for a lithium-ion battery pack in electric vehicles using adaptive extended Kalman filter. Appl. Energy 2017, 185, 2033–2044. [Google Scholar] [CrossRef]
  33. Hong, J.C.; Wang, Z.P.; Liu, P. Big-Data-Based Thermal Runaway Prognosis of Battery Systems for Electric Vehicles. Energies 2017, 10, 919. [Google Scholar] [CrossRef]
  34. Zhang, G.; Li, D.; Liu, P.; Zhang, Z. Multi-dimension Fault Diagnosis of Battery System in Electric Vehicles Based on Real-world Thermal Runaway Vehicle Data. In Proceedings of the 2019 IEEE Sustainable Power and Energy Conference (iSPEC), Beijing, China, 21–23 November 2019; pp. 2830–2835. [Google Scholar]
  35. Li, D.; Liu, P.; Zhang, Z.; Zhang, L.; Deng, J.; Wang, Z.; Dorrell, D.G.; Li, W.; Sauer, D.U. Battery Thermal Runaway Fault Prognosis in Electric Vehicles Based on Abnormal Heat Generation and Deep Learning Algorithms. IEEE Trans. Power Electron. 2022, 37, 8513–8525. [Google Scholar] [CrossRef]
  36. Li, Z.X.; Yang, Y.; Li, L.W.; Wang, D.Q. A weighted Pearson correlation coefficient based multi-fault comprehensive diagnosis for battery circuits. J. Energy Storage 2023, 60, 106584. [Google Scholar] [CrossRef]
  37. Yang, N.; Xu, C.L.; Fang, R.; Li, H.L.; Xie, H. Capacity Failure Prediction of Lithium Batteries for Vehicles Based on Large Data. In Proceedings of the International Conference on Optoelectronic Science and Materials (ICOSM), Hefei, China, 25–27 September 2020; Volume 11606, p. 1160609. [Google Scholar]
  38. Zhao, X.; Wang, L.; Wang, X.; Sun, Y.; Jiang, T.; Li, Z.; Zhang, Y. Reliable Life Prediction and Evaluation Analysis of Lithium-ion Battery Based on Long-Short Term Memory Model. In Proceedings of the 2019 IEEE 19th International Conference on Software Quality, Reliability and Security Companion (QRS-C), Sofia, Bulgaria, 22–26 July 2019; pp. 507–509. [Google Scholar]
  39. Kang, Y.Z.; Duan, B.; Zhou, Z.K.; Shang, Y.L.; Zhang, C.H. Online multi-fault detection and diagnosis for battery packs in electric vehicles. Appl. Energy 2020, 259, 114170. [Google Scholar] [CrossRef]
  40. Hu, X.; Jiang, J.; Cao, D.; Egardt, B. Battery Health Prognosis for Electric Vehicles Using Sample Entropy and Sparse Bayesian Predictive Modeling. IEEE Trans. Ind. Electron. 2016, 63, 2645–2656. [Google Scholar] [CrossRef]
  41. Friedman, J.H. Greedy Function Approximation: A Gradient Boosting Machine. Ann. Stat. 2001, 29, 1189–1232. [Google Scholar] [CrossRef]
  42. Liu, F.T.; Ting, K.M.; Zhou, Z.H. Isolation Forest. In Proceedings of the 8th IEEE International Conference on Data Mining, Pisa, Italy, 15–19 December 2008; p. 413. [Google Scholar]
  43. Hong, J.C.; Wang, Z.P.; Yao, Y.T. Fault prognosis of battery system based on accurate voltage abnormity prognosis using long short-term memory neural networks. Appl. Energy 2019, 251, 113381. [Google Scholar] [CrossRef]
  44. Rakhmatov, D.N. Battery voltage prediction for portable systems. In Proceedings of the 2005 IEEE International Symposium on Circuits and Systems, Kobe, Japan, 23–26 May 2005; Volume 4, pp. 4098–4101. [Google Scholar]
  45. Zhao, R.X.; Kollmeyer, P.J.; Lorenz, R.D.; Jahns, T.M. A Compact Methodology Via a Recurrent Neural Network for Accurate Equivalent Circuit Type Modeling of Lithium-Ion Batteries. IEEE Trans. Ind. Appl. 2019, 55, 1922–1931. [Google Scholar] [CrossRef]
  46. Tobar, F.; Castro, I.; Silva, J.; Orchard, M. Improving battery voltage prediction in an electric bicycle using altitude measurements and kernel adaptive filters. Pattern Recognit. Lett. 2018, 105, 200–206. [Google Scholar] [CrossRef]
  47. Chen, Z.Y.; Xiong, R.; Lu, J.H.; Li, X.G. Temperature rise prediction of lithium-ion battery suffering external short circuit for all-climate electric vehicles application. Appl. Energy 2018, 213, 375–383. [Google Scholar] [CrossRef]
  48. Sun, J.; Wei, G.; Pei, L.; Lu, R.; Song, K.; Wu, C.; Zhu, C. Online Internal Temperature Estimation for Lithium-Ion Batteries Based on Kalman Filter. Energies 2015, 8, 4400–4415. [Google Scholar] [CrossRef]
  49. Meng, J.; Luo, G.; Gao, F. Lithium Polymer Battery State-of-Charge Estimation Based on Adaptive Unscented Kalman Filter and Support Vector Machine. IEEE Trans. Power Electron. 2016, 31, 2226–2238. [Google Scholar] [CrossRef]
  50. Chemali, E.; Kollmeyer, P.J.; Preindl, M.; Ahmed, R.; Emadi, A. Long Short-Term Memory Networks for Accurate State-of-Charge Estimation of Li-ion Batteries. IEEE Trans. Ind. Electron. 2018, 65, 6730–6739. [Google Scholar] [CrossRef]
  51. Lee, Y.S.; Wang, W.Y.; Kuo, T.Y. Soft computing for battery state-of-charge (BSOC)—Estimation in battery string systems. IEEE Trans. Ind. Electron. 2008, 55, 229–239. [Google Scholar] [CrossRef]
Figure 1. The overall framework of this paper.
Processes 12 00136 g001
Figure 2. Vehicle model of the dataset selected in this article.
Processes 12 00136 g002
Figure 3. MSE for different learning rates and loss functions.
Processes 12 00136 g003
Figure 4. MSEs of different training samples.
Processes 12 00136 g004
Figure 5. MSEs of different PTSs.
Processes 12 00136 g005
Figure 6. MSEs of different training time steps.
Processes 12 00136 g006
Figure 7. Predicted voltage comparison results.
Processes 12 00136 g007
Figure 8. Voltage prediction results in different states of the verification set. (a) Driving state; (b) charging state.
Processes 12 00136 g008
Figure 9. Prediction results of all battery cell voltages of the faulty vehicle before the fault occurred.
Processes 12 00136 g009
Figure 10. Fault diagnosis results of the faulty vehicle.
Processes 12 00136 g010
Table 1. Common lithium-ion power batteries.
AbbreviationPositive Electrode MaterialBattery Performance Characteristics
LCOLiCoO2High voltage (3.9 V), higher specific energy, but there is a safety hazard of fire
LMOLiMn2O4The voltage and specific energy are close to those of LCO, the capacity declines quickly, and the thermal stability is poor.
LFPLiFePO4it exhibits commendable safety features, accompanied by a high power density, albeit with a lower energy density. Moreover, it demonstrates favorable thermal stability.
NCALi0.8Co0.15Al0.05O2The voltage is slightly lower than LCO, the safety is better than LCO, and the cycle life characteristics are good
NMCLiNi1−x−yCoxMnyO2Its security is between NCA and LMO, and its capacity declines faster than NCA
Table 2. Related parameters of the vehicle model.
ParametersDate
Total Mass2058
Electric MotorPM50W01
Rated Power50 KW
Vehicle Length/Width/Height4582/1794/1515
Table 3. Voltage prediction accuracy of different algorithms.
AlgorithmMSEPTS
Linear Regression1.06 × 10−31
SVM5.21 × 10−31
Random Forest4.86 × 10−436
LightGBM6.28 × 10−436
XGBoost2.12 × 10−436
LSTM [43]7.04 × 10−36
GBDT2.03 × 10−436
Modified GBDT
(proposed in this paper)
1.73 × 10−436
Table 4. Comparison of errors for various studies.
MethodParametersMRE
Battery model based on simplified physical analysis [44]Voltage predictionMRE < 3.7%
LSTM-RNN battery model [45]MRE < 4.8%
KLMS-X filter algorithm [46]MRE < 4.5%
A two-step prediction approach for temperature rise [47]Temperature predictionMRE < 3.05%
Kalman Filter [48]MRE < 3.21%
AUKF with LSSVM battery model [49]SOC predictionMRE < 2%
LSTM-RNN battery model [50]MRE < 0.64%
Fuzzy NN with genetic algorithm [51]MRE < 0.83%
The modified GBDT model (proposed in this paper)Voltage predictionMRE < 0.35%
Temperature predictionMRE < 0.76%
SOC predictionMRE < 0.47
Disclaimer/Publisher’s Note: The statements, opinions and data contained in all publications are solely those of the individual author(s) and contributor(s) and not of MDPI and/or the editor(s). MDPI and/or the editor(s) disclaim responsibility for any injury to people or property resulting from any ideas, methods, instructions or products referred to in the content.

