Article

Workshop Facility Layout Optimization Based on Deep Reinforcement Learning

Intelligent Manufacturing College, Panzhihua University, Panzhihua 617000, China
*
Author to whom correspondence should be addressed.
Processes 2024, 12(1), 201; https://doi.org/10.3390/pr12010201
Submission received: 14 December 2023 / Revised: 11 January 2024 / Accepted: 15 January 2024 / Published: 17 January 2024

Abstract

:
With the rapid development of intelligent manufacturing, the application of virtual reality technology to the optimization of workshop facility layout has become one of the development trends in the manufacturing industry. Virtual reality technology has put forward engineering requirements for real-time solutions to the Workshop Facility Layout Optimization Problem (WFLOP). However, few scholars have researched such solutions. Deep reinforcement learning (DRL) is effective in solving combinatorial optimization problems in real time. The WFLOP is also a combinatorial optimization problem, making it possible for DRL to solve the WFLOP in real time. Therefore, this paper proposes the application of DRL to solve the dual-objective WFLOP. First, this paper constructs a dual-objective WFLOP mathematical model and proposes a novel dual-objective DRL framework. Then, the DRL framework decomposes the WFLOP dual-objective problem into multiple sub-problems and then models each sub-problem. In order to reduce computational workload, a neighborhood parameter transfer strategy is adopted. A chain rule is constructed for the appealed sub-problem, and an improved pointer network is used to solve the bi-objective WFLOP of the sub-problem. Finally, the effectiveness of this method is verified by using the facility layout of a chip production workshop as a case study.

1. Introduction

The Facility Layout Optimization Problem (WFLOP) is one of the important elements in the field of workshop optimization design. The International Association for Manufacturing Technology shows that excellent workshop facility layout can reduce the total production cost by 10% to 30% [1]. As the manufacturing industry continues to develop and expand, the layout of workshop facilities has shown some problems, such as wasteful logistics and handling, unreasonable location, and low production efficiency. Because early workshop design considered mainly the realization of production functions and did not carry out a refined design of workshop facility layout, there are a number of unreasonable workshop facility layout solutions, which are most common in developing countries. In this situation, optimizing the layout of workshop facilities has become an important research topic in the field of workshop optimization design, first studied by Flavio D. P. (1996) [2]. Subsequently, a large number of scholars have successively carried out research on traditional facility layout methods such as the shape of facility layout, mathematical models of facility layout, and solution algorithms, and have produced rich research results [3,4]. With the continuous advancement of Industry 4.0 and the breakthroughs in emerging technologies such as sensors, digital twins, and virtual reality, scholars have used emerging technologies for facility layout optimization. Andreas K (2019) [5] studied technologies such as infrared scanners, photogrammetry, and LiDAR to build virtual reality models of workshop facilities. Mona S (2023) [6] proposed realizing a visual facility layout plan in urban construction through a 3D BIM platform. Seungnam Y (2022) [7] studied the DES-VR platform for nuclear facilities to implement thermal battery equipment design methods and verified the practicality of the resulting process equipment layout and floor plan. Virtual reality technology has been widely used in workshop facility layout optimization, as shown in Figure 1.
The application of virtual reality technology to the optimization of workshop facility layout is a development trend in the manufacturing industry, and many companies have already applied it. The engineering application of virtual reality technology puts forward real-time solution requirements for the solution method of facility layout. There are many algorithms for solving WFLOP, and scholars such as Zhang Z Q (2019) [11], Goli A (2021) [12], Kalyanmoy Deb (2020) [13], and Julia R (2022) [14] have successively applied algorithms such as MOEA, NSGA, and PSO. The above intelligent algorithms have been improved, updated, and mixed, and the results are better at solving the WFLOP. However, although these algorithms have better results in solving the WFLOP, they take longer to find solutions and cannot achieve real-time solution results. Oriol Vinyals et al. (2017) [15] of Google Brain first proposed machine learning to solve combinatorial optimization problems and used single-objective TSP to verify the effectiveness of the method, and the trained model achieved real-time results. Kaiwen Li et al. (2020) [16] proposed reinforcement learning to solve the dual-objective combinatorial optimization problem and used TSP to verify the efficiency and accuracy of the algorithm. Since then, results in machine learning for solving combinatorial optimization problems have continued to emerge.
According to the research results of many scholars, there are few studies on machine learning solution methods for the WFLOP. However, the latest facility layout methods put forward real-time solution requirements for solution speed. In order to meet the needs of engineering applications, it is urgent and necessary to explore methods for real-time solutions to facility layout problems.
In summary, research on the WFLOP is extremely important to workshop production and manufacturing. The integration of virtual reality technology into the layout of workshop facilities is a current research hotspot. At the same time, traditional intelligent algorithms cannot meet the requirements of virtual reality for real-time solutions to the WFLOP. However, many scholars have used machine learning to achieve real-time solutions to combinatorial optimization problems such as job shop scheduling, TSP, and machine slot allocation, which has provided a method for DRL to solve the WFLOP in real time. Therefore, this paper examines DRL as a solution to the dual-objective workshop facility layout optimization problem in real time. It also establishes a mathematical model for the optimization problem of workshop facility layout.
When using DRL to solve multi-dimensional targets, the facility layout problem is first converted into a pointer network problem, and then a decomposition strategy and a neighborhood parameter transfer strategy need to be used. The decomposition strategy decomposes the problem into a set of sub-problems and solves them in a collaborative manner. The neighborhood parameter transfer strategy builds a neural network for sub-problems, and the network parameters are transferred from the previous sub-problem to the next sub-problem in order. Finally, a chip production workshop with numerous automated equipment is used as an application case to verify the effectiveness of the above method. The main contributions of this article include the following:
(1)
The DRL is proposed to solve the facility layout optimization problem.
(2)
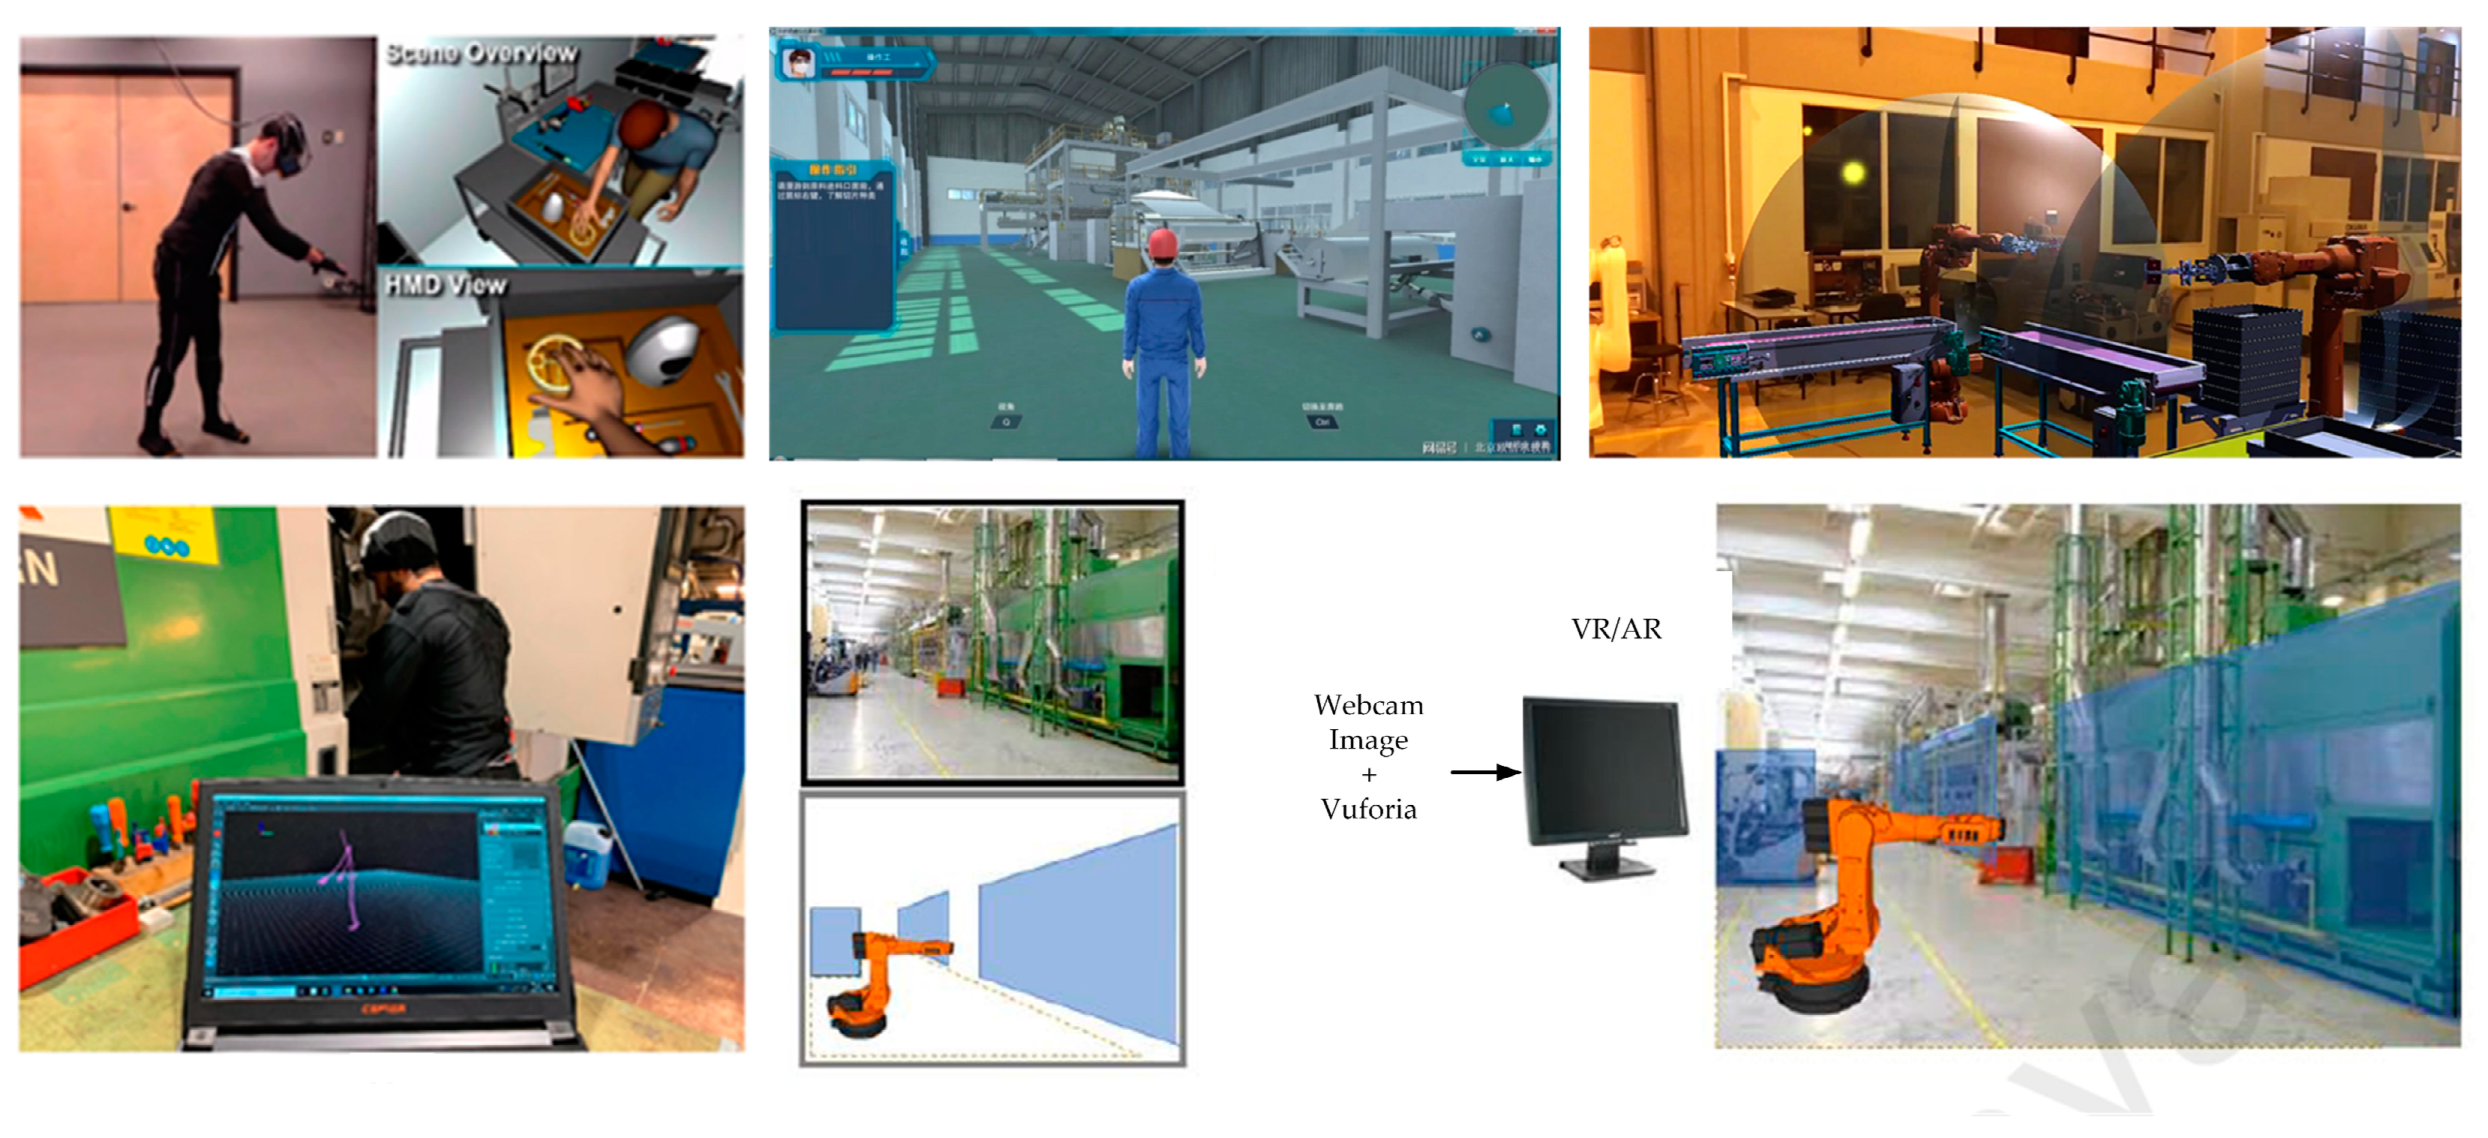
The engineering application requirements of virtual reality facility layout for a real-time solution of dual-objective workshop facility layout are realized.
(3)
A dual-objective mathematical model for facility layout optimization is constructed.
(4)
High-quality cases can provide a reference for the layout of other similar types of workshop facilities.
The remainder of this paper is organized as follows: Section 1 presents the literature review. Section 2 presents mathematical model building. Section 3 proposes the design of the DRL solution process. Section 4 presents a case application. Finally, Section 5 presents conclusions.

2. Mathematical Model

Before constructing the mathematical model, it is necessary to divide the functional areas of the workshop and establish a direct coordinate system, as shown in Figure 2.
Some variables of the mathematical model are marked in Figure 2, and their meanings are as follows:
The facility number is represented by i. The length and width of the facility are represented by (li, wi). The coordinate system of the facility is represented by (xi, yi). (Lx, Wy) represent the length and width of the workshop. A1 represents the main channel width limit. A2 represents this channel width limit. (L, W) indicate the workshop length and width restrictions. A 0–1 variable is represented by fij. The quantity of product q is represented by nq. D represents the carrying distance. S represents the workshop area. The horizontal arrangement of equipment is represented by r and e. J represents the minimum spacing between devices.
The objective function of minimizing the carrying distance is shown in Formula (1).
min D = q i j n q x i x j + y i y j f i j
The objective function with the smallest area is shown in Equation (2). The facility can change direction by 90°, with l and w replacing each other.
min S = L x * W y L x = max x i + l i / 2 + A 2 W y = max y i + w i / 2 + A 1
The constraints are shown in Equations (3)–(7).
x i r x j r J + l i + l j 2 i , j , r   a n d   i j
y i r y j e A 2 + w i + w j 2 i , j , r , e   a n d   r e
l i 2 + A 1 x i L l i 2 A 1
w i 2 + A 1 y i W w i 2 A 1
y i r = y j r r
The facility numbers are represented by i and j. Different horizontal rows of the facility layout are represented by r and e. The length and width of the facility are represented by (l, w). (L, W) represents the length and width of the workshop. The coordinates are represented by (x, y). Facility non-interference constraints include mainly non-interference between facilities and non-interference between equipment and surrounding facilities. Equation (3) means that the spacing between devices in the same row does not interfere. Equation (4) indicates that the spacing between different rows of equipment does not interfere. Equation (5) indicates that there must be secondary passages on the left and right sides of the workshop. Equation (6) indicates that this passage up and down the workshop is necessary. Equation (7) indicates that the centers of equipment in the same row are on the same center line.

3. DRL Solves WFLOP

3.1. Decomposition Strategy

The decomposition strategy is widely used in solving multi-objective optimization problems and, as it is very effective, this strategy is also used for the bi-objective optimization problem of facility layout in this article. The decomposition strategy entails decomposing the facility layout optimization problem into multiple sub-problems and then solving each sub-problem. When all the sub-problems have obtained solutions, then a set of ideal solutions is obtained, and the optimal solution is included in this set of solutions. The dual objectives of facility layout are processed using the well-known weighting method, where the weight vector is  δ j = δ 1 , δ 2 , , δ N , and  δ i j  represents the multi-objective weight coefficient in the j-th sub-problem. For example, if  δ i j  is  δ 1 j , δ 2 j , then the bi-objective weighting of the j-th sub-problem is  δ 1 j * distance   targe , δ 2 j * area   arget δ j  is a uniformly distributed sub-problem. The coordinate system composed of the area and distance of the dual-objective FLOP as shown in Figure 3 can be composed of N sub-problems of {P1, P2, P3, …, PN}.

3.2. Parameter Transfer Strategy

DRL solves the facility layout problem by establishing sub-problems as neural networks, but there are many sub-problems, and training for each of them results in a vast amount of calculation and difficulty in implementation. Therefore, parameter transfer design is required to make it possible to use deep reinforcement learning to solve the WFLOP. As shown in Figure 3, the weight vectors of uniformly distributed sub-problems are adjacent, and adjacent sub-problems have close optimal solutions. Therefore, the neural network parameters of adjacent sub-problems can be used as the parameter starting point for the next sub-problem, and then the corresponding parameters of the neural network for the neighbor problem are iterated from generation to generation. For example,  m δ j , n δ j  represents the neural network parameters of the j-th sub-problem.  m δ j * , n δ j *  indicates that the network parameters of the optimal solution to the sub-problem have been obtained through training.  m δ j + 1 , n δ j + 1  uses  m δ j * , n δ j *  as the initial parameter of the j + 1th sub-problem for training to obtain the optimal parameter  m δ j + 1 * , n δ j + 1 * , and so on, until J = N ends the training. The algorithm pseudocode is shown below.
Step 1: Randomly generate  m δ 1 * , n δ 1 * , calculate the optimal solution F1, and set  m * , n *  to max.
Step 2: If N ≠ 1
    for j = 1:N,
       use  m δ j * , n δ j *  as the initial parameter input of  m δ j + 1 , n δ j + 1  for training, and calculate Fj+1.
       If Fj+1 m * , n *
          m * , n *  =  m δ j + 1 * , n δ j + 1 *
   else  m * , n *  =  m δ 1 * , n δ 1 *
   return  m * , n * .
Step 3: Calculate the optimal solution through  m * , n * .
The above-mentioned decomposition strategy is used, and adjacent parameters are transferred, which greatly reduces the amount of calculation, and simplifies and modularizes the neural network. The above method realizes the problem decomposition of the facility layout problem and allows the sub-problems to be cyclically trained. However, the solution method of the sub-problems has not yet been demonstrated. Next, the modeling and analysis of the problem will be carried out.

3.3. DRL Solves WFLOP Subproblem

DRL solves combinatorial optimization problems starting from the pointer network in the literature [15]. The facility layout optimization problem is also a combinatorial optimization problem, so this paper uses the pointer network in [15,16] to solve the WFLOP sub-problem.
In the WFLOP shown in Figure 2, the model input set X is {Ei, i = 1, 2, 3, …, n}, where n is the number of devices, which is 6 in Figure 2. Ei is composed of a set of vectors, representing the attributes of the objective function, such as the coordinate system (xi, yi) in the dual-objective facility layout problem to calculate the distance objective function, and the length and width (li, wi) to calculate the area objective function. The input structure is shown in Figure 4.
The output of the model is the permutation and combination of facilities; for example, the output Y is {ρ1, ρ2, ρ3, …, n}. To map input X to output Y, use the probabilistic chain rule:
P ( Y / X ) = Π t = 1 n P ( ρ t + 1 ρ 1 , , ρ t + 1 , X t )
First, any facility ρ1 is placed at the entrance of the workshop, and the next facility among the remaining Xt facilities is selected and placed in the second position at the entrance of the workshop. Xt will update the optional facilities as the facilities are selected until all equipment is selected, at which time all corresponding equipment has been placed in the workshop. Fan [17] and Yuan [18] map the sequence of facilities to a scalar, which is the workshop logistics handling volume or workshop area. It can be seen from Section 3.1 of this article that this article weights the logistics handling volume and the workshop area. The reward of a WFLOP solution is a weighted negative number. When the solution is optimal, the weighted value is the smallest, the optimal logistics handling volume and area are obtained, and the reward is the largest. The pointer network models Formula (8). For details, see documents [15,16]. The basic structure is the sequence-to-sequence model, a powerful model recently proposed in the field of machine translation that maps one sequence to another. A general sequence-to-sequence model consists of two RNN networks, called encoder and decoder. The encoder RNN encodes the input sequence into a code vector containing the input knowledge. Based on the encoding vector, the decoder RNN is used to decode the knowledge vector into the desired sequence. Therefore, the properties of sequence-to-sequence models that map an input sequence to an output sequence are suitable for solving facility layout problems.

4. Case Application

The influence on the semiconductor manufacturing business is especially noticeable due to the fast growth of electronic gadgets. For example, by 2030, China’s semiconductor manufacturing business will have grown by 31.9 per cent, with a tremendous market potential [19,20]. The semiconductor production process is complicated, and the system is massive. Few businesses have mastered the whole manufacturing process, while most companies can only complete a portion of the production process [21]. As a fundamental step in the semiconductor manufacturing process, chip (computer chips or microchips, etc., are referred to as chip) packaging accounts for a significant portion of semiconductor output. As a result, careful consideration should be given to the chip packaging production process [22,23]. Few scholars have used machine learning to solve the problem of facility layout optimization in chip workshops. With the global rise of digital manufacturing, immersive facility layout optimization is also widely used in chip manufacturing workshops. This application puts forward real-time solution requirements for facility layout optimization. Therefore, this case uses the production of a chip workshop in Chengdu as an application case.

4.1. Chip Packaging Workshop Analysis
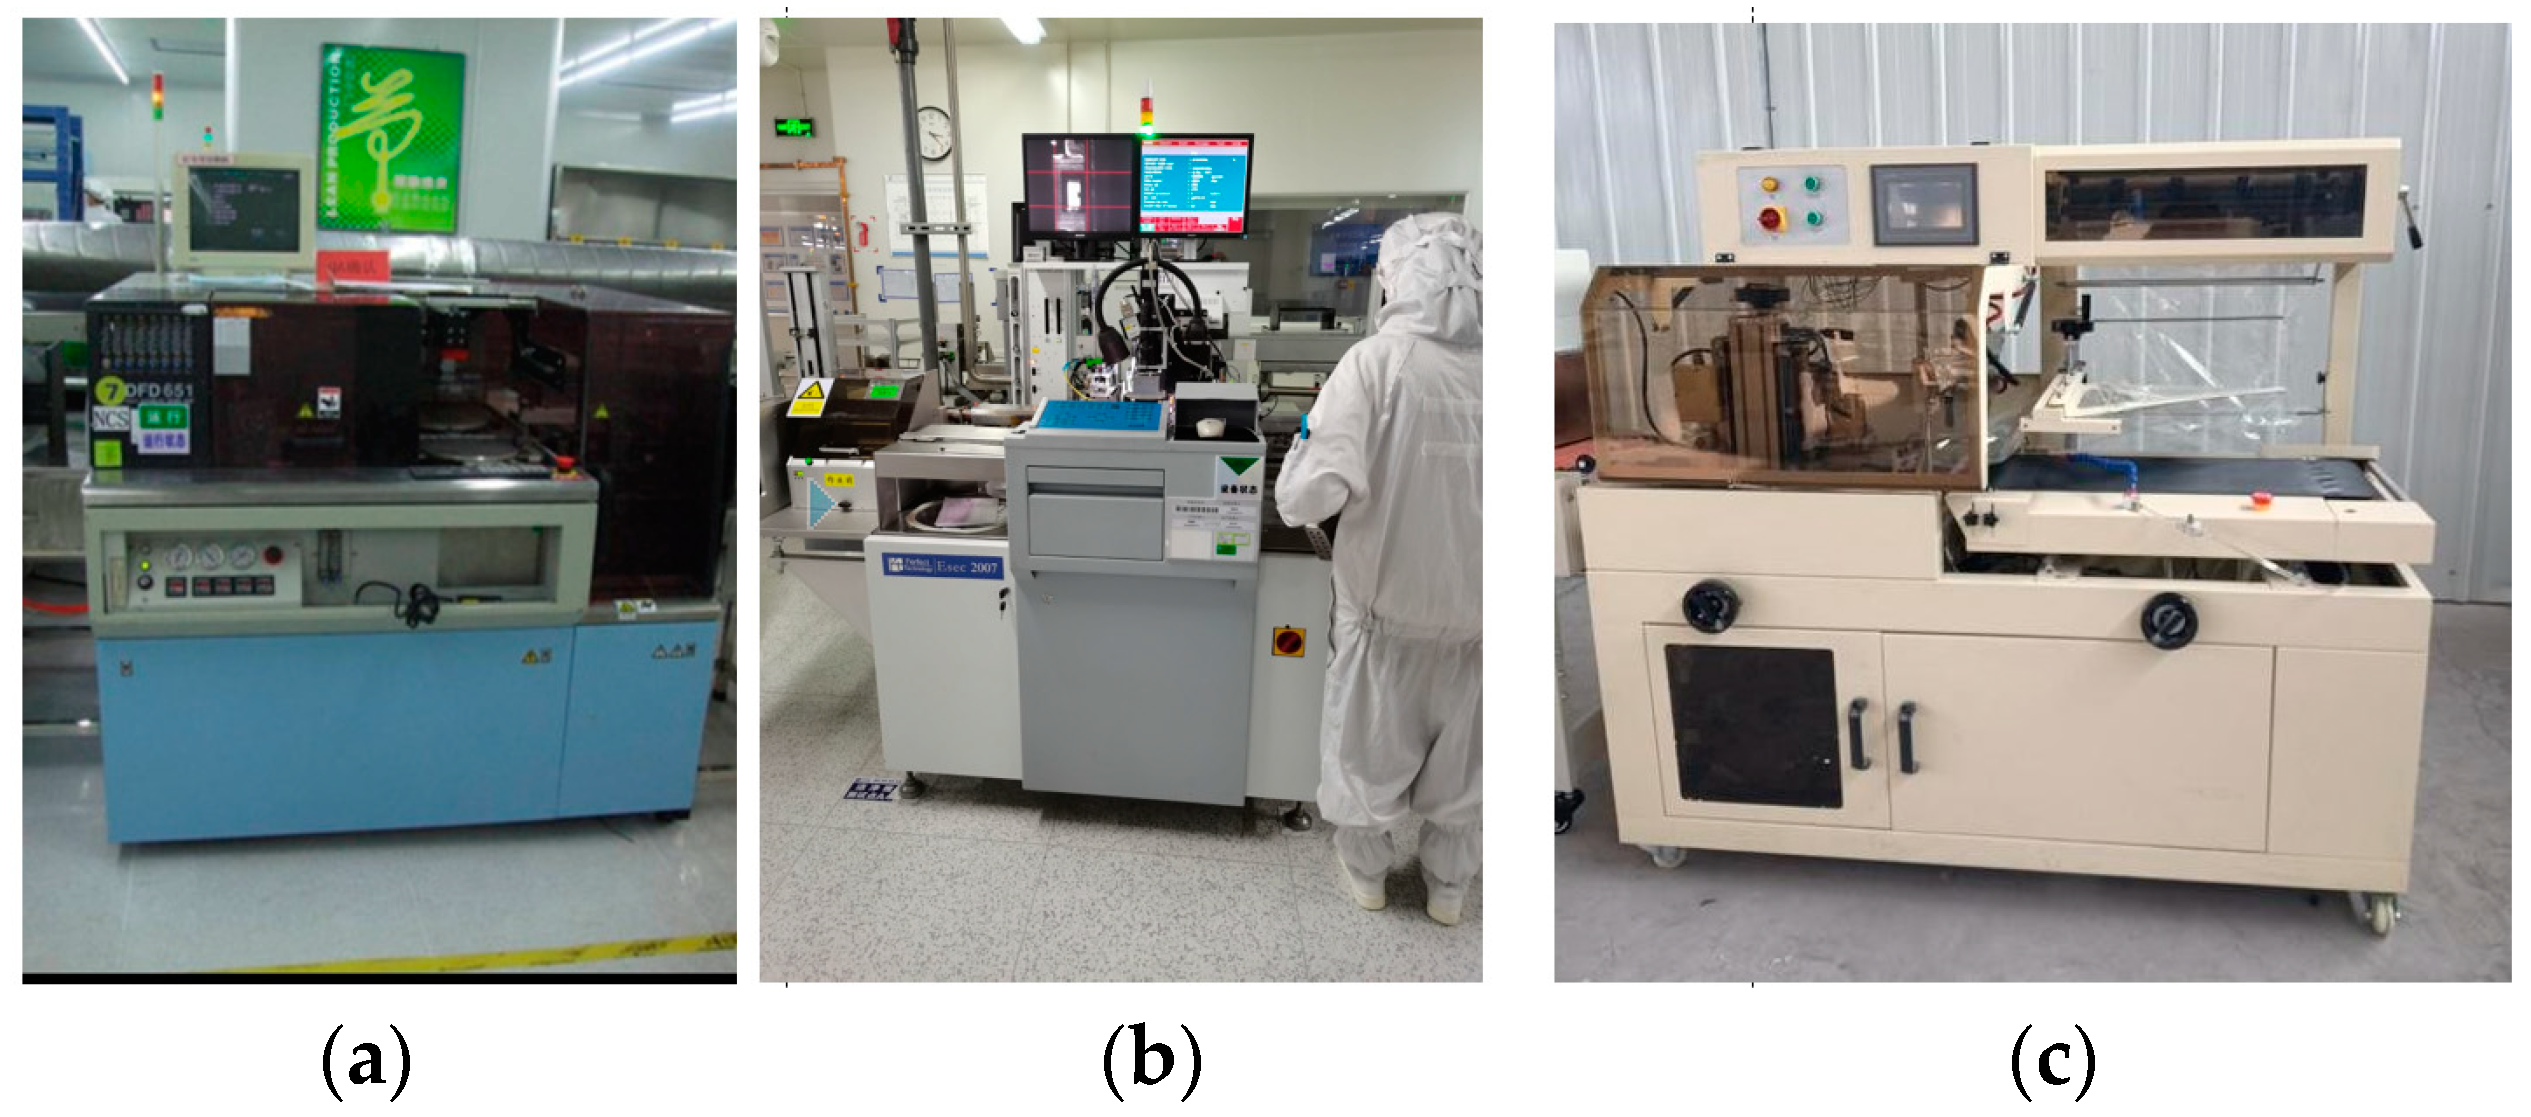
(1)
Chip packaging equipment
Because there are few chip equipment manufacturers in China, a chip packaging workshop (CPW) depends mostly on equipment imported from European and American nations for production. HJW equipment focuses primarily on maintaining normal functioning, and there are few locations where the equipment may be enhanced and improved. The HJW CPW consists mainly of the disc, chip loading, bonding, plastic sealing, electroplating equipment, printer and rib, and other items, some of which are shown in Figure 5.
(2)
Packaging Process
It is only necessary to complete one chip packing process, and the kind of manufacturing equipment used seldom varies. In addition, the equipment is highly automated. The key process phases of the workshop are represented by the nine steps shown in Figure 6.
  • Dicing is the process of separating each chip with its own set of electrical characteristics. The dicing process is classified into two types: semi-automatic cutting and full-automatic cutting. The HJW CPW uses full-automatic cutting.
  • Chip loading is the process of assembling the chip on the frame. Resin bonding, eutectic welding, and lead-tin alloy welding are all common chip loading processes employed by the HJW CPW.
  • Bonding involves connecting the bonding wires between the electrodes in contact with the chip and the frame pins. This process places exceptionally high demands on the wires used for bonding, since the wires significantly impact the chip’s durability and stability.
  • Plastic wrapping protects the item from environmental impacts and allows it to perform steadily and consistently for an extended time. Plastic packaging is classified into two types: air-tight packaging and non-airtight packaging. Because the air-tight packing effect is a better option, the HJW CPW uses air-tight packaging.
  • The primary goal of electroplating is to cover the silicon wafer in the chip with a thick, homogeneous coating of gold free of holes, gaps, and other flaws to improve the chip’s conductivity and solderability.
  • Printing entails performing laser engraving on the front or back of the chip, with the content of the engraving including product information, which is mostly utilized for chip identification and tracking. Ink printing and laser marking are two basic types of printing. The HJW CPW makes use of laser marking.
  • Rib cutting consists mostly of two processes: rib cutting and bending. Rib cutting is a technology that divides a whole piece into multiple pieces. Bending is the removal of undesirable material from a work-in-process and pressing the work-in-process into certain predetermined forms.
  • The test’s purpose is to complete the operation by collaborating between the sorting machine and the testing machine, checking the function and electrical characteristics of the finished chips, and the sorting machine marking, sorting, and receiving the chips.
  • The packing procedure necessitates that the packed items be easily picked up.
(3)
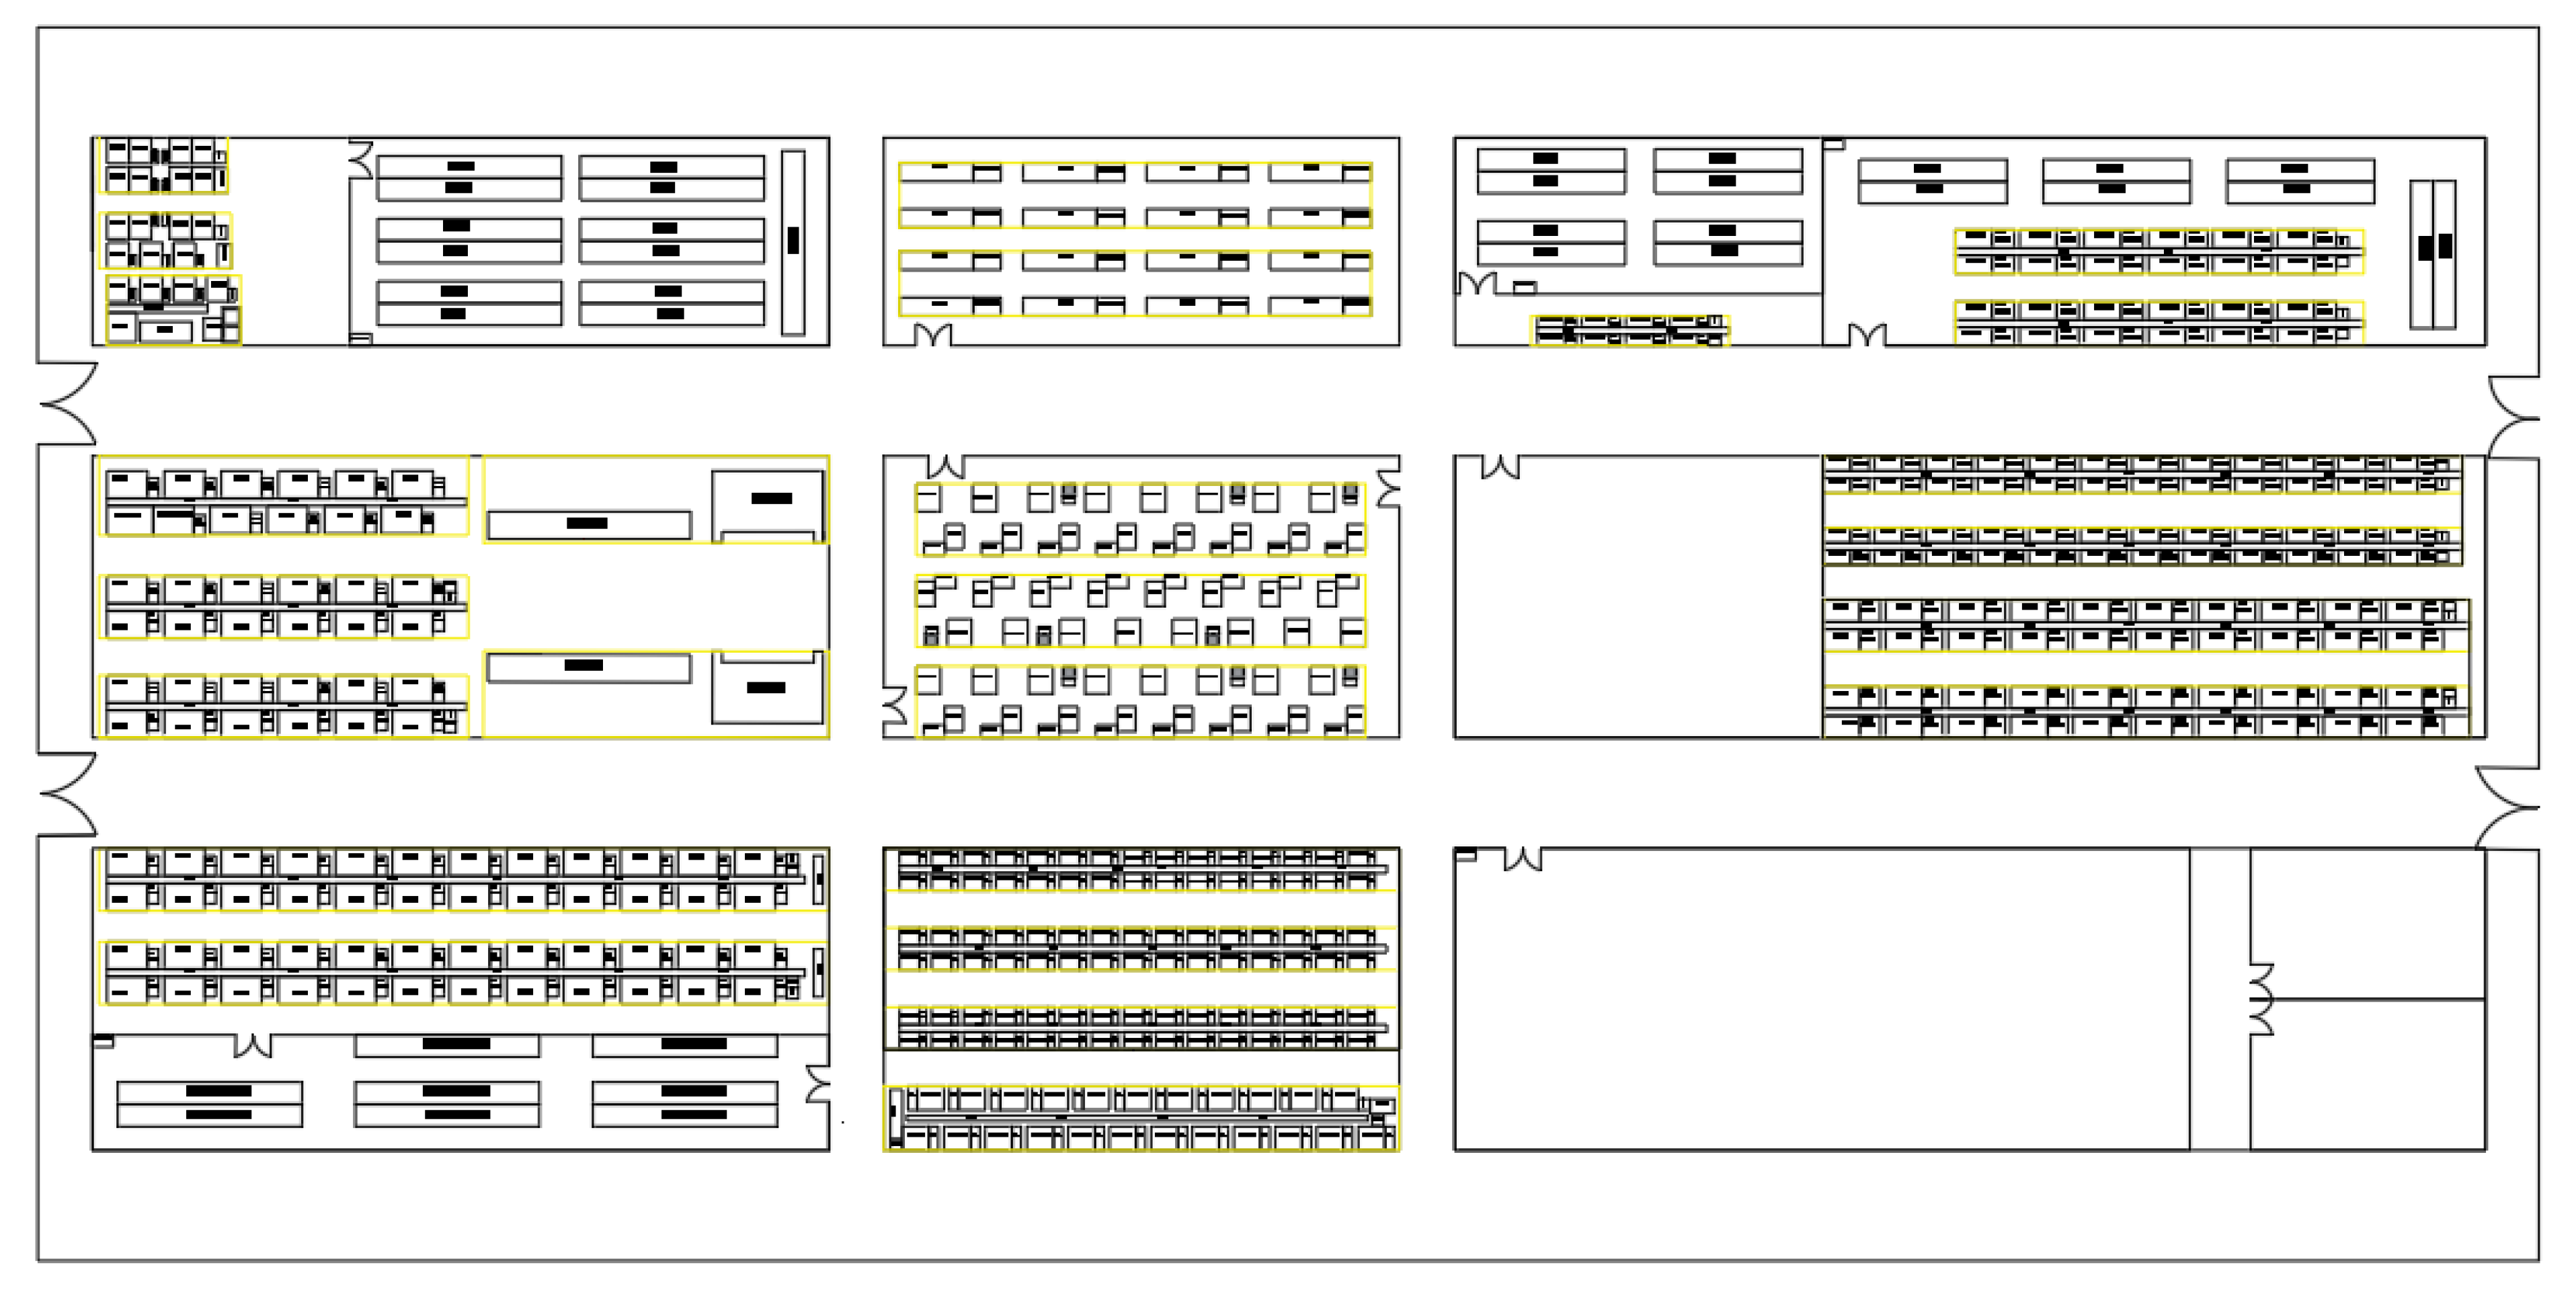
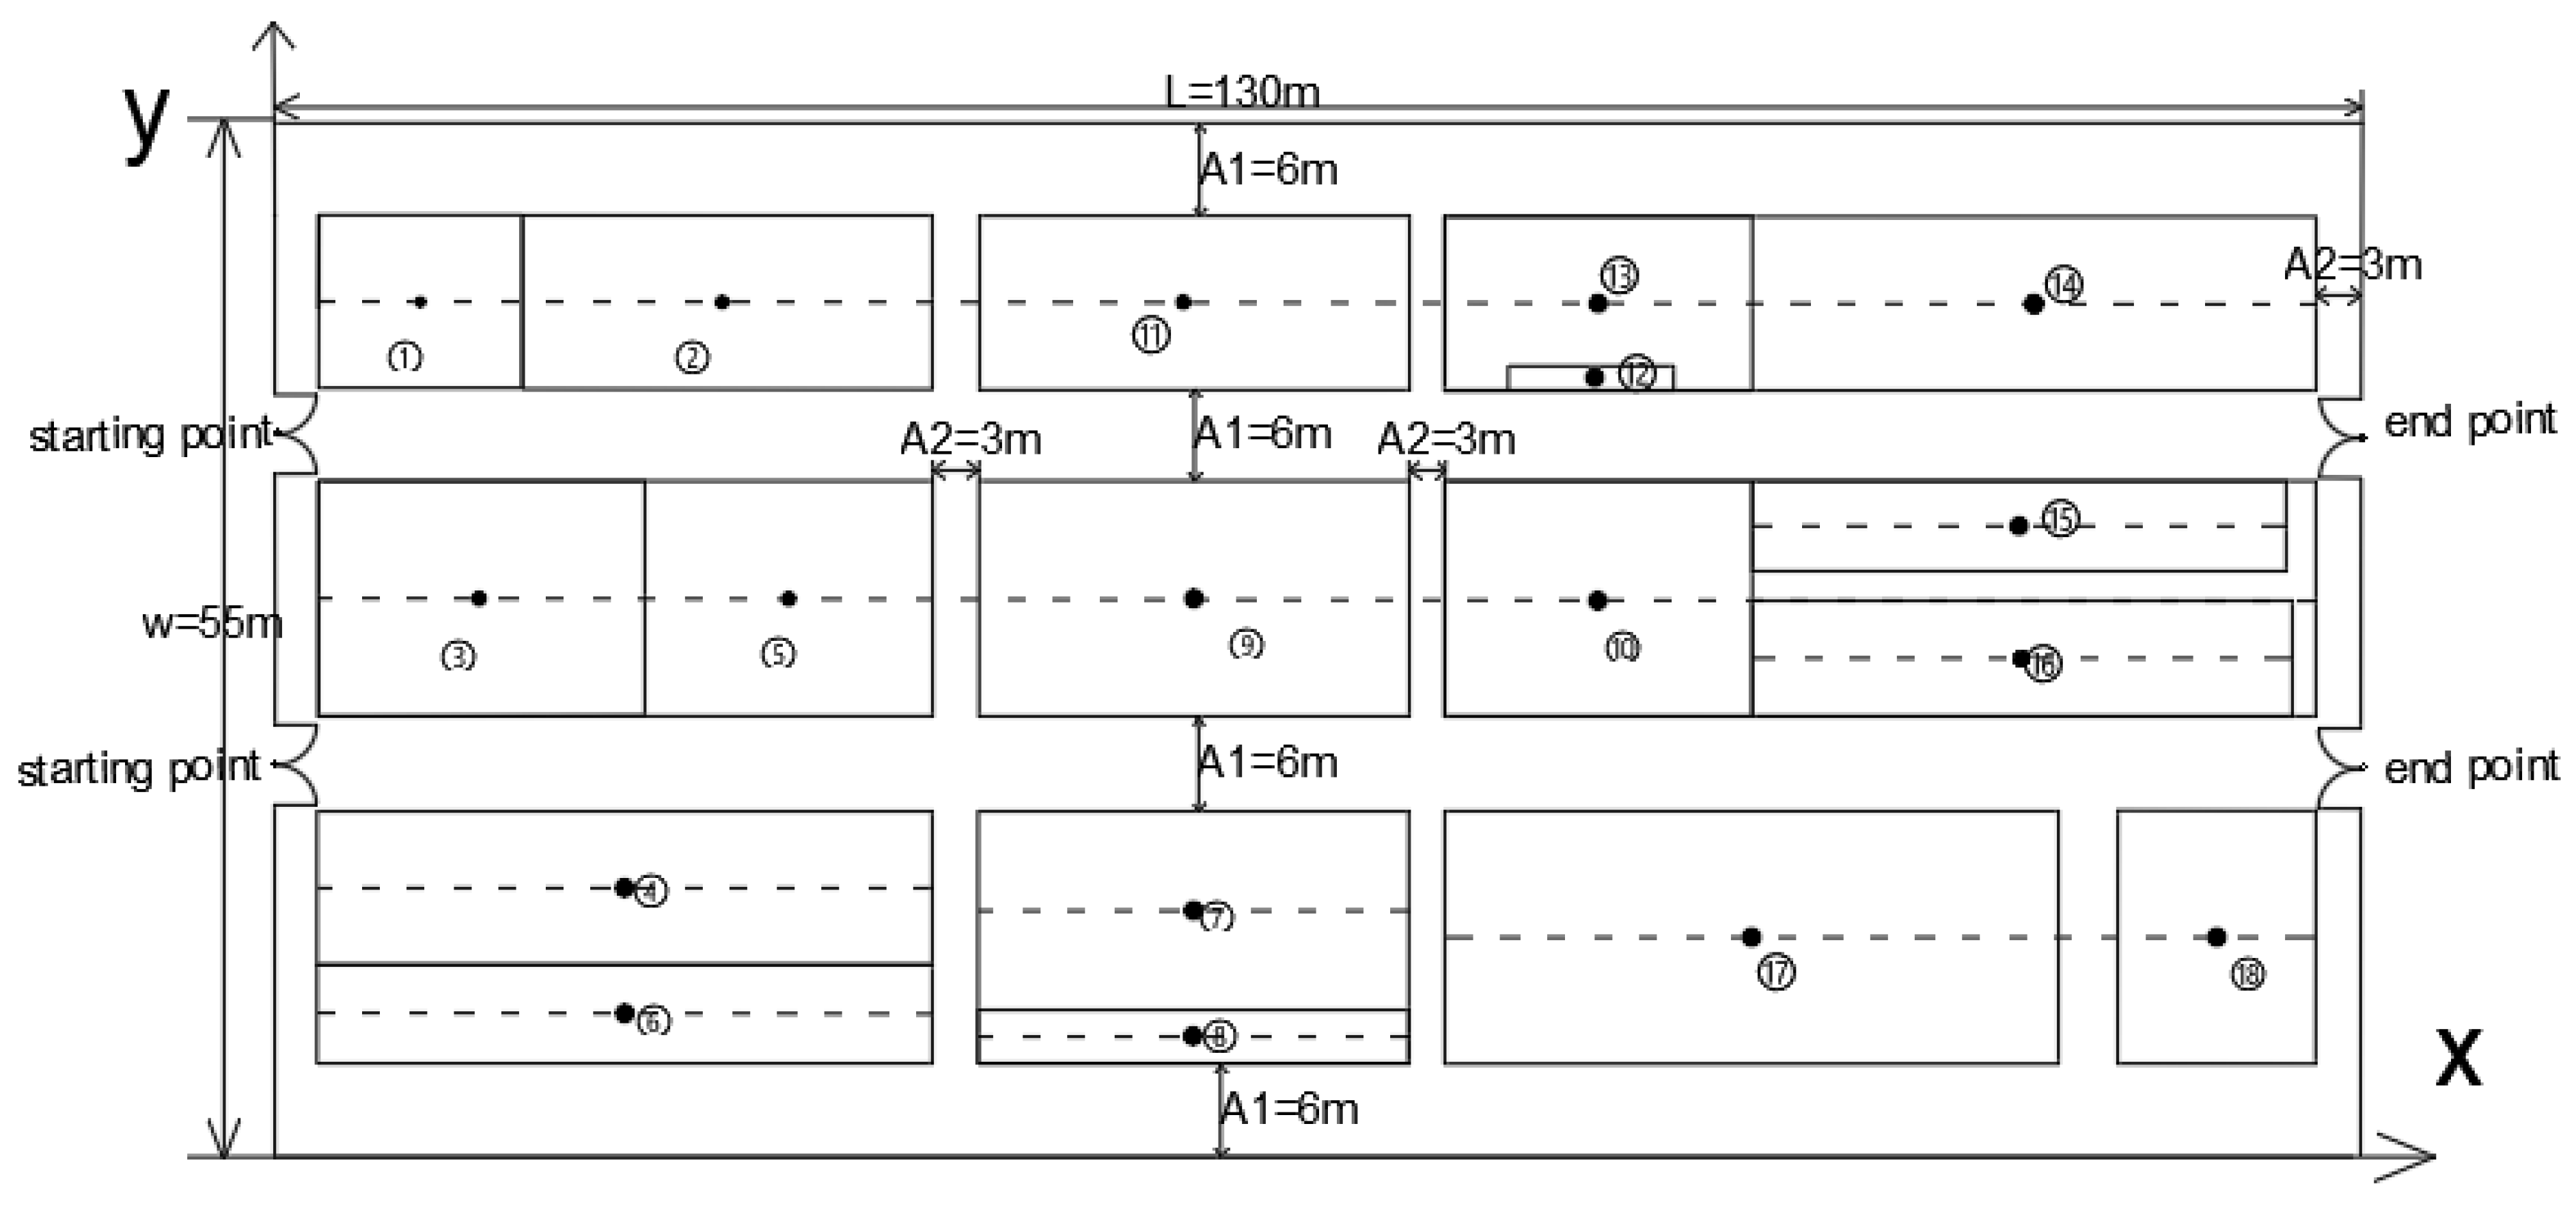
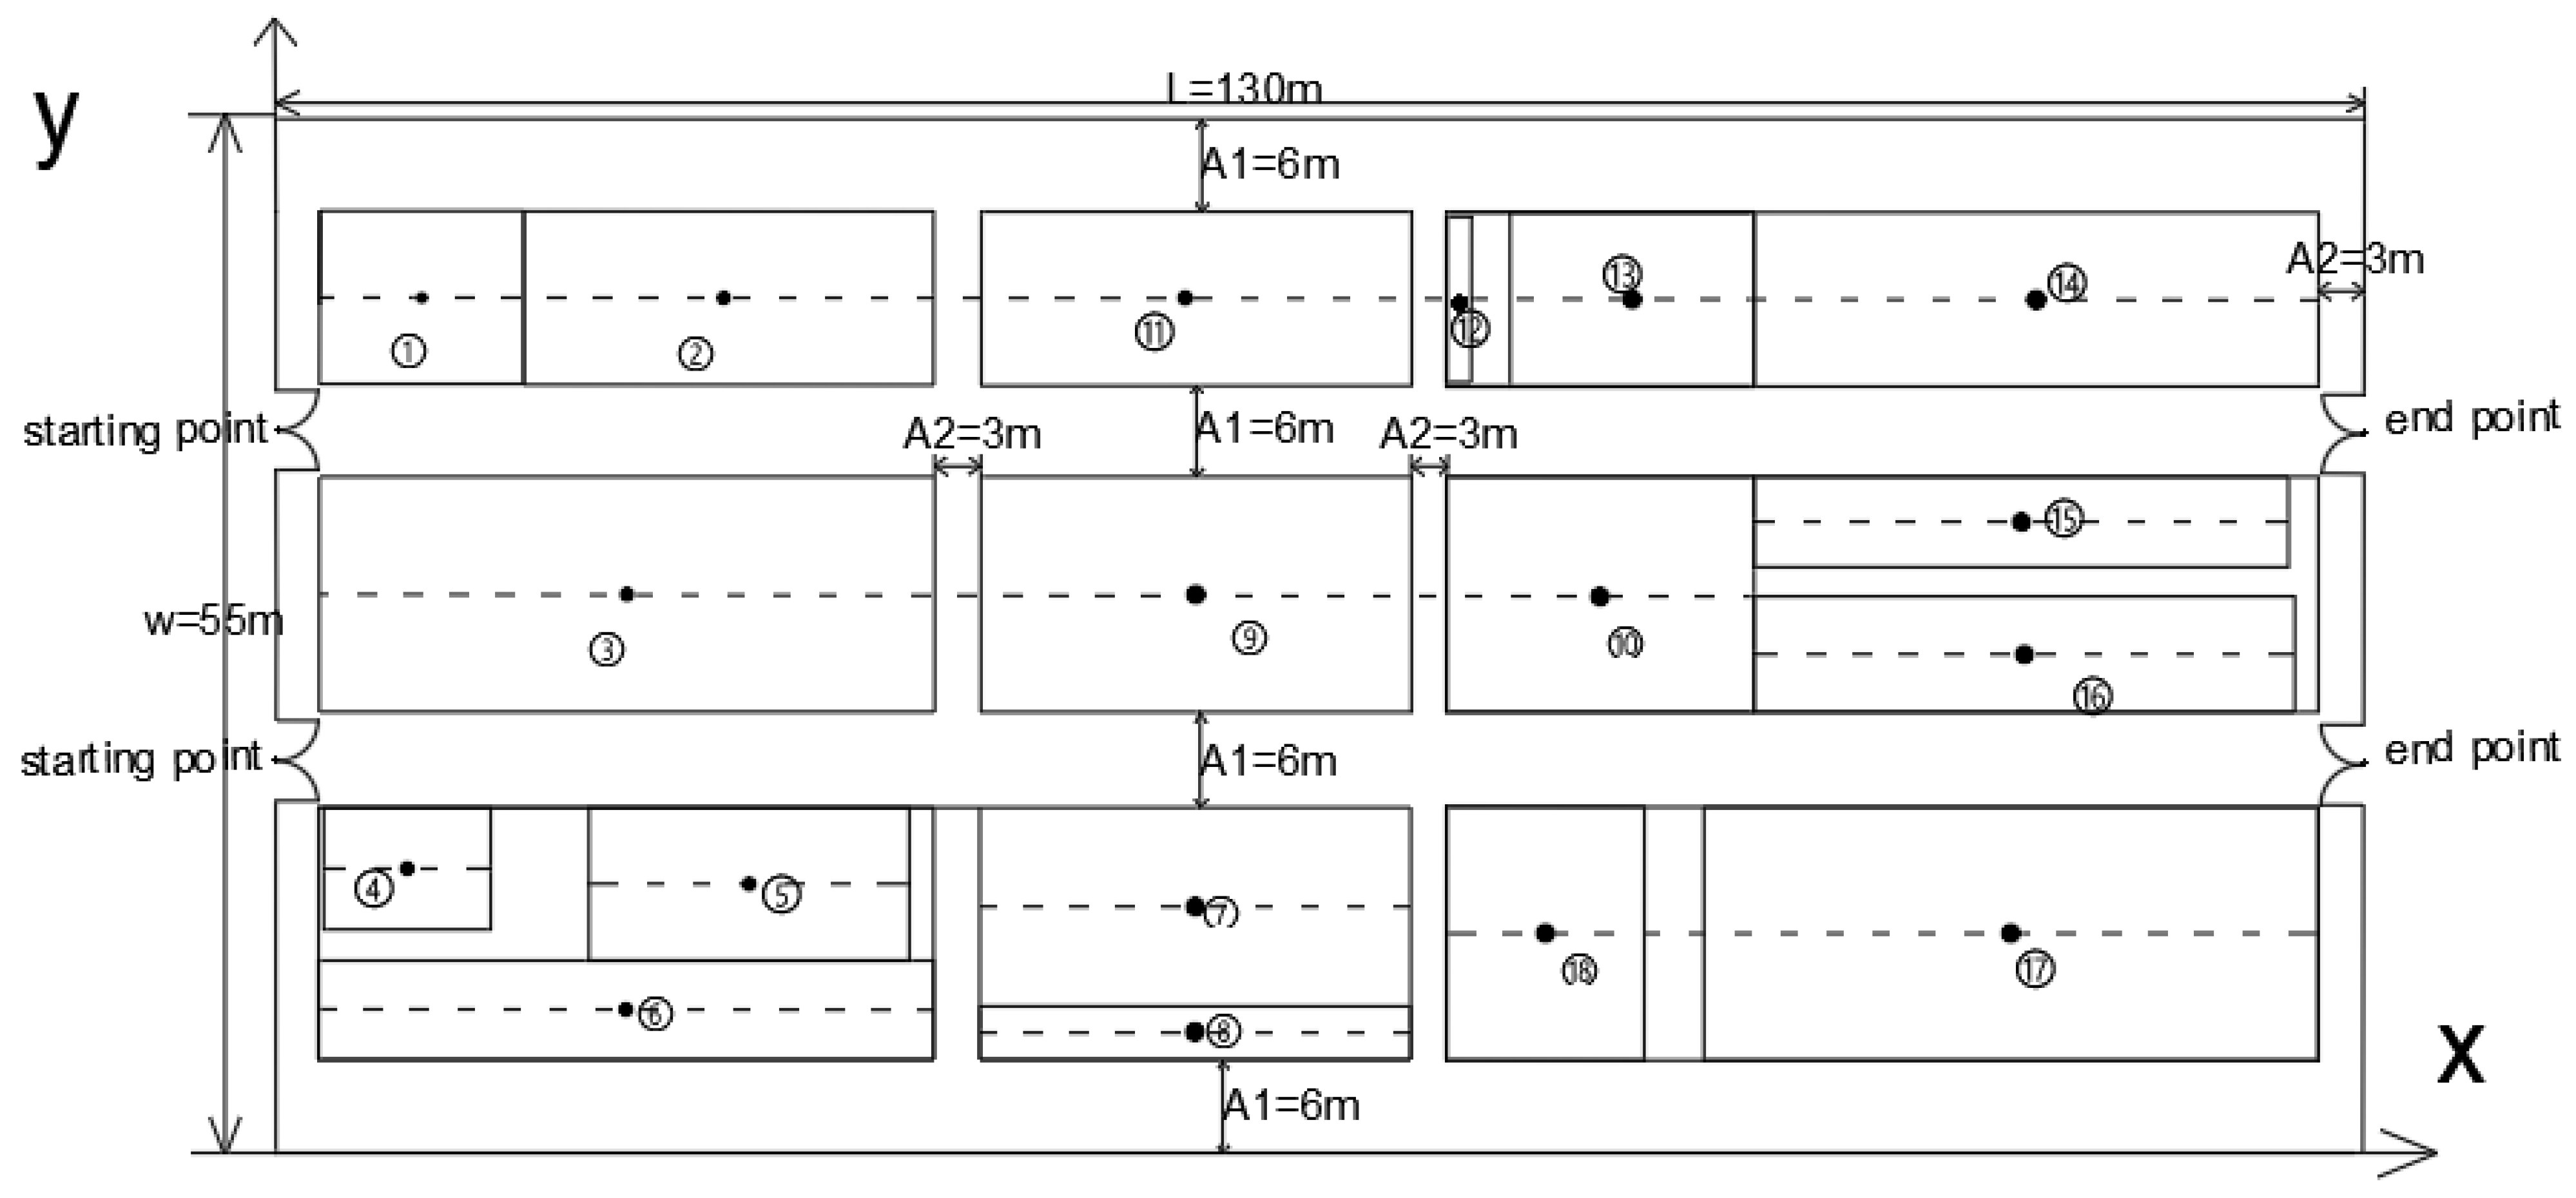
Workshop Layout Analysis
The HJW CPW is rectangular in shape, with a length of around 140 metres, a width of 60 metres, and a total area of more than 8000 square metres. Entry and exit points are located on the left and right sides of the CPW, and the workshop is divided into many tunnels. The main corridor is 6 metres in width, whereas this passage measures 3 metres in width. Scribing, loading, and bonding areas are the most common features of the CPW. There is also a warehouse with several shelves and raw material areas, as well as an electro-plating area, a plastic sealing area, bonding and testing areas, and rib cutting and testing locations. Figure 7 depicts the original general layout.
Table 1 illustrates the size of each area in Figure 3.
Following the layout of the CPW in Figure 7 and Table 1, it may be split into 17 major areas. For study efficiency, we separated the two loading areas into loading zone 1 and loading zone 2 and then divided these two zones further into 18 zones. Figure 8 depicts a simplified representation of the CPW.
In the manner shown in Figure 8, a Cartesian coordinate system is formed, the starting point (numbered 0) and ending point (numbered 19) are input, and the coordinate system of each zone is generated as depicted in Table 2.
In Figure 8, we can see that A1 is 6 m and A2 is 3 m. According to Formula (2), the area before optimization can be calculated as 7460.0354 m2.
The material flow of each O-D pair may be computed using the information in Table 2 and the output from the workshop, as shown in Table 3.
As shown in Table 3, the shortest distance for single-chip production and handling in this workshop is around 540.7 metres, and the total logistics volume of the CPW’s current layout is 2,651,004 m·pcs.

4.2. Solution Result Analysis

This case study uses Python for programming, and the operating environment uses the Windows 10 (64-bit) operating system, configured as Intel i7-9750H 2.60 Ghz 12 cores and 24 G memory. Model training uses most of the parameters found in the literature [15,16]. For this study, we used the neural network of GRU RNN to solve the WFLOP problem. Specifically, the parameter settings of the network model are shown in Table 4. Dinput represents the dimension of input, i.e., Dinput = 4 for bi-objective WFLOP. We employed a one-layer GRU RNN with a hidden size of 128 in the decoder. For the critic network, the hidden size was also set to 128. We trained both the actor and critic networks using the Adam optimizer with a learning rate η of 0.0001 and batch size of 200. The Xavier initialization method was used to initialize the weights for the first subproblem [24]. Weights for the following subproblems were generated by the introduced neighbourhood-based parameter transfer strategy [16].
The trained model can achieve real-time solution results, and the final decoding of the calculation results is shown in Figure 9.
CPW device coordinate values are presented in Table 5 because the optimum area location has been modified.
The optimized area index is 6993.596 m2.
Table 6 depicts the calculated CPW data after optimization.
According to the above study results, the shortest distance for CPW single-chip production and handling has decreased from 540.7 m to 501.55 m, which is 39.15 m shorter than the previous distance. The area has been reduced from 7460.0354 m2 to 6993.596 m2, which is 466.4394 m2 less than before optimization. Furthermore, its logistics volume has decreased from 2,651,004 m·pcs in the previous year to 2,279,587 m·pcs in the current year, representing a loss of 371,417 m·pcs. Because of the data analysis findings, it is not difficult to conclude that the new layout has achieved the aim of chip packaging workshop optimization.

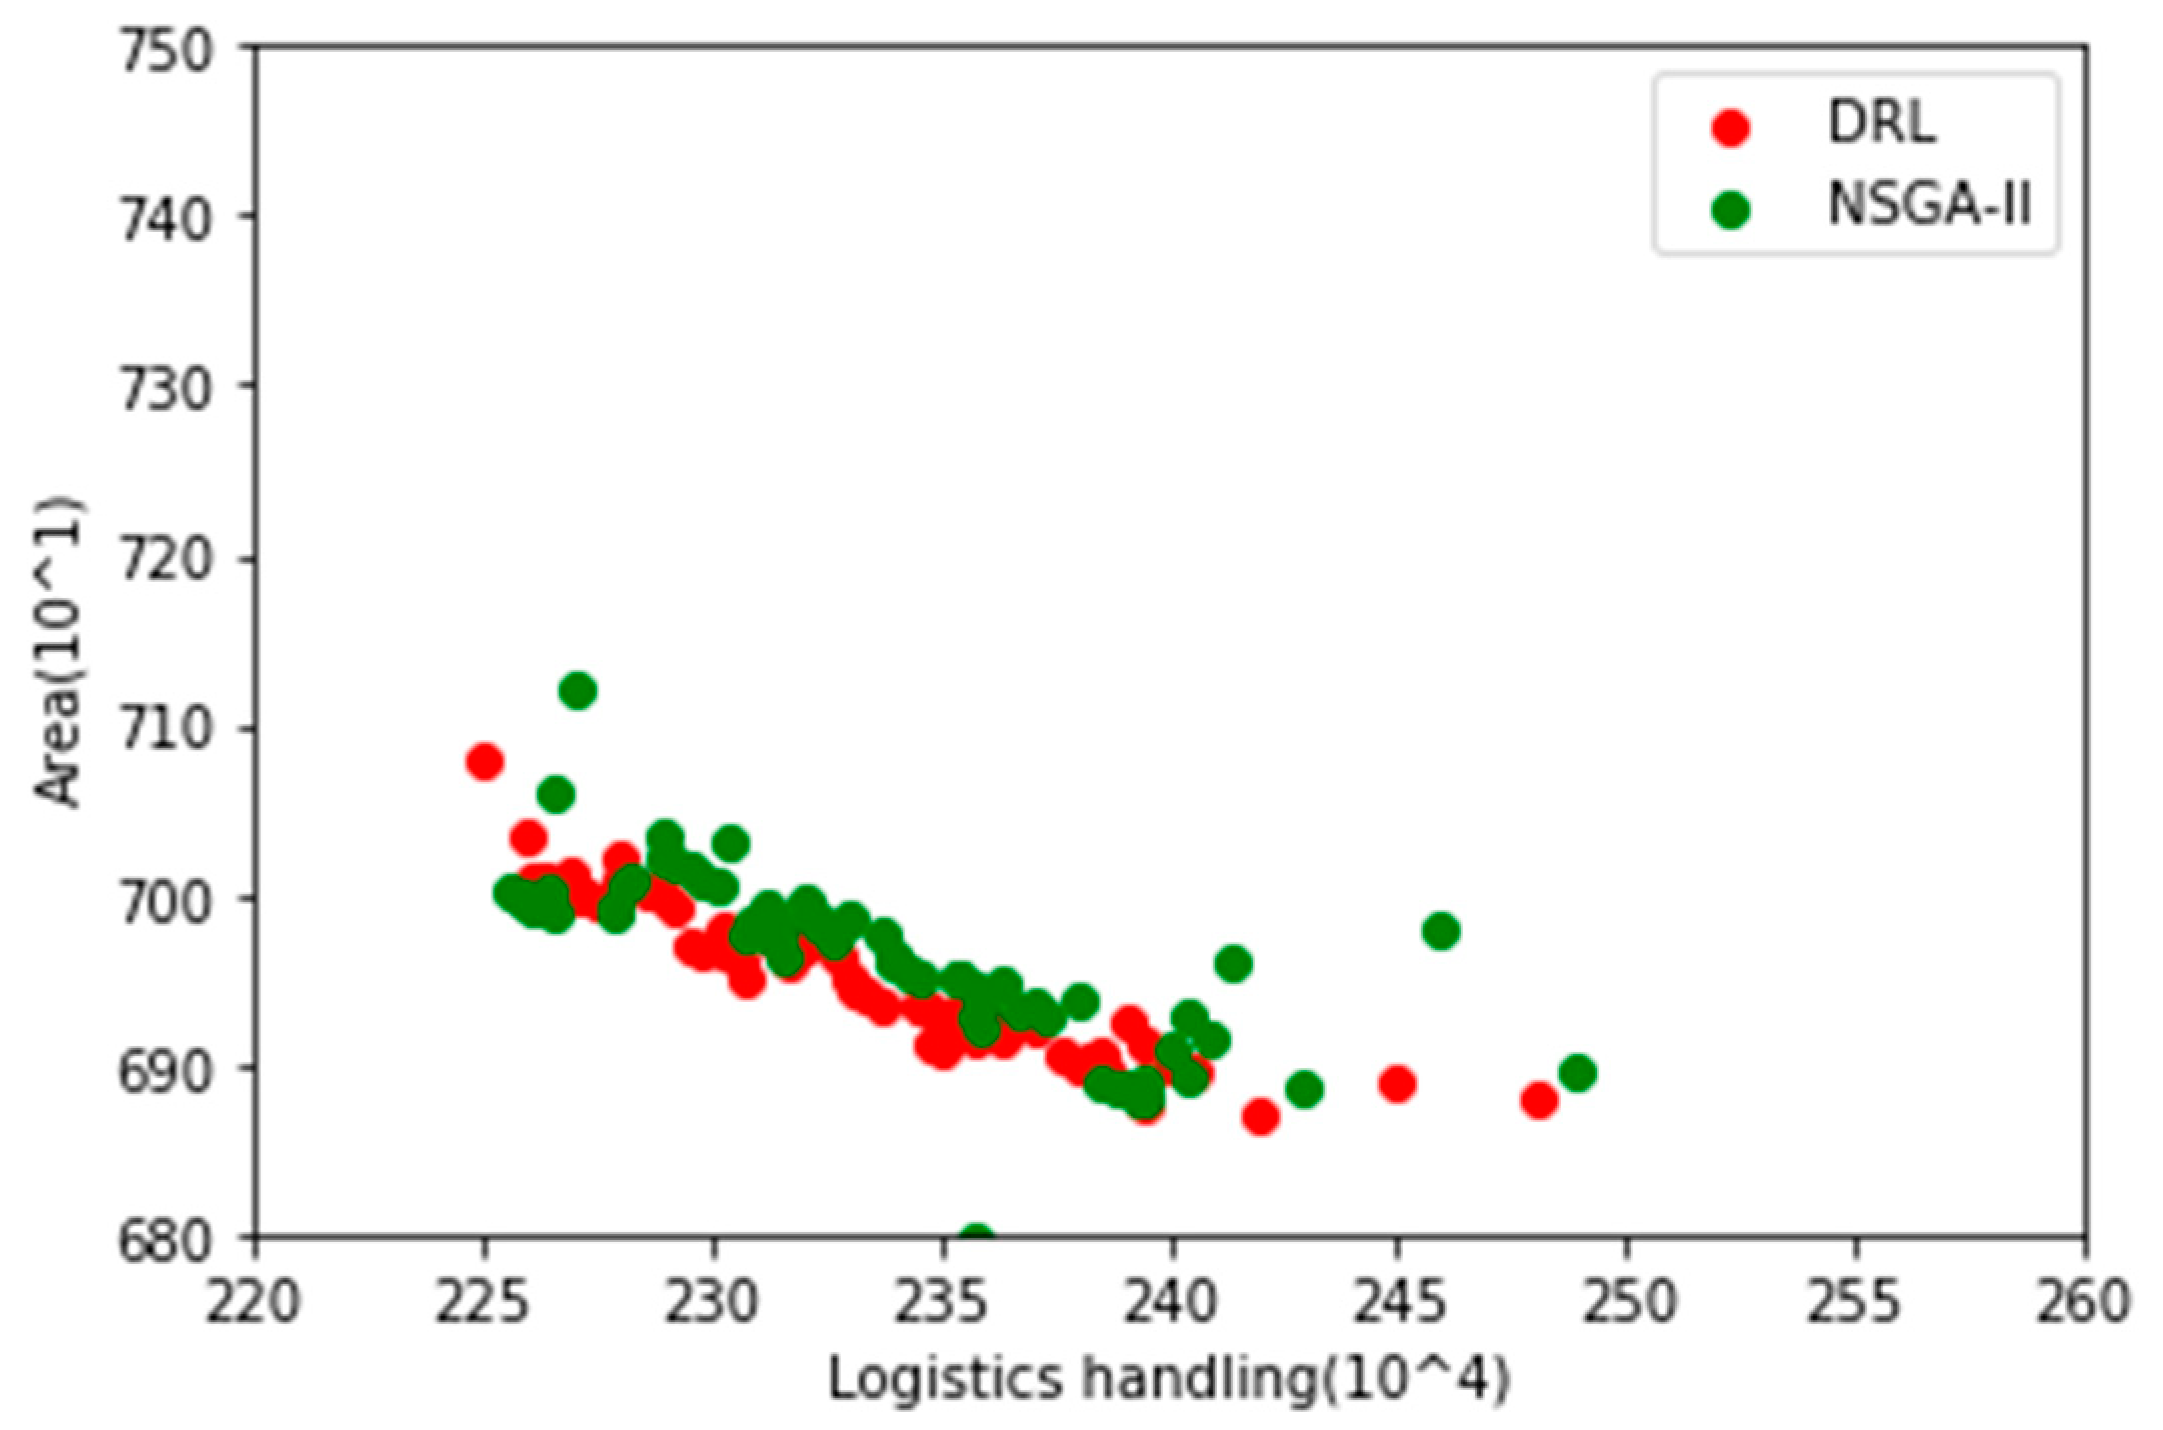
4.3. Optimization Algorithm Comparison

NSGA-II is widely used in solving the WFLOP, and the solution effect is good. In order to verify the superiority of DRL in solving the WFLOP, this study uses the classic NSGA-II as the comparison object. The population size of the NSGA-II algorithm is 100, the maximum number of iterations is 3000 generations, and each is run 10 times. The comparison of optimal solution sets is shown in Figure 10.
From Figure 10, we can find that both NSGA-II and DRL have better solution results. The DRL optimal solution set is slightly better than the NSGA-II algorithm, and both algorithms obtain optimal solutions (227.9 × 10⁴, 669.3 × 101). The calculation time of NSGA-II is between 15 and 60 min, so it cannot meet the real-time solution requirements of virtual reality technology. After training, the DRL solution to the WFLOP can achieve a real-time solution effect and can meet the engineering needs of facility layout for virtual reality technology. The DRL method of solving the WFLOP provides theoretical support for the facility layout of immersive virtual reality technology.

5. Discussion and Conclusions

This paper proposes the application of DRL to solve a dual-objective WFLOP. It first constructs a dual-objective WFLOP mathematical model and proposes a novel dual-objective DRL framework. The DRL framework decomposes the WFLOP dual-objective problem into multiple sub-problems and then models each sub-problem. In order to save computational workload, a neighborhood parameter transfer strategy is adopted. A chain rule is constructed for the appealed sub-problem, and an improved pointer network is used to solve the bi-objective WFLOP of the sub-problem. Finally, the effectiveness of this method is verified by using the facility layout of a chip production workshop as a case study.
The research presented in this article has achieved some results, but there are some limitations. Further research is required on the following points:
(1)
This article only studies DRL (Deep Reinforcement Learning) to solve the dual-objective WFLOP (Workshop Facility Layout Optimization Problem). The DRL framework of the WFLOP for high-dimensional objectives needs further research.
(2)
The WFLOP platform for virtual reality technology has not yet been built. In the future, Unity 3D, Demo 3D, etc. will be used to build the WFLOP platform.
(3)
The generalization ability of DRL to solve the WFLOP needs further study to improve the compatibility of this method.

Author Contributions

Conceptualization, D.D. and Y.Z.; methodology, Y.Z.; software, D.D. and Y.Z.; validation, D.D. and Y.Z.; formal analysis, D.D. and Y.Z.; investigation, Y.Z.; resources, Y.Z.; data curation, D.D. and Y.Z.; writing—original draft preparation, Y.Z.; writing—review and editing, D.D. and Y.Z.; visualization, D.D.; supervision, Y.Z.; project administration, Y.Z.; funding acquisition, Y.Z. All authors have read and agreed to the published version of the manuscript.

Funding

This research was funded by the Natural Science Foundation of Sichuan Province (Grant No. 24NSFSC7602), Sichuan Technology & Engineering Research Center for Vanadium Titanium Materials (Grant No. 2021-FTGC-Z-05), and Vanadium and Titanium Resource Comprehensive Utilization Key Laboratory of Sichuan Province (Grant No. 2022FTSZ05).

Data Availability Statement

Data are contained within the article.

Acknowledgments

We sincerely thank all editors and reviewers for their valuable suggestions on the improvement of this paper.

Conflicts of Interest

The authors declare no conflicts of interest.

References

  1. Chao, G.; Zhang, Z.Q.; Liu, S.L. Multi-objective particle swarm optimization for multi-workshop facility layout problem. J. Manuf. Syst. 2019, 53, 32–48. [Google Scholar]
  2. Flavio, D.P.; Amy, R.C. An MINLP approach for safe process plant layout. Ind. Eng. Chem. Res. 1996, 35, 1354–1361. [Google Scholar]
  3. Zhao, Y.L. Manufacturing cell integrated layout method based on RNS-FOA algorithm in smart factory. Processes 2022, 10, 1759. [Google Scholar] [CrossRef]
  4. Guo, W.; Jiang, P.Y.; Yang, M.L. Unequal area facility layout problem-solving: A real case study on an air-conditioner production shop floor. Int. J. Prod. Res. 2022, 61, 1479–1496. [Google Scholar] [CrossRef]
  5. Andreas, K.; Vosniakos, G.C. An augmented reality approach to factory layout design embedding operation simulation. Int. J. Interact. Des. Manuf. 2019, 13, 1061–1071. [Google Scholar]
  6. Mona, S.; Emad, E.; Emad, E. Optimization of construction site layout using BIM generative design. Int. J. Constr. Manag. 2023, 24, 314–322. [Google Scholar]
  7. Seungnam, Y.; Jonghui, H. Virtual reality platform-based conceptual design and simulation of a hot cell facility. Int. J. Adv. Manuf. Technol. 2021, 116, 487–505. [Google Scholar]
  8. Chee, H.T.; Hwa, J.Y.; Siti, N.M. Augmented reality assisted facility layout digitization and planning. J. Mech. Sci. Technol. 2021, 35, 4115–4123. [Google Scholar]
  9. Mirco, P.; Giuseppe, F.; Fabio, S. V Digital Facility Layout Planning. Sustainability 2020, 12, 3349. [Google Scholar]
  10. Jiang, S.; Nee, A.Y.C. A novel facility layout planning and optimization methodology. CIRP Ann. Manuf. Technol. 2013, 32, 483–486. [Google Scholar] [CrossRef]
  11. Zhinan, Z.; Xin, W.; Xiaohan, W.; Fan, C.; Hui, C. A simulation-based approach for plant layout design and production planning. J. Ambient Intell. Humaniz. Comput. 2019, 10, 1217–1230. [Google Scholar]
  12. Goli, A.; Tirkolaee, E.B.; Aydın, N.S. Fuzzy integrated cell formation and production scheduling considering automated guided vehicles and human factors. IEEE Trans. Fuzzy Syst. 2021, 29, 3686–3695. [Google Scholar] [CrossRef]
  13. Kalyanmoy, D.; Proteek, C.R.; Rayan, H. Surrogate modeling approaches for multiobjective optimization: Methods, taxonomy, and results. Math. Comput. Appl. 2020, 26, 5. [Google Scholar]
  14. Julia, R.; Maria, A.Z.; Iva, K. Integrated multi-objective evolutionary optimization of production layout scenarios for parametric structural design of flexible industrial buildings. J. Build. Eng. 2022, 46, 103766. [Google Scholar]
  15. Oriol, V.; Meire, F.; Navdeep, J. Pointer networks. Adv. Neural Inf. Process. Syst. 2015, 475, 2692–2700. [Google Scholar]
  16. Kaiwen, L.; Tao, Z.; Rui, W. Deep reinforcement learning for multi-objective optimization. J. IEEE Transcations Cybern. 2020, 214, 2977661. [Google Scholar]
  17. Fei, F.; Guang, L.X. Spatiotemporal path tracking via deep reinforcement learning of robot for manufacturing internal logistics. J. Manuf. Syst. 2023, 69, 50–169. [Google Scholar]
  18. Yunmei, Y.; Hong, Y.L. Application of Deep Reinforcement Learning Algorithm in Uncertain Logistics Transportation Scheduling. Comput. Intell. Neurosci. 2021, 27, 5672227. [Google Scholar]
  19. Seamus, G.; Debin, D. China’s emerging role in the global semiconductor value chain. Telecommun. Policy 2022, 46, 101959. [Google Scholar]
  20. Jiancheng, G.; Nan, M. A bibliometric study of China’s semiconductor literature compared with other major asian countries. Scientometrics 2007, 70, 124–127. [Google Scholar]
  21. YouJin, P.; Sun, H. Improvement of productivity through the reduction of unexpected equipment faults in die attach equipment. Processes 2021, 8, 394. [Google Scholar]
  22. Pedro, E.C.; Radu, G.; Eduardo, M.G.R. A review of data mining applications in semiconductor manufacturing. Processes 2021, 9, 305. [Google Scholar]
  23. Madhav, D. Manufacturing processes for fabrication of flip-chip micro-bumps used in microelectronic packaging: An overview. J. Micromanuf. 2020, 3, 69–83. [Google Scholar]
  24. Glorot, X.; Bengio, Y. Understanding the difficulty of training deep feedforward neural networks. In Proceedings of the Thirteenth International Conference on Artificial Intelligence and Statistics, Sardinia, Italy, 13–15 May 2010; pp. 249–256. [Google Scholar]
Figure 1. Virtual reality technology applied to workshop facility layout optimization [8,9,10].
Processes 12 00201 g001
Figure 2. Workshop layout diagram (Numbers 1–6 represent facility numbers).
Processes 12 00201 g002
Figure 3. Decomposition strategy diagram.
Processes 12 00201 g003
Figure 4. Input structure of neural network model for distance target and area target.
Processes 12 00201 g004
Figure 5. Physical equipment of CPW: (a) dicing machine; (b) chip loading machine; (c) PC plastic sealing machine.
Processes 12 00201 g005
Figure 6. Process flow: (a) dicing; (b) chip loading; (c) bonding; (d) plastic sealing; (e) electroplating; (f) printing; (g) rib cutting; (h) testing; (i) packaging.
Processes 12 00201 g006
Figure 7. Original general layout drawing of CPW.
Processes 12 00201 g007
Figure 8. Simplified diagram of CPW (Numbers 1–18 represent facility numbers).
Processes 12 00201 g008
Figure 9. Optimized CWP layout (Numbers 1–18 represent facility numbers).
Processes 12 00201 g009
Figure 10. Comparison diagram of optimal solution sets of DRL and NSGA-II.
Processes 12 00201 g010
Table 1. Size of each area.
NumberArea NameLength (m)Width (m)
1Dicing area7.64 9.78
2Raw material area26.00 11.30
3Loading area20.10 17.90
4Return cleaning area18.73 9.45
5Shelf area after loading40.00 6.27
6Gold wire bonding area28.00 6.90
7Aluminum wire bonding area28.00 3.49
8Plastic area28.00 15.30
9Plastic cold storage20.00 15.30
10Electroplating area28.00 11.30
11Printing area10.77 1.60
12Shelf area after printing20.00 8.50
13Rib cutting area36.00 11.30
14Testing area34.74 4.00
15Packaging area35.14 5.60
16Finished product Warehouse area39.94 16.40
17 Bathroom12.77 16.40
Table 2. Coordinate values of each area.
NumberCoordinate ValueNumberCoordinate Value
1[0, 20.65] or [0, 38.24]11[57.21, 45.48]
2[9.07, 45.48]12[82.20, 41.45]
3[27.86, 45.48]13[82.43, 45.48]
4[21.78, 29.69]14[109.58, 45.48]
5[21.78, 14.30]15[108.63, 33.56]
6[32.01, 29.69]16[108.63, 26.52]
7[57.21, 13.09]17[91.98, 11.68]
8[57.21, 6.43]18[120.95, 11.68]
[130, 20.65] or
[130, 38.24]
9[57.21, 29.69]19
10[82.40, 29.69]
Table 3. Coordinate values of each area.
NumberO-DDistance (m)Output (pcs) Logistics (m·pcs)
10-228.79 4200120,918
22-118.79 420078,918
31-316.21 210034,041
41-433.67 210070,707
53-519.29 300057,870
64-518.48 300055,440
75-624.33 350085,155
85-730.18 150045,270
95-834.29 100034,290
106-735.85 200071,700
116-835.45 150053,175
127-916.60 500083,000
138-923.26 400093,040
1410-925.19 200050,380
159-1115.79 11,000173,690
1611-1225.31 12,500316,375
1712-134.04 10,00040,400
1812-1427.67 250069,175
1913-1427.15 10,000271,500
2014-1511.96 9000107,640
2115-167.04 900063,360
2216-1722.30 11,000245,300
2317-1939.06 11,000429,660
total2,651,004
Table 4. Model parameter settings [15,16].
Neural NetworkParameter
Actor network
(Pointer network)
Encoder: 1D-Conv(Dinput, 128, kernel size = 1, stride = 1)
Decoder: GRU(hidden size = 128, number of layer = 1)
Critic network1D-Conv(Dinput, 128, kernel size = 1, stride = 1)
1D-Conv(128, 20, kernel size = 1, stride = 1)
1D-Conv(20, 20, kernel size = 1, stride = 1)
1D-Conv(20, 1, kernel size = 1, stride = 1)
Table 5. Coordinate values for each area after optimization.
NumberCoordinate ValueNumberCoordinate Value
1[0, 20.65] or [0, 38.24]11[57.21, 42.48]
2[9.07, 42.48]12[73.70, 42.48]
3[27.86, 42.48]13[84.50, 42.48]
4[21.84, 29.69]14[104.58, 42.48]
5[8.15, 15.13]15[108.63, 33.56]
6[29.44, 14.30]16[108.63, 26.52]
7[57.21, 13.09]17[103.98, 11.68]
8[57.21, 6.43]18[79.01, 11.68] [130, 20.65] or
[130, 38.24]
9[57.21, 29.69]19
10[82.40, 29.69]
Table 6. Coordinate values for each area.
NumberO-DDistance (m)Output (pcs) Logistics (m·pcs)
10-228.79 4200120,918
22-118.79 420078,918
31-320.31 358572,811.35
41-430.36 61518,671.4
53-517.16 512187,876.36
64-521.31 87918,731.49
75-610.16 350035,560
85-727.80 150041,700
95-828.86 100028,860
106-735.85 200071,700
116-835.45 150053,175
127-916.60 500083,000
138-923.26 400093,040
1410-925.19 200050,380
159-1115.79 11,000173,690
1611-1216.49 12,500206,125
1712-1310.80 10,000108,000
1812-1435.88 250089,700
1913-1425.08 10,000250,800
2014-1511.96 9000107,640
2115-167.04 900063,360
2216-1714.85 11,000163,350
2317-1923.78 11,000261,580
total2,279,587
Disclaimer/Publisher’s Note: The statements, opinions and data contained in all publications are solely those of the individual author(s) and contributor(s) and not of MDPI and/or the editor(s). MDPI and/or the editor(s) disclaim responsibility for any injury to people or property resulting from any ideas, methods, instructions or products referred to in the content.

