Article

Spatio-Temporal Evolution of Loading and Deformation of Surface Gas Pipelines for High-Intensity Coalbed Mining and Its Integrity Prediction Methodology

1
Key Laboratory of Deep Coal Resource Mining, Ministry of Education, School of Mines, China University of Mining and Technology, Xuzhou 221116, China
2
Shaanxi Xiaobaodang Mining Corporation Limited, Yulin 719302, China
3
Shenhua Xinjie Energy Company Limited, Ordos 017200, China
*
Author to whom correspondence should be addressed.
Processes 2024, 12(1), 213; https://doi.org/10.3390/pr12010213
Submission received: 17 November 2023 / Revised: 29 December 2023 / Accepted: 8 January 2024 / Published: 18 January 2024
(This article belongs to the Special Issue Coal Mining and Unconventional Oil Exploration)

Abstract

:
In recent years, the integrity of the gas pipeline in the coal-gas co-mining subsidence area has become a critical problem, restricting the safe and efficient mining of coal resources. This paper establishes a theoretical model for the safety prediction of gas pipelines in mining subsidence areas based on elastic free theory, constructs a 3D model of pipe-sand soil by using ABAQUS simulation software (2021), analyzes the characteristics of ground surface and pipeline settlement combined with the measured data on-site, and reveals the temporal and spatial evolution law of the pipeline load and deformation under the condition of diagonal intersections of the pipeline and high-strength mining working face. The results show that during the mining cycle, the pipe and the sandy soil body experienced the stage of cooperative deformation, the stage of increasing non-cooperative deformation, and the stage of weakening non-cooperative deformation; the pipe body is most vulnerable to yield failure in the circumferential direction of 180°, 45°, 225°, and 0°; the relative deformation rate of the pipe experienced a slow and rapid increase in the stage, and tends to flatten out when the advancement length is about 1.5–2 times the distance at the taken cross-section. The study’s results are conducive to accurately predicting the pipe failure orientation under high-intensity mining conditions in coal seams, improving the diagnostic efficiency of pipes, and optimizing the advancement speed of the working face.

1. Introduction

In the past decade, as the center of gravity of China’s coal resources development gradually shifted to the northwestern part of the country, the synergistic development zone of coal and co-associated resources, represented by the Ordos Basin, has faced many problems [1,2]. The region is rich in mineral resources such as coal, oil, and natural gas, and the coal-oil/gas co-mining area is increasing yearly. Coal seams usually have good storage conditions in this area, with a coal thickness of 2–8 m, and are nearly horizontal coal seams with low gas content and relatively simple geological structures. Therefore, the working face size of coal seams in the coal-oil/gas co-mining area is generally large, and most mines are designed with a working face width of more than 350 m, an advancing length of more than 4000 m, and an average advancing speed of 10–20 m/d. The movement of overburden and surface subsidence caused by high-intensity mining is more intense than that of the working face, with daily advancing of less than 10 m. Therefore, the oil/gas wells and the shallowly buried oil/gas pipelines in the area are more likely to have accidents of stress concentration, deformation, and even loss of integrity [3,4,5,6]. Once the integrity of oil and gas wells and pipelines is lost, the leaked oil and gas may cause surface fires, explosion safety accidents, and shallow soil and groundwater pollution [7,8]. Therefore, it is of great significance to study the loading and deformation spatial and temporal evolution of shallowly buried oil and gas pipelines in the process of high-intensity advancement of the working face, and to grasp the main failure orientation and timing of shallowly buried pipelines in order to prevent pipeline destabilization and leakage to determine the reasonable geometrical parameter, advancement speed, and safe avoidance distance from pipelines in the working face, as well as to ensure the safe and efficient coordination of coal-oil/gas mining.
In order to grasp the loading and deformation characteristics of shallowly buried pipelines in the surface subsidence area, at present, scholars at home and abroad adopt the foundation beam model to simulate the interaction between the pipeline and the soil, divide the deformation between the pipeline and the soil into coordinated and uncoordinated deformations in the process of surface subsidence, establish the pipeline deflection differential equations and the mechanical model, put forward the segment probability integral correction model for the prediction of the surface subsidence, achieve the prediction of the boundary of the subsidence basin, and analyze the stress and deformation distribution law of pipe body in the process of pipe-soil coordinated and uncoordinated deformation in the subsidence area [9,10,11,12]. Meanwhile, the random medium theory has also been applied to study the deformation law of the soil around the pipeline, which can more accurately assess the strain or stress suffered by the pipeline [13,14,15]. Due to the difficulty of real-time on-site monitoring of the stress and strain on pipelines in the subsidence area of coal mining and the high cost of monitoring, with the continuous enrichment of mechanical and theoretical models of pipelines and the rapid development of numerical simulation software, some scholars have used the finite element method to study the nonlinear mechanical response of pipelines and soil parameters to buried pipelines during the subsidence of the local soil layer [16,17,18,19,20,21].
Although many previous studies have been carried out on the subsidence law of the soil around the pipe, the mechanical response of the gas pipeline during the coordinated/uncoordinated deformation of the pipe-soil in the subsidence zone, and the deformation law, there is very little research on the spatial-temporal evolution law of the loading and deformation of the surface pipeline by the high-intensity mining of the coal bed under the conditions of the oblique intersection of the shallow buried gas pipeline and the advancing direction of the working face at the surface. Therefore, this paper takes the high-intensity mining of a working face in the Da Niu Di gas field in the Ordos Basin as the engineering background and adopts ABAQUS nonlinear finite element simulation software (2021) to analyze the settlement characteristics of the ground surface and the gas pipeline, and reveals the spatial-temporal evolution of the loading and deformation of the shallow buried gas pipeline that intersects obliquely with the advancing direction in the process of high-intensity mining of the working face. The conclusions of the study are crucial for accurately predicting the location of failure orientation of pipelines under high-intensity mining conditions in coal seams, improving the diagnostic efficiency of pipelines in coal-gas co-mining areas, optimizing the advancement speed of the working face, and determining the safe placement location of pipelines in order to avoid mining subsidence areas in the planning stage. At the same time, it is of great significance to safeguard the integrity of the surface shallow buried gas pipeline in the subsidence area of coal-gas high-intensity mining within the Ordos Basin.

2. Engineering Background

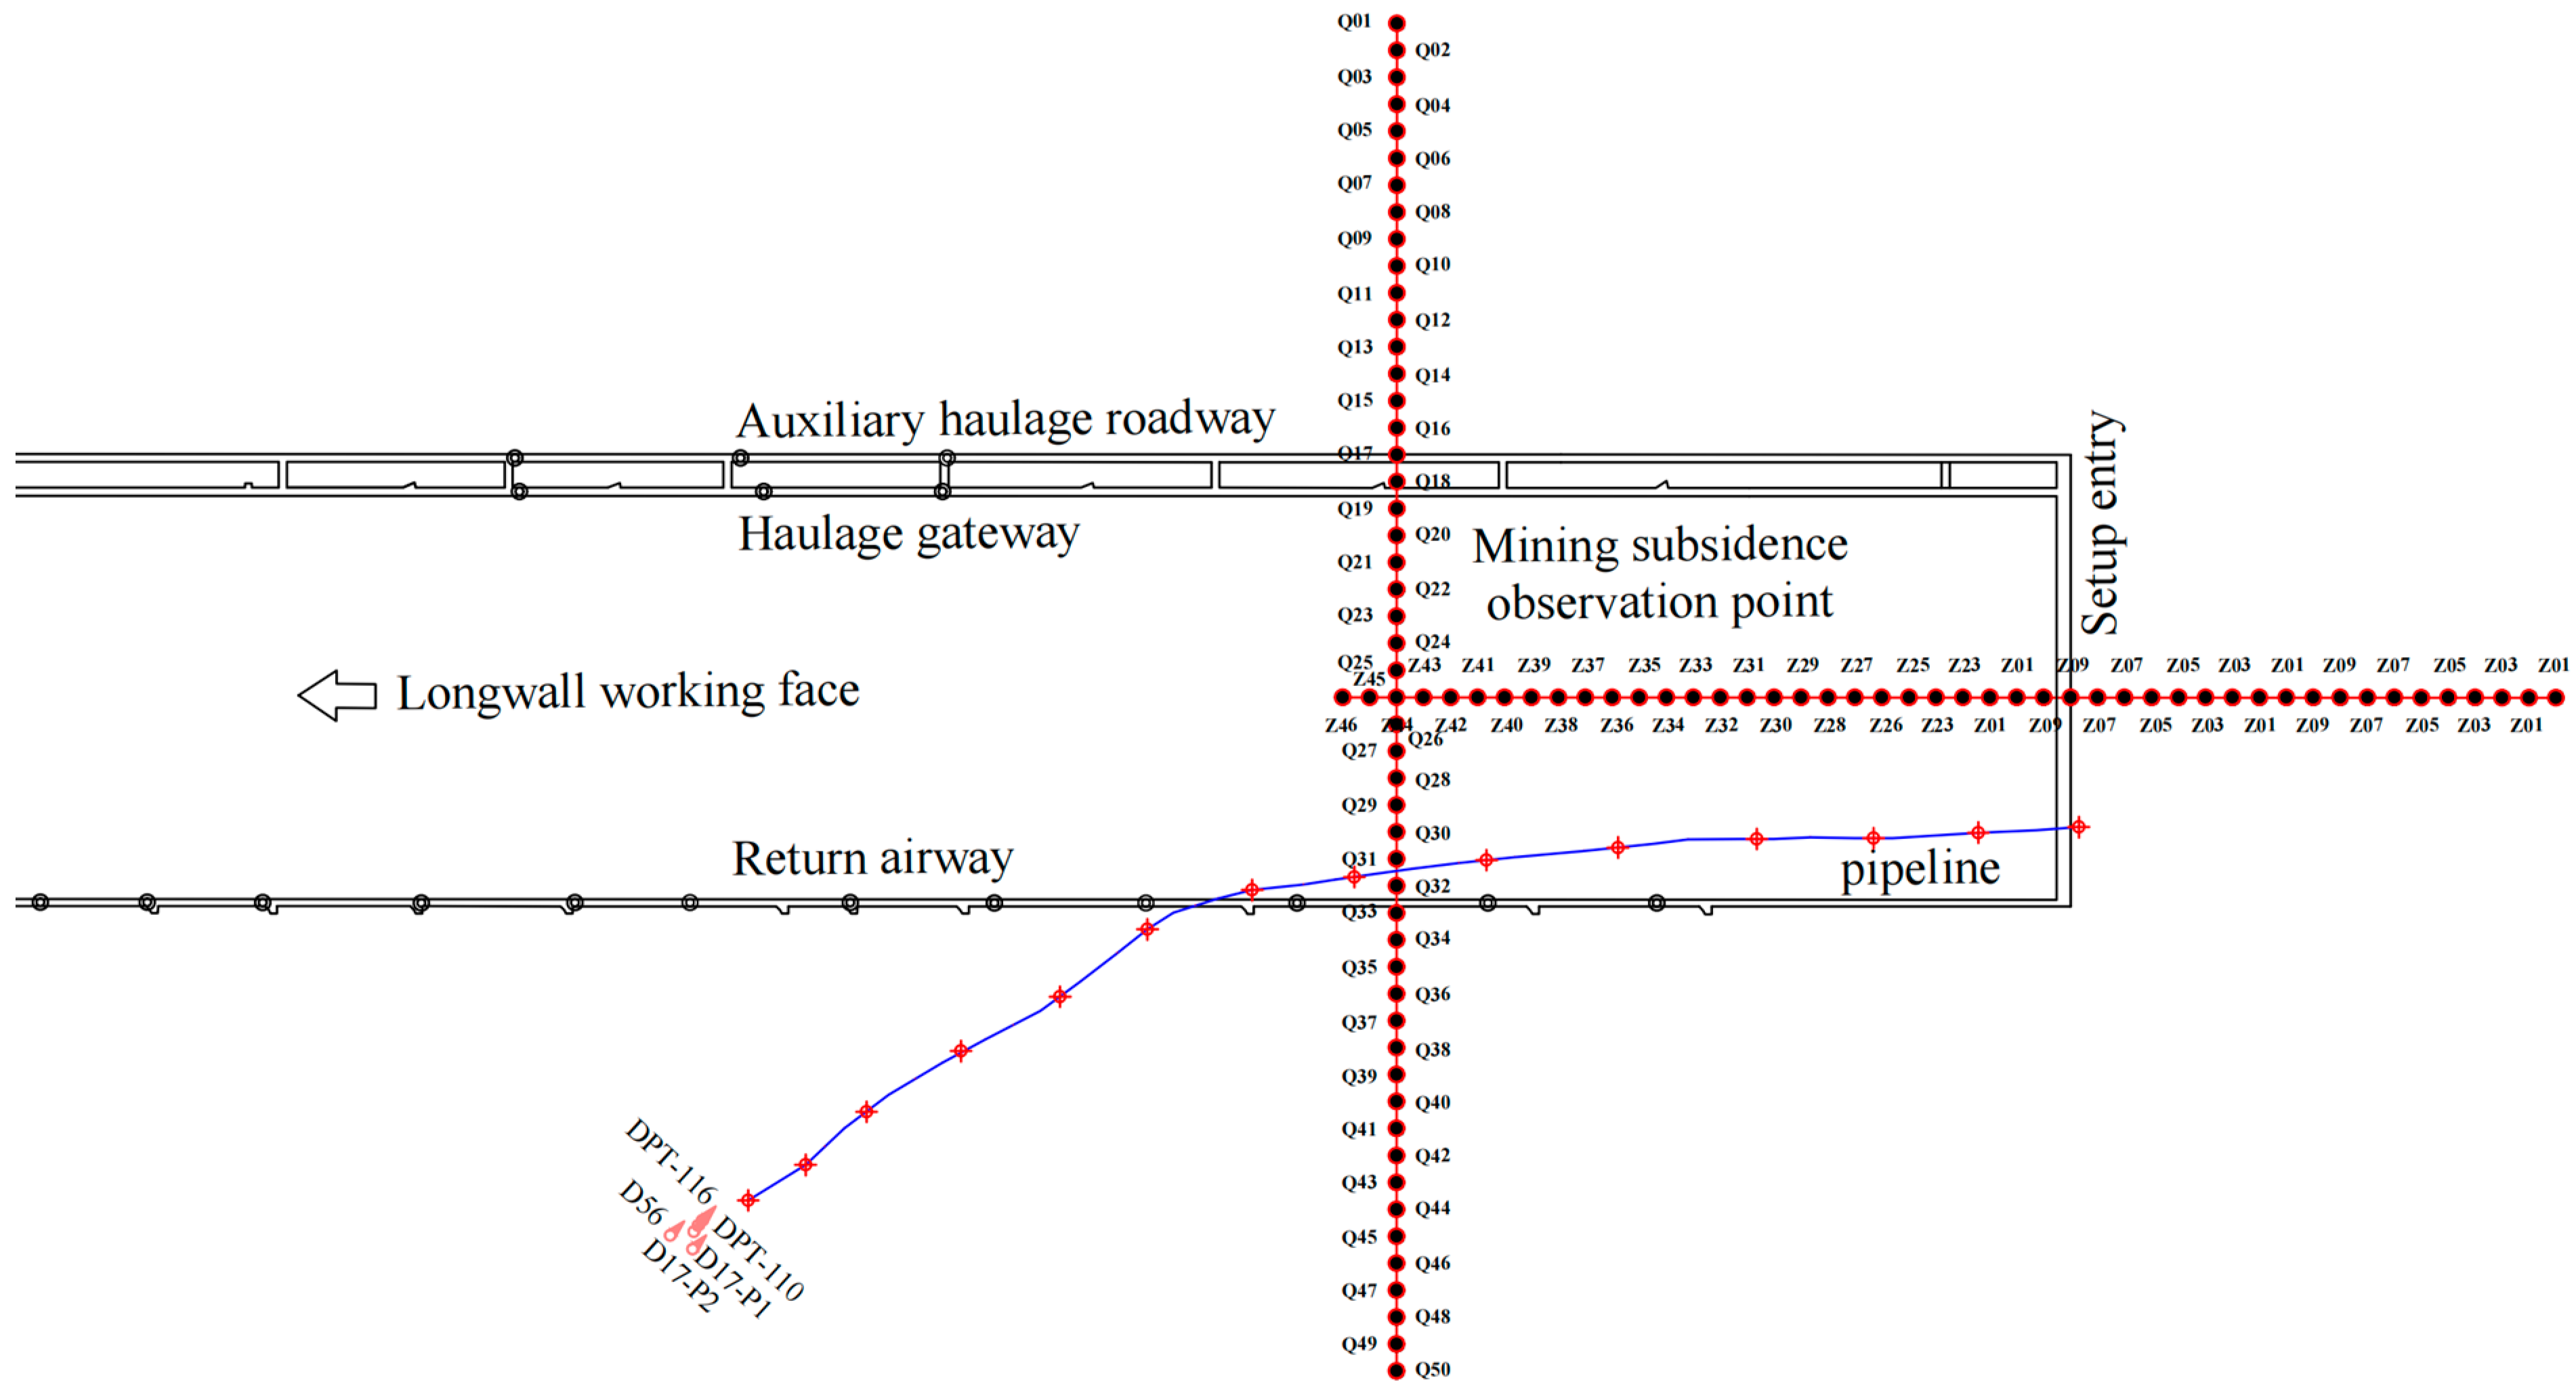
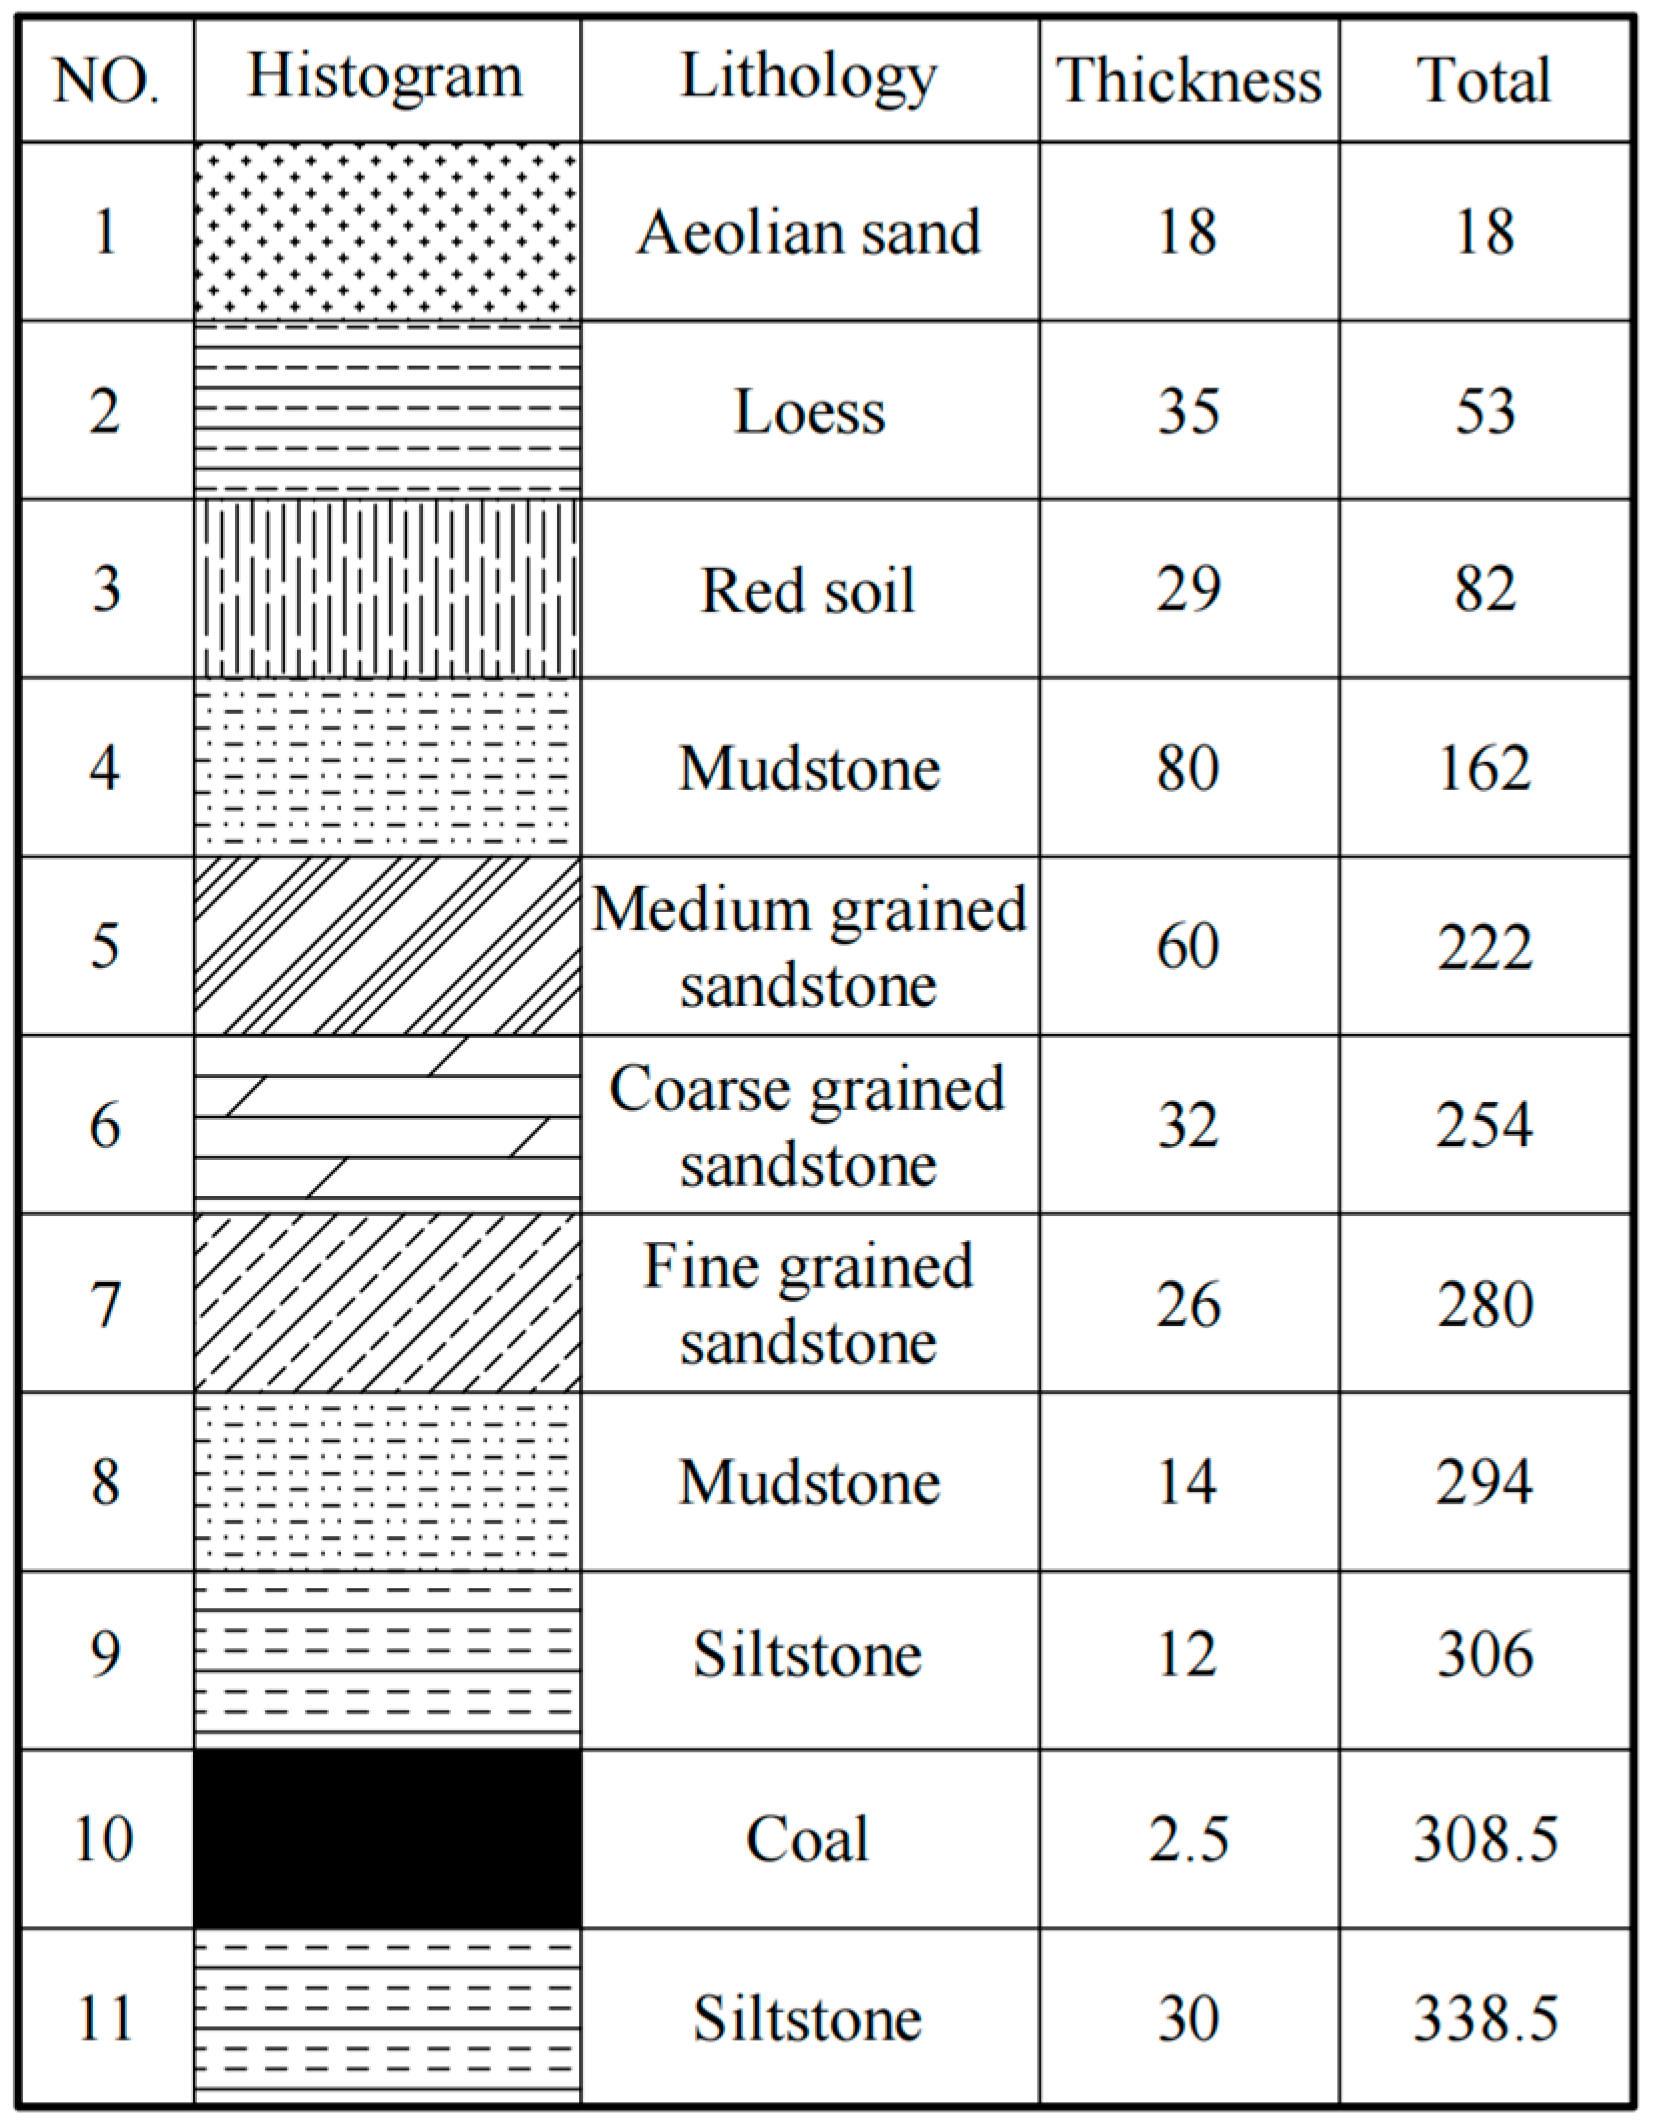
Natural gas resources within the Ordos Basin are mainly distributed within the Surig and Da Niu Di gas fields, with proven geological reserves of 1.79 × 10¹⁴ m3. The Da Niu Di gas field (depth of 2000 m or more) overlaps with the upper Jurassic coal seam (depth of 800 m or more) in the vertical direction over a large area (Figure 1). The length of gas transmission lines, gas gathering lines, and gas gathering trunk lines laid in the region is about 40.2 km [22,23]. The surfaces of working faces in mines within the Da Niu Di gas field are covered by thick alluvium aeolian sand, and the thickness of the aeolian sand is about 18 m [24]. The depth of a working face coal seam in a mine is 338 m, the average mining thickness is 2.5 m, and the inclination angle of the coal seam is 2°. The working face width is 300 m, the strike length is 4000 m, and the average monthly advance distance is about 450 m. The working face adopts the along-strike longwall full-mechanized coal mining method and the fully caving coal mining method to deal with the roof, which belongs to the shallowly buried coal seam super long working face high-intensity mining [25,26]. There exists a natural gas pipeline on the surface of the working face, which is about 400 m in length and laid along the direction of mining back towards the working face with an angle of 82° with the setup entry and an angle of 8° with the roadway of mining back to the surface. The gas pipeline has an outer diameter of 159 mm, a wall thickness of 5 mm, is made of 245N seamless steel pipe, and the buried depth of the pipeline is 1.8 m. The relationship between the working face, the pipeline, and the layout of the surface subsidence monitoring points are shown in Figure 2. The geological conditions of the working face are simple, and the columnar shape of the coal and rock seams of the area of the mining area is shown in Figure 3.

3. Integrity Prediction Method of Gas Pipeline in Mining Subsidence Area

In order to safeguard the integrity of the shallowly buried gas pipeline on the surface of the working face in the coal-gas coproduction subsidence area of the Da Niu Di gas field, a theoretical model of pipeline safety prediction has been established based on the elastic free theory. A method of safe pipeline laying to avoid the influence of the area of the mining subsidence has been put forward, which can provide a theoretical basis for the position of the surface gas pipeline in the pre-planning stage of the coal-oil and gas superposition area.

3.1. Elastic Deformation Limit of Pipeline

In the process of coal seam mining, the original stress state around the goaf and the overlying strata is out of balance. The roof and its overlying rock appear to move, fracture, and break under the action of self-weight, and then collapse successively. With the dynamic advancement of the working face, the caving zone, fracture zone, and curve subsidence zone (the “three zones”) are formed above the goaf in sequence. When the working face advances to a distance of 1/4–1/2 of the mining depth, the impact of mining gradually spreads to the surface, where it appears as a surface subsidence basin. When the shallowly buried pipeline is within the range of surface subsidence after the coal seam is mined, the soil at the bottom of the pipe gradually sinks. The pipeline bears the overburden load and its gravity, and the stress state around the pipe is changed. Plastic damage occurs when the pipeline exceeds the elastic deformation limit during subsidence. According to the People’s Republic of China oil and gas industry standard SY/T 0330-2004 «recommend practice for movement of in-service pipeline» [27], based on the elastic free theory, the shallowly buried pipeline on the surface of the mining subsidence area is simplified to be a single-span beam with fixed ends and uniform load. The elastic deformation limit of the pipeline can be derived from Equation (1):
L = 3.2 × 10 6 D Δ + 5.34 × 10 5 Δ 2 F D S M Y S S E
where L is the pipeline allowable deformation length, m; D is the pipe diameter, mm; Δ is the elastic deformation limit of the pipeline, m; FD is the design coefficient, and should take into account the state of the pipeline conditions, operating history, and the application of relevant regulations and rules, FD = 0.9; SMYS is the specified yield strength of the pipeline, MPa; and SE is the original axial stress in the pipe, MPa.
The surface of the working face is wind-deposited sand (Mao Wusu Desert), and the original axial stress in the pipeline can be expressed by Equations (2)–(4):
S E = S P + S T + S C
S P = p D μ 2 t
S t = E α T 1 T 2
where Sp is the internal pressure generated by the pipeline axial tensile stress, MPa; p is the pipeline maximum internal working pressure, MPa; μ is the Poisson’s ratio of steel pipe, take 0.3; t is the nominal wall thickness of the pipeline, mm; St is the pipeline axial tensile stress generated by temperature changes, MPa; E is the modulus of elasticity of the steel, 2 × 10⁵ MPa; α is the linear thermal expansion coefficient of the steel, 1.2 × 10⁻⁵ mm/(mm °C); T1 is the installation of the pipeline temperature, °C; T2 is the temperature at which the pipe moves, °C; SC is the original axial stress in the pipe produced by elastic bending, SC = 0.
Equations (2)–(4) are brought into Equation (1) to obtain Equation (5). According to Equation (5), the elastic deformation limit of the pipeline in the surface moving basin can be calculated by Δ .
Δ = 3.2 × 10 6 × D 2 + 4 × 5.34 × 10 5 × L 2 × F D × S M Y S S E 3.2 × 10 6 × D 2 × 5.34 × 10 5

3.2. Pipeline Safety Protection Methods

The axis of the pipeline intersects obliquely with the advancing direction of the working face, and is in the inner and outer fringe areas of the moving basin. The inner fringe area (compression area) is located between the vicinity of the boundary of the extraction zone to the point of maximum subsidence, and the outer fringe area (stretching area) is located between the vicinity of the boundary of the extraction zone and the boundary of the basin. The surface subsidence in the two areas is not uniform, the ground movement is tilted to the direction of the basin center, and the shallowly buried pipeline moves, tilts, bends, and undergoes other forms of deformation with the surface subsidence. Since the pipe itself has a certain strength, it is considered safe when it does not reach its permissible elastic deformation limit during ground subsidence when the coal working face is advancing (Figure 4). The initial position of the pipe is buried at point A. After mining subsidence, it moves to point B and reaches the elastic deformation limit of the pipeline.
In order to effectively ensure the integrity of the pipeline in the mining subsidence zone, assuming that the arc length between AB is S, the length S of the pipeline moving along the subsidence curve must be within the allowable elastic deformation limit of the pipeline [28]. According to the difference method, the idea of “replacing curvature with straightness” in the curve integration of arc length is quoted, and the interval (xi, xi+1) is divided into sub-intervals. Then, the length of the curve corresponding to each sub-interval can be approximated by Equation (6).
S i = Δ x i 2 + Δ y i 2 = 1 + f 2 x i Δ x i
where xi is any point in the i interval, i = 1, 2, 3 …n.
The length of the arc between AB is approximately equal to the sum of the lengths of the curves corresponding to each subinterval in S, which can be approximated by Equation (7).
S i = 0 n S i = i = 0 n 1 + f 2 x i Δ x i
When n tends to infinity, the arc length S can be expressed by Equation (8).
S lim n i = 0 n S i = lim n i = 0 n 1 + f 2 x i Δ x i = x i x i + 1 1 + f 2 x d x
Based on the above analysis, the safety protection method of a shallow buried gas pipeline in a mining subsidence area is established by Equation (9).
Δ S = x i x i + 1 1 + f 2 x d x
Using the Gaussian function to fit the surface subsidence curve, the expression can be placed in the equation. Here, the surface inclination subsidence curve is fitted to the critical mining. In Equation (10), the correlation coefficient is 99.82%. It can be seen that the surface subsidence monitoring curve can be well-fitted by the Gaussian function (Figure 5).
f x = 16.15 1438.109 × exp 0.5 × x 497.78 67.195 2

3.3. Analysis of Theoretical Calculation Results

Combined with the site engineering conditions in this paper, the safety of shallow buried pipeline in mining subsidence area is verified. Since the laying length of the pipeline at the site is larger than the influence range of surface settlement, and the length of the pipeline which is in the influence range of surface settlement is 900 m, the elastic deformation limit of the pipeline can be found from the physical parameters in Table 1, Δ = 20.3 m. According to the measured surface subsidence curve, we know that the pipeline is in the subsidence curve at a certain point to move the vertical distance and horizontal distance, through the horizontal distance of the pipeline movement, the use of Matlab on the Equation (9) to solve the integral to get the pipeline along the subsidence curve to move the length of the S, to ensure that S is less than the elastic deformation of the pipeline limit can protect the integrity of the pipeline. Under the premise of determining the physical and mechanical parameters of pipelines in different working conditions, and obtaining the surface subsidence curves in different areas, it can provide a theoretical basis for the layout position of gas pipelines in the pre-planning stage of mining subsidence area.

4. Materials and Methods

4.1. Modeling and Methodology Design

A natural gas pipeline is a thin shell structure. Under the non-uniform subsidence of surface sand and soil bodies in the extraction area, the pipeline will be deformed or even damaged by extrusion, tension, and bending. Since there may be residual stresses on the pipe wall after the pipe is loaded and deformed, it is unreasonable to use the superposition principle to accumulate the deformation of the pipe when the pipe cross-section has a large deformation. Therefore, this paper adopts the finite element program ABAQUS to simulate and analyze the nonlinear mechanical behaviour of the pipeline and the spatiotemporal evolution characteristics of pipeline deformation during the process of high-intensity dynamic advancements of the coal seam, revealing the pipeline loading and deformation evolution law during the mining cycle and obtaining the spatiotemporal relationship between the pipeline yielding and the location of the coal seam being mined back. At the same time, it can also provide a reference for a more accurate assessment of the integrity of the surface shallow buried pipelines in the Da Niu Di gas field and mining areas with similar geological conditions. Since the surface pipeline is diagonally intersected with the advancement direction of the coal mining face, and the loads on the pipeline are asymmetric during the dynamic advancement of the working face, full-size modeling is adopted. After a large number of calculations, combined with the rock layer histogram of the mining area and the spatial relative position of the pipeline and the working face, the model length, width, and height are set to 1200 m × 700 m × 338.5 m. Considering the influence of the boundary effect, 200 m coal pillars are left behind the working face, in front of the stopping line, and on both sides of the working face (Figure 6). The numerical model established in this paper makes the following basic assumptions: (1) Pipe joints and pipe corrosion are not simulated in the finite element model. (2) The creep and relaxation characteristics of the pipe are not considered. (3) The rock layers in the model are homogeneous.
The pipeline is simulated using a reduced-integral four-node curved shell unit (S4R), and the sandy soil body around the pipeline is simulated using a reduced-integral eight-node linear hexahedral unit (C3D8R). The pipe circumference is divided into 40 shell units, and the size of the shell units along the axial direction of the pipe is 1/100 of the outer diameter of the pipe, which is more delicate, in order to more accurately respond to the characteristics of the surface pipeline loaded and the cross-section deformation in the extraction zone. Horizontal displacement constraints are set on the side of the model, horizontal and vertical displacement constraints are set on the bottom surface, the upper surface is free surface, gravity load is applied to the model, and the predefined field type is the ground stress. The model is run to the initial stress equilibrium before excavation. The isotropic elasticity model is used for the steel pipeline, and the mechanical properties of the pipeline are mainly described by the elastic modulus E and Poisson’s ratio μ. The Mohr–Coulomb constitutive model [29,30,31] is used to describe the mechanical properties of the coal rock mass in finite element numerical simulation, and the variation of the mechanical properties of the various rock formations is mainly described by four parameters, namely, the angle of internal friction φ, cohesion c, elastic modulus E, and Poisson’s ratio μ. These four parameters are accurately described. The shear stress on the force surface of the coal rock body unit is:
τ n = c + σ n tan φ
where σn and τn are the normal and shear stresses on the fracture plane, MPa; c is the cohesive force, MPa; and φ is the internal friction angle, °.
The mechanical property parameters of each rock stratum and pipeline are shown in Table 2. In order to ensure that the finite element numerical simulation is closer to the actual site, combined with the daily footage of the working face, the model is set up to excavate 20 m in each step, with a total of 40 steps in the working face. The total excavation length is 800 m. The mechanical response generated by the shallow buried pipeline and the spatial and temporal evolution characteristics of pipeline cross-section deformation in the process of non-uniform settlement in the mining subsidence area are analyzed during the mining process of the coal seam when the surface reaches from subcritical mining to critical mining and supercritical mining.

4.2. Model Validation

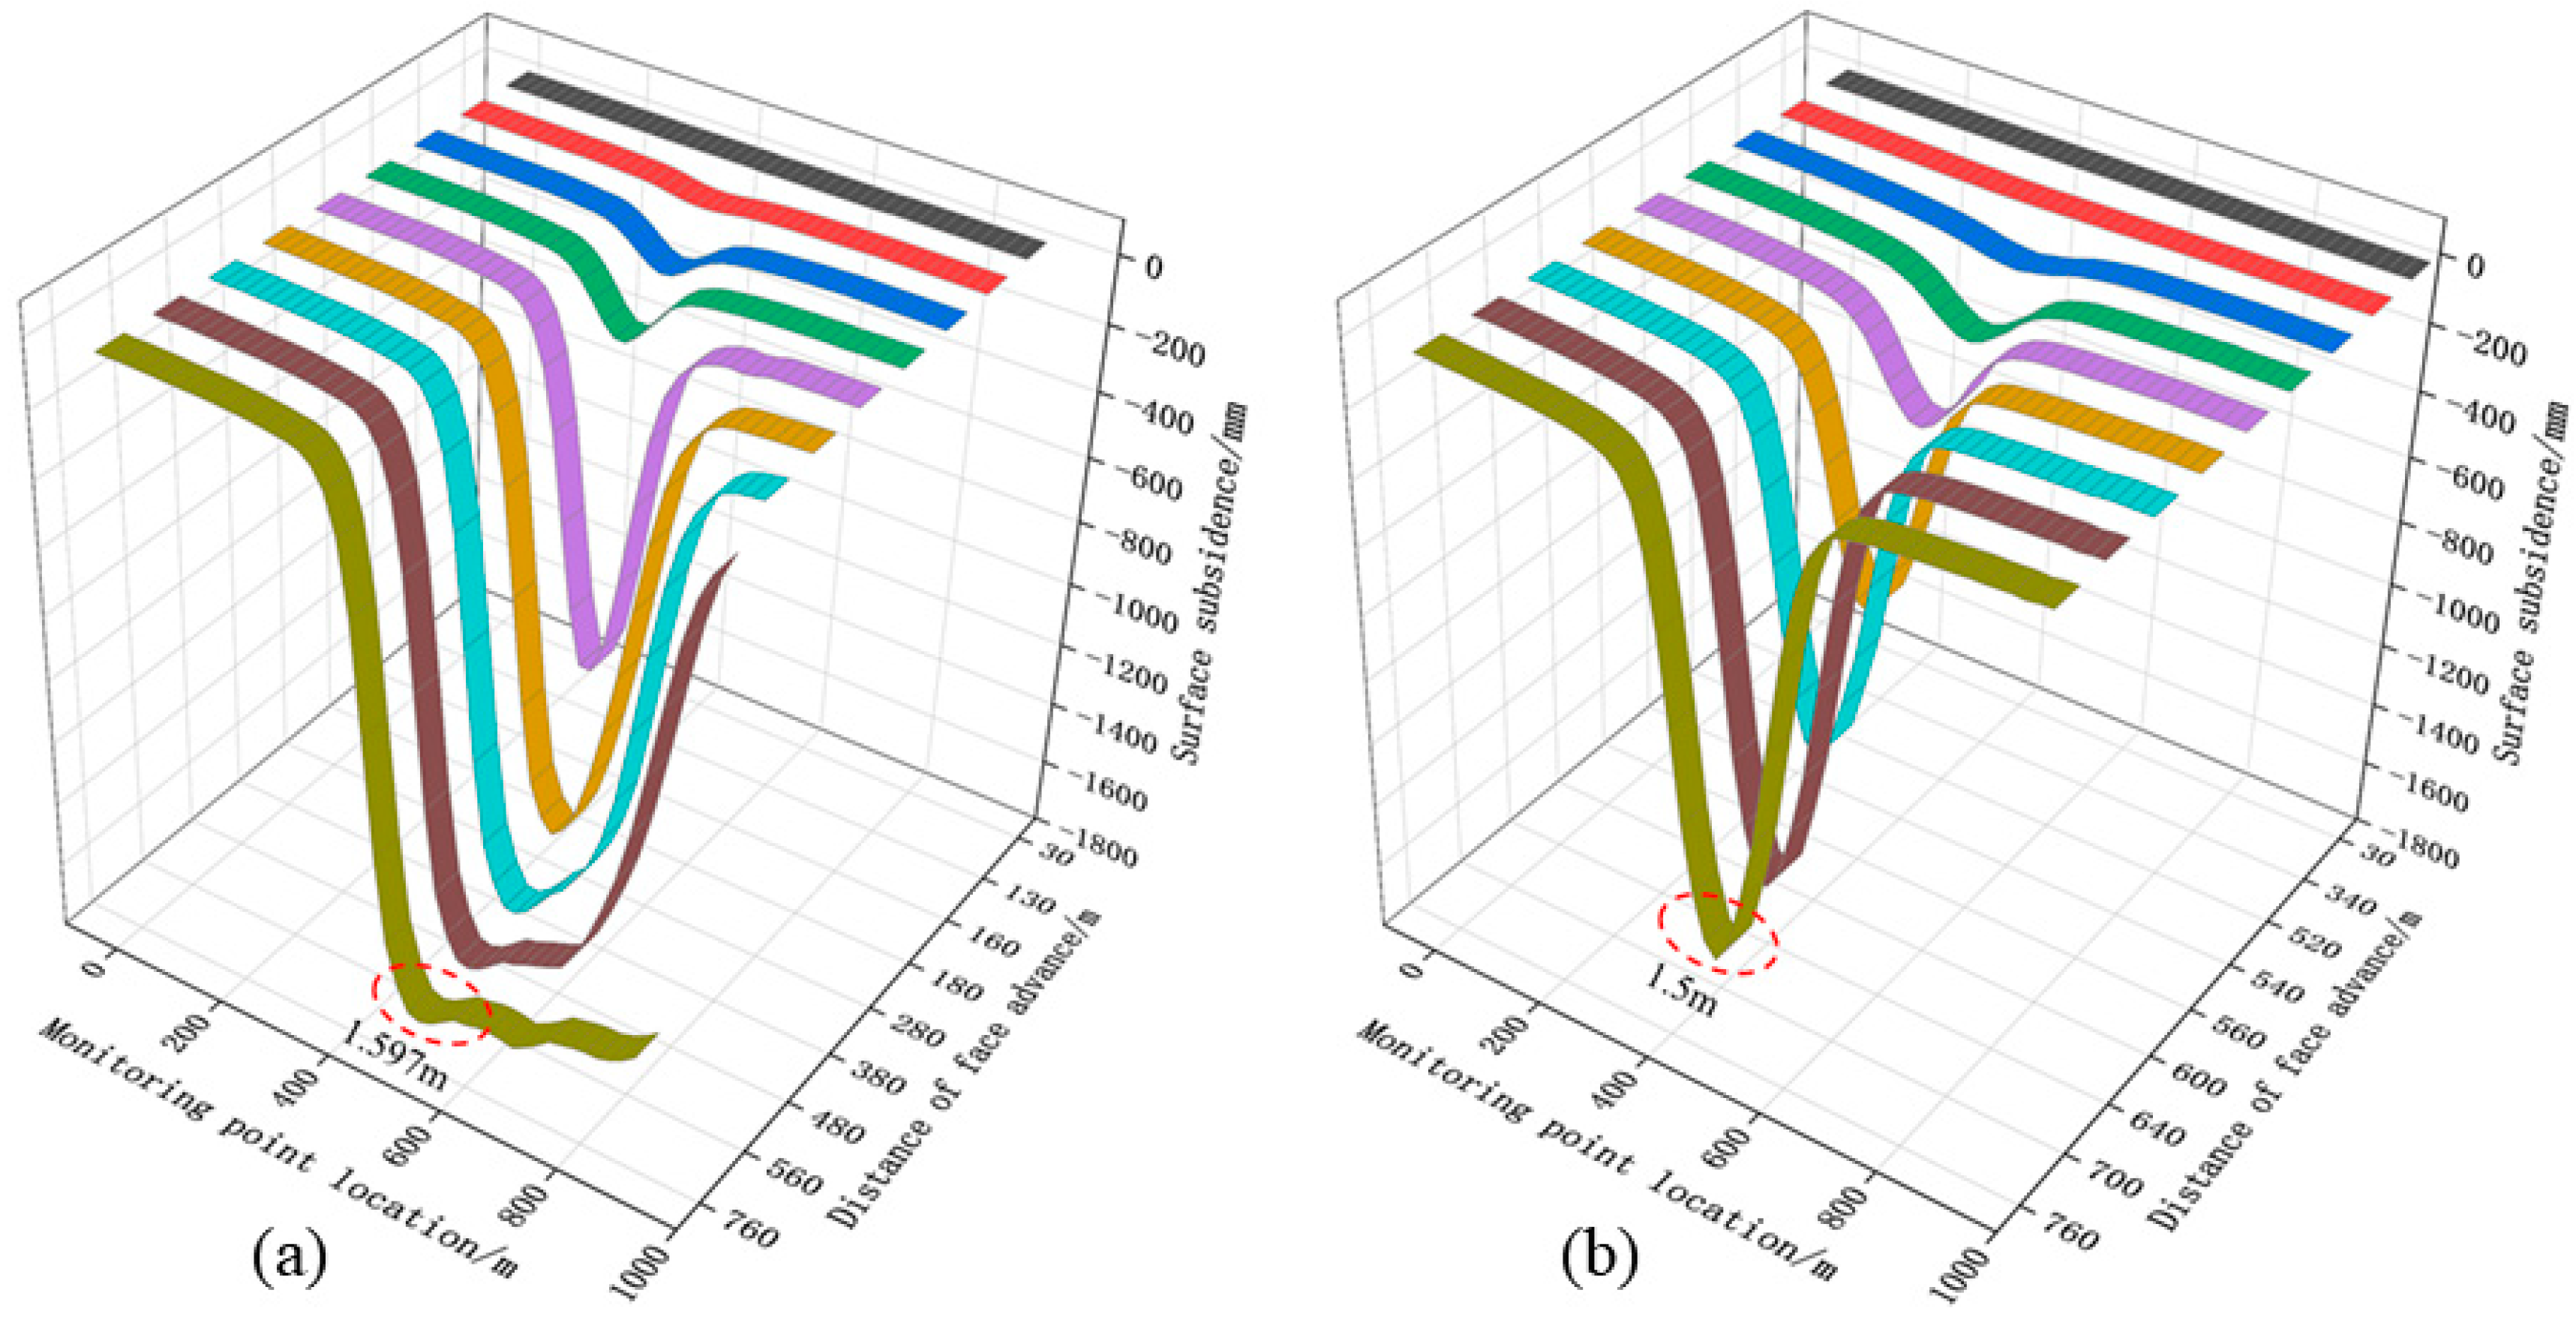
According to the measured data on-site, the surface subsidence curve of the working face strike and inclination is shown in Figure 7, when critical mining is achieved. With the increase of the mining distance of the coal seam, the maximum subsidence of the surface strike and inclination gradually increases, and the scope of the subsidence section expands to both sides. The inclination length of the working face is 300 m, and the width of the hollow area is less than (1.2–1.4) H0 (the mining depth) has not reached the theoretical condition of critical mining. Therefore, the measured inclination subsidence curve is similar to a “funnel shape”, and the maximum subsidence value of inclination is 1.5 m. When the face is mined back to 480 m from the setup entry, the maximum subsidence area of the strike subsidence curve starts to form the trend of “basin bottom”. When mining back to 760 m, the maximum value of the strike subsidence curve reaches 1.597 m. As the face continues to mine back, the maximum subsidence no longer changes significantly. The maximum value of the strike subsidence curve obtained through finite element simulation is 1.54 m, the overall trend of the subsidence curve is similar to that of the actual measurement, and the maximum value of the subsidence is only 3.57% smaller than that of the actual result (Figure 8). This indicates that the finite element model established in this paper is more reliable, and can characterize the surface movement and deformation caused by the high-intensity mining of the working face in the field.

5. Analysis and Discussion of Results

5.1. Surface and Pipeline Subsidence Characteristics

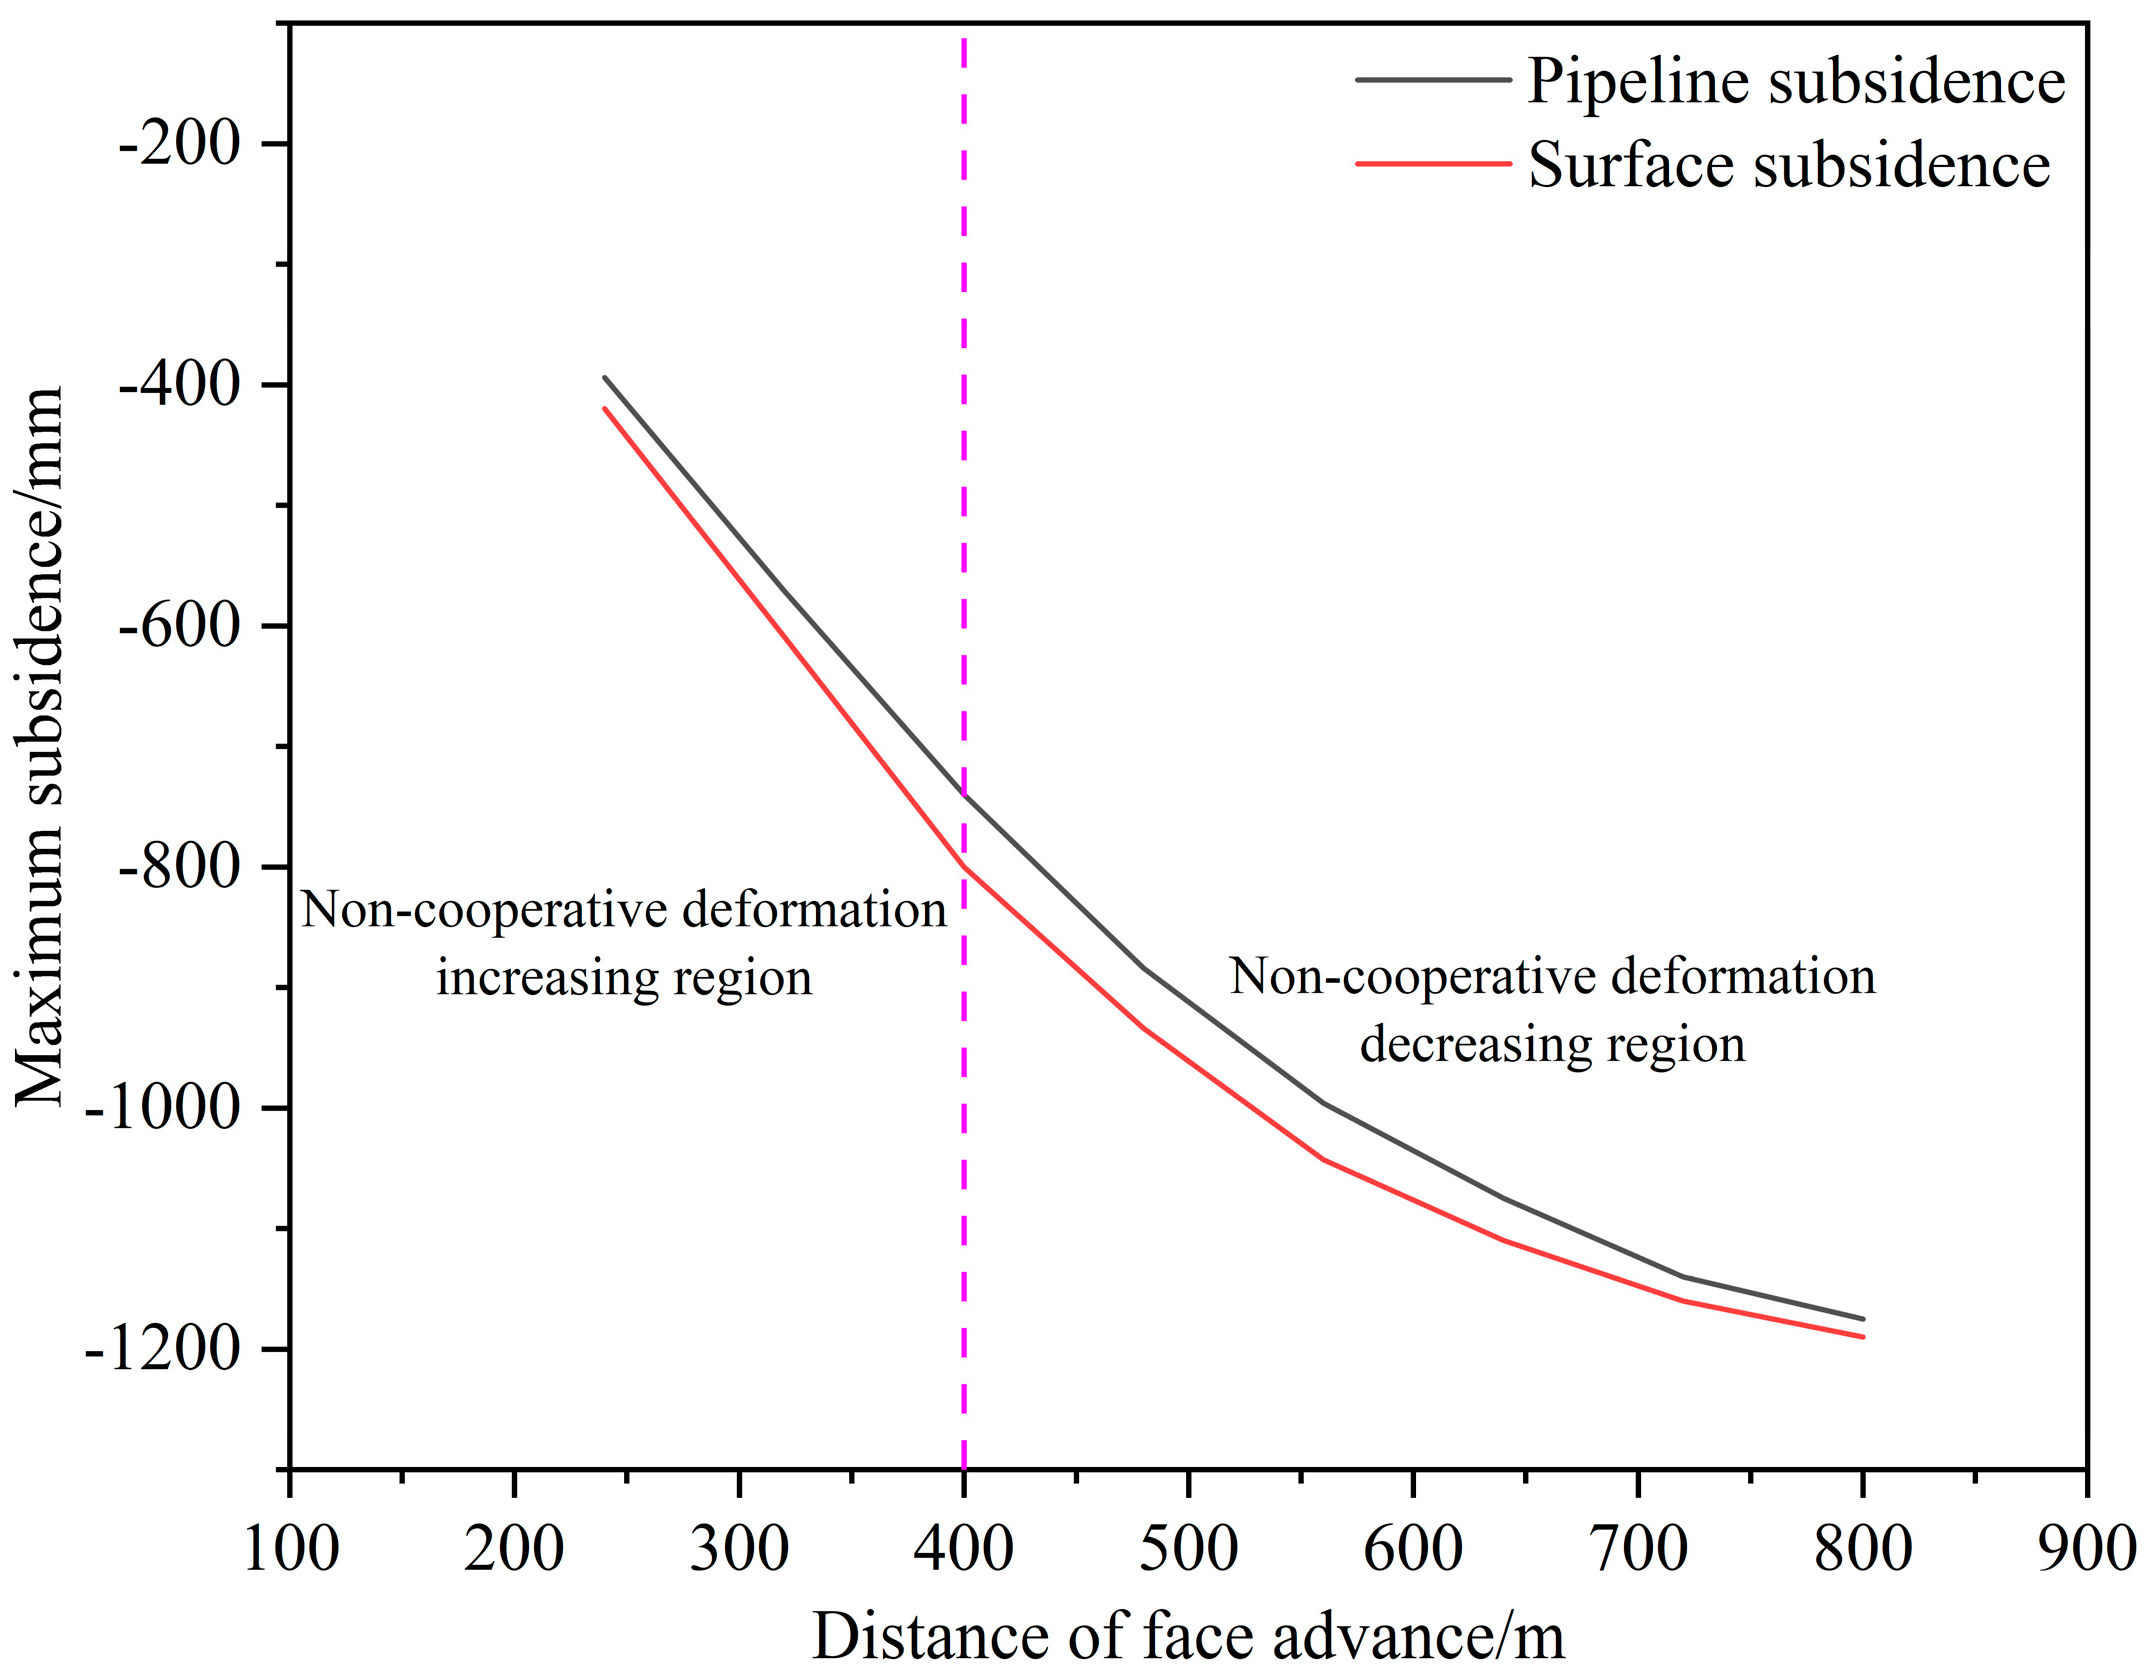
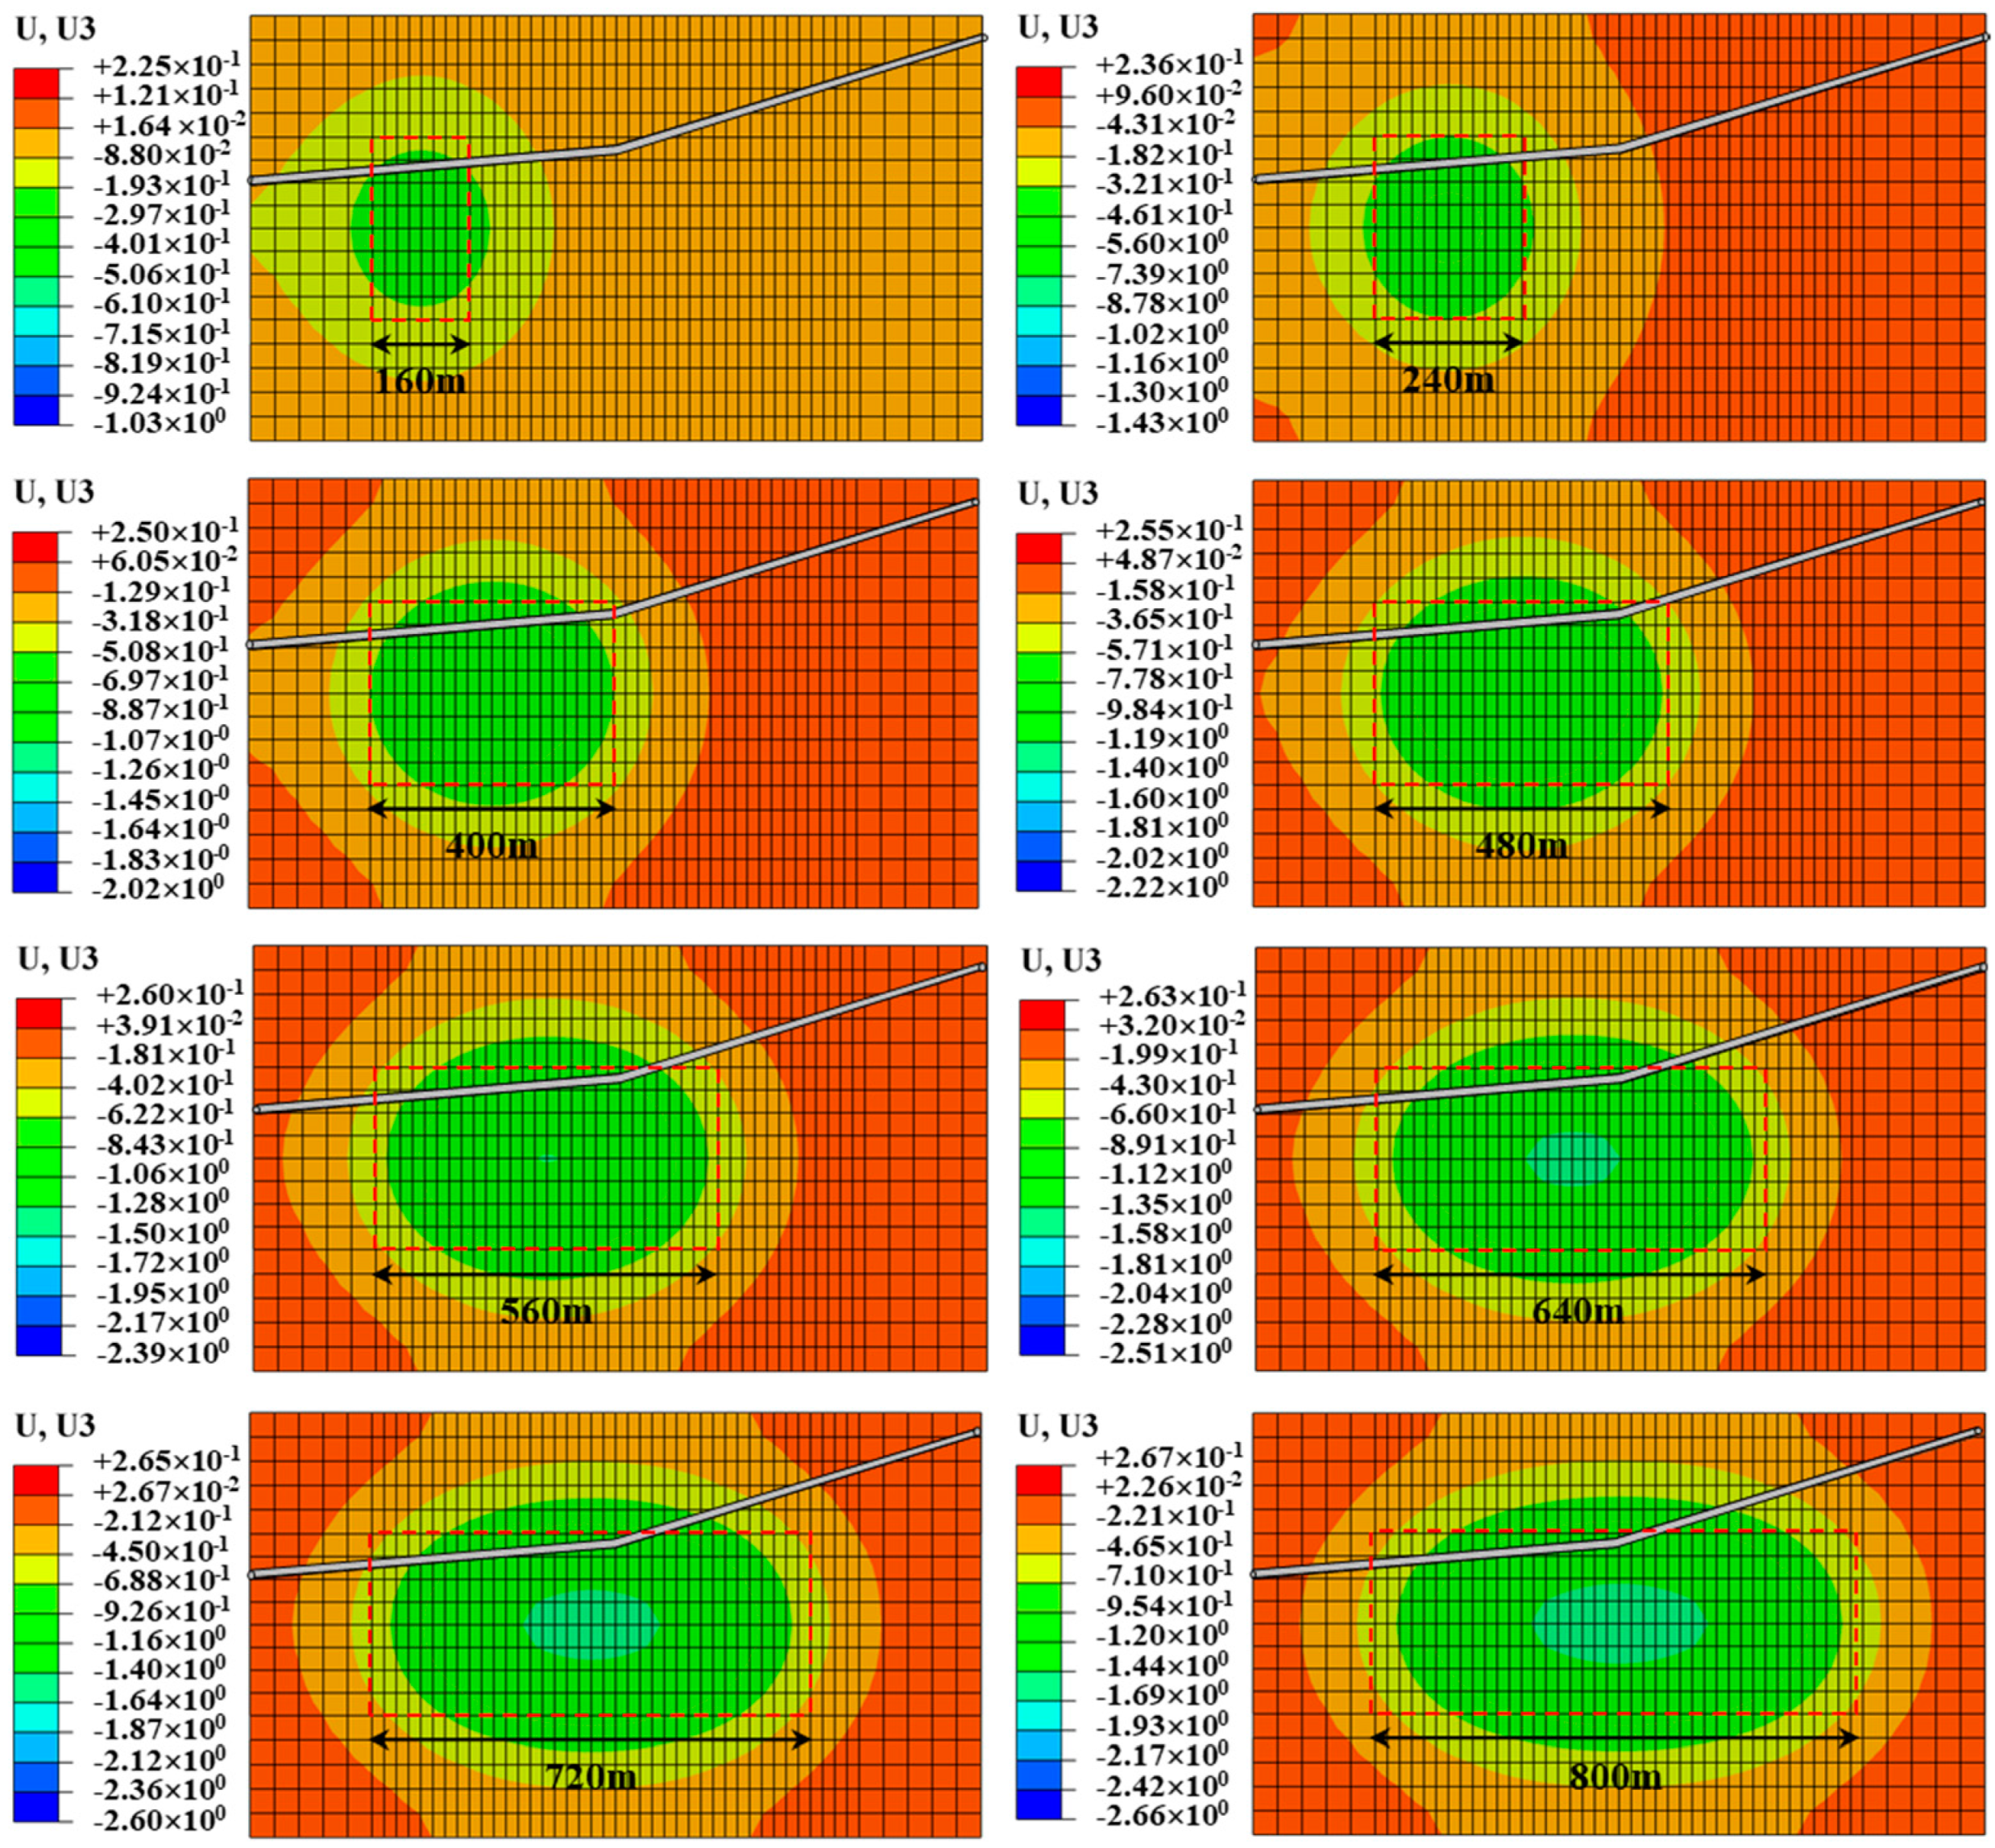
Pipeline deformation damage in the mining subsidence area is mainly dominated by failure after yielding. According to the fourth strength theory, Von Mises Stress is the failure judgment index. When the working face mining distance is 120 m (already in the range of 1/4–1/2H0), the surface appears to have apparent subsidence, and the maximum pipe subsidence displacement is 137 mm. Currently, the pipe suffers the maximum Von Mises Stress of 127 MPa. As the working face continues to advance, the surface’s basin of influence range continues to expand, and the pipeline and the pipe around the sandy soil commonly subside. In order to analyze the change of maximum pipe-sand soil subsidence during the mining process, a method of recording the maximum subsidence displacement of the surface and the pipe every 20 m of mining back (Figure 9) was designed. We extracted the cloud diagram of the relationship between surface subsidence and spatial location of the pipe (Figure 10).
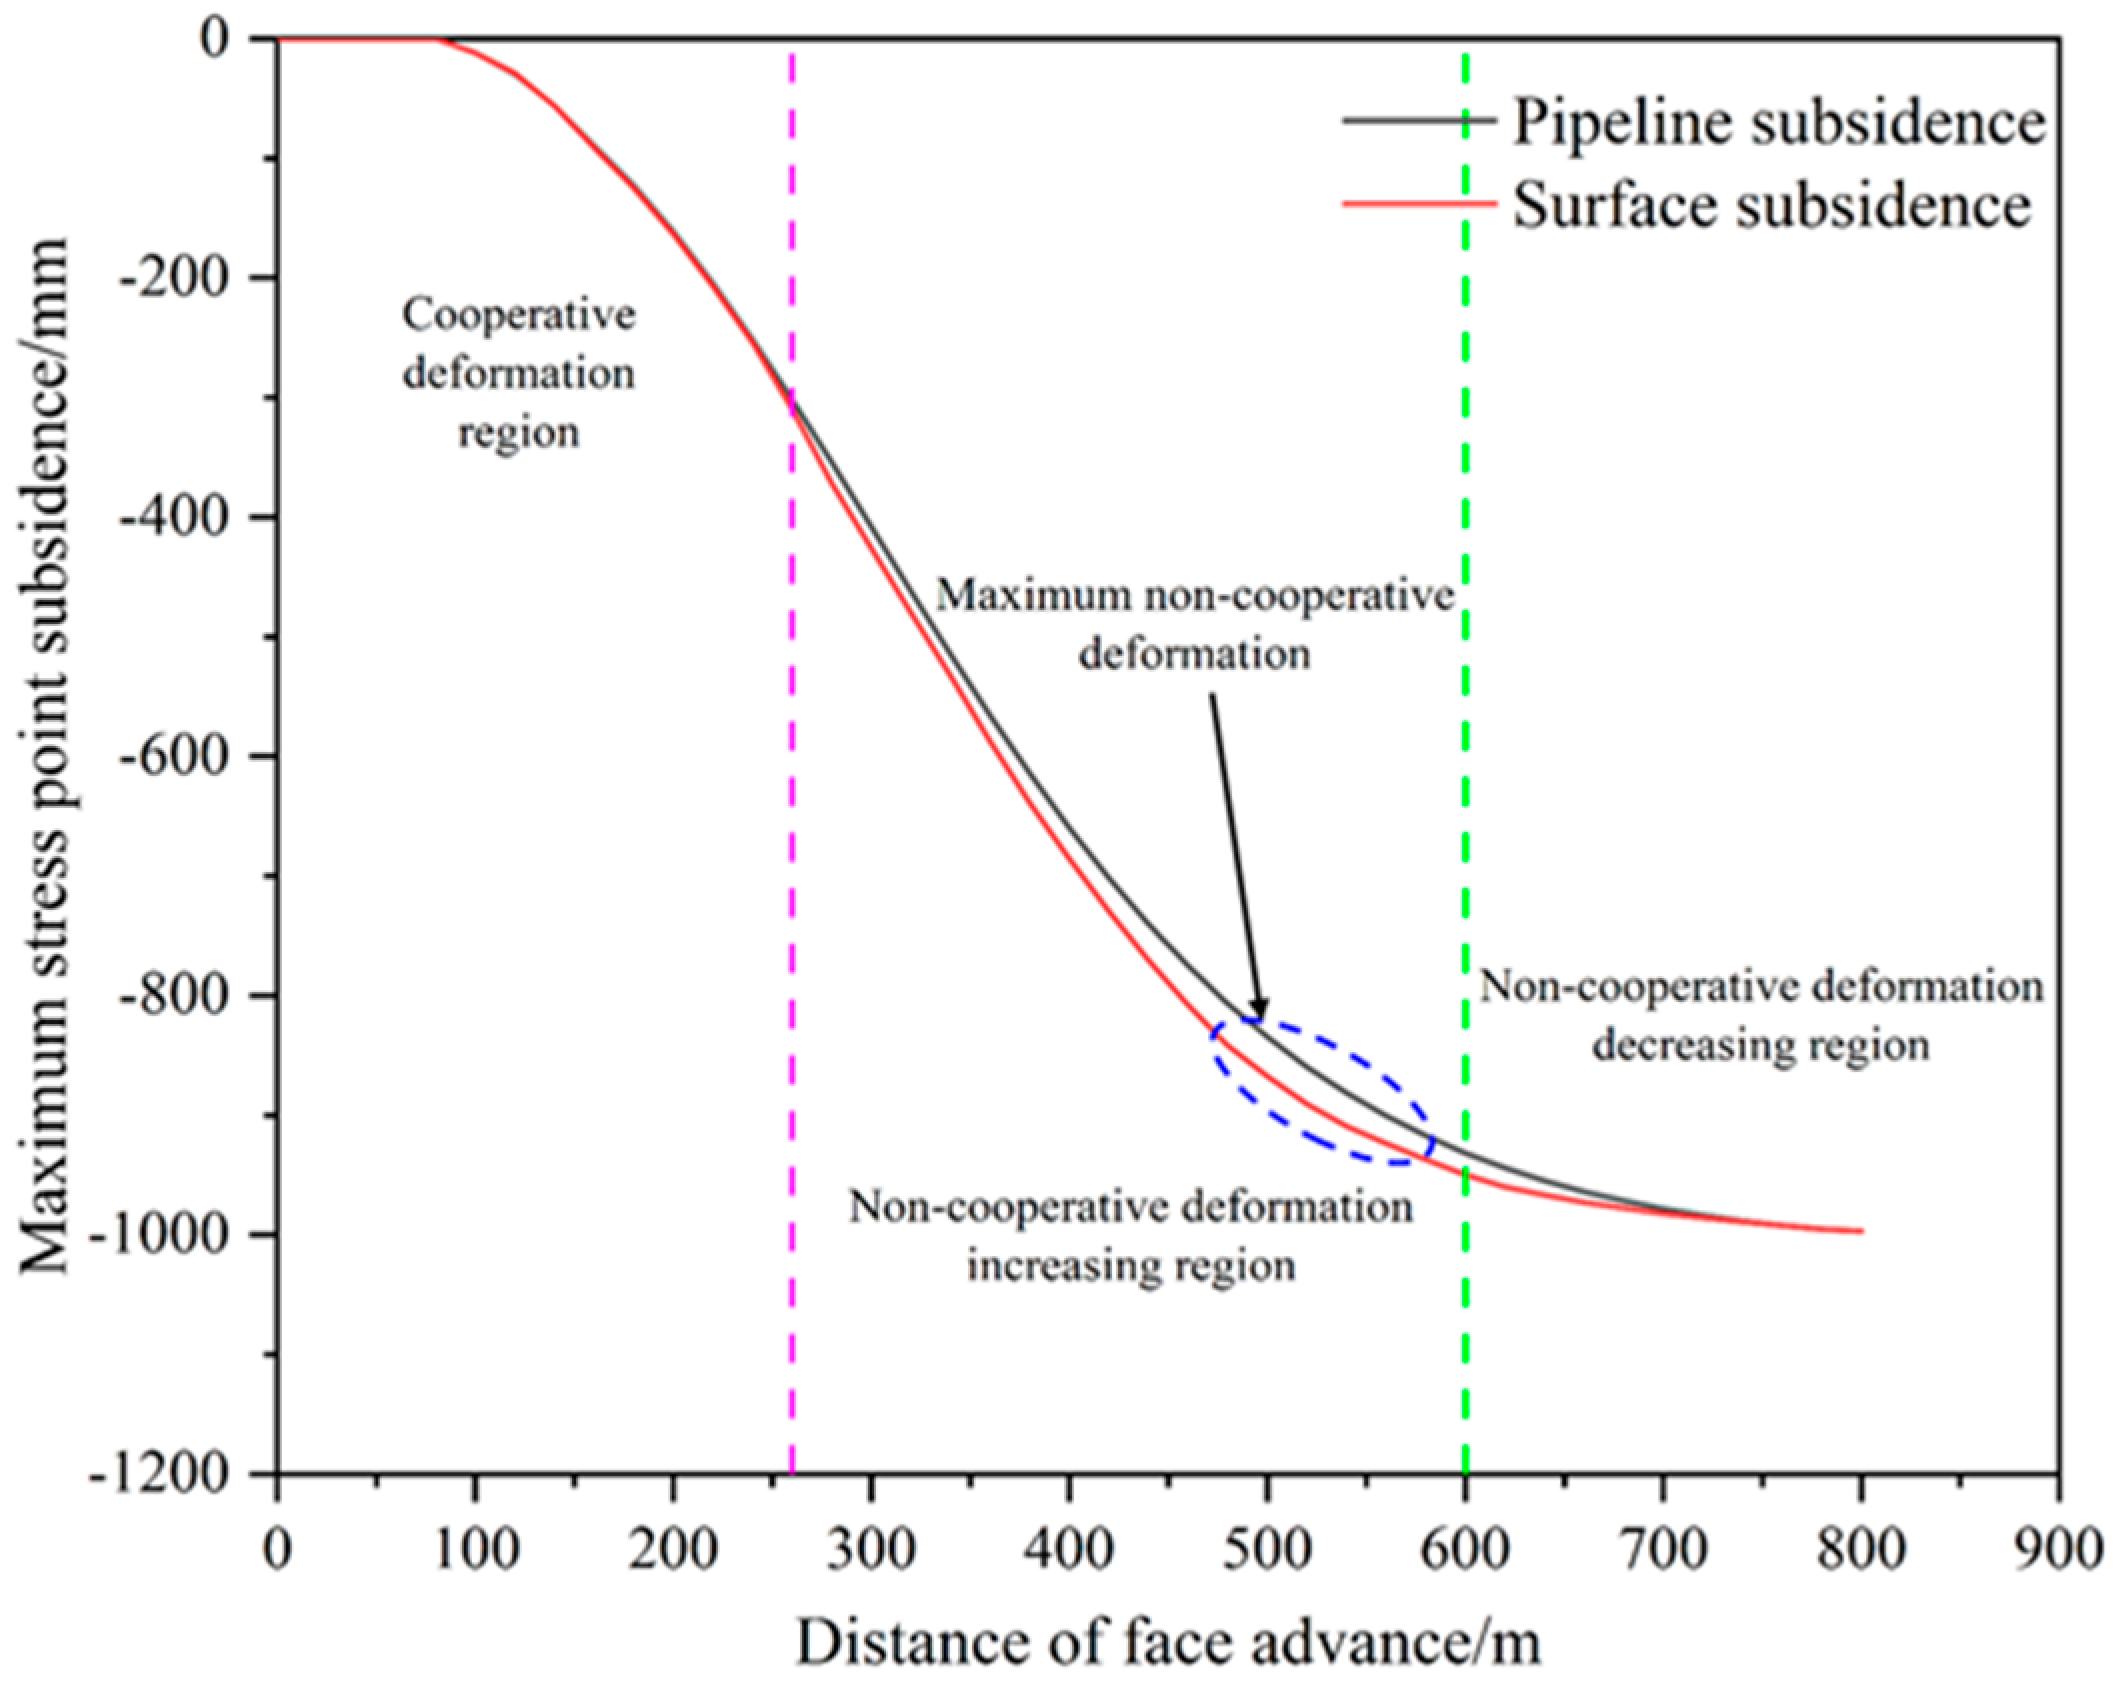
As can be seen from Figure 9, when the working face is mined back to 240 m the maximum subsidence of the pipe and the sand no longer correspond to each other, and the difference between the two gradually becomes larger with the increase of the working face advancing distance. The maximum subsidence displacement value of the pipe is always smaller than that of the sand, indicating that non-synergistic deformation between the pipe and the sand, and the larger the working face is mined back to the larger distance, the greater the degree of non-synergistic deformation between the pipe and the sand. During the mining cycle of the working face, the non-synergistic deformation between the pipe and the sandy soil is divided into two stages, which are the stage of increasing non-synergistic deformation and the stage of weakening non-synergistic deformation. Before the face is mined back to 400 m, the pipe-sand-soil is in the stage of increasing non-synergistic deformation because the modulus of elasticity of sand-soil is lower than the modulus of the elasticity of the pipe. With the advancement of the working face, the deformation rate of the pipe is lower than that of the sand-soil. Due to the direction along the working surface in the non-subsidence area or the edge of the subsidence area of the pipeline in the pipe, and the fact that the sand friction is not easy to move and in the subsidence area of the pipeline, length is a finite length, when the sand and soil subsidence occurs, the pipeline itself has the strength to resist the pipe above a certain range of sand and soil subsidence. In the process, the pipeline’s deformation is constantly approaching the elastic deformation limit of the pipe, and ultimately entered the yield stage of the pipe. When the working face mining distance is in the range of 400–800 m, the pipe and the sandy soil are in the stage of weakening the non-synergistic deformation, and the degree of non-synergistic deformation between the pipe and the sandy soil body is gradually reduced in this stage. This analysis occurred is because the pipe was subjected to a maximum Von Mises Stress of 554 MPa before this, which exceeded the maximum yield strength of 450 MPa that the pipe can carry, but did not reach the tensile strength of 655 MPa of the pipe. Pipeline steel is an elastic-plastic material, and after entering the yield stage, the rate of pipe deformation increased compared to the non-synergistic deformation increase phase. At this point, in addition to producing elastic deformation, some plastic deformation is also produced. As the pipe continues to settle under load during the subsidence of the overlying sand, when the pipe reaches its maximum tensile strength, the pipe will fracture in tension, resulting in a loss of integrity.
In order to analyze the subsidence evolution of the pipe and the sandy soil in the cross-section where the maximum stress point is located during the mining cycle, the subsidence displacement of the pipe body and the sandy soil at the bottom of the pipe at the location of the maximum Von Mises Stress during the mining period (180 m along the strike of the working face) is monitored during the simulation process. Figure 11 shows the subsidence evolution curve of the pipeline (180 m along the strike of the working face) and the sand-soil body at the bottom of the pipe during the working face mining. When the working face advances 120 m, the pipe-sand soil begins to show subsidence displacement, and before advancing to 260 m, the pipe and sand soil are in the stage of cooperative deformation. The settlement rate of the pipe is slow at the beginning of cooperative deformation and then accelerates as the working face advancement occurs. The working face back to the mining distance is in the range of 260–600 m, and the pipe-sand soil is in the stage of non-synergistic deformation increase due to the pipe elastic modulus being larger. The subsidence displacement of the pipe is smaller than the sand subsidence displacement, resulting in the separation between the pipe-sand soil. As the working face continues to move forward, the degree of non-synergistic deformation between the pipe-sand soil increases, and when the working face is mined back to 480–600 m, the difference in subsidence between the pipe-sand soil reaches the maximum. At this time, the pipe carries the maximum Von Mises Stress during the mining period. However, the surface subsidence at the location of the pipe’s maximum stress point begins to decrease gradually, indicating that the surface sand movement has gradually stabilized. When the working face continues to be mined back, the pipe-sand soil enters the stage of non-coordinated deformation weakening until the mining back to about 700 m, the pipe-sand soil contacts again, and the pipe settlement tends to a fixed value.
During the working face mining cycle, the pipe sand-soil interface experienced synergistic and non-synergistic deformation phases, and the pipe settlement rate showed an evolutionary process from slow to fast and then back to slow again. The analysis is because, prior to critical mining, the surface subsidence rate was faster due to high-intensity mining in the coal seam. However, the elastic modulus of the pipeline is larger, so the separation between the pipe, sand, and soil occurs. The pipeline in the deformation process gradually reached the limit of elastic deformation. With the advancement of the working face to reach critical mining, the monitoring position at the surface to reach a certain amount of subsidence no longer continues to settle. After the pipe enters the yield stage, the deformation is accelerated, and then the pipe will contact with the sand body at the bottom of the pipe again. Before the surface reaches critical mining, the subsidence rate of the pipe and sandy soil increases rapidly, and the pipe body is loaded by the overlying sandy soil body, which increases rapidly. Therefore, under the condition of the high-intensity mining of coal seam, it can be considered to reduce the daily advancing speed of the working face before the surface reaches critical mining to weaken the subsidence rate of the pipe and the sand and soil on the surface, which is more conducive to the maintenance of the integrity of the pipe body.

5.2. Pipeline Stress Analysis

The shallowly buried pipeline on the surface of the working face is made of a seamless steel pipe of steel grade 245N, which is a typical steel used for transporting oil and gas. According to the national standard of the People’s Republic of China GB/T 9711-2017 «petroleum and natural gas industries steel pipe for pipeline transportation systems» [32], the maximum yield strength of 245N steel is 450 MPa, and the maximum tensile strength is 655 MPa.
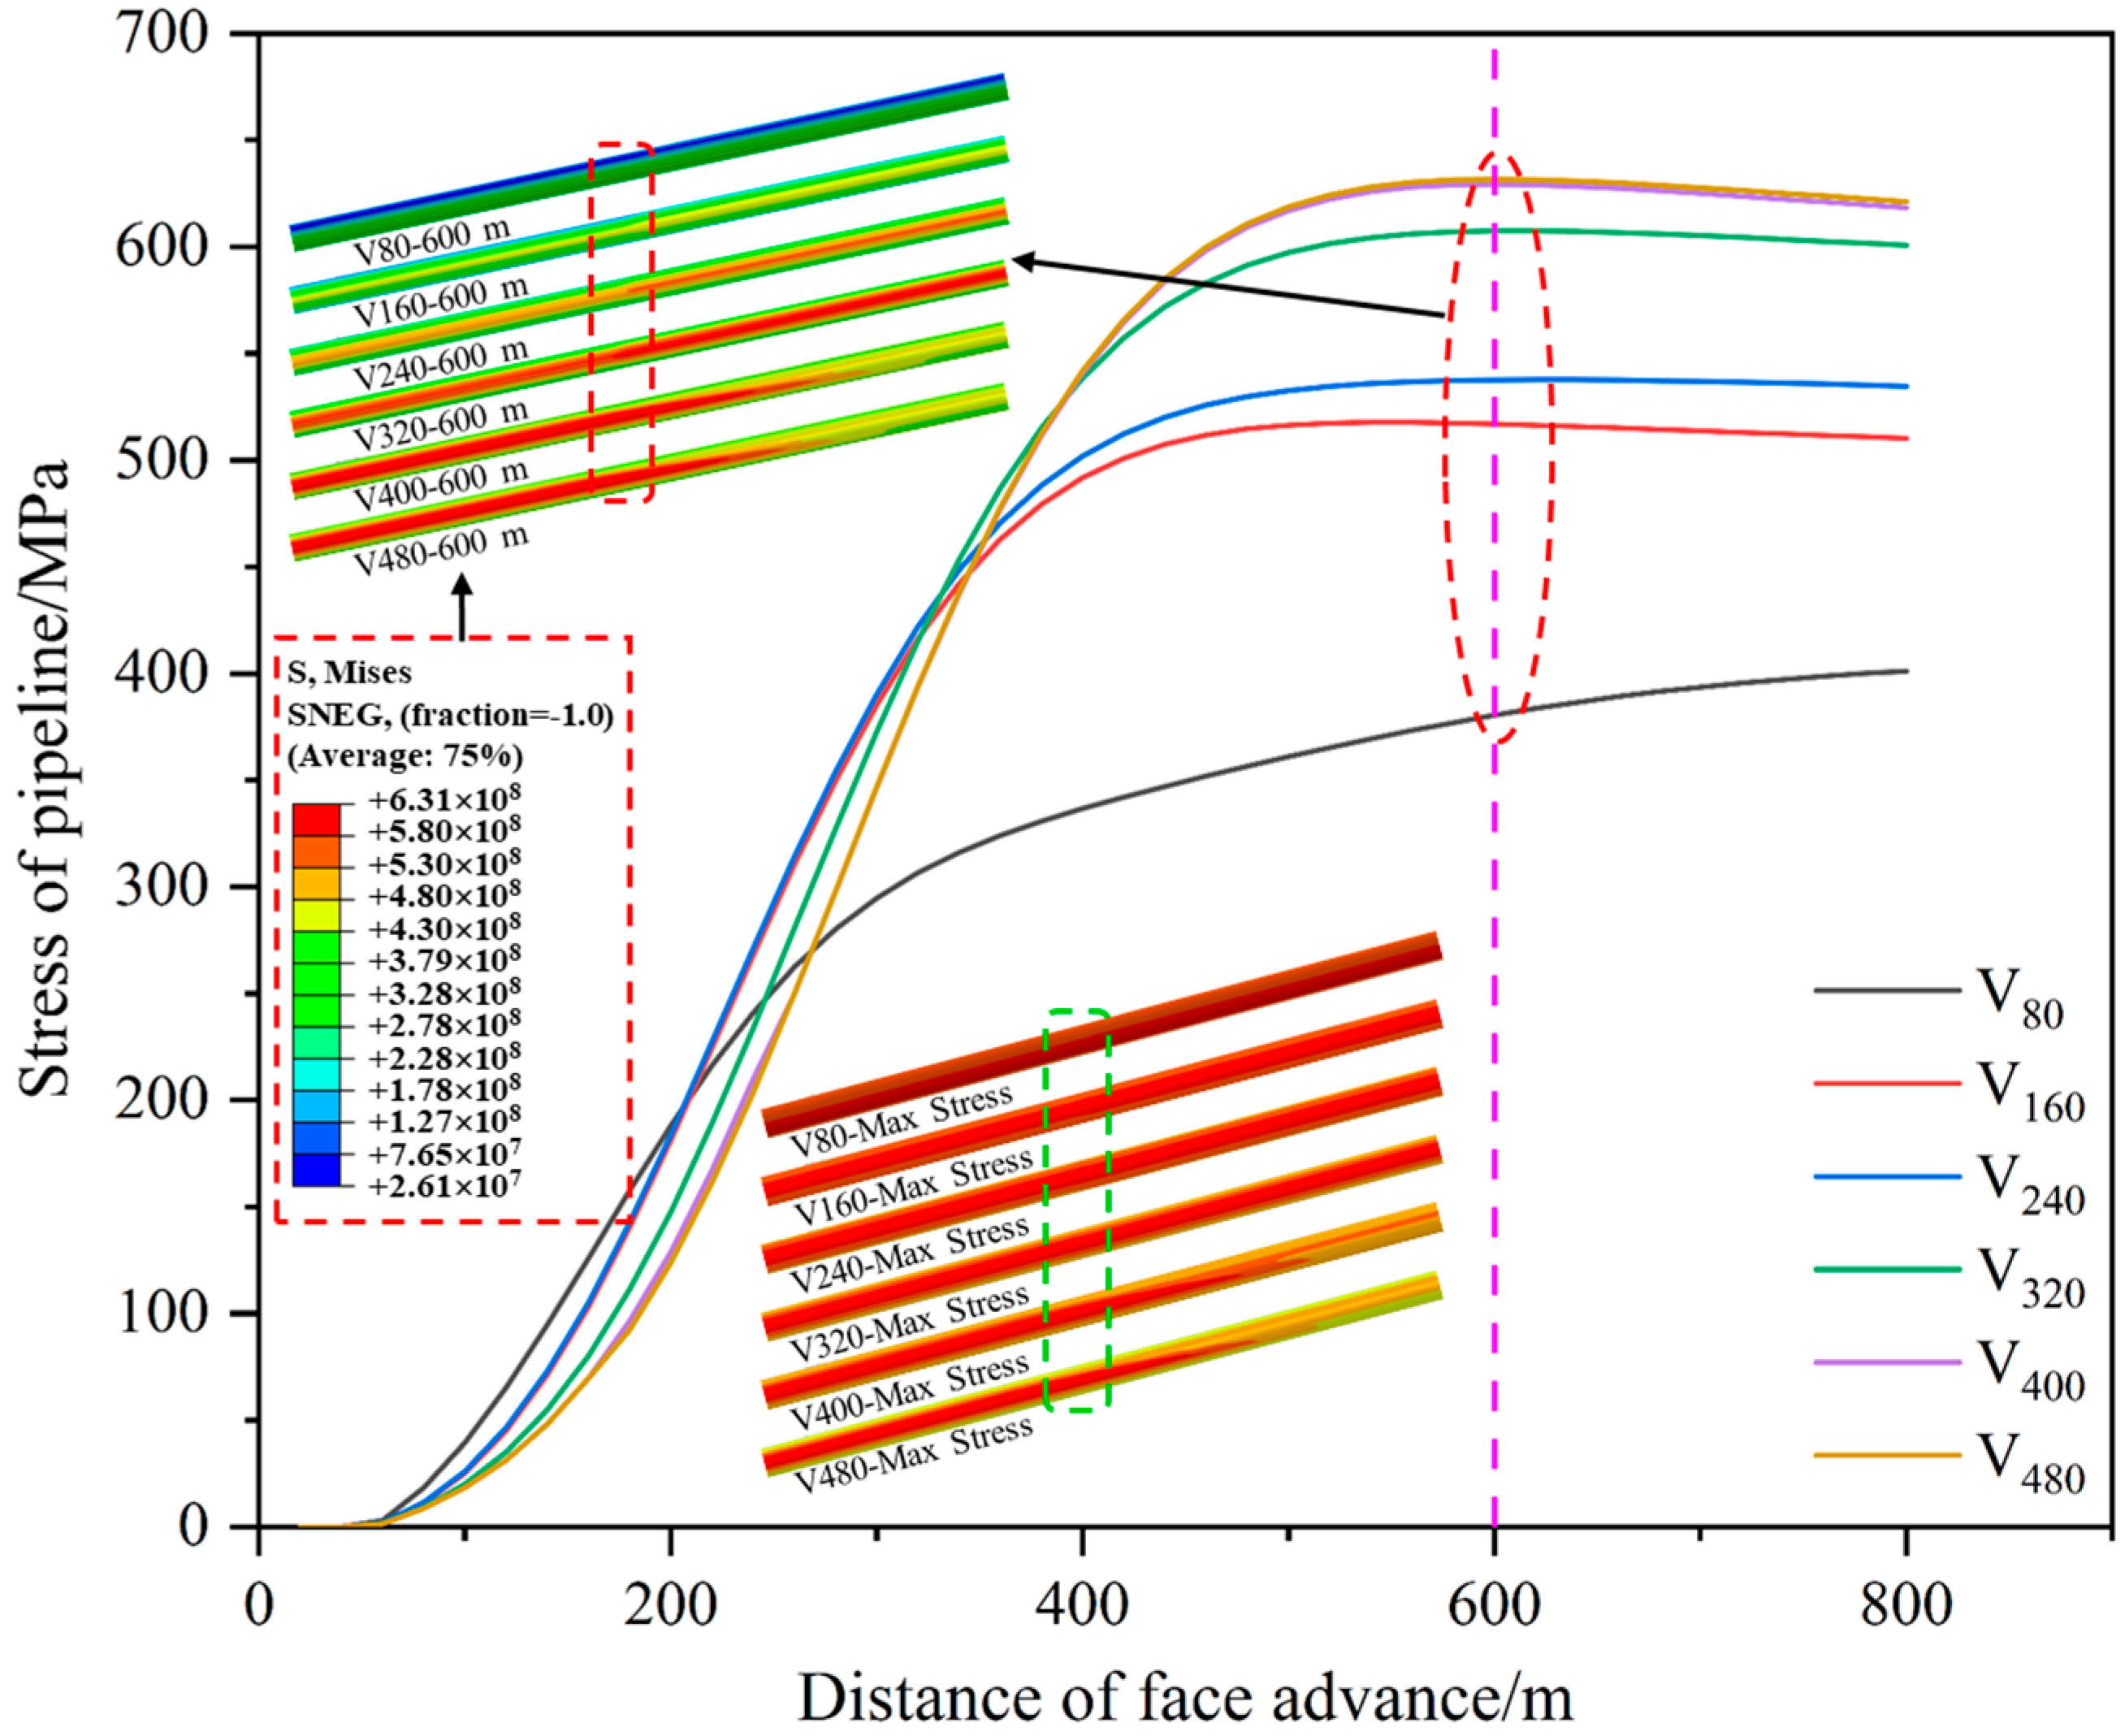
The evolution of Von Mises Stress during the mining cycle is a critical factor in evaluating whether the surface shallow buried pipeline in the mining subsidence area can maintain its integrity. In order to comprehensively analyze and grasp the evolution of pipeline stress in the mining subsidence area, the maximum Von Mises Stress on the pipeline—when the working face advances to 80 m, 160 m, 240 m, 320 m, 400 m, 480 m, 560 m, 640 m, 720 m, and 800 m—are selected as V80, V160, V240, V320, and V400, respectively, as well as V480, V560, V640, V720, and V800, and the evolution of the stresses at the above locations during the mining cycle is monitored. According to the spatial location relationship between the working face and the pipeline, the stresses at the locations where the working face advances to 0 m, 100 m, 200 m, 300 m, 400 m, and 500 m (outside the boundary of the air-mining zone) and intersections with the pipeline will be monitored respectively (hereinafter expressed in terms of the 0–500 m cross-section) in order to obtain the stress evolution law at different cross-sections along the axial direction of the pipe during the advancing process of the working face.
Figure 12 shows the stress evolution of the maximum Von Mises Stress location of the pipe under different advancement degrees of the working face during the mining cycle. The lower side of the figure depicts the initial position of extracting V80–V480, which is in the green box of the stress contour. The left side of the figure depicts when the working face advances to 600 m, the extracted stress contour and legend at position V80–V480 are in the red box. When the face is mined back to 480 m, the maximum stress on the pipe will no longer change. At this time, the location is 180 m from the setup entry and the pipe intersection, and the maximum stress occurs at the bottom of the pipe. It can be seen in the figure that when the working face advances to 60 m, there is no effect on the stresses on V80–V480. As the face advances to 300 m, the rate of stress increase at the V80 location begins to decrease, and as the face continues to advance, the rate of stress increase is very slow, with a maximum Von Mises stress of 401 MPa. V160–V480 reached the maximum stress when the working face advanced to about 600 m. Prior to that, the stress growth rate of V160–V480 went through the stage of slow-rapid-smooth decline, and the closer to the setup entry, the more the first to enter the stage of decline, and the maximum stress at each position during the mining cycle increased in order, respectively: 517 MPa, 537 MPa, 607 MPa, 629 MPa, and 631 MPa. As the workface continued to advance, the stresses on the pipe began to trend downward, although not significantly. The pipe experienced pipe-sand synergistic subsidence due to the stiffness of the pipe body being greater than the stiffness of the soil body. Also, carrying the top of the pipe sand continues to settle after the occurrence of the pipe-sand non-synergistic deformation, the bottom of the pipe loses the soil support, the pipeline is subjected to the change of the state of the stress, and the degree of the pipe body stress concentration is increased. When mining reaches a certain length, due to the flexible characteristics of the long-distance pipeline, the bottom of the pipe and the soil body gradually come into contact and begin to “recover” the stress state. The Von Mises Stress appears to decline due to the plastic deformation of most areas of the pipe body. Therefore, the stress “recovery” is minimal.
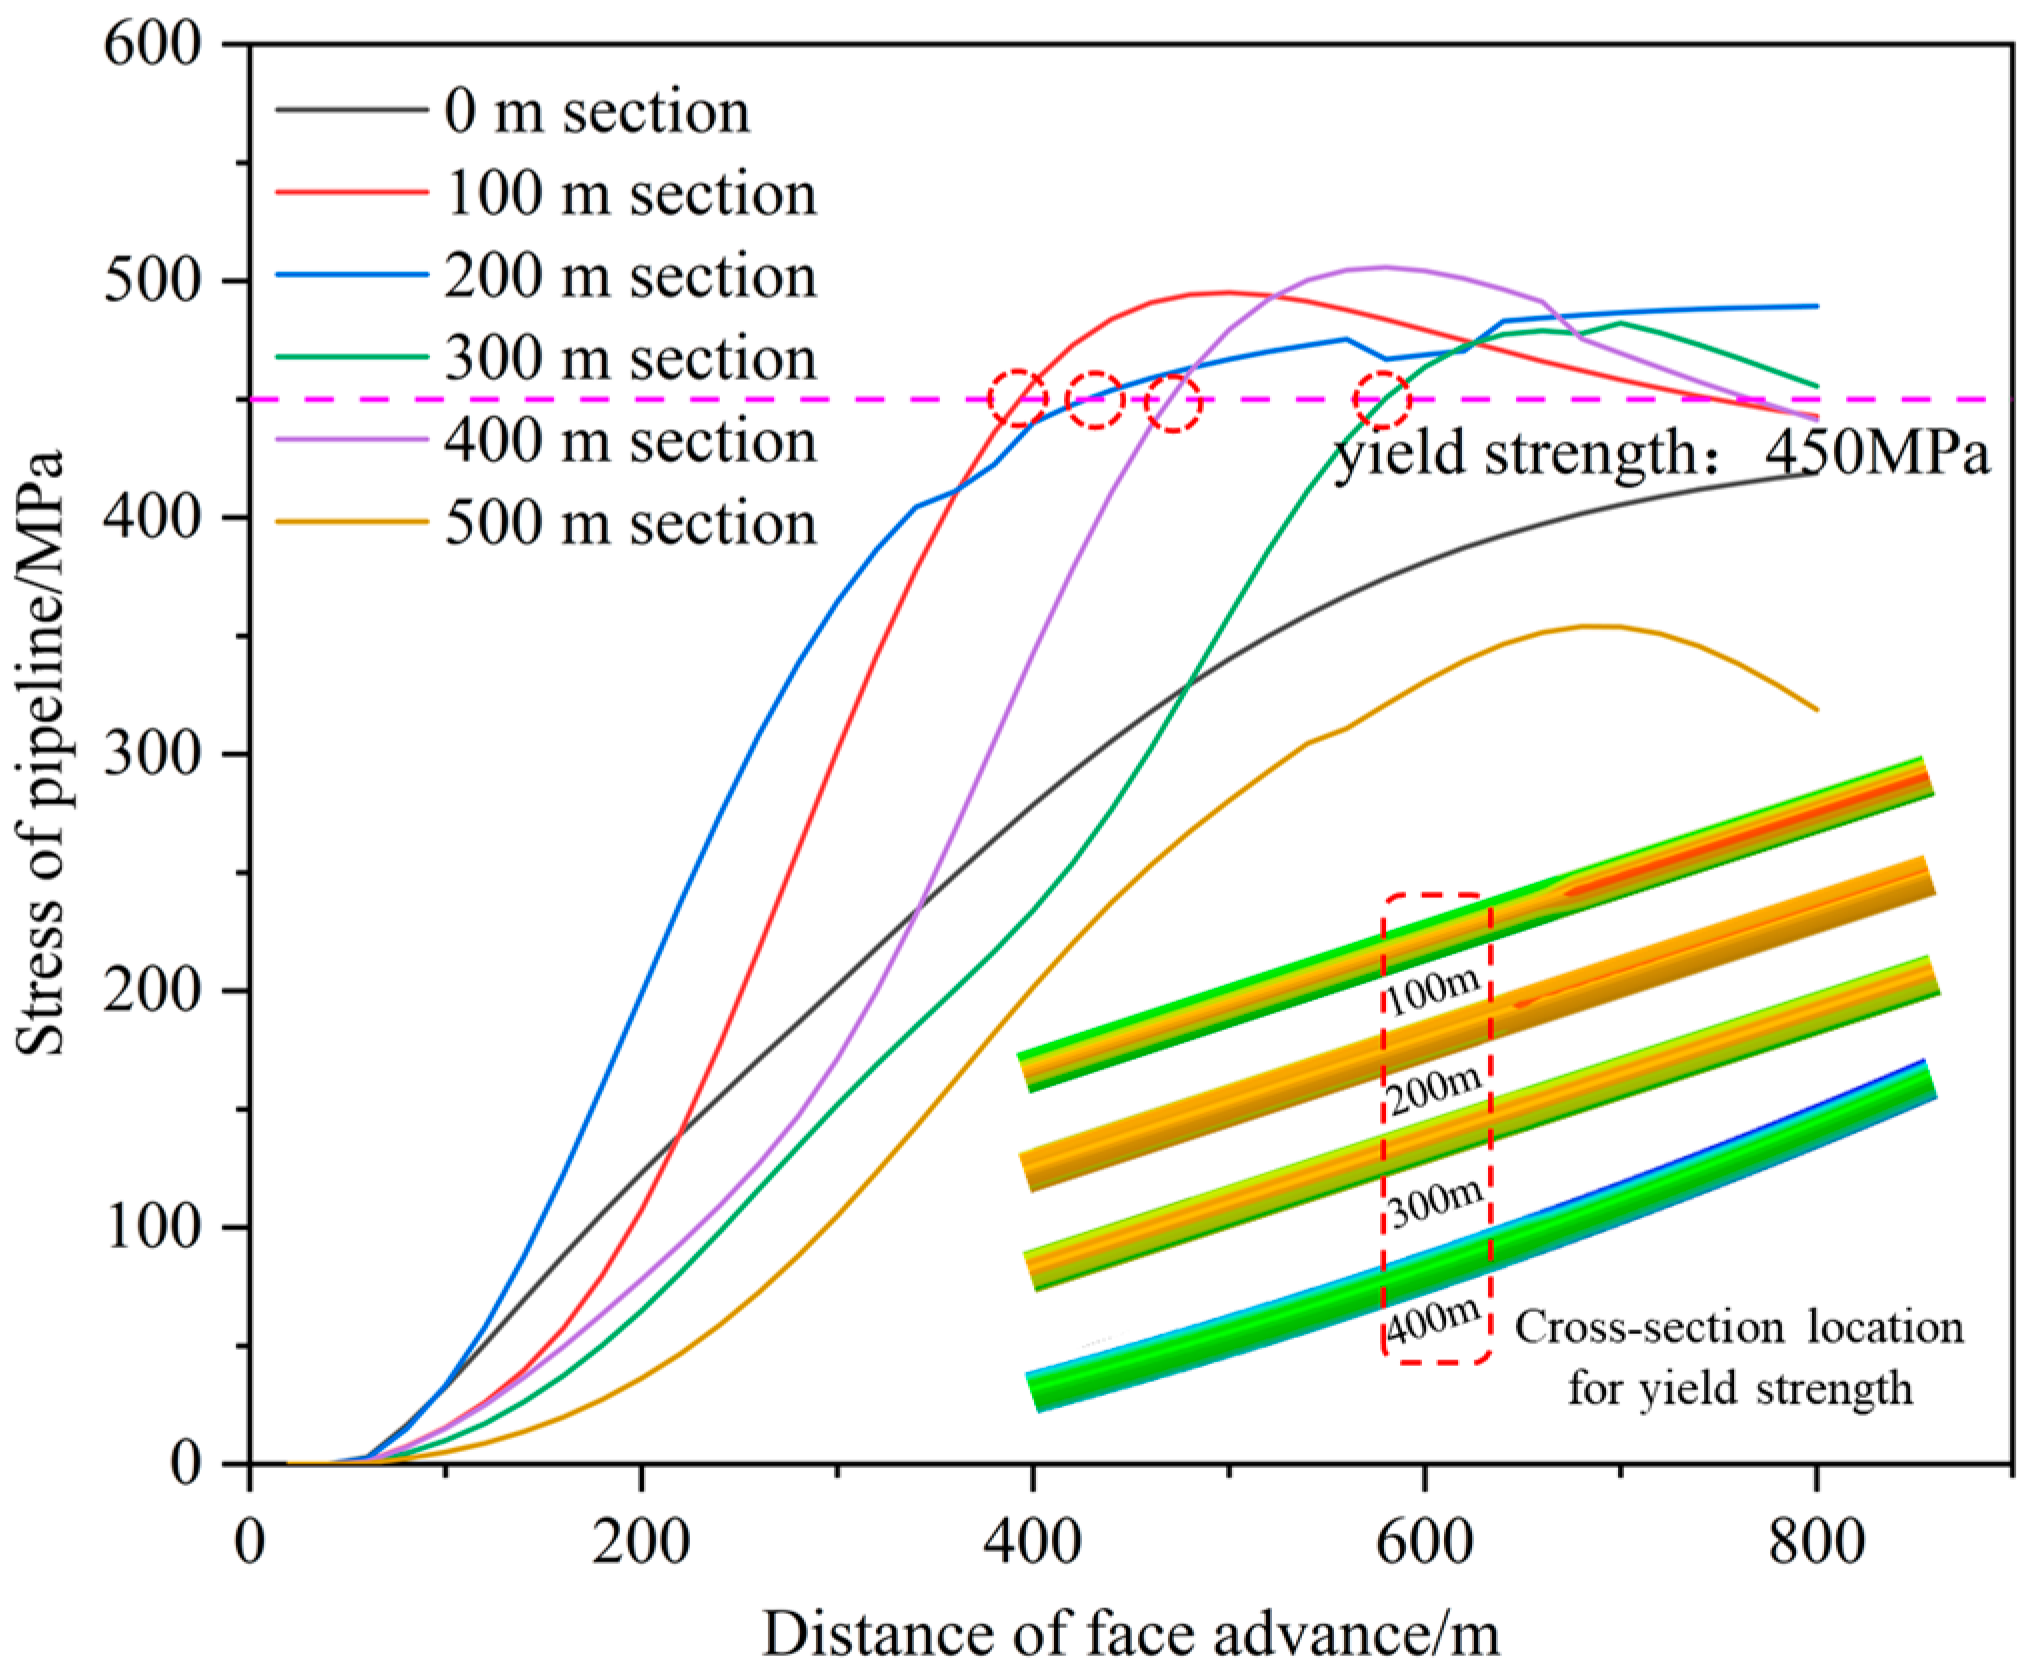
Figure 13 shows the Von Mises Stress evolution curves of different pipe sections during the mining cycle. When the working face advances to 380 m, 420 m, 580 m, and 460 m, the 100 m, 200 m, 300 m, and 400 m sections of the pipeline reach the yield strength, respectively. At this time, the stress contour of each section of the pipeline is shown on the lower-right side of the figure, and the extracted position of each cross-section is in the red box. The Von Mises Stress of each section remained virtually unchanged as the working face advanced to 60 m. The Von Mises Stress of the 0 m section (the location of the setup entry) and the 500 m section (the outside of the goaf) was smaller during the mining cycle, and neither reached the yield strength of the pipe. Before the working face advances to 500 m, the stress of the 100 m section is in the rising trend, and it is 495 MPa when it reaches the maximum stress value. The stress growth rate has experienced the stage of slow-rapid-smooth decrease, but the duration of the slow-growth stage is shorter. Similarly, the 300 m and 400 m sections experienced the same stress evolution during the mining cycle. However, the maximum Von Mises Stress was reached at different advancing distances of the working face, with maximum stresses of 482 MPa and 505 MPa reached when advancing to 700 m and 580 m, respectively. While the stress on the pipe at the 200 m section rises during the mining cycle, the rate of stress increase starts to level off when the face advances to 400 m.
When the 200 m and 300 m sections of the pipeline reach the maximum yield strength of the pipeline, the working surface advances about twice as much as the section position. The 400 m section is located at the corner of the pipeline, and when it reaches the maximum yield strength, the working surface advances 450 m. When the 100 m section reaches the maximum yield strength, the working surface advances 370 m, which is about four times as much as the section position. Von Mises Stress is still in the upward tendency when each section reaches the maximum yield strength. It shows that the pipeline linear section and non-linear section (corner) in the mining subsidence area are subjected to different loading laws, and the maximum yield strength of the pipeline is reached when the working face pushes through the corner of the pipeline for about 50 m. When the pipe section near the setup entry of the working face reaches the maximum yield strength, the working face pushes forward for a longer distance due to the initial stage of surface subsidence. The pipe is still in the elastic deformation limit, the pipe sand-soil is in the stage of synergistic deformation, and the stress grows more slowly.
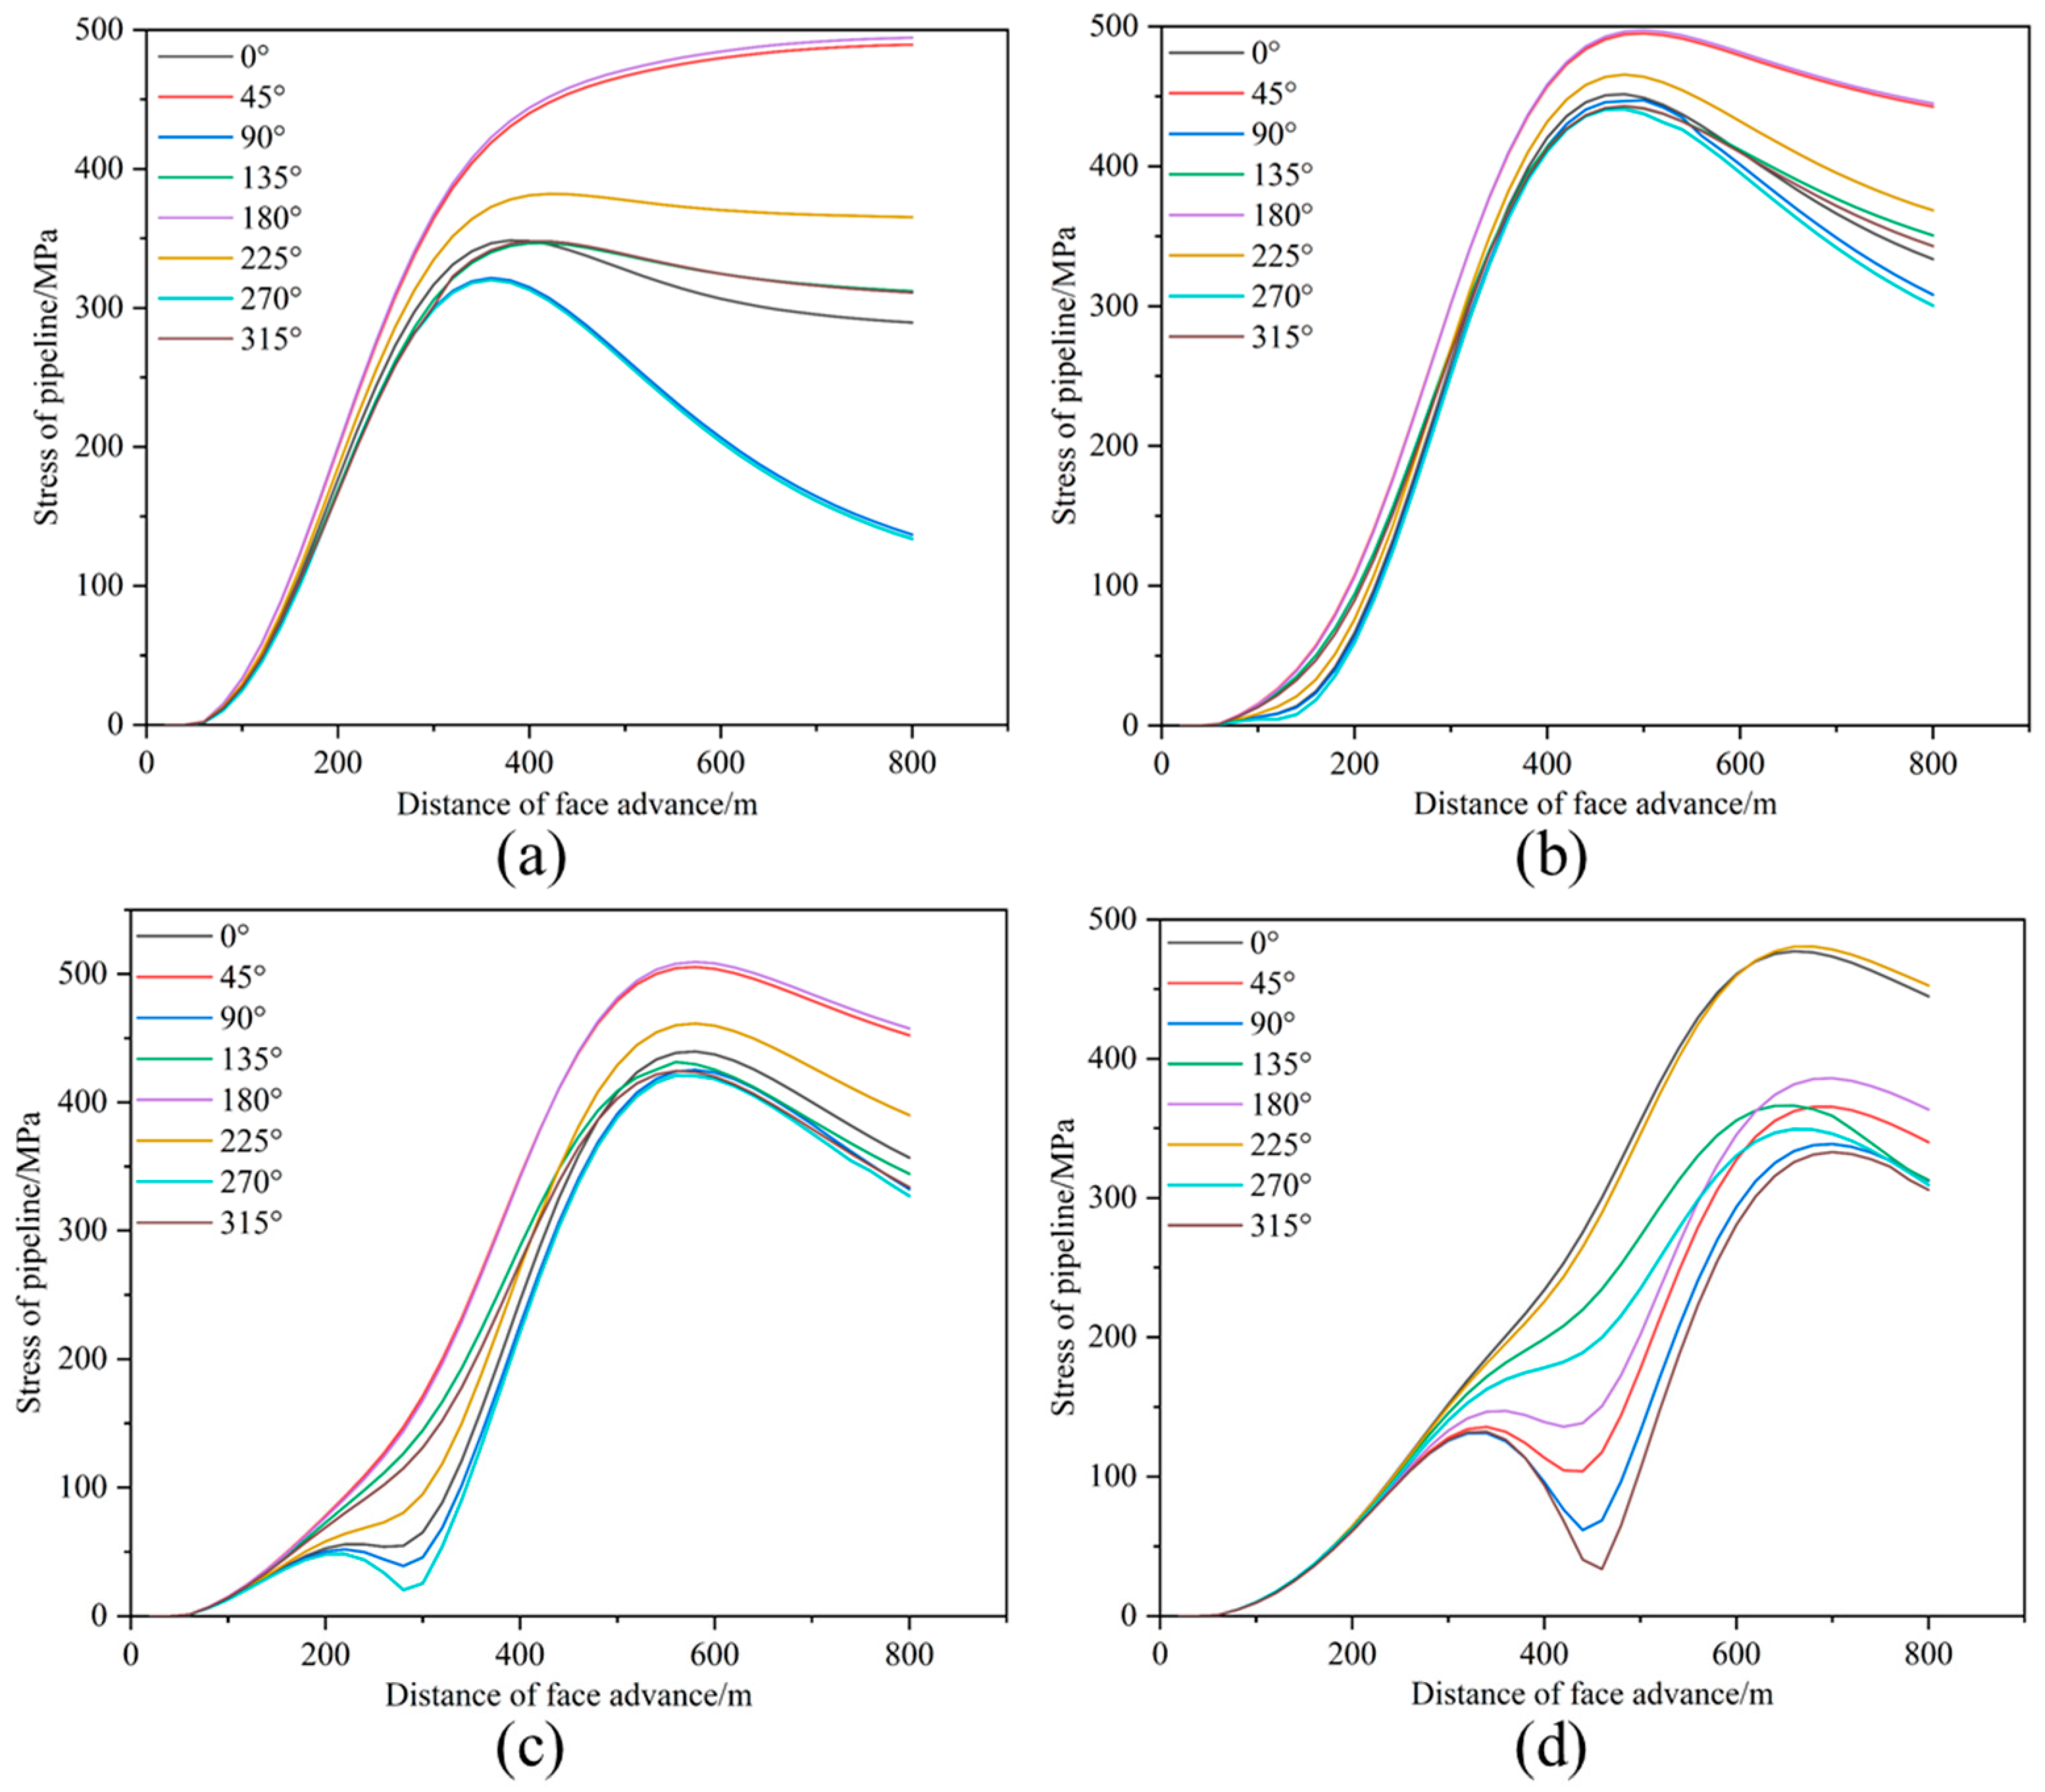
The 100 m, 200 m, 300 m, and 400 m sections of the pipeline are most prone to yield failure during the mining cycle (Figure 13). In order to clarify the orientation of the pipeline that is prone to yielding in the circumferential direction, the Von Mises Stress evolution data were extracted counterclockwise along the advancing direction of the working face for each section at 0°, 45°, 90°, 135°, 180°, 225°, 270°, and 315° during the recovery cycle (Figure 14). When the working face advances to 60 m, the mining subsidence does not reach the surface, and each pipeline cross-section is not disturbed by stress. With the advancement of the working face, each cross-section of the pipeline reaches the peak stress, and the positions of 180°, 45°, 225°, and 0° in the ring upwards are the most vulnerable to yield failure. When the peak stress is reached in different directions at the same degree of advancement, the working surface advancement distance at this time is about two times the location of the section taken. Peak stresses are reached in different orientations at the same degree of advancement: when the working face is advanced about twice as far as the location of the section taken. The peak stress on the pipe increases as the section of pipe taken gets closer to half the total length of the working face advance. The 400 m section is close to the boundary of the gob and is located at the corner of the pipeline. Its peak stress is reduced compared to that of the 300 m section, and the 400 m section is most prone to yield stresses in the orientations of 0° and 225°, which are different from the 180° and 45° of the 100 m, 200 m, and 300 m sections, which are most prone to yielding.
From the previous analysis, it is known that the pipe cross-section is most prone to yield failure in the orientation of 180°, 45°, 225°, and 0°. In order to further determine the different cross-sections of the same orientation of the yielding time sequence of the evolution of the law, the data extracted from Figure 14 will be sorted out and plotted in Figure 15. During the mining period, the time sequence of yielding in the 180° and 45° orientation of the pipe is 200 m, 100 m, and 300 m sections, while the peak stresses of 400 m section in the 180° and 45° orientation are 386 MPa and 365 MPa, which are 85.7% and 81% of the yield strength of the pipe, respectively. The time sequence of susceptibility to yielding at 225° orientation is in the order of 200 m, 300 m, and 400 m sections, and the time sequence of susceptibility to yielding at 0° orientation is in the order of 200 m and 400 m sections. The peak stresses of the 100 m section at 225° and 0° orientation are 382 MPa and 348 MPa, which are 84.8% and 77.3% of the yield strength of the pipeline, respectively. The peak stress of the 300 m section at 0° orientation is 439 MPa, which is 97.5% of the yield strength of the pipeline. At this level, it can be determined that it has already entered the yielding stage.

5.3. Deformation Analysis of Main Load Direction of Pipeline

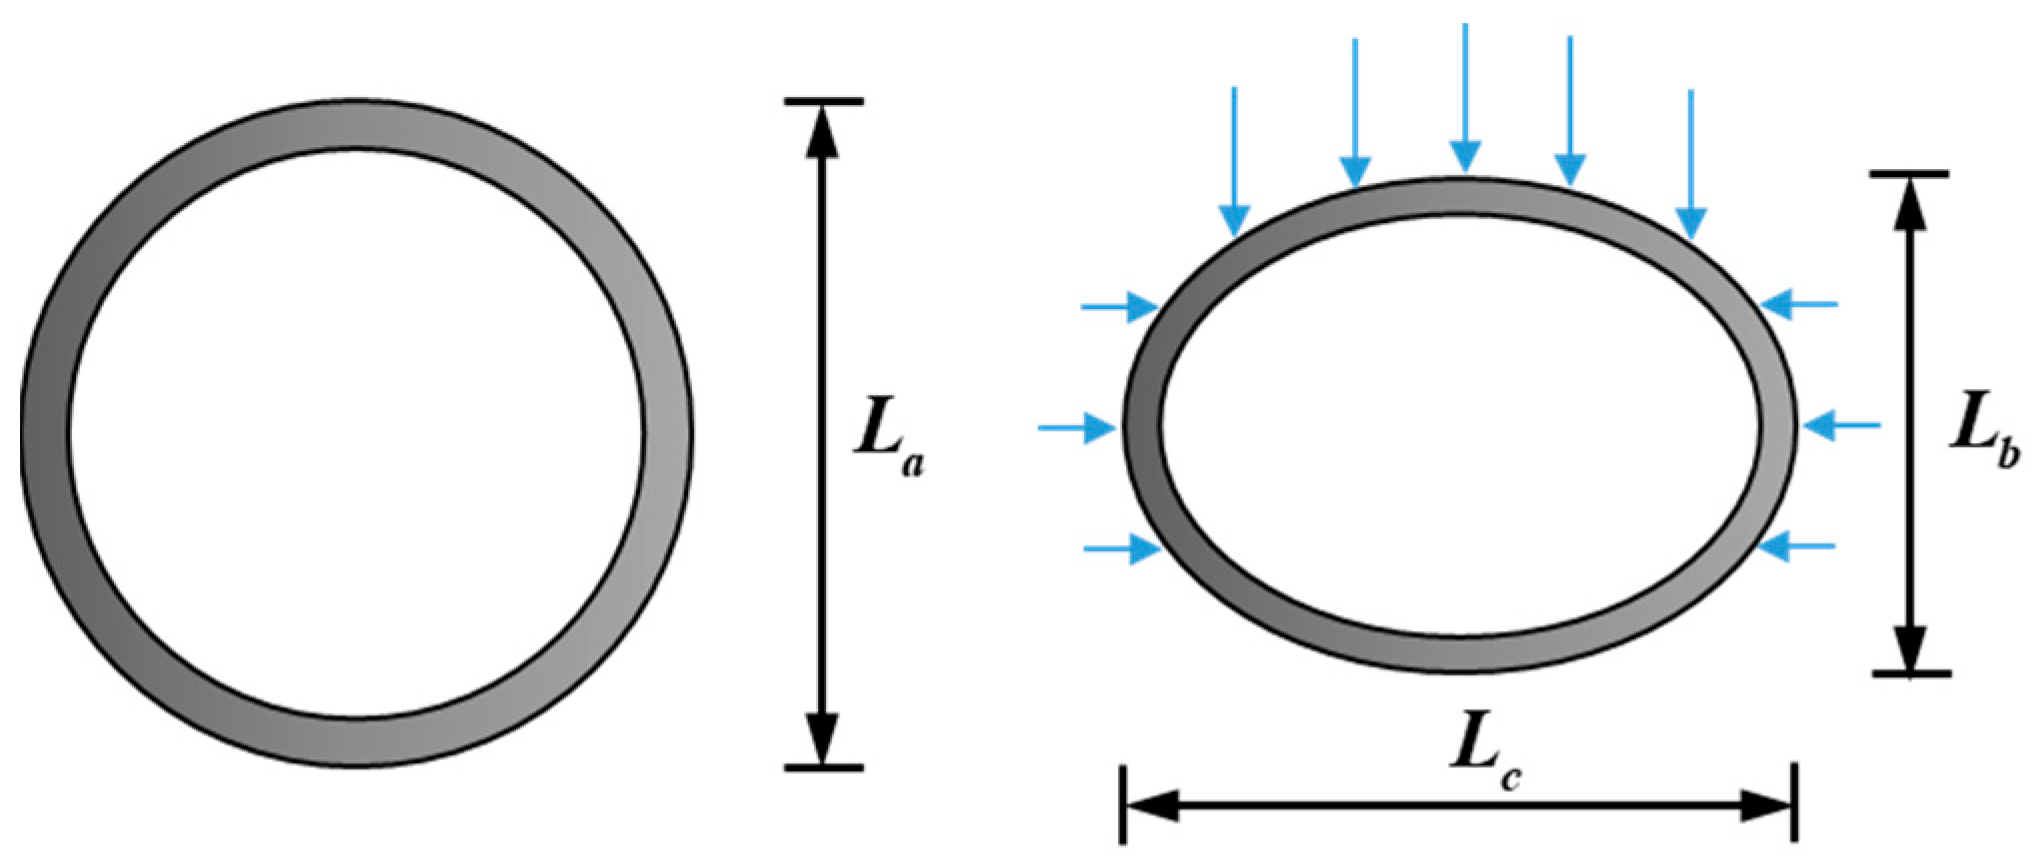
In order to characterize the deformation of the pipeline in the main loading direction during the mining cycle, the relative deformation rate of the pipeline cross-section is defined by introducing the important concept of engineering strain in the mechanics of materials for analysis. The vertical direction of the pipe in the mining subsidence area is the main loading direction, so the relative deformation rate defined in this paper reflects the degree of ovalization of the pipe in the vertical direction during the surface subsidence process, as shown in Figure 16.
η = ε Eng 100 % = L a L b L a 100 %
where η is the relative deformation rate of the pipe diameter; ε Eng is the engineering strain of the pipe; La/2 is the radius of the pipe before deformation, mm; Lb/2 is the short radius of the pipe after deformation along the vertical direction, mm; and Lc/2 is the long radius of the pipe after deformation along the horizontal direction, mm.
Since the true strain is obtained in post-processing in ABAQUS, in the elastic deformation stage, there is almost no difference between the engineering strain and the true strain of the pipe. After entering the plastic phase, based on the assumption of constant plastic deformation volume, engineering strain can be derived from true strain. Then, the relative deformation rate of the pipe cross-section is expressed. According to the relationship between engineering strain and true strain in the mechanics of materials:
ε T = ln 1 + ε E n g
ε E n g = e ε T 1
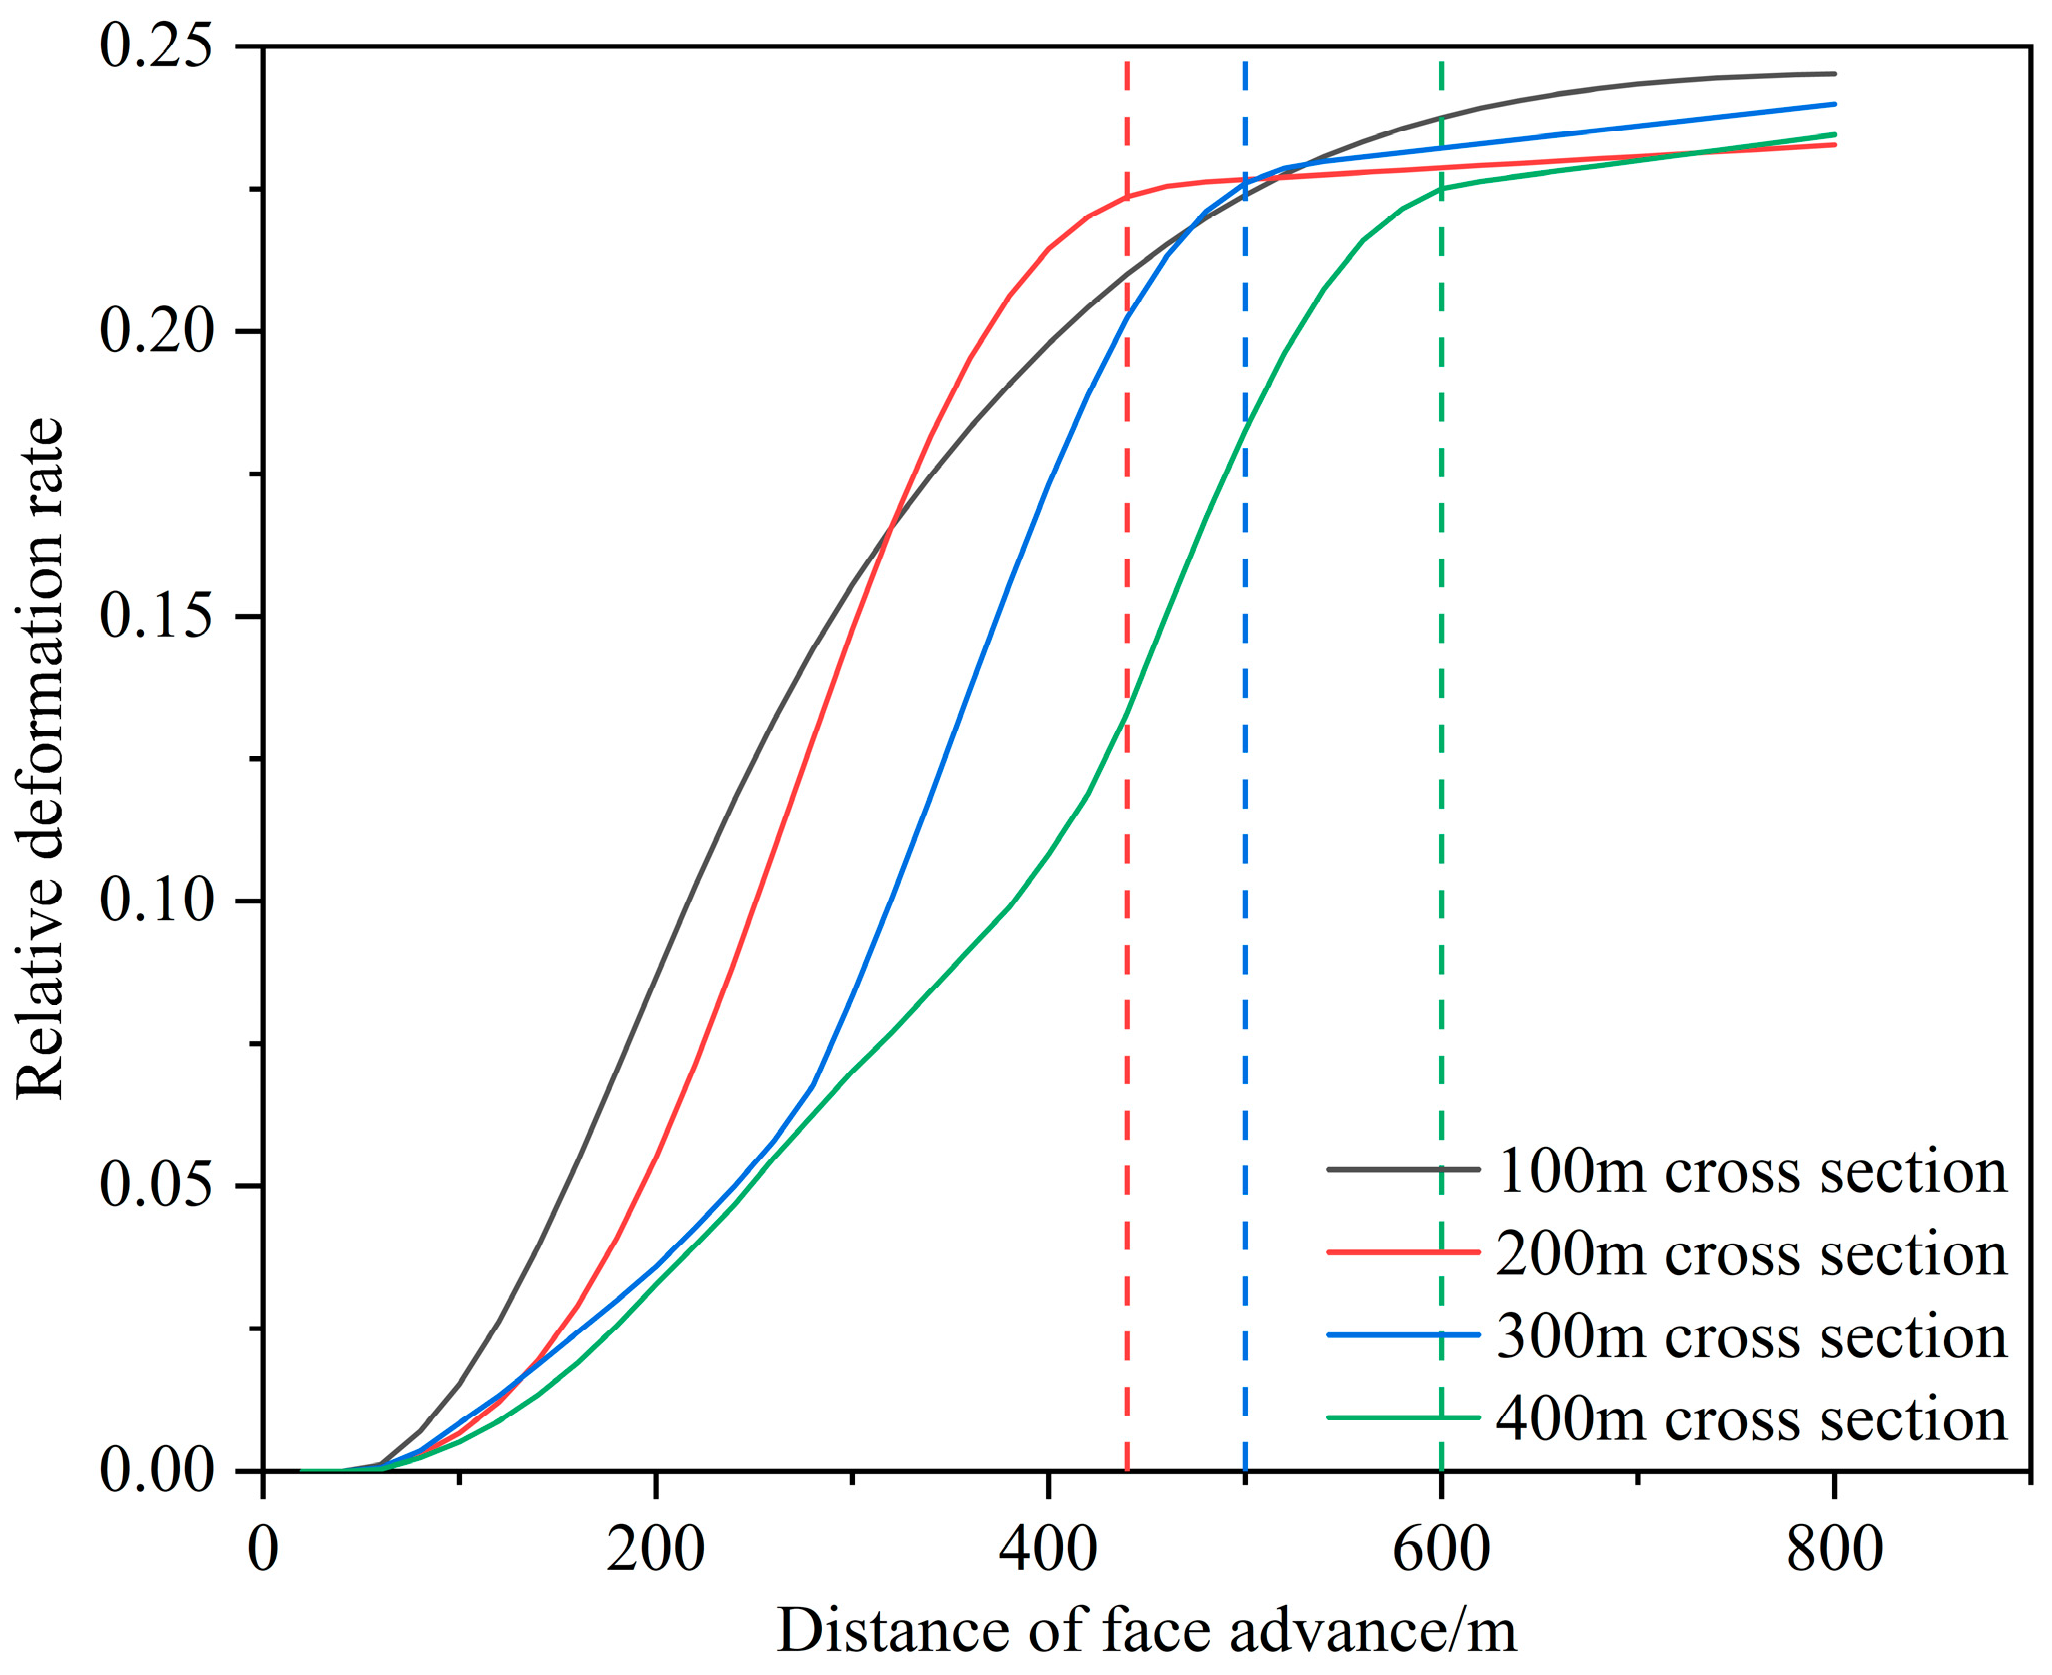
where ε T is the true strain of the pipe. From Equations (12) and (13) can be derived and brought into Equation (11), and the relative deformation rate of pipeline section can be obtained. It can be seen by the relative deformation rate that the larger the pipe is loaded under the ground subsidence, the smaller the diameter of the pipe along the direction of the load, the larger the relative deformation rate, and the larger the ovality of the pipe cross-section. Since the loading and deformation of the pipeline in the vertical direction are dominant during the surface subsidence process, the relative deformation rate of the pipeline cross-section in the vertical direction is mainly investigated. Figure 17 shows the evolution of the relative deformation rate of each pipeline cross-section with the advancement distance of the working surface. The relative deformation rate of each pipeline cross-section shows an increasing trend with the increase of the advancing length, indicating that, along with the expansion of the range of the surface movement basin, the overlying sand load is applied to the pipeline body so that the cross-section deformation gradually increases. The relative deformation rate of the pipeline cross-section in the direction of the loaded direction increases accordingly. Before the face advances to 60 m, the overburden collapse has not yet reached the surface and there is no obvious change in the relative deformation rate of the pipe cross-section. When the working face advances from 60 m to 440 m, 500 m, and 600 m, the relative deformation rate of 100 m, 200 m, 300 m, and 400 m sections of the pipeline undergoes a slow and rapid growth stage and finally tends to stabilize successively. This is due to the fact that when the coal seam is mined back a distance equal to 1/4–1/2 of the mining depth, the mining influence spreads to the surface, causing the surface to sink. As the working face continues to advance, the area of the goaf increases, the influence range of the ground surface continues to expand, the subsidence value increases, and the ground surface movement basin gradually expands. This means that the amplitude of the pipeline moving with the sand and soil becomes larger. In the process of surface movement, due to the pipeline impeding the movement of sand and soil body, the pipeline will carry the load applied in the direction of sand and soil movement and the relative deformation rate of the pipeline cross-section increases rapidly. When the size of the goaf increases to a certain degree, the surface movement basin of the goaf will not stop moving immediately but will continue for some time before stabilizing. At this time, the relative deformation rate of the pipeline cross-section begins to level off.

5.4. Discussion

In this paper, the numerical model is established through the field histogram. The mechanical property parameters of coal rock and pipeline are assigned according to the field conditions. The surface subsidence curve is obtained after critical mining along the working face strike. The maximum subsidence value is 1.54 m, which is 3.57% different from the field-measured value of 1.597 m, which verifies the accuracy of the numerical model and, at the same time, lays a foundation for the subsequent study of the spatial-temporal evolution law of the surface subsidence and pipeline, loaded and deformed. Zhou Min [33] and Li Haojie et al. [34] analyzed the pipe’s deformation characteristics under surface subsidence and the fact that the spatial distribution pattern of the pipe and the sand-soil body undergoing subsidence conform to the Gaussian curve. At the same time, due to the stiffness difference between the pipe and the sandy soil, the phenomenon of pipe-soil separation occurs, indicating the existence of coordinated and non-coordinated deformation between the pipe and the sandy soil body in the subsidence zone, which verifies the accuracy of the results in Section 5.1.
From our previous analyses, we found that the tube body is most susceptible to yield failure in the 180°, 45°, 225°, and 0° directions in the circumferential direction. Ren Jiandong [35] analyzed the case where the advancing direction of the working face is perpendicular to the axial direction of the pipe through numerical simulation and found that the pipe is most likely to be damaged in the interval of 330°–150° in the circumferential direction. Compared with the case in which the pipe axial direction is oblique to the working face studied in this paper, the difference lies in the 0° and 45° in the circumferential direction of the pipe body. It shows a difference in the angle between the working face advancement direction and the pipeline axial direction, which leads to a difference in the direction of the pipeline body in the circumferential direction most prone to damage.
The conclusions reached by the above scholars using methods such as theoretical analysis and numerical simulation are consistent with those of this paper, indicating that the results obtained from the further analysis of this paper based on previous studies are reliable.

6. Conclusions

(1) Based on elastic free theory, a theoretical model of safety prediction for surface gas pipelines in high-strength mining subsidence zones is established, and a safe placement method for pipelines to avoid the impact area of mining subsidence is proposed which can be used to predict the distance of the gas pipelines in the mining subsidence areas to reach the elasticity limit. In this paper, the pipeline length in the mining subsidence area is 900 m and the elastic deformation limit of the pipeline is 20.3 m. Combined with the different working conditions of the pipeline and the monitoring to obtain the surface subsidence curves in different areas, this method can provide a theoretical basis for the layout of the surface pipeline in the pre-planning stage of the coal-oil and gas co-mining area.
(2) During the mining cycle, after the working face has advanced by 240 m, non-coordinated deformation occurs between the pipeline and the sand. As the pipeline gradually reaches the elastic deformation limit and enters the plastic deformation process, before the working face advances 400 m, the pipeline and the sand are in the stage of increasing non-coordinated deformation. Within the range of 400 to 800 m of working face advancement, the pipeline and the sand are in the stage of decreasing non-coordinated deformation. The settling rate of the pipeline exhibits an evolutionary process of starting slow, becoming fast, and then slowing down again.
(3) The pipe stress experienced a slow-rapid-smooth decreasing stage with the advancement of the working face. When the working face advances to 480 m, it reaches the maximum stress value of 631 MPa. At this time, the maximum stress position of the pipe body is 180 m from the normal distance of the setup entry, and it will not be changed as the working face continues to advance. The stresses of 0 m and 500 m pipeline sections outside the setup entry and the boundary of the goaf do not reach the maximum yield strength, which is 418 MPa and 354 MPa, respectively. The stresses of the straight section and corner position (non-straight section) of the pipeline section in the inner part of the goaf go into the yielding stage. The maximum stresses of the straight section reach 495 MPa, and the maximum stress in the pipe section at the corner position is 505 MPa.
(4) Straight sections of pipeline within the goaf, in the circumferential direction, 180°, 45°, 225°, and 0° are the most vulnerable to yield failure orientation. In the non-straight section corners, the peak stress is generated in the orientation of 0 ° and 225 °. Peak stresses are reached in different orientations at the same degree of advancement when the working face advancement distance is about two times the position of the section taken. Different sections in the same orientation enter the yielding stage in turn, but no yielding occurs at 225° and 0° for the 100 m section of the pipeline, and at 180° and 45° for the 400 m section.
(5) In the mining cycle, with the advancement of the working face, the ground surface in the process of subcritical mining, critical mining, and supercritical mining, the relative deformation rate of each cross-section of the pipeline with the increase in the amount of ground subsidence and increase, and both went through a slow and rapid growth stage and finally in the back to the length of the mining is about 1.5 to 2 times the position of the cross-section, the successive convergence of the leveling off.

Author Contributions

S.L., Y.X., B.Y. and X.L. conceived and designed the numerical simulation scheme; Y.X. and S.L. collected field data; Y.X. and Z.S. performed the numerical simulation; S.L., B.Y. and X.L. helped Y.X. revised the manuscript; C.W., M.Y. and J.S. helped Y.X. analyze the data; Y.X. wrote the paper; Y.M. and P.X. assisted Y.X. in collecting site data and mapping. All authors have read and agreed to the published version of the manuscript.

Funding

Financial support for this work was provided by the National Natural Science Foundation of China (No. 52174139).

Data Availability Statement

Data are contained within the article.

Conflicts of Interest

Authors Xu Liang, Biao Yang, Pei Xu and Yindou Ma were employed by the company Shaanxi Xiaobaodang Mining Corporation Limited. Author Miao Yang was employed by the company Shenhua Xinjie Energy Company Limited. The remaining authors declare that the research was conducted in the absence of any commercial or financial relationships that could be construed as a potential conflict of interest.

References

  1. Yuan, L. Scientific problem and countermeasure for precision mining of coal and associated resources. J. China Coal Soc. 2019, 44, 1–9. [Google Scholar]
  2. Yuan, L.; Zhang, T.; Zhao, Y.X.; Ren, B.; Hao, X.J.; Xu, J. Precise coordinated mining of coal and associated resources: A case of environmental coordinated mining of coal and associated rare metal in Ordos basin. J. China Univ. Min. Technol. 2017, 46, 449–459. [Google Scholar]
  3. Wang, T.; Sun, J.; Lin, Z.Y.; Fang, H.M.; Wang, Y.; Liu, Y.F. Coordinated Exploration Model and its Application to Coal and Coal-associated Deposits in Coal Basins of China. Acta Geol. Sin. Engl. Ed. 2021, 95, 1346–1356. [Google Scholar] [CrossRef]
  4. Hao, D.Y.; Zhang, T.; Yang, Y.B.; Ren, J.M. Study on the disturbance characteristics and control strategies of coordinated exploitation of superimposed resources of coal and oil-type gas in Ordos Basin. Energy Sci. Eng. 2023, 11, 3964–3978. [Google Scholar] [CrossRef]
  5. Liang, S.; Elsworth, D.; Li, X.H.; Fu, X.H.; Yang, D.; Yao, Q.L.; Wang, Y. Dynamic impacts on the survivability of shale gas wells piercing longwall panels. J. Nat. Gas Sci. Eng. 2015, 26, 1130–1147. [Google Scholar] [CrossRef]
  6. Liang, S.; Elsworth, D.; Li, X.H.; Fu, X.H.; Sun, B.Y.; Yao, Q.L. Key strata characteristics controlling the integrity of deep wells in longwall mining areas. Int. J. Coal Geol. 2017, 172, 31–42. [Google Scholar] [CrossRef]
  7. Liang, S.; Elsworth, D.; Fu, X.H.; Li, X.H.; Yao, Q.L. Influence of Stratigraphic Conditions on the Deformation Characteristics of Oil/Gas Wells Piercing Longwall Pillars and Mining Optimization. Energies 2017, 10, 775. [Google Scholar] [CrossRef]
  8. Liang, S.; Elsworth, D.; Li, X.H.; Yang, D. Topographic influence on stability for gas wells penetrating longwall mining areas. Int. J. Coal Geol. 2014, 132, 23–36. [Google Scholar] [CrossRef]
  9. Fu, D.X.; Deng, B.; Yang, M.H.; Zhen, B.B. Analytical solution of overlying pipe deformation caused by tunnel excavation based on Pasternak foundation model. Sci. Rep. 2023, 13, 921. [Google Scholar] [CrossRef]
  10. Liu, M.; Ortega, R. Assessment of Impact to Buried Pipelines due to Tunneling-Induced Settlement. J. Pipeline Syst. Eng. Pract. 2023, 14, 04023020. [Google Scholar] [CrossRef]
  11. Chen, F.Q.; Fang, S.Q.; Lin, L.B. Mechanical Analyses of Underground Pipelines Subjected to Ground Subsidence Considering Soil-Arching Effect. J. Pipeline Syst. Eng. Pract. 2023, 14, 04022076. [Google Scholar] [CrossRef]
  12. Jiang, Q.; Guo, G.L.; Li, H.Z.; Wei, T.; Yuan, Y.F.; Jiang, C.M. Investigation of coordinated development of coal mining and pipeline protection under boundary effect of thick unconsolidated layer. Bull. Eng. Geol. Environ. 2022, 81, 136. [Google Scholar] [CrossRef]
  13. Ma, W.J.; Wang, B.L.; Wang, X.; Zhou, S.H.; Wang, B.L. Soil Layer Disturbance Caused by Pipe Jacking: Measurement and Simulation of a Case Study. Ksce J. Civ. Eng. 2021, 25, 1467–1478. [Google Scholar] [CrossRef]
  14. Orynyak, I.; Yaskovets, Z.; Mazuryk, R. Novel Numerical Approach to Analysis of Axial Stress Accumulation in Pipelines Subjected to Mine Subsidence. J. Pipeline Syst. Eng. Pract. 2019, 10, 04019026. [Google Scholar] [CrossRef]
  15. Oswell, J.M.; Hart, J.; Zulfiqar, N. Effect of Geotechnical Parameter Variability on Soil-Pipeline Interaction. J. Pipeline Syst. Eng. Pract. 2019, 10, 04019028. [Google Scholar] [CrossRef]
  16. Wu, Y.; You, X.; Zha, S.X. Mechanical behavior analysis of buried polyethylene pipe under land subsidence. Eng. Fail. Anal. 2020, 108, 104351. [Google Scholar] [CrossRef]
  17. Zhang, J.; Liang, Z.; Han, C.J. Numerical Modeling of Mechanical Behavior for Buried Steel Pipelines Crossing Subsidence Strata. PLoS ONE 2015, 10, e0130459. [Google Scholar] [CrossRef]
  18. Zhang, J.; Xie, R. Numerical Analysis of Mechanical Behavior of Buried Pipes in Subsidence Area Caused by Underground Mining. J. Press. Vessel. Technol. Trans. Asme 2019, 141, 021703. [Google Scholar] [CrossRef]
  19. Zhang, J.; Xie, R. Mechanical behavior analysis of suspended pipelines caused by ground subsidence. J. Pipeline Syst. Eng. Pract. 2021, 12, 04021030. [Google Scholar] [CrossRef]
  20. Gu, W.B.; Wu, K.; Tong, L.Y.; Liu, S.Y. Study of Deflection of Buried HDPE Corrugated Pipeline under the Uneven Settlement of Soil. KSCE J. Civ. Eng. 2021, 26, 221–235. [Google Scholar] [CrossRef]
  21. Zhang, Y.; Hou, S.H.; Lin, L.; Lou, Y.H.; Zhou, Y. Experimental study on the mechanical behavior of buried steel pipeline subjected to the local subsidence. Int. J. Press. Vessel. Pip. 2023, 206, 105037. [Google Scholar] [CrossRef]
  22. Wang, W.; Ren, J.D.; Wang, F.B.; Dong, M.; Luo, Y.; Miao, C.G. Study on the Mining Mode of “Gas Corridor” in Erdos Basin. Met. Mine 2019, 10, 23–31. [Google Scholar]
  23. Ren, J.D.; Zhao, Y.X.; Sun, Z.B.; Wang, W.; Liu, S.M. Investigation on protective coal pillar optimization and multi-parameter evolution characteristics of buried pipeline in gas-coal superposition area. Rock Soil Mech. 2023, 44, 2679–2695. [Google Scholar]
  24. Song, Y.X.; Peng, J.B.; Wang, Z.J.; Li, X.; Zhao, X.K. Test study on mechanical characteristics of aeolian sand in MU US Desert. J. Eng. Geol. 2010, 18, 894–899. [Google Scholar]
  25. Guo, W.B.; Zhao, G.B.; Lou, G.Z.; Wang, S.R. Height of fractured zone inside overlying strata under high-intensity mining in China. Int. J. Min. Sci. Technol. 2019, 29, 45–49. [Google Scholar] [CrossRef]
  26. Guo, W.B.; Zhao, G.B.; Lou, G.Z.; Wang, S.R. A New Method of Predicting the Height of the Fractured Water-Conducting Zone Due to High-Intensity Longwall Coal Mining in China. Rock Mech. Rock Eng. 2019, 52, 2789–2802. [Google Scholar] [CrossRef]
  27. SY/T 0330-2004; Recommend Practice for Movement of in-Service Pipeline. Petroleum Industry Press: Beijing, China, 2004.
  28. Ren, J.D.; Zhao, Y.X.; Wang, W.; Guo, J.H.; Sun, Z.B.; Liu, S.M. Optimal Design of a Protective Coal Pillar with a Buried Pipeline in a Thick Loose Layer in Western China: Methodology and Case Study. Rock Mech. Rock Eng. 2023, 56, 2879–2896. [Google Scholar] [CrossRef]
  29. Zhao, B.; Zhang, H.L.; Wang, Y.; Zhou, Y.T.; Zhang, J.X. Mechanical Behavior of Gas-Transmission Pipeline in a Goaf. Processes 2023, 11, 1022. [Google Scholar] [CrossRef]
  30. Yu, C.; Han, C.J.; Xie, R.; Wang, L. Mechanical behavior analysis of buried pipeline under stratum settlement caused by underground mining. Int. J. Press. Vessel. Pip. 2021, 188, 104212. [Google Scholar] [CrossRef]
  31. Zhang, J.; Liang, Z.; Han, C.J. Mechanical behaviour analysis of buried pressure pipeline crossing ground settlement zone. Int. J. Pavement Eng. 2017, 18, 608–621. [Google Scholar] [CrossRef]
  32. GB/T 9711-2017; Petroleum and Natural Gas Industries Steel Pipe for Pipeline Transportation Systems. General Administration of Quality Supervision, Inspection and Quarantine of the People’s Republic of China; Standardization Administration of the People’s Republic of China: Beijing, China, 2017.
  33. Zhou, M.; Du, Y.J.; Wang, F.; You, Q.; Dong, D.D. Mechanical response of buried HDPE pipes subjected to localized land subsidence. Chin. J. Rock Mech. Eng. 2017, 36, 4177–4187. [Google Scholar]
  34. Li, H.J.; Zhu, H.H.; Zhu, B.; Wu, H.Y.; Liu, Z.Y.; Shi, B. Model tests on settlement of buried pipeline based on fiber optic monitoring. Chin. J. Rock Mech. Eng. 2020, 39, 3645–3654. [Google Scholar]
  35. Ren, J.D.; Zhao, Y.X.; Sun, Z.B.; Liu, S.M.; Wang, W. Study on time series rule of buried pipe failure under high-intensity coal mining in a gas-coal overlapping area. Coal Sci. Technol. 2023, 56, 2879–2896. [Google Scholar]
Figure 1. Schematic diagram of the coal and gas co-mining area of the Da Niu Di gas field in the Or-dos Basin.
Processes 12 00213 g001
Figure 2. Relationship between coal mining face, pipeline location, and layout of surface subsidence monitoring points.
Processes 12 00213 g002
Figure 3. Histogram of the coal rock strata.
Processes 12 00213 g003
Figure 4. Schematic diagram of pipeline offset by ground subsidence.
Processes 12 00213 g004
Figure 5. Function fitting curve for surface subsidence monitoring points.
Processes 12 00213 g005
Figure 6. Pipe and soil finite element model.
Processes 12 00213 g006
Figure 7. Critical mining surface strike and inclination subsidence curves: (a) strike subsidence curve, (b) inclined subsidence curve.
Processes 12 00213 g007
Figure 8. Comparison of critical mining towards subsidence curve.
Processes 12 00213 g008
Figure 9. Maximum subsidence value of pipe and soil with advancement of working face.
Processes 12 00213 g009
Figure 10. Cloud diagram of the relationship between surface subsidence and spatial position of pipeline as the working face advances.
Processes 12 00213 g010
Figure 11. Evolutionary curve of pipe and soil subsidence at the point of maximum stress during the mining period.
Processes 12 00213 g011
Figure 12. Stress evolution at the location of the maximum Von Mises Stress on the pipe at different degrees of advancement throughout the mining cycle.
Processes 12 00213 g012
Figure 13. Evolution of von mises stress in different sections of the pipeline over the mining cycle.
Processes 12 00213 g013
Figure 14. Stress evolution at different orientations in the same section during the mining cycle: (a) 100 m section, (b) 200 m section, (c) 300 m section, (d) 400 m section.
Processes 12 00213 g014
Figure 15. Stress evolution in different sections of the same orientation during the mining cycle: (a) 180°, (b) 45°, (c) 225°, (d) 0°.
Processes 12 00213 g015
Figure 16. Schematic before and after deformation of pipeline cross-section in the main loading direction.
Processes 12 00213 g016
Figure 17. Evolution of relative deformation rates of pipeline sections over the mining cycle.
Processes 12 00213 g017
Table 1. Physical and mechanical parameters of the pipeline.
ParametersValueParametersValue
D159 mm μ 0.3
L900 mt5 mm
FD0.9E2 × 105 MPa
SMYS450 MPa α 1.2 × 10⁻⁵ mm/(mm °C)
p6.3 MPaT1T237°
Table 2. Physical and mechanical parameters of strata and pipeline.
Name of MaterialDensity
(kg/m3)
Elastic Modulus
(MPa)
Poisson
Ratio
Cohesive
Force (MPa)
Internal Friction
Angle (°)
Aeolian sand16001500.110.219
Loess21005250.320.830
Red soil22605000.31234
Mudstone23007500.33.834
Medium grained
sandstone
23609000.344.436
Coarse grained
sandstone
234010500.285.740
Fine grained
sandstone
245012000.265.242
Mudstone23007500.33.834
Siltstone24009000.314.136
Coal13503000.20.429
Siltstone24009000.314.136
Pipe7850200,0000.3//
Disclaimer/Publisher’s Note: The statements, opinions and data contained in all publications are solely those of the individual author(s) and contributor(s) and not of MDPI and/or the editor(s). MDPI and/or the editor(s) disclaim responsibility for any injury to people or property resulting from any ideas, methods, instructions or products referred to in the content.