
The Influence of Wettability Effect and Adsorption Thickness on Nanoconfined Methane Phase Behavior: Vapor-Liquid Co-Existence Curves and Phase Diagrams


Abstract
1. Introduction
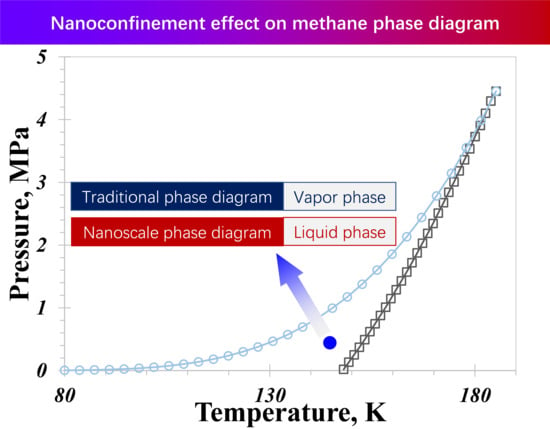
2. Physical Model
3. Model Establishment
3.1. Adsorption-Phase Thickness
3.2. Shift in Critical Properties
3.3. Capillary Pressure
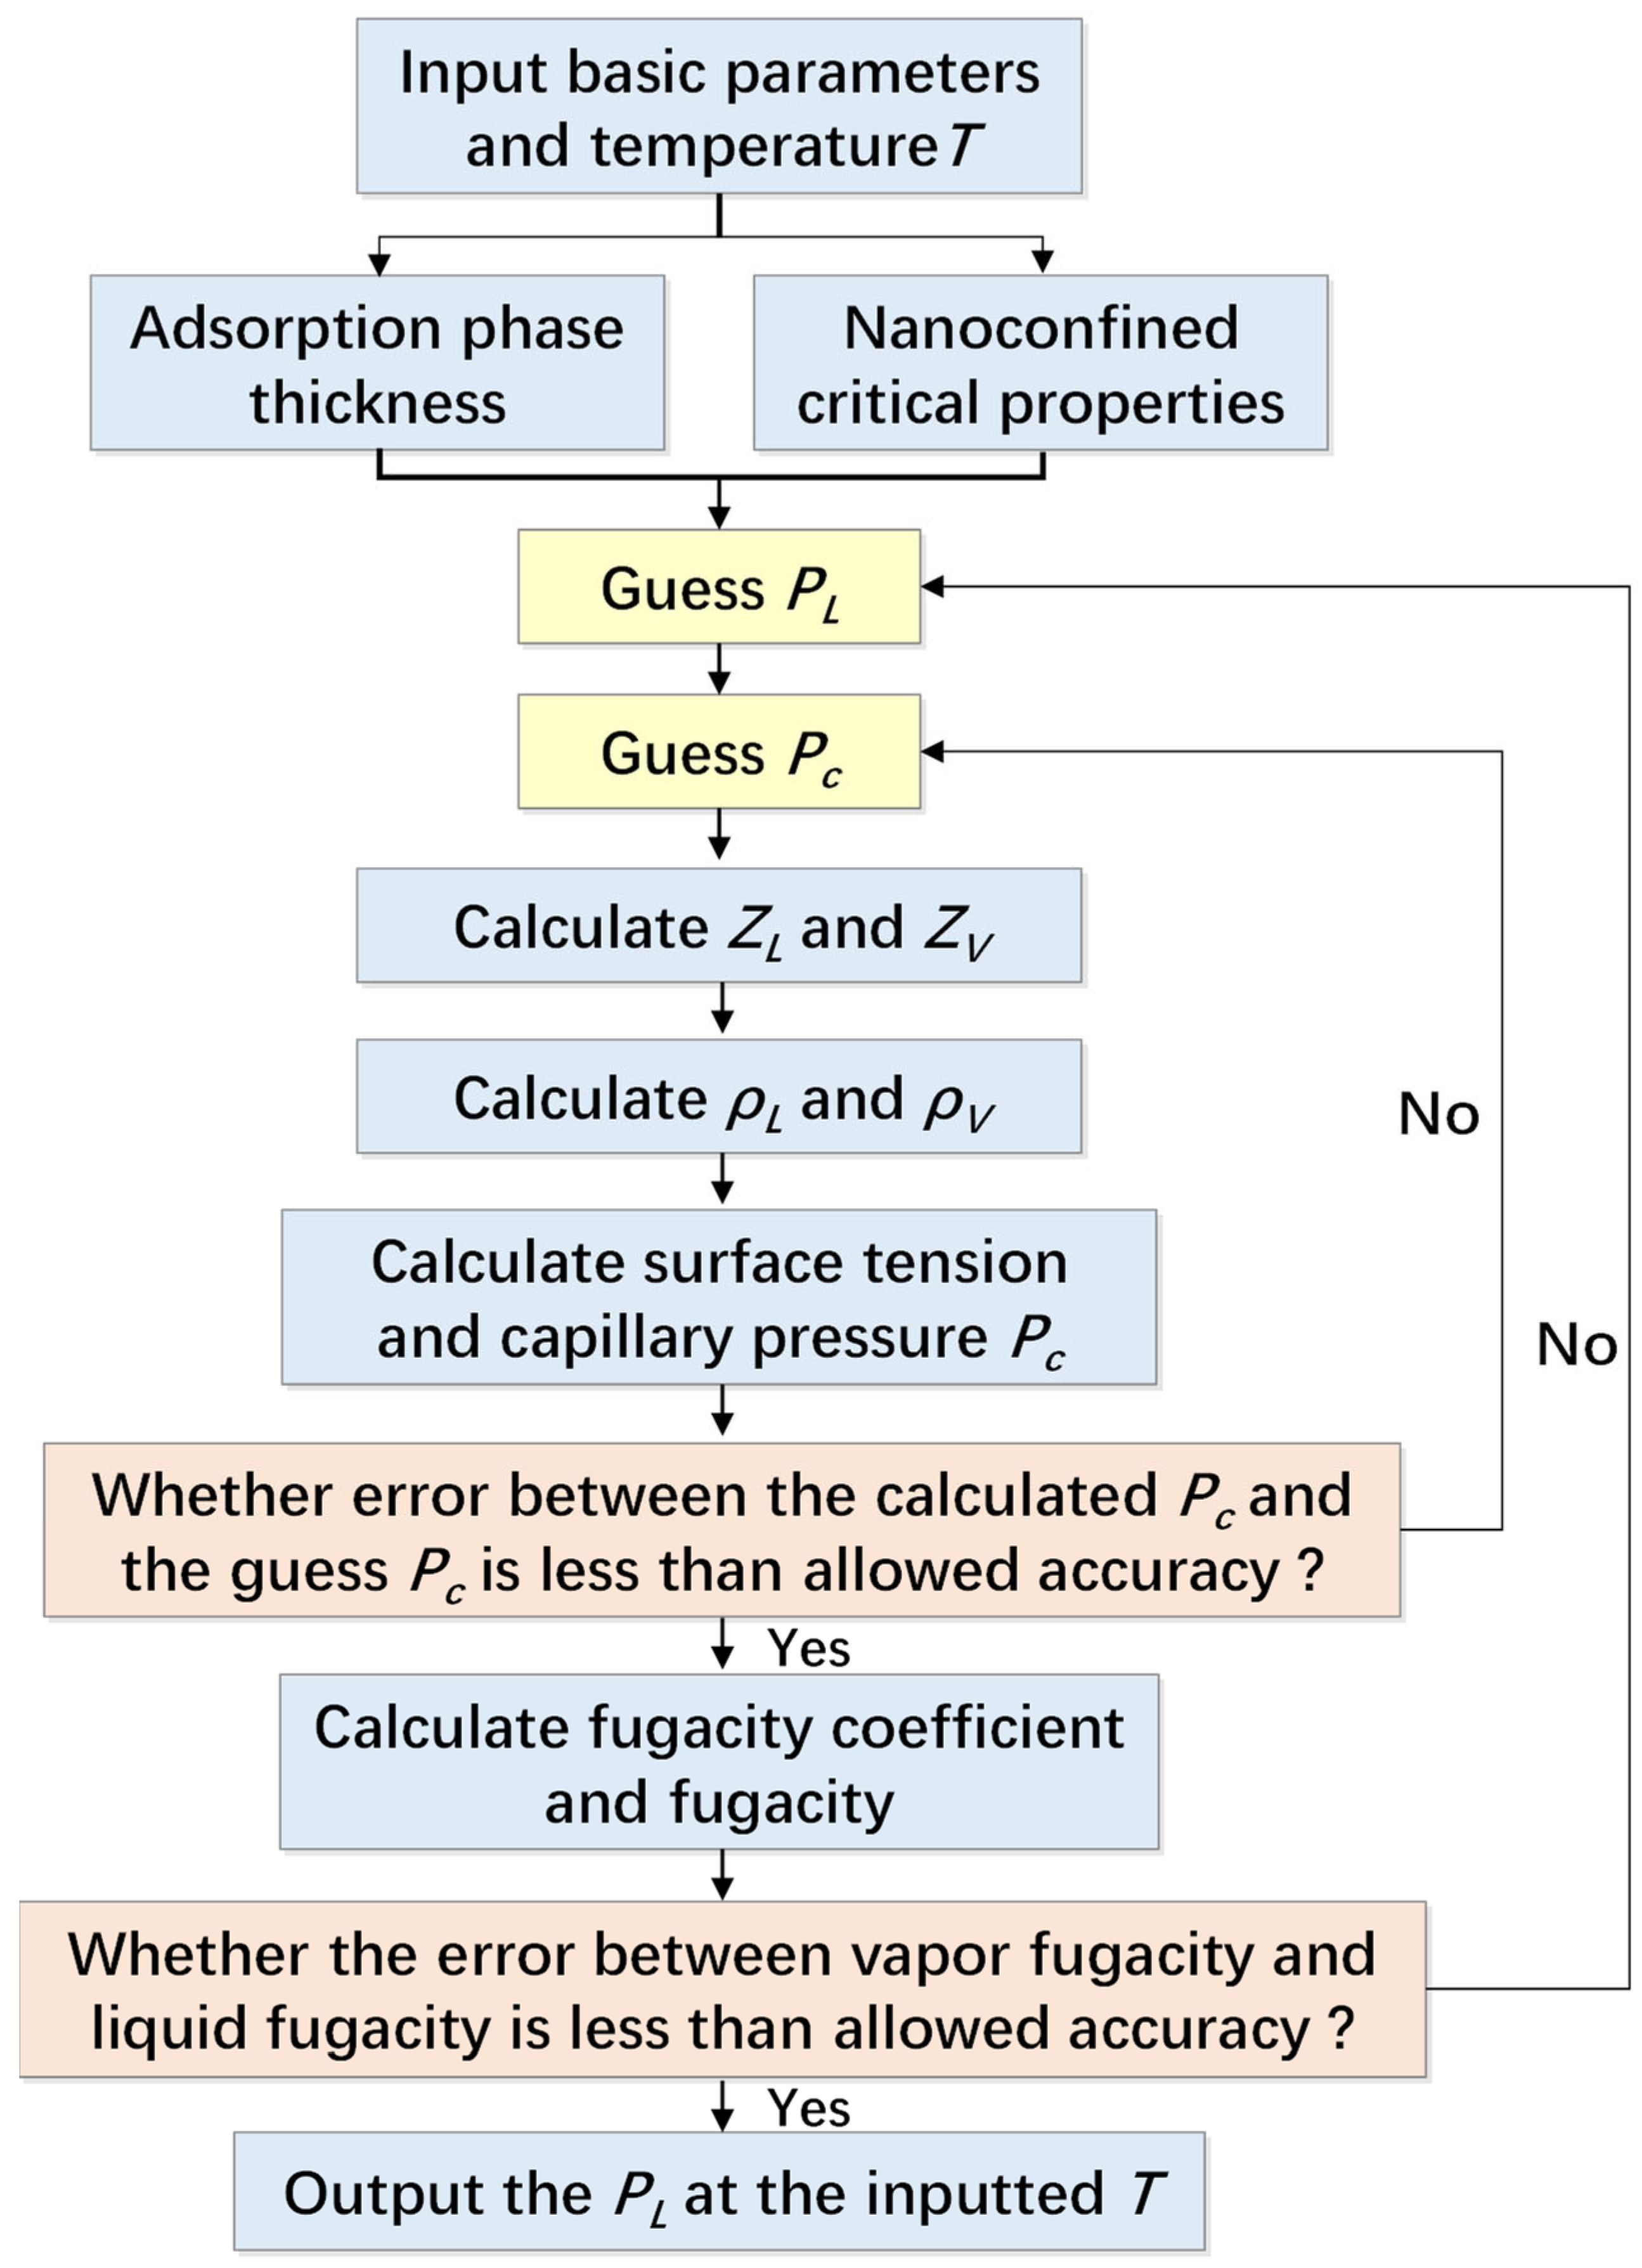
3.4. Vapor-Liquid Fugacity Equilibrium
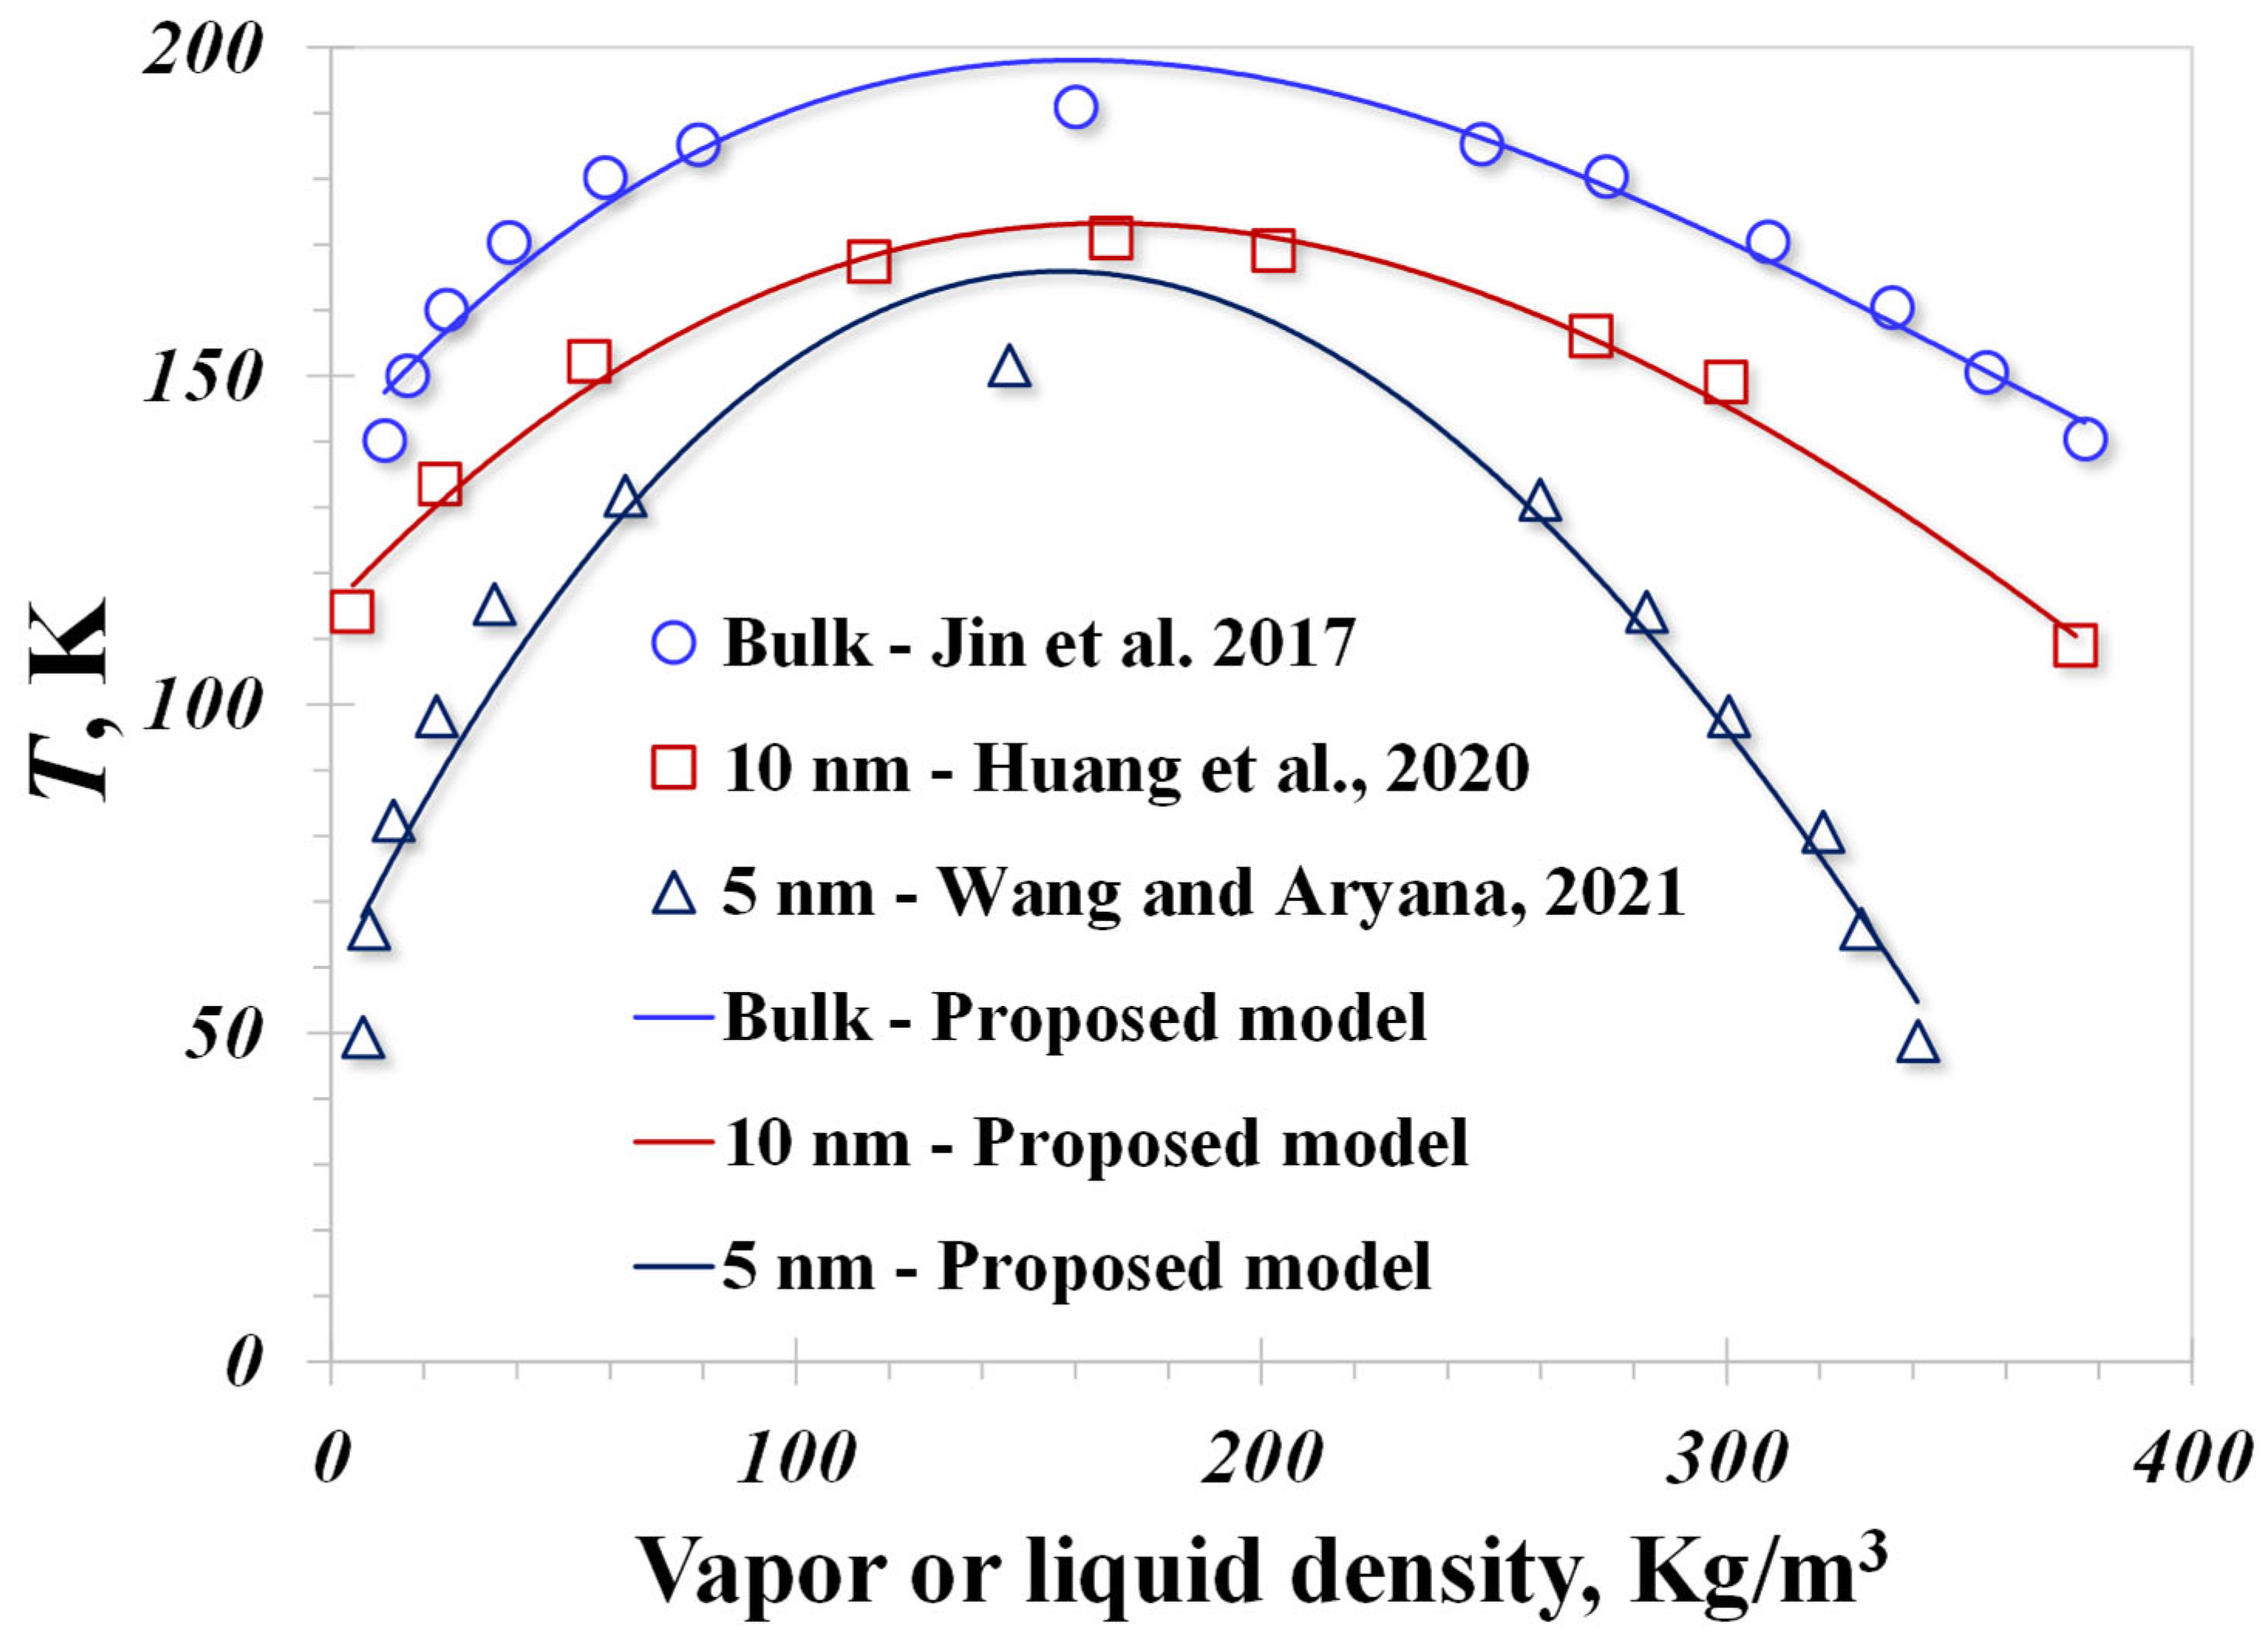
4. Model Validation
5. Results and Discussion
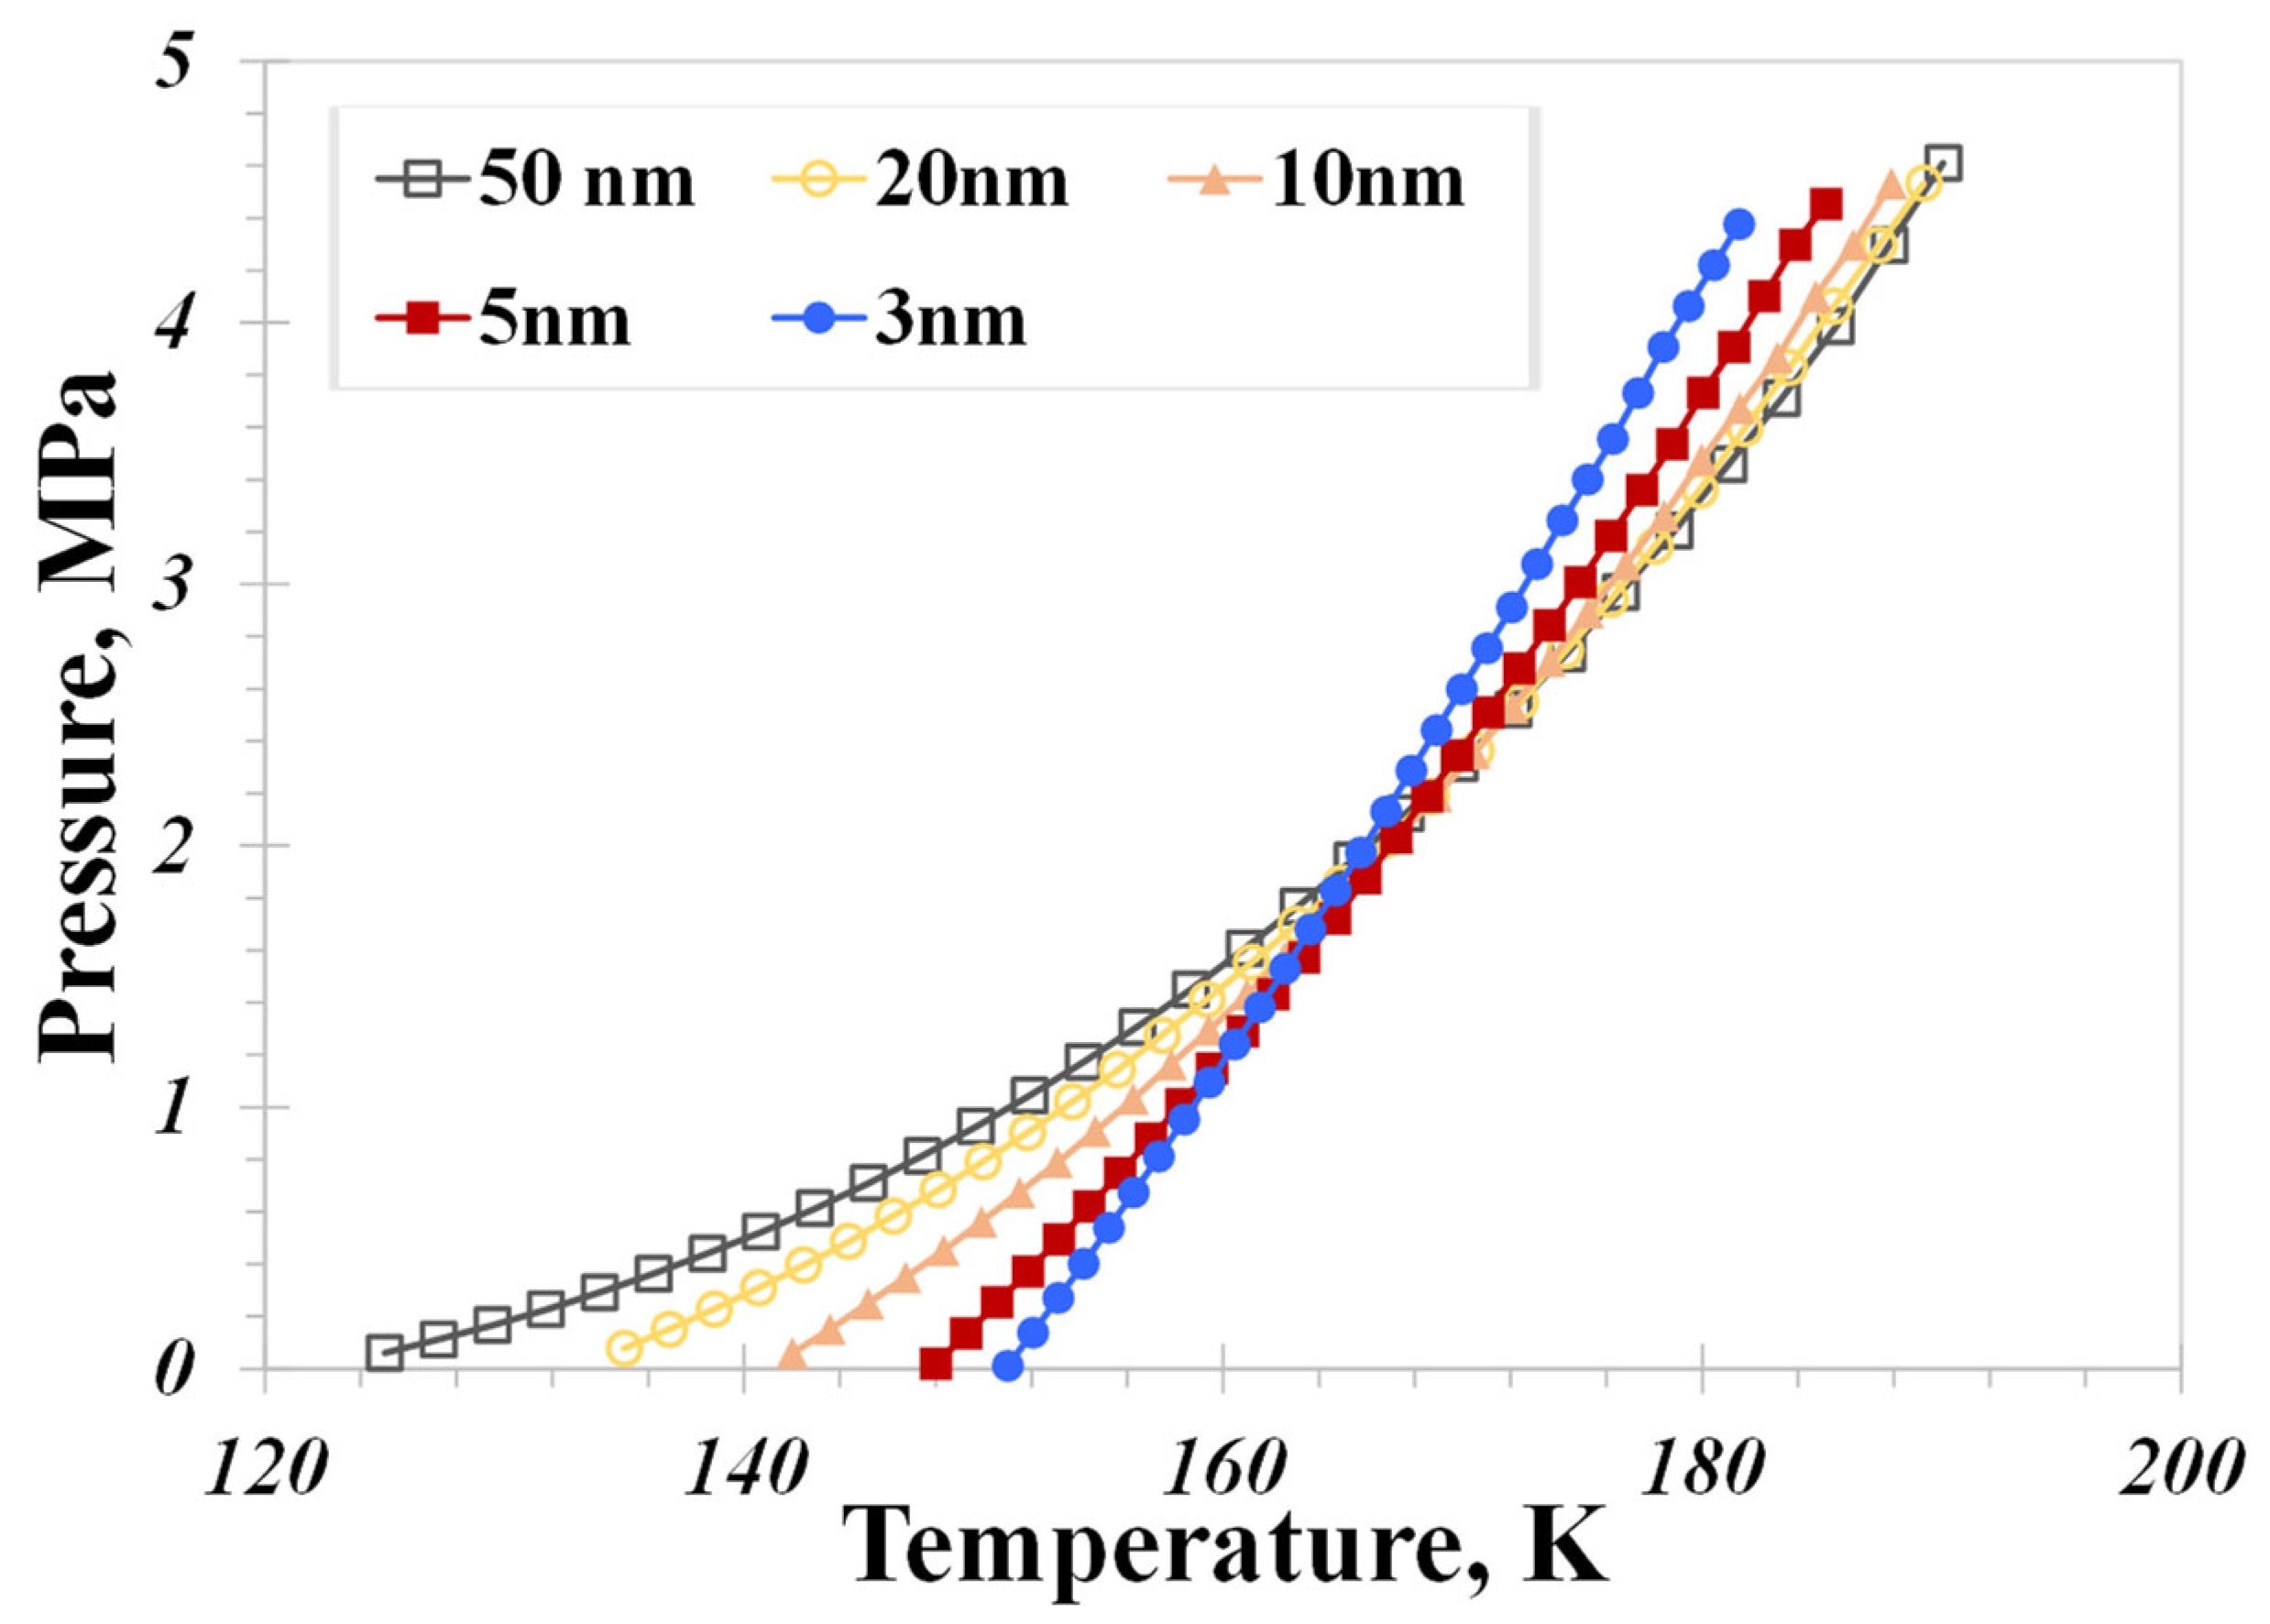
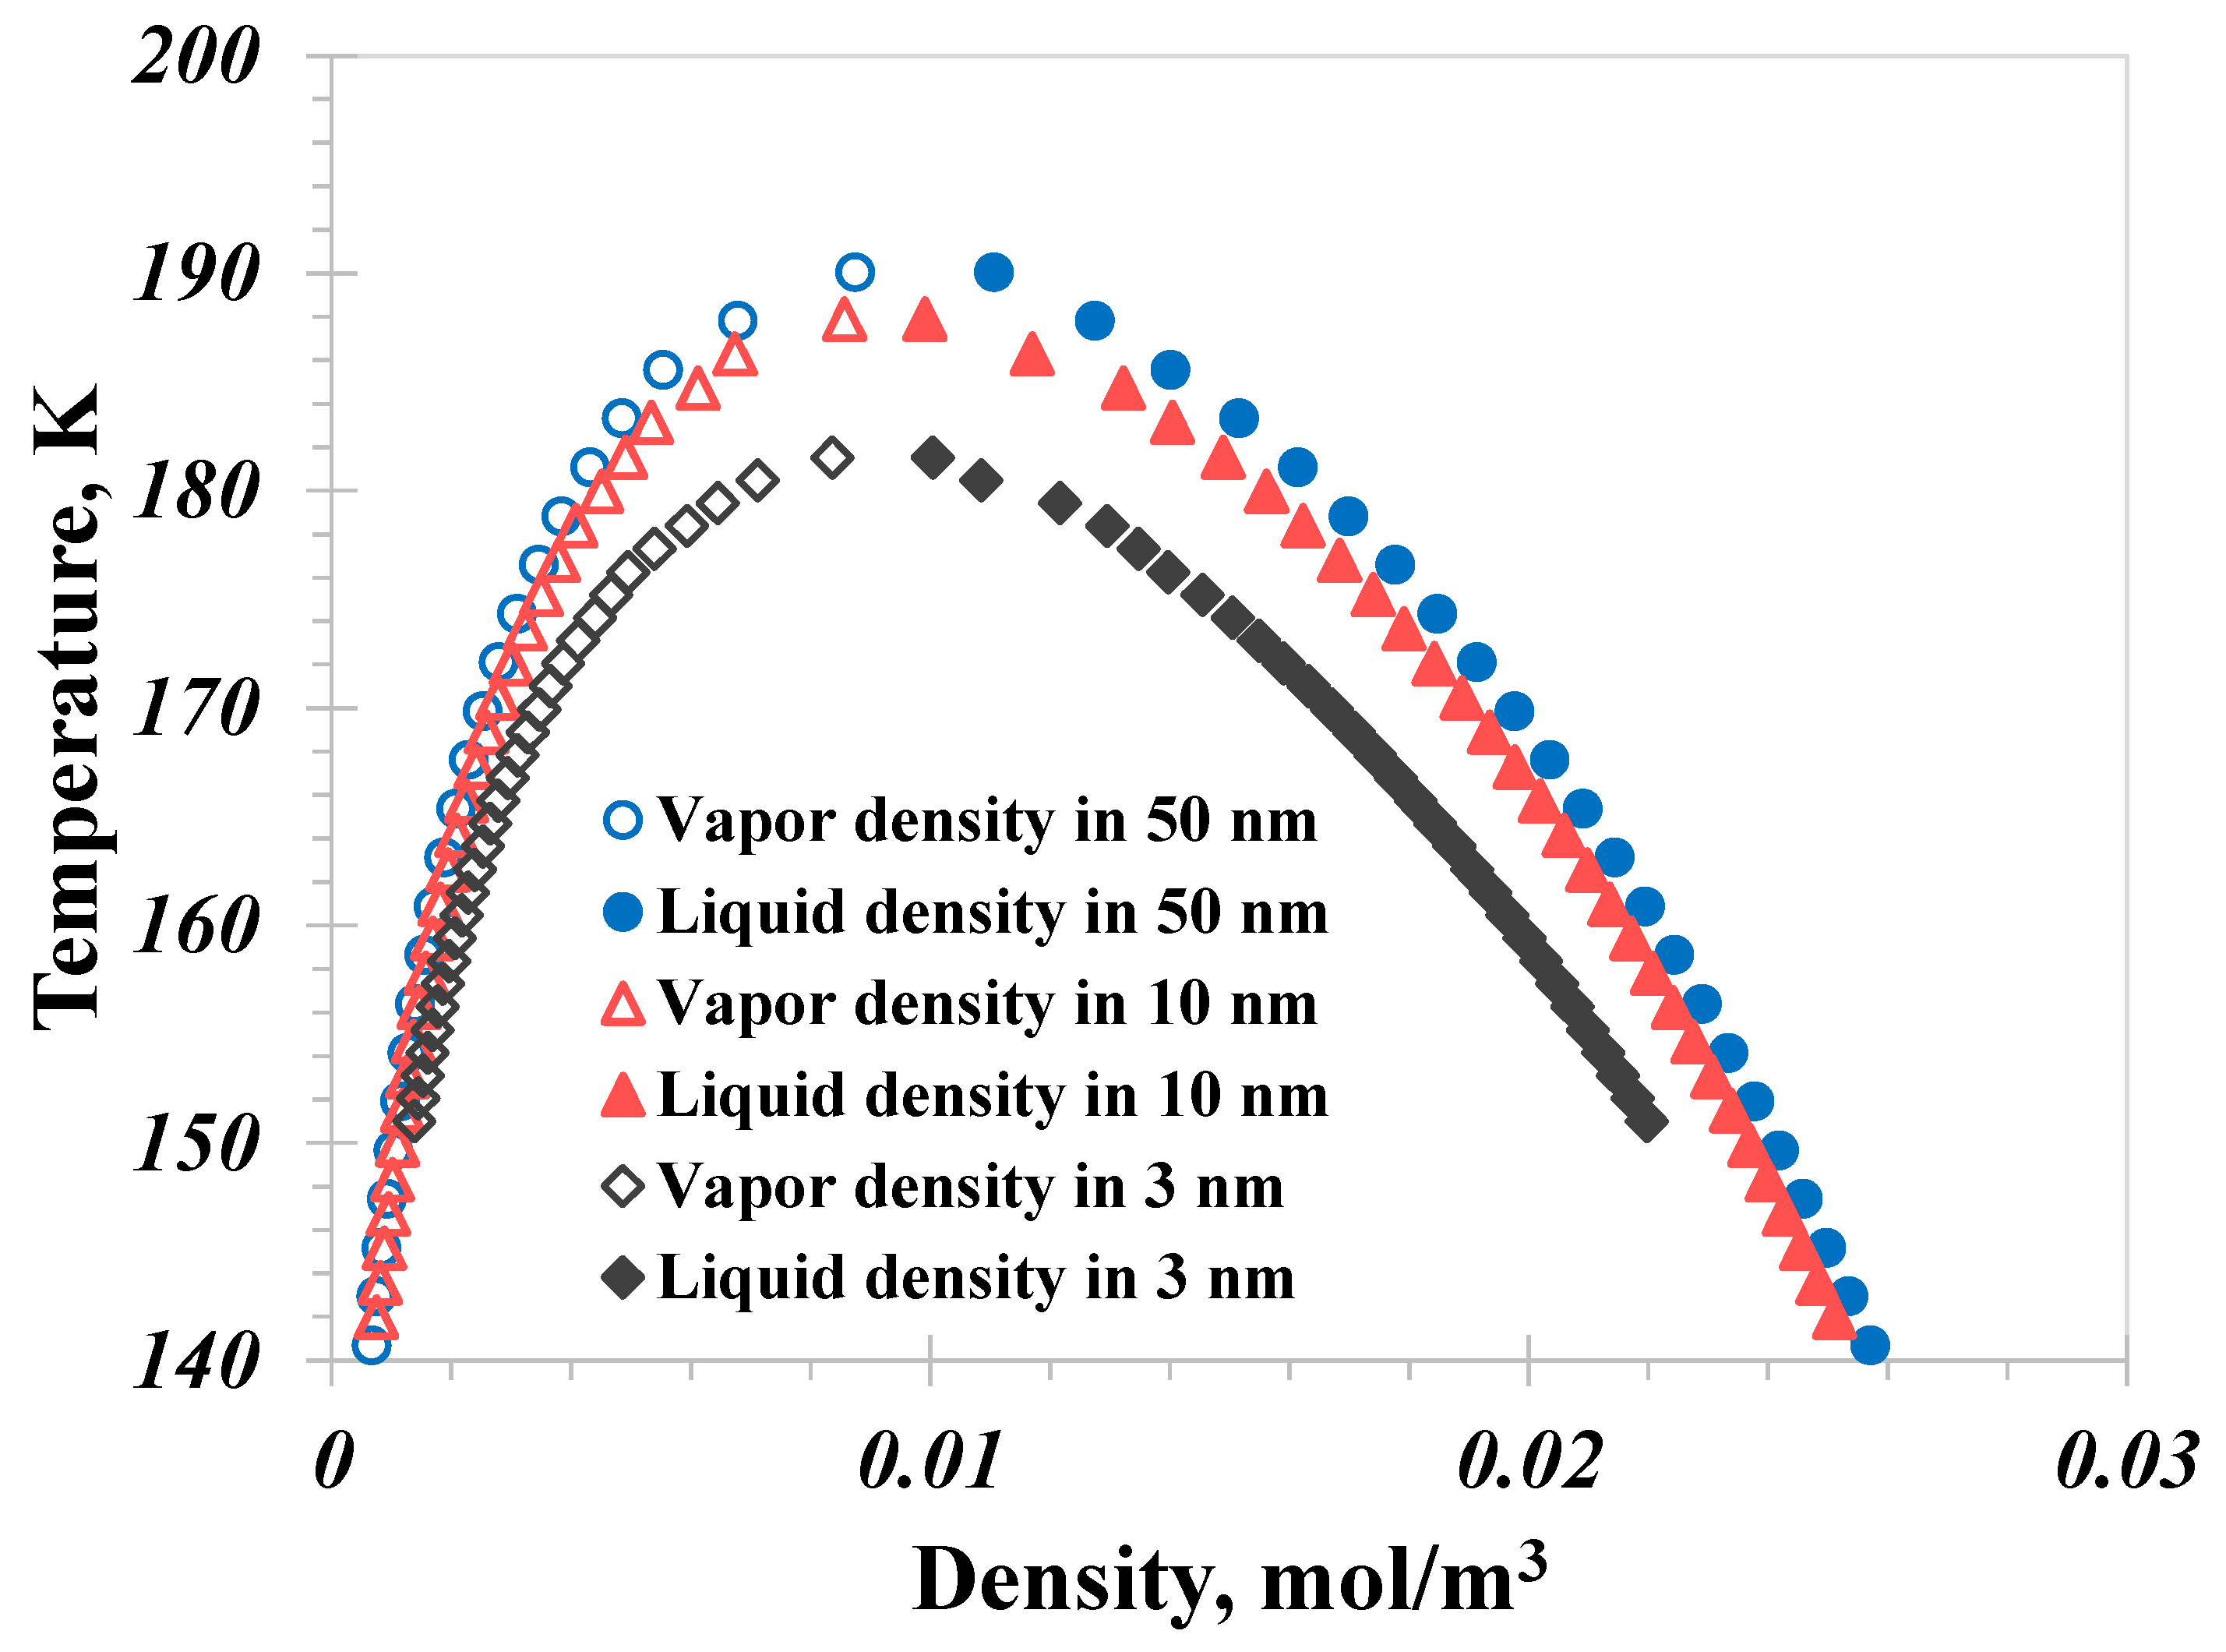
5.1. Pore Size
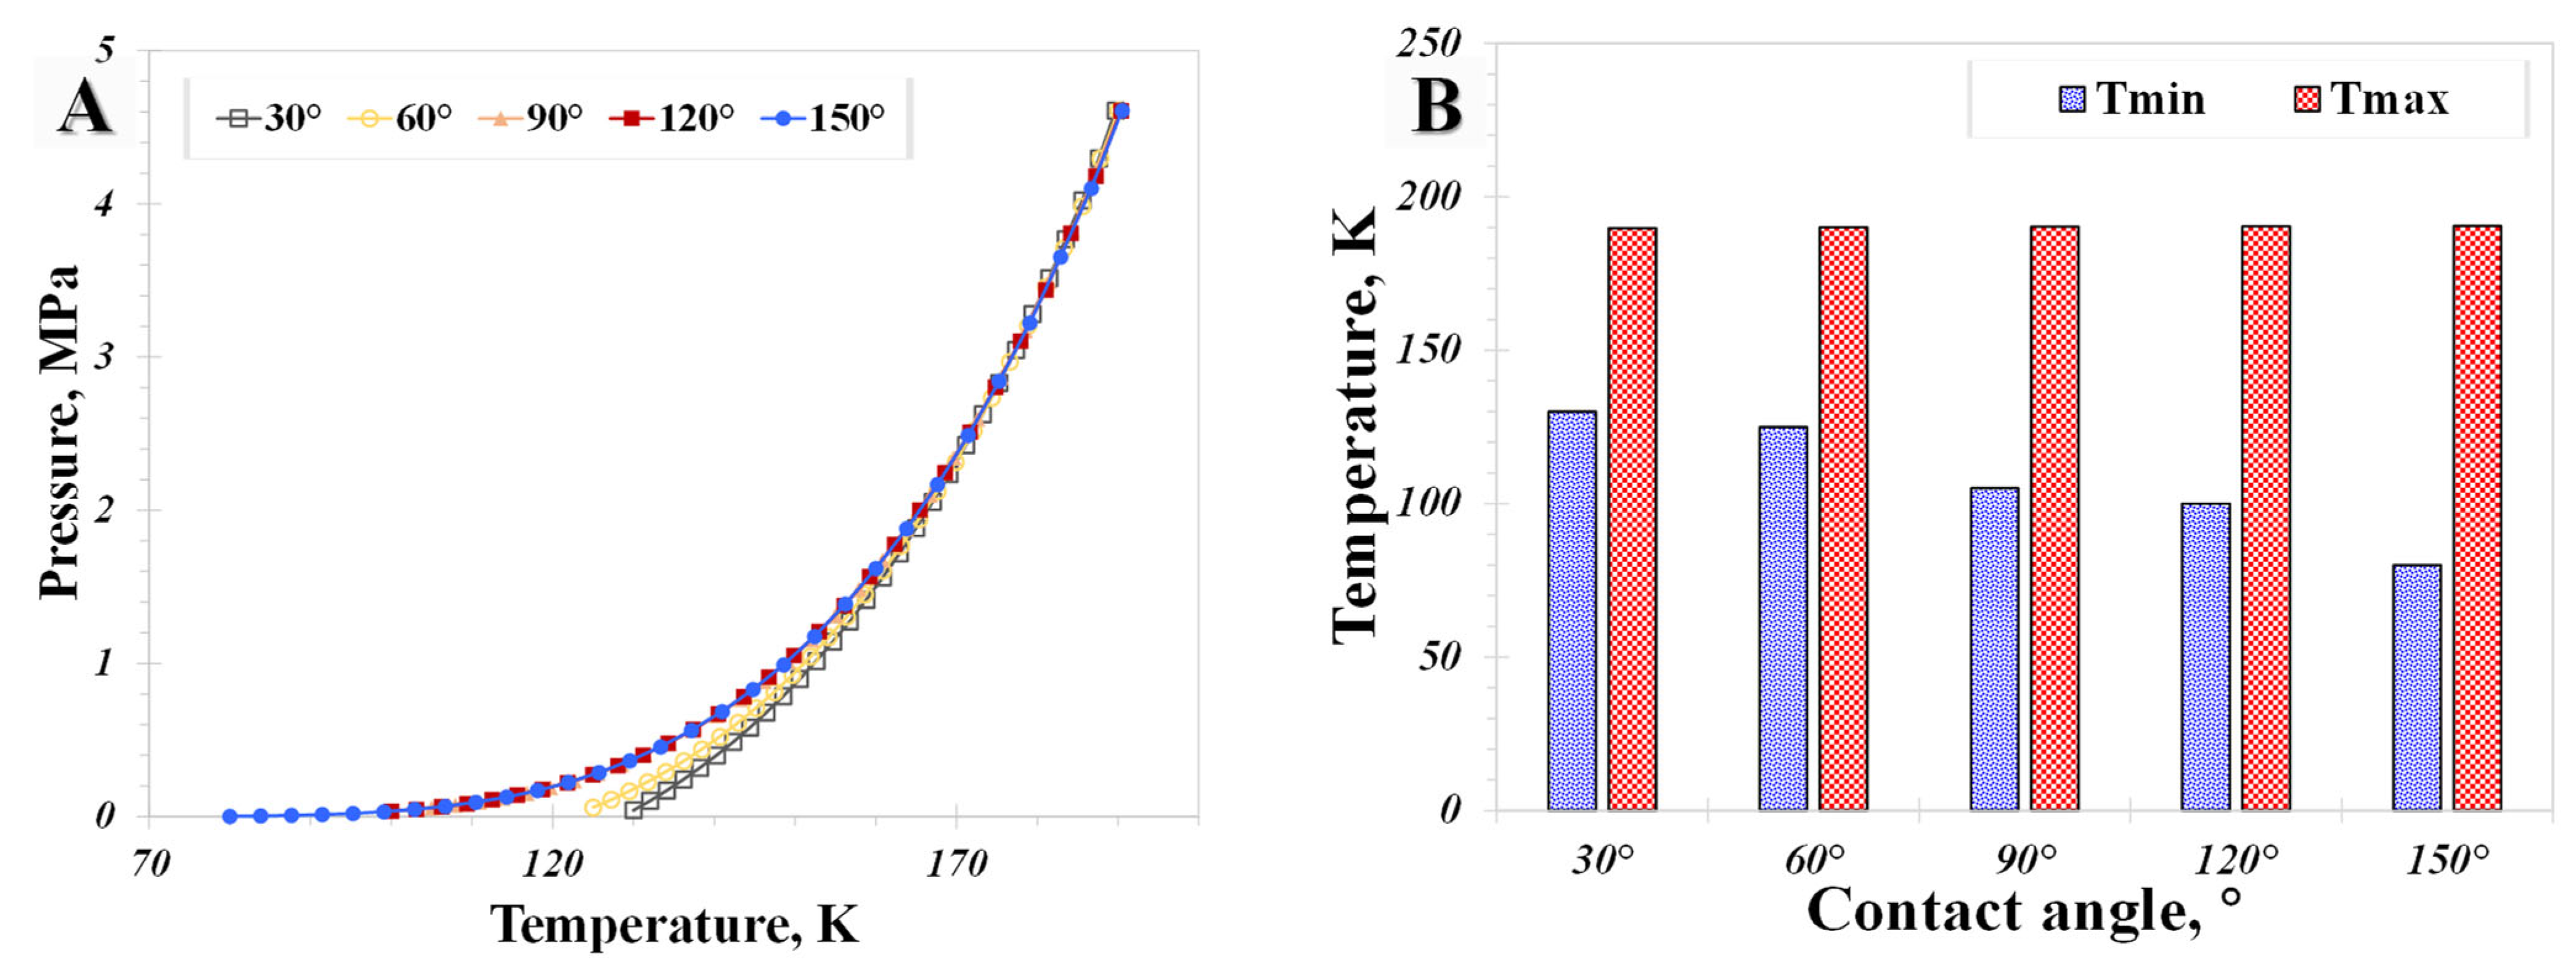
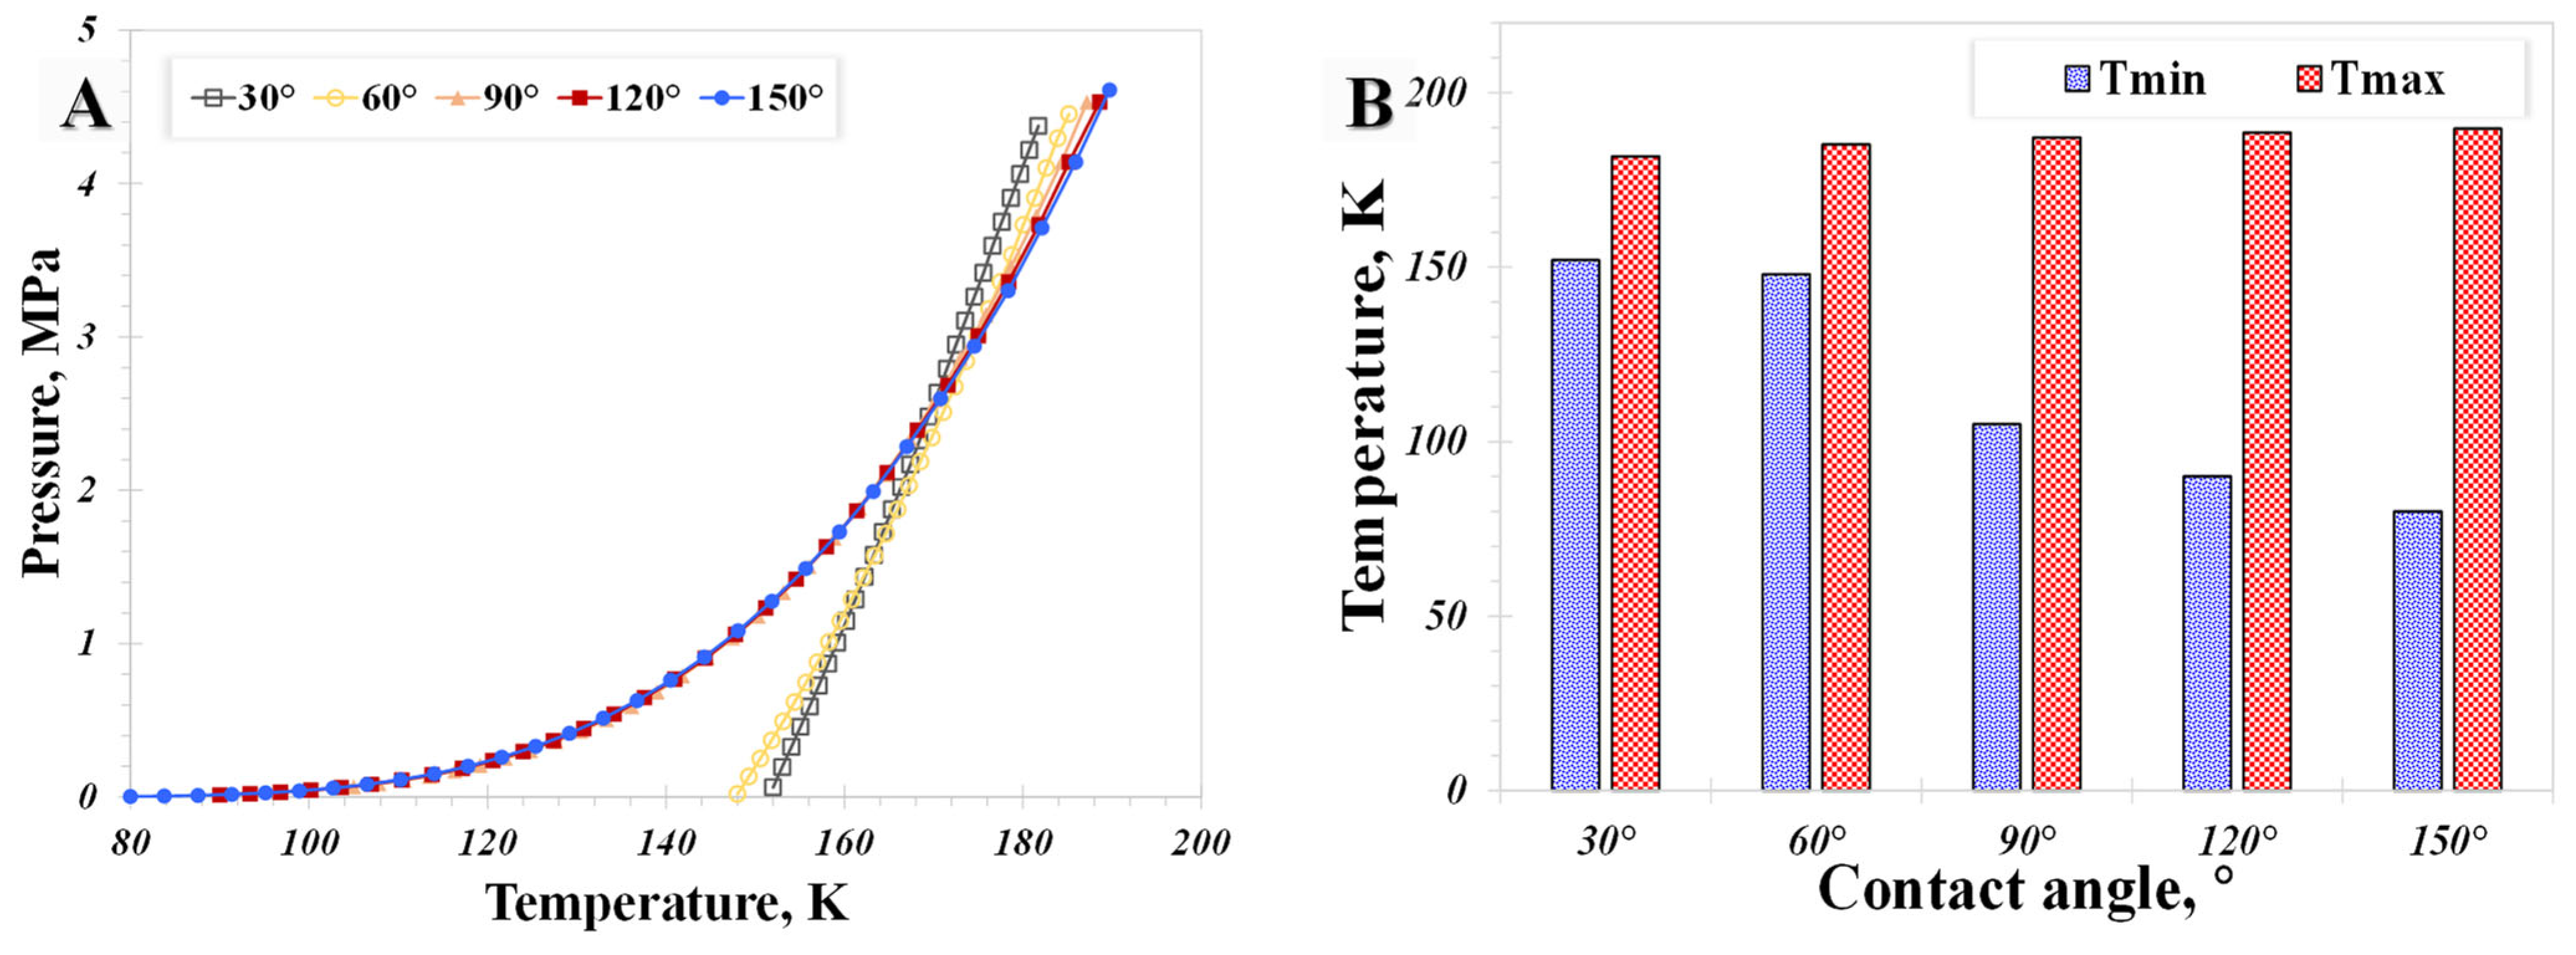
5.2. Surface Wettability
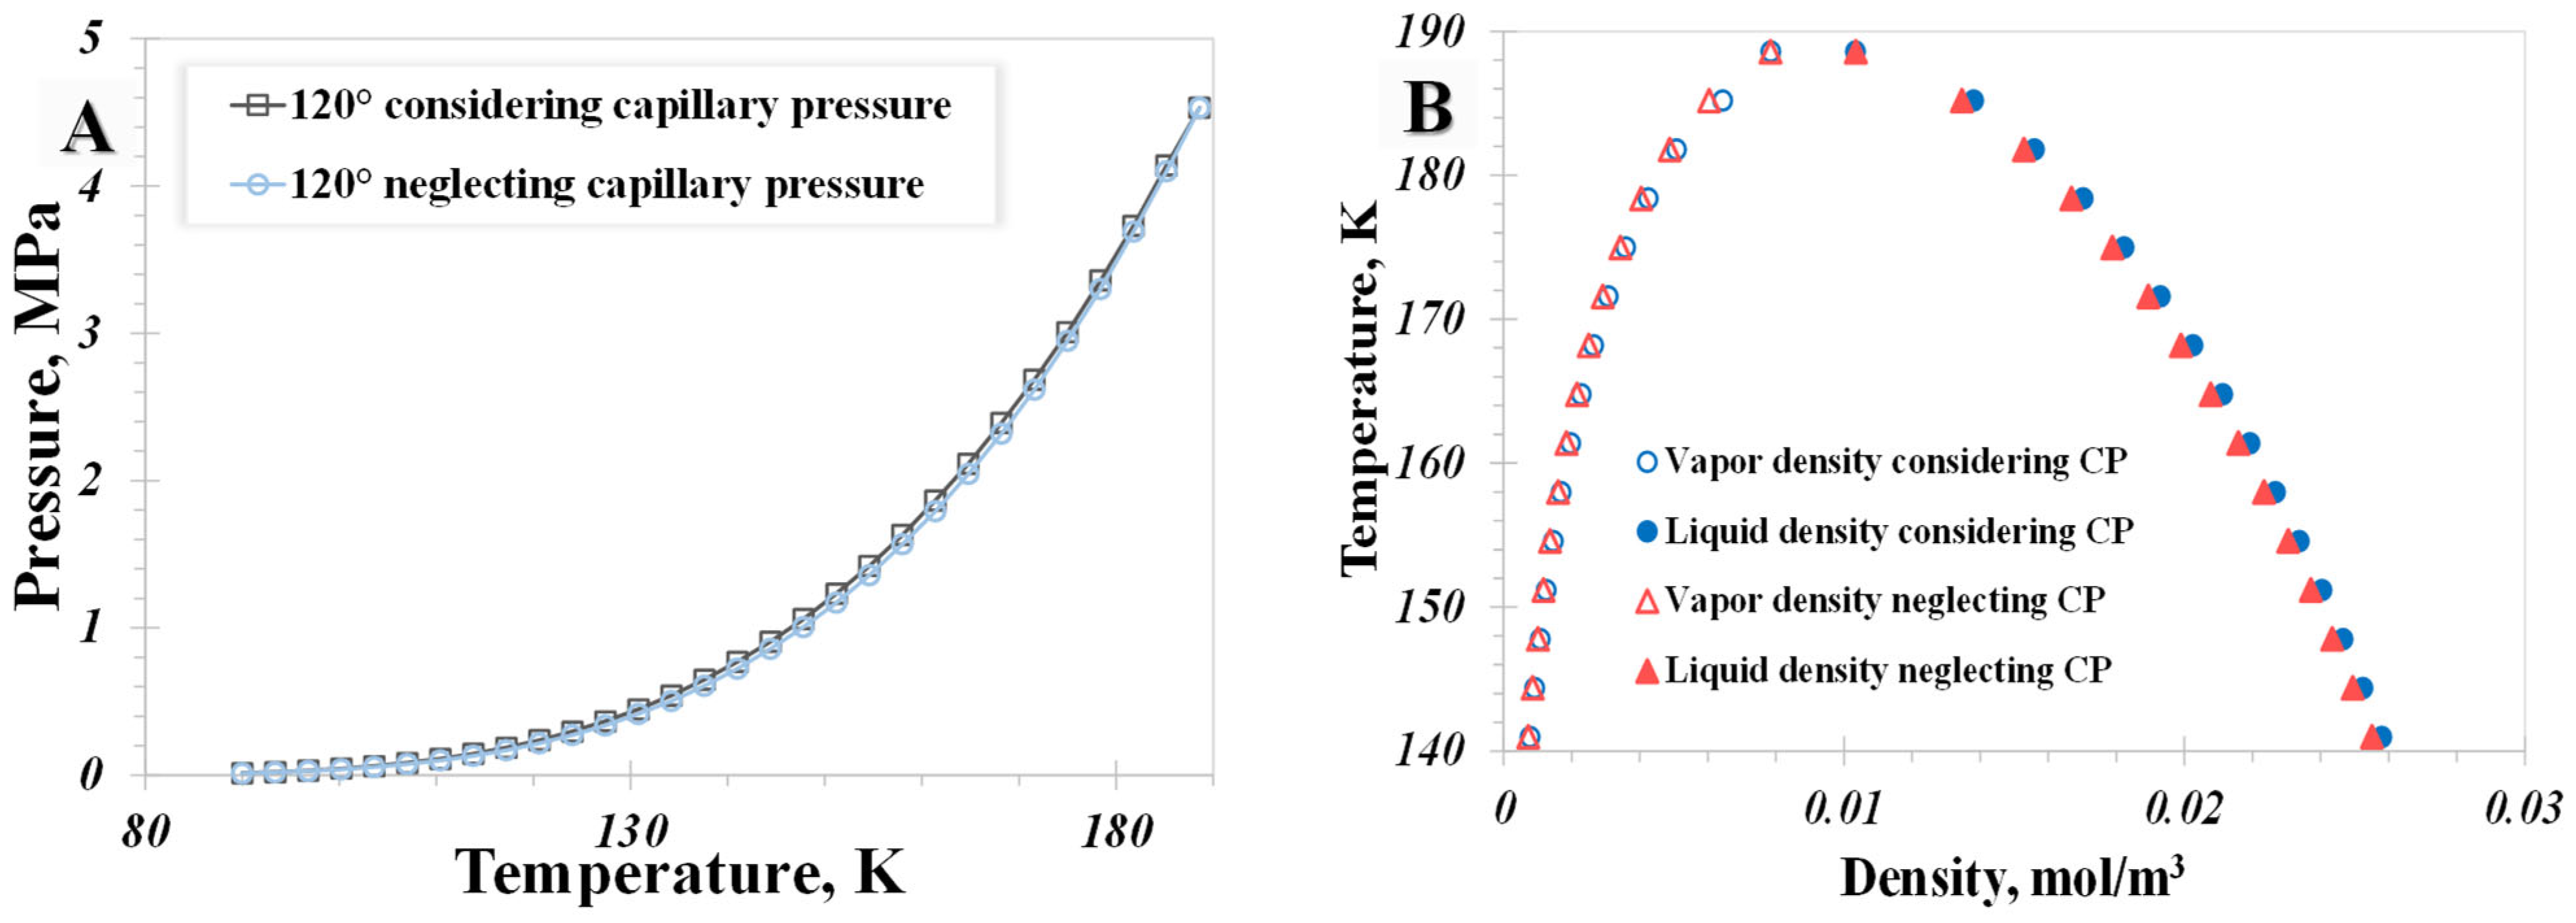
5.3. Capillary Pressure
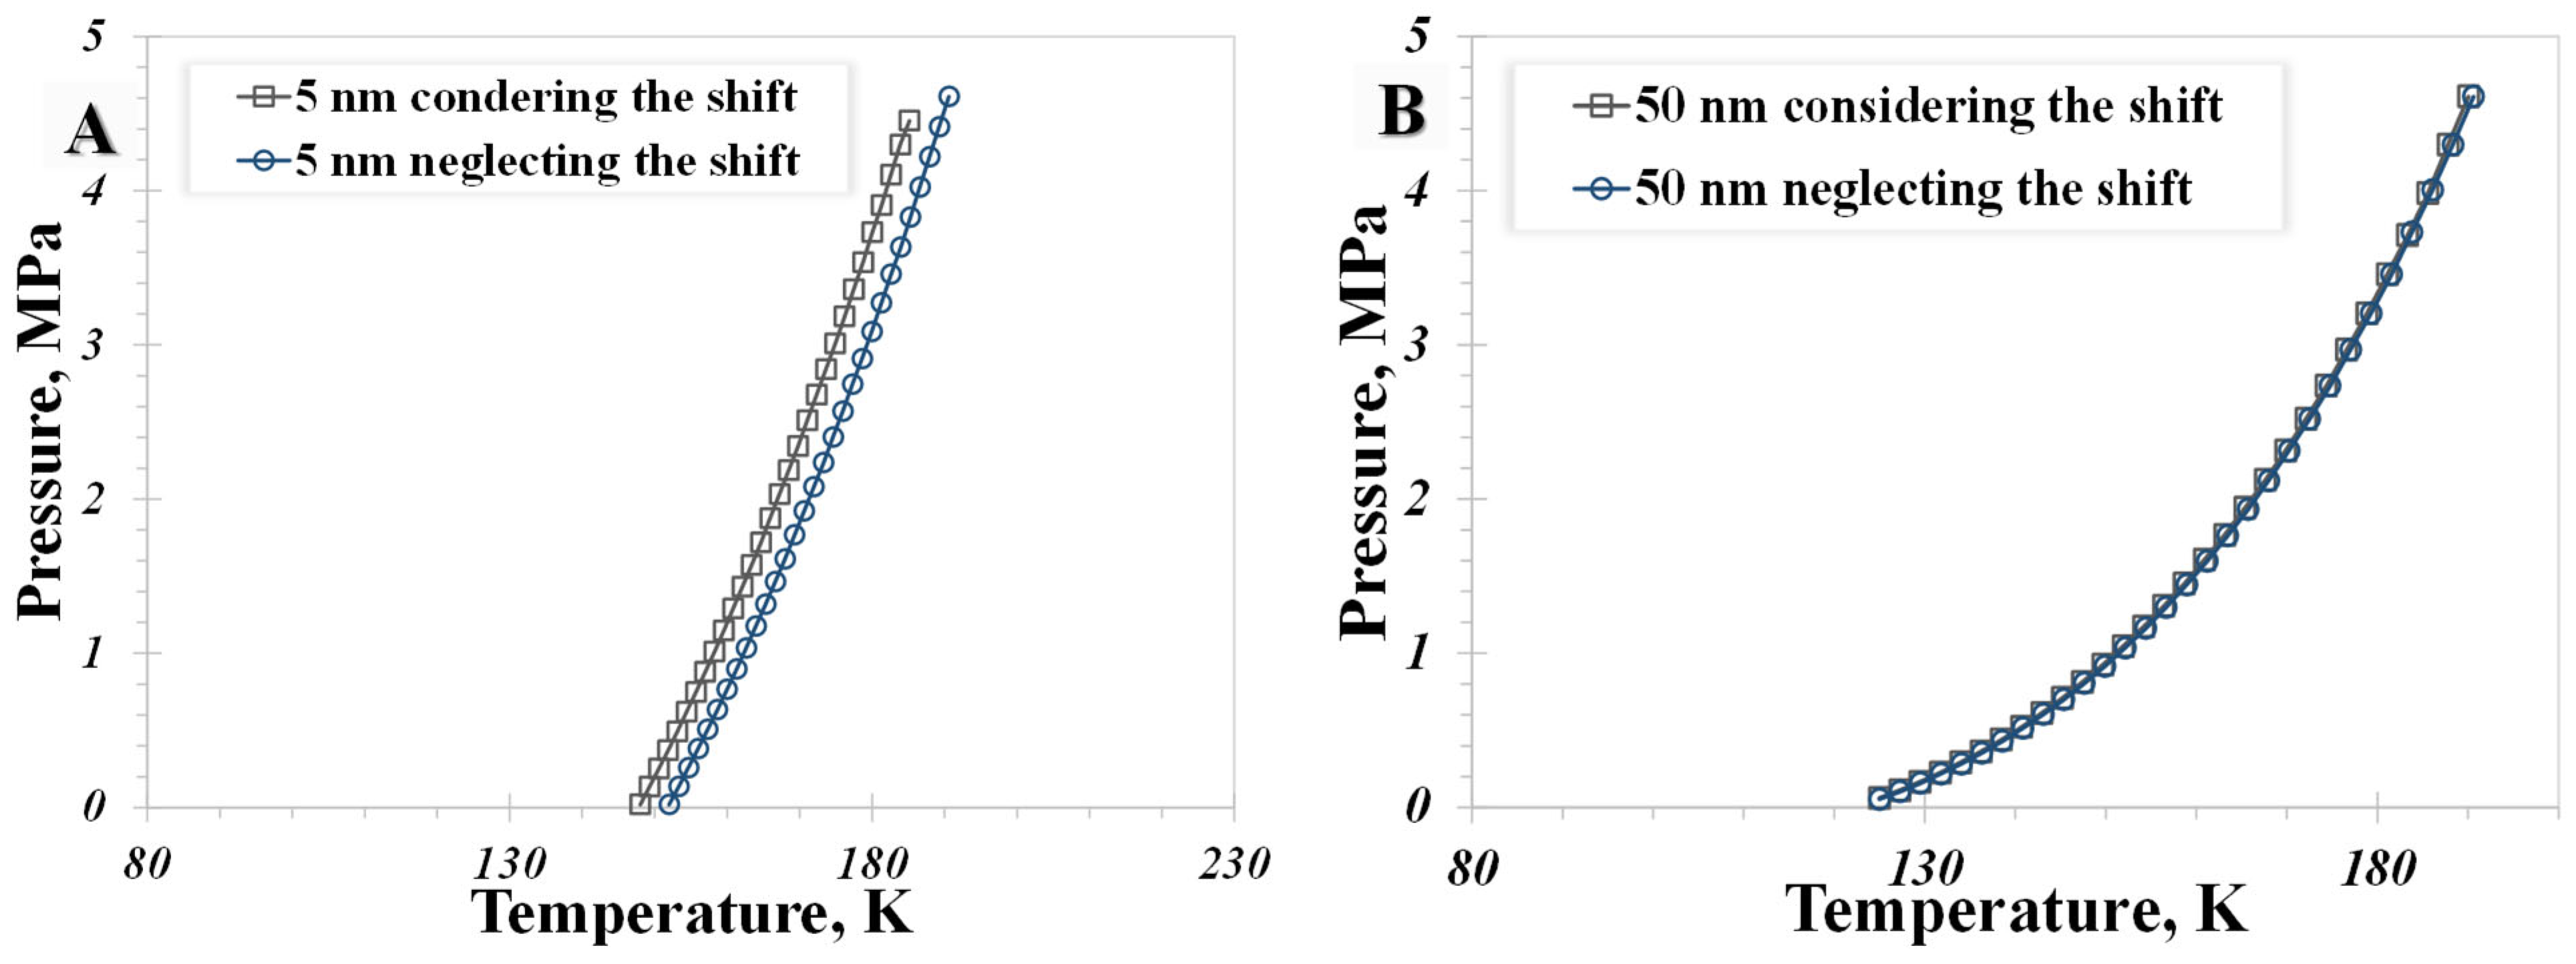
5.4. Shifted Critical Properties
6. Conclusions
- Based on the fundamental vapor-liquid fugacity equilibrium, we established a fully coupled model to explore the methane phase diagram in nanopores. This model simultaneously considers adsorption-phase thickness, capillary pressure, and shifted critical properties. The reliability of the model in reproducing nanoconfined methane phase diagrams was thoroughly clarified by comparing it against experimental data and MD results, utilizing different methods and surface types.
- A distinctive temperature, 168 K in our calculation case, serves as a dividing point for the impact of pore size on the nanoconfined methane phase diagram. Below 168 K, methane molecules in a vapor phase in large nanopores transition to the liquid phase in smaller nanopores. The presence of capillary pressure, which enhances vapor-phase pressure as pore size decreases, is responsible for the increase in vapor density.
- The influence of the wettability effect on nanoconfined phase behavior becomes more pronounced when the pore size is less than 5 nm. The methane phase diagram remains almost unchanged when the contact angle is larger than 90°, with a dramatic change occurring when the contact angle is less than 90°. Capillary pressure emerges as the main factor causing the phase diagram curve to become vertical. The impact of shifted critical properties might reasonably be overlooked when the pore size exceeds 50 nm.
Author Contributions
Funding
Data Availability Statement
Conflicts of Interest
References
- York, R.; Bell, S.E. Energy transitions or additions: Why a transition from fossil fuels requires more than the growth of renewable energy. Energy Res. Soc. Sci. 2019, 51, 40–43. [Google Scholar] [CrossRef]
- Liu, F.; Mauzerall, D.L.; Zhao, F.; Hao, H. Deployment of fuel cell vehicles in China: Greenhouse gas emission reductions from converting the heavy-duty truck fleet from diesel and natural gas to hydrogen. Int. J. Hydrog. Energy 2021, 46, 17982–17997. [Google Scholar] [CrossRef]
- Shamlooh, M.; Hussein, I.A.; Nasser, M.S.; Magzoub, M.; Salehi, S. Development of pH-controlled aluminum-based polymeric gel for conformance control in sour gas reservoirs. ACS Omega 2020, 5, 24504–24512. [Google Scholar] [CrossRef] [PubMed]
- Suboyin, A.; Rahman, M.M.; Haroun, M. Hydraulic fracturing design considerations, water management challenges and insights for Middle Eastern shale gas reservoirs. Energy Rep. 2020, 6, 745–760. [Google Scholar] [CrossRef]
- Yu, P.; Dempsey, D.; Archer, R. Techno-Economic feasibility of enhanced geothermal systems (EGS) with partially bridging Multi-Stage fractures for district heating applications. Energy Convers. Manag. 2022, 257, 115405. [Google Scholar] [CrossRef]
- Soleymanzadeh, A.; Helalizadeh, A.; Jamialahmadi, M.; Soulgani, B.S. Development of a new model for prediction of cementation factor in tight gas sandstones based on electrical rock typing. J. Nat. Gas Sci. Eng. 2021, 94, 104128. [Google Scholar] [CrossRef]
- Knapp, L.J.; Ardakani, O.H.; Uchida, S.; Nanjo, T.; Otomo, C.; Hattori, T. The influence of rigid matrix minerals on organic porosity and pore size in shale reservoirs: Upper Devonian Duvernay Formation, Alberta, Canada. Int. J. Coal Geol. 2020, 227, 103525. [Google Scholar]
- Pang, Y.; Wang, S.; Yao, X.; Hu, X.; Chen, S. Evaluation of gas adsorption in nanoporous shale by simplified local density model integrated with pore structure and pore size distribution. Langmuir 2022, 38, 3641–3655. [Google Scholar] [CrossRef]
- Sun, Z.; Huang, B.; Yan, S.; Wang, S.; Wu, K.; Yu, W.; Li, Y.; Wang, S. Nanoconfined Methane Thermodynamic Behavior below Critical Temperature: Liquid–Vapor Coexistence Curve under Wettability Effect. Ind. Eng. Chem. Res. 2022, 61, 4971–4979. [Google Scholar]
- Mohagheghian, E.; Hassanzadeh, H.; Chen, Z. Evaluation of shale-gas-phase behavior under nanoconfinement in multimechanistic flow. Ind. Eng. Chem. Res. 2020, 59, 15048–15057. [Google Scholar] [CrossRef]
- Jia, B.; Xian, C.; Tsau, J.S.; Zuo, X.; Jia, W. Status and outlook of oil field chemistry-assisted analysis during the energy transition period. Energy Fuels 2022, 36, 12917–12945. [Google Scholar] [CrossRef]
- Jia, B.; Xian, C.G. Permeability measurement of the fracture-matrix system with 3D embedded discrete fracture model. Pet. Sci. 2022, 19, 1757–1765. [Google Scholar] [CrossRef]
- Wang, T.; Tian, S.; Li, G.; Zhang, L.; Sheng, M.; Ren, W. Molecular simulation of gas adsorption in shale nanopores: A critical review. Renew. Sustain. Energy Rev. 2021, 149, 111391. [Google Scholar] [CrossRef]
- Rabani, R.; Merabia, S.; Pishevar, A. Conductive heat transfer through nanoconfined argon gas: From continuum to free-molecular regime. Int. J. Therm. Sci. 2023, 192, 108391. [Google Scholar] [CrossRef]
- Sun, Z.; Li, X.; Liu, W.; Zhang, T.; He, M.; Nasrabadi, H. Molecular Dynamics of Methane Flow Behavior through Realistic Organic Nanopores under Geologic Shale Condition: Pore size and Kerogen Types. Chem. Eng. J. 2020, 398, 124341. [Google Scholar]
- Zhang, T.; Javadpour, F.; Li, J.; Zhao, Y.; Zhang, L.; Li, X. Pore-scale perspective of gas/water two-phase flow in shale. SPE J. 2021, 26, 828–846. [Google Scholar] [CrossRef]
- Zuo, H.; Zhai, C.; Deng, S.; Jiang, X.; Javadpour, F. Lattice Boltzmann modeling of gaseous microflow in shale nanoporous media. Fuel 2023, 337, 127087. [Google Scholar] [CrossRef]
- Le, T.H.H.; Morita, A.; Tanaka, T. Refractive index of nanoconfined water reveals its anomalous physical properties. Nanoscale Horiz. 2020, 5, 1016–1024. [Google Scholar] [CrossRef]
- Barisik, M.; Beskok, A. Scale effects in gas nano flows. Phys. Fluids 2014, 26, 052003. [Google Scholar] [CrossRef]
- Bardhan, R.; Hedges, L.O.; Pint, C.L.; Javey, A.; Whitelam, S.; Urban, J.J. Uncovering the intrinsic size dependence of hydriding phase transformations in nanocrystals. Nat. Mater. 2013, 12, 905–912. [Google Scholar] [CrossRef]
- Duan, X.; Hu, Z.; Shao, N.; Li, W.; Li, Y.; Chang, J.; Shen, R. Establishment of a new slip permeability model of gas flow in shale nanopores based on experimental and molecular dynamics simulations studies. J. Pet. Sci. Eng. 2020, 193, 107365. [Google Scholar] [CrossRef]
- Wu, K.; Chen, Z.; Li, X.; Guo, C.; Wei, M. A model for multiple transport mechanisms through nanopores of shale gas reservoirs with real gas effect–adsorption-mechanic coupling. Int. J. Heat Mass Transf. 2016, 93, 408–426. [Google Scholar]
- Song, W.; Yao, J.; Wang, D.; Li, Y.; Sun, H.; Yang, Y. Dynamic pore network modelling of real gas transport in shale nanopore structure. J. Pet. Sci. Eng. 2020, 184, 106506. [Google Scholar] [CrossRef]
- Xu, J.; Wu, K.; Li, Z.; Pan, Y.; Li, R.; Li, J.; Chen, Z. A model for gas transport in dual-porosity shale rocks with fractal structures. Ind. Eng. Chem. Res. 2018, 57, 6530–6537. [Google Scholar]
- Shen, W.; Song, F.; Hu, X.; Zhu, G.; Zhu, W. Experimental study on flow characteristics of gas transport in micro-and nanoscale pores. Sci. Rep. 2019, 9, 10196. [Google Scholar] [CrossRef] [PubMed]
- Roy, S.; Raju, R.; Chuang, H.F.; Cruden, B.A.; Meyyappan, M. Modeling gas flow through microchannels and nanopores. J. Appl. Phys. 2003, 93, 4870–4879. [Google Scholar]
- Sheng, G.L.; Zhao, H.; Su, Y.L.; Javadpour, F.; Wang, C.; Zhou, Y.; Liu, J.; Wang, H. An analytical model to couple gas storage and transport capacity in organic matter with noncircular pores. Fuel 2020, 268, 117288. [Google Scholar] [CrossRef]
- Pang, Y.; Hu, X.; Wang, S.; Chen, S.; Soliman, M.Y.; Deng, H. Characterization of adsorption isotherm and density profile in cylindrical nanopores: Modeling and measurement. Chem. Eng. J. 2020, 396, 125212. [Google Scholar]
- Huang, L.; Zhou, W.; Xu, H.; Wang, L.; Zou, J.; Zhou, Q. Dynamic fluid states in organic-inorganic nanocomposite: Implications for shale gas recovery and CO2 sequestration. Chem. Eng. J. 2021, 411, 128423. [Google Scholar] [CrossRef]
- Liu, J.; Zhang, T.; Sun, S. Mechanism Analysis of Shale Gas Adsorption under Carbon Dioxide–Moisture Conditions: A Molecular Dynamic Study. Energy Fuels 2022, 36, 14865–14873. [Google Scholar]
- Zhao, W.; Jia, C.; Zhang, T.; Jiang, L.; Li, X.; Jiang, Z.; Zhang, F. Effects of nanopore geometry on confined water flow: A view of lattice Boltzmann simulation. Chem. Eng. Sci. 2021, 230, 116183. [Google Scholar] [CrossRef]
- Fathi, E.; Akkutlu, I.Y. Lattice Boltzmann method for simulation of shale gas transport in kerogen. SPE J. 2013, 18, 27–37. [Google Scholar] [CrossRef]
- Li, J.; Wu, K.; Chen, Z.; Wang, K.; Luo, J.; Xu, J.; Li, R.; Yu, R.; Li, X. On the negative excess isotherms for methane adsorption at high pressure: Modeling and experiment. SPE J. 2019, 24, 2504–2525. [Google Scholar] [CrossRef]
- Garberoglio, G.; Skoulidas, A.I.; Johnson, J.K. Adsorption of gases in metal organic materials: Comparison of simulations and experiments. J. Phys. Chem. B 2005, 109, 13094–13103. [Google Scholar] [CrossRef] [PubMed]
- Song, Z.; Song, Y.; Guo, J.; Zhang, Z.; Hou, J. Adsorption induced critical shifts of confined fluids in shale nanopores. Chem. Eng. J. 2020, 385, 123837. [Google Scholar]
- Islam, A.W.; Patzek, T.W.; Sun, A.Y. Thermodynamics phase changes of nanopore fluids. J. Nat. Gas Sci. Eng. 2015, 25, 134–139. [Google Scholar] [CrossRef]
- Sedghi, M.; Piri, M. Capillary condensation and capillary pressure of methane in carbon nanopores: Molecular Dynamics simulations of nanoconfinement effects. Fluid Phase Equilibria 2018, 459, 196–207. [Google Scholar] [CrossRef]
- Yu, P.; Dempsey, D.; Archer, R. A three-dimensional coupled thermo-hydro-mechanical numerical model with partially bridging multi-stage contact fractures in horizontal-well enhanced geothermal system. Int. J. Rock Mech. Min. Sci. 2021, 143, 104787. [Google Scholar] [CrossRef]
- Sun, Z.; Huang, B.; Wang, S.; Wu, K.; Li, H.; Wu, Y. Hydrogen adsorption in nanopores: Molecule-wall interaction mechanism. Int. J. Hydrog. Energy 2023, 48, 33496–33508. [Google Scholar]
- Cao, M.; Hirose, S.; Sharma, M.M. Factors controlling the formation of complex fracture networks in naturally fractured geothermal reservoirs. J. Pet. Sci. Eng. 2022, 208, 109642. [Google Scholar] [CrossRef]
- Maurer, R.J.; Ruiz, V.G.; Camarillo-Cisneros, J.; Liu, W.; Ferri, N.; Reuter, K.; Tkatchenko, A. Adsorption structures and energetics of molecules on metal surfaces: Bridging experiment and theory. Prog. Surf. Sci. 2016, 91, 72–100. [Google Scholar] [CrossRef]
- Wu, S.; He, Y.; Wang, J. Molecular Resolution Imaging of Adsorption of Dodecane on a Lignite Surface by Frequency Modulation AFM. Energy Fuels 2022, 36, 11861–11872. [Google Scholar] [CrossRef]
- Zhang, K.; Jia, N.; Liu, L. CO2 storage in fractured nanopores underground: Phase behaviour study. Appl. Energy 2019, 238, 911–928. [Google Scholar]
- Humand, M.; Khorsand Movaghar, M.R. Critical temperature shift modeling of confined fluids using pore-size-dependent energy parameter of potential function. Sci. Rep. 2023, 13, 4842. [Google Scholar] [CrossRef]
- Zarragoicoechea, G.J.; Kuz, V.A. Critical shift of a confined fluid in a nanopore. Fluid Phase Equilibria 2004, 220, 7–9. [Google Scholar] [CrossRef]
- Feng, D.; Bakhshian, S.; Wu, K.; Song, Z.; Ren, B.; Li, J.; Hosseini, S.A.; Li, X. Wettability effects on phase behavior and interfacial tension in shale nanopores. Fuel 2021, 290, 119983. [Google Scholar]
- Shen, A.; Liu, Y.; Ali, S.F. A model of spontaneous flow driven by capillary pressure in nanoporous media. Capillarity 2020, 3, 1–7. [Google Scholar]
- Song, Y.; Song, Z.; Guo, J.; Feng, D.; Chang, X. Phase behavior and miscibility of CO2–hydrocarbon mixtures in shale nanopores. Ind. Eng. Chem. Res. 2021, 60, 5300–5309. [Google Scholar]
- Jin, B.; Bi, R.; Nasrabadi, H. Molecular simulation of the pore size distribution effect on phase behavior of methane confined in nanopores. Fluid Phase Equilibria 2017, 452, 94–102. [Google Scholar]
- Huang, J.; Yin, X.; Barrufet, M.; Killough, J. Lattice Boltzmann simulation of phase equilibrium of methane in nanopores under effects of adsorption. Chem. Eng. J. 2021, 419, 129625. [Google Scholar] [CrossRef]
- Wang, Y.; Aryana, S.A. Coupled confined phase behavior and transport of methane in slit nanopores. Chem. Eng. J. 2021, 404, 126502. [Google Scholar]


| Contributions | Approach | Pore Size | Surface Type | Inputted Contact Angle |
|---|---|---|---|---|
| Jin et al., 2017 [49] | Molecular simulation | Bulk | Graphite | 60° |
| Huang et al., 2020 [50] | Lattice Boltzmann Method | 10 nm | Contact angle is 76°, as reported | 76° |
| Wang and Aryana, 2021 [51] | Theoretical model | 5 nm | / | 90° |
Disclaimer/Publisher’s Note: The statements, opinions and data contained in all publications are solely those of the individual author(s) and contributor(s) and not of MDPI and/or the editor(s). MDPI and/or the editor(s) disclaim responsibility for any injury to people or property resulting from any ideas, methods, instructions or products referred to in the content. |
© 2024 by the authors. Licensee MDPI, Basel, Switzerland. This article is an open access article distributed under the terms and conditions of the Creative Commons Attribution (CC BY) license (https://creativecommons.org/licenses/by/4.0/).
Share and Cite
Wu, G.; Zeng, C.; Cheng, L.; Luan, J.; Zhang, R.; Chen, Z.; Pang, Y.; Sun, Z. The Influence of Wettability Effect and Adsorption Thickness on Nanoconfined Methane Phase Behavior: Vapor-Liquid Co-Existence Curves and Phase Diagrams. Processes 2024, 12, 215. https://doi.org/10.3390/pr12010215
Wu G, Zeng C, Cheng L, Luan J, Zhang R, Chen Z, Pang Y, Sun Z. The Influence of Wettability Effect and Adsorption Thickness on Nanoconfined Methane Phase Behavior: Vapor-Liquid Co-Existence Curves and Phase Diagrams. Processes. 2024; 12(1):215. https://doi.org/10.3390/pr12010215
Chicago/Turabian StyleWu, Guodai, Chunlin Zeng, Lijun Cheng, Jinhua Luan, Ruigang Zhang, Ziwei Chen, Yu Pang, and Zheng Sun. 2024. "The Influence of Wettability Effect and Adsorption Thickness on Nanoconfined Methane Phase Behavior: Vapor-Liquid Co-Existence Curves and Phase Diagrams" Processes 12, no. 1: 215. https://doi.org/10.3390/pr12010215
APA StyleWu, G., Zeng, C., Cheng, L., Luan, J., Zhang, R., Chen, Z., Pang, Y., & Sun, Z. (2024). The Influence of Wettability Effect and Adsorption Thickness on Nanoconfined Methane Phase Behavior: Vapor-Liquid Co-Existence Curves and Phase Diagrams. Processes, 12(1), 215. https://doi.org/10.3390/pr12010215