Article

The Contribution of Cornelian Cherry (Cornus mas L.) Alcoholic Beverages on the Sensory, Nutritional and Anti-Nutritional Characteristics—In Vitro and In Silico Approaches

by
Oskar Szczepaniak
1,2,
Barbara Stachowiak
3,
Henryk Jeleń
3,
Kinga Stuper-Szablewska
4,
Katarzyna Szambelan
3 and
Joanna Kobus-Cisowska
1,*
1
Department of Gastronomy Sciences and Functional Foods, Poznań University of Life Sciences, ul. Wojska Polskiego 28, 60-637 Poznań, Poland
2
Department of Biochemistry and Biotechnology, Poznań University of Life Sciences, ul. Dojazd 11, 60-632 Poznań, Poland
3
Department of Food Technology of Plant Origin, Poznań University of Life Sciences, ul. Wojska Polskiego 31, 60-624 Poznań, Poland
4
Department of Chemistry, Poznań University of Life Sciences, ul. Wojska Polskiego 28, 60-637 Poznań, Poland
*
Author to whom correspondence should be addressed.
Processes 2024, 12(1), 237; https://doi.org/10.3390/pr12010237
Submission received: 18 December 2023 / Revised: 16 January 2024 / Accepted: 18 January 2024 / Published: 22 January 2024

Abstract

:
Food producers have focused on novel and attractive raw materials with functional properties. Cornelian cherry (Cornus mas L.) fruits contain numerous compounds that may be beneficial for health. Objective: This study aimed to compare and assess the physicochemical properties and amygdalin levels in brandy and liquor prepared from frozen cornelian cherry fruits. Density functional theory-based B3LYP functionals were used to analyze the spectral and optical properties of amygdalin. The contents of the compounds and volatile products of amygdalin decay were found in two spirituose beverages of Cornus mas, using HPLC and GC-MS. Significant differences in their physicochemical properties were detected between the samples. Alcoholic beverages based on cornelian cherry fruits were rich in a wide range of functional ingredients with a low concentration of amygdalin. In silico analysis showed that orbital density diffusion has a major effect on the physical properties of amygdalin, while differences between the polarities of water and ethanol had no noticeable effect on the spectral properties of the compound. Cornelian cherry-based alcoholic drinks might be interesting functional products with rich aromatic bouquets. The amygdalin concentration is low enough to pose no toxicological threat, but rather shapes the tastory bouquet of the products. Levels of amygdalin may be controlled using the same analytical methods for solutions with different ethanol–water ratios.

1. Introduction

Brandies and liquors are high-strength alcoholic beverages prepared via maceration processes. They have been commonly manufactured since ancient times by crafters and in households from local fruits and herbs. Despite the rising popularity of these beverages, few dedicated scientific papers have been published. However, the available literature on this subject shows a high concentration of bioactive compounds and high biological activity for both brandies and liquors. Phenolic compounds predominate in the bioactive compound fraction of fruit brandies [1,2]. Moreover, bioactivity may differ depending on the raw materials used, the recipes and the storage conditions [3]. Numerous epidemiological studies have shown significant relationships between the consumption of plant polyphenols and a lower incidence of cancer, cardiovascular disease, diabetes, osteoporosis and neurodegenerative disease [4]. A key mechanism of action of polyphenols is the ability to inhibit radical reactions and the chelation of ions responsible for radical generation [5]. Compared with other popular alcoholic beverages, brandies have a polyphenolic content similar to that of red wines, but significantly greater than that of white wines and beers. Nonetheless, brandies are drunk in smaller quantities, due to their higher concentration of ethyl alcohol [6,7].
Fruit liquors and brandies have become popular commodities in numerous countries, and their market has become diverse due to local customs, drinking culture and legal frameworks of spirit production. The local customs of liquor preparation are usually linked with regional ingredients and flavors [8]. In Eastern Europe, herbal liquors predominate, while in the Mediterranean countries the most popular are products based on citrus fruits. As the liquor market is highly diverse, producers seek unique and authentic products to attract consumers’ attention [9]. The interest in local, unique products is a key success factor of small distilleries and manufacturers, which focus on producing high-quality liquors with exquisite flavors. The other trend is organic products due to the growing interest in green solutions. Consumers are also becoming more and more open to tasting new flavors, which leads to the launching of novel products on the market [8,10].
Amygdalin is naturally present in the kernels of Rosaceae plants, such as quince, bird cherry, almond, apricot, peach, cherry and plum. It is also present in trace amounts in the flesh of several fruits (blueberries, blackberries, chokeberries, cranberries, strawberries, raspberries, dogwood) and in cashew, macadamia and almond nuts [11]. Amygdalin (PubChem CID 2180) is a cyanogenic glycoside. The metabolic pathway transforms it in the body to hydrogen cyanide and benzaldehyde. The toxicity of HCN results from its ability to inhibit oxidative phosphorylation. The binding of cyanide anions to Fe3+ in the active center of cytochrome oxidase leads to hypoxia [12]. Intoxication with amygdalin may lead to diarrhea, vomiting, abdominal pain, and in most severe cases, to death. However, the lethal dose is relatively high compared to the concentration in plant kernels. Depending on the source, it estimated to be between 0.5 and 3.5 mg/kg body weight.
A significant portion of cyanides are detoxified in liver mitochondria via the sulfur-transferase enzyme (E.C. 2.8.1.1) to thiocyanates that are further excreted in urine. Another detoxification mechanism involves the formation of cyanocobalamin as an intermediate, and then the oxidation of CN ions to formates and CO2.
The bioavailability of amygdalin and its toxicity in the body depend on its source, from which it is consumed [13]. The majority of fruit kernels, e.g., raspberry or strawberry seeds, are not digested in the body. Thus, amygdalin is not absorbed and is secreted with the kernels. Moreover, stone fruits (e.g., plums, cherries) are consumed without kernels. Consequently, the vast majority of fruits are poor sources of amygdalin. Amygdalin is also found in tinctures and beverages prepared with stone fruits.
The toxicity of amygdalin was studied in relation to its concentration in different foods and beverages, and in terms of potential anti-cancer and anti-infection effects. This trial of amygdalin application started in Russia in 1845, when high toxicity and poor results were noted. Further research conducted in Germany in 1892 also resulted in the termination of any treatment with the compound [14]. In the 1920s, in the United States, a danger to human health posed by amygdalin was confirmed. However, thirty years later, an intravenous version of amygdalin was patented and certified to be safe for humans [15]. Then, The National Cancer Institute analyzed the amygdalin preparation produced by Cyto Pharma, and discovered that oral and intravenous forms did not meet American regulations on pharmaceutical safety. Recently, the European Food Safety Authority (EFSA) updated in 2019 the scientific opinion on the health risk of cyanogenic glycosides limits in foods, excluding apricot kernels [16]. EFSA stated that the acute reference dose (ARfD) of 20 μg cyanide/kg body weight should have no severe effects. However, this ArfD may be exceeded with the administration of linseed, almonds and cassava, which are rich in cyanogenic glycosides. Nonetheless, there are still no legal regulations regarding amygdalin levels in liquors.
Although the solubility of amygdalin is relatively high in water and ethanol, it is fragile to acidic hydrolysis and conversion to neoamygdalin during the extraction of the raw material, and during product storage. Due to the presence of amygdalin and its products of decay, the beverages referred to above have a specific bitter flavor. Moreover, the amygdalin content in these products is relatively low. Thus amygdalin poses no toxicological threat. Nonetheless, amygdalin may affect the other properties of a food product. Another key determinant of the properties of the final beverage is the method of maceration or extraction. The chemical structures of compounds found in a food matrix differ. Interactions with other food ingredients have not been fully determined, and this issue is pivotal in designing the production process. Polyphenols are highly labile to oxidation. High temperatures and alkaline conditions accelerate the degradation of these compounds. Therefore, the preparation of raw material and the extraction process are key factors determining the ingredients and properties of the final food product.
Due to rising consumer interest in cornelian cherry food products, this study aimed to assess the properties of the most popular Cornus mas products, i.e., brandy and liquor.
The product of amygdalin decay may affect the aroma profile of the beverages. Moreover, the auxiliary aim of the study was to validate the spectral and physical properties of amygdalin, which might be useful in preparing the maceration process and controlling amygdalin levels. We assumed that the properties of amygdalin in water and ethanol should be similar enough to relate them to the properties of amygdalin in spirit matrices based on differences in water–ethanol ratio.

2. Material and Methods

2.1. Cornelian Cherry Liquors

The raw materials were prepared from ripe fruits of the cornelian cherry cultivar (cv.) Szafer, collected from the “Szynsad” orchard in Dąbrówka, Nowa, Błędów, Mazowieckie, Poland (51°47′01″ N 20°43′04″ E). The final products examined were cornelian cherry liquor and brandy, manufactured by hBp-Likvor CLP (Pniewy, Poland) according to a method developed by the authors [17]. We designed two different types of product: brandy and liquor. For the brandy, fruits were initially frozen at −20 °C before they being subjected to the maceration stage. Frozen C. mas fruits were macerated at a ratio of 1.5 kg of fruit per 1 L of 70% ethanol. The liquor was prepared by the remaceration of fruits used for the preparation of brandy, with the addition of inverted saccharose at a ratio of 5 g inverted saccharose per 8 g fruits. The whole mixture was dissolved in 1 L of 70% ethanol. The maceration of the liquor lasted 60 days. The prepared beverages were bottled in capped bottles made of translucent glass. After that, they were kept at ambient temperature out of daylight until the analyses.

2.2. Analytical Methods

2.2.1. Basic Physicochemical Parameters

The ethanol content was first determined using the Super Dee Digital Distillator (Gibertini, Novate Milanese, Italy), and then with a DDM 2909 Automatic Density Meter (Rudolph Research Analytical, Hackettstown, NJ, USA), according to the officially recognized AOAC alcohol table. For each sample, the test was repeated in triplicate and the final value was provided in % v/v. The volatile compounds in the tested beverages were verified on a Hewlett Packard HP 6890 (Waldbronn, Germany) gas chromatograph with two flame ionization detectors (FIDs), a single split/splitless inlet, and an autoinjector. The volatile compounds were separated using two capillary columns (CPWax 57CB, 60 m × 0.25 mm × 0.4 µm; and DB-624, 60 m × 0.25 mm × 1.4 µm). The chromatographic equipment and analysis conditions were described by He et al. [18]. The results have been expressed as mg/L 100% spirit (recalculated to ethanol content) and compared with Polish and European standards [19,20].
Th residue extract content after distillation was determined according to the density method using a DDM 2909 Automatic Density Meter and run in triplicate for each sample. The final values have been given in Brix degrees (Bx).
The pH values of the tested beverages were determined using a CP-411 pH meter (Elmetron, Zabrze, Poland). Each sample was measured three times. The relative viscosity of the tested samples was measured with an Ubbelohde viscometer using a ViscoClock viscosity measuring unit (Schott, Mainz, Germany). Distilled water was used as a reference liquid for the calculation of relative viscosity. Each sample was measured three times.
The color of the tested beverages was examined using a PCE-CSM 3 colorimeter (China) set in CIE L*a*b* units.

2.2.2. Amygdalin Concentration

The amygdalin concentration in the liquor and the brandy was measured according to a modification of the method described by Miao et al. [21]. The tested beverages were first filtered through 45 µm filter disks to chromatographical vials, and then placed in an autosampler with a temperature of 4 °C. The concentration measurement of amygdalin was performed using an Agilent 1260 high-performance liquid chromatograph (USA) with a UV-VIS detector. The samples were separated at 25 °C using a Phenomenex Luna column (4.6 mm × 250 mm, 5 μm). The analysis ran in an isocratic elution. The eluent was a mixture of acetonitrile (Sigma Aldrich, Germany) and water 15:85 v/v at a flow rate of 0.8 mL/min. The analysis time was 20 min, followed by 10 min of column flushing with eluent at a flow rate of 1.0 mL/min and 5 min of column conditioning before the next analysis. Test samples were applied to the column at a quantity of 20 μL. The amygdalin concentration was determined using a standard curve (r2 = 0.990) based on the peak areas recorded for standard amygdalin solutions (Sigma Aldrich) at λ = 214 nm. Amygdalin showed a peak at a retention time of 9.5 min. Each trial was analyzed in triplicate. The final results are expressed in mg/L.

2.2.3. In Silico Calculation of Amygdalin Properties and UV-VIS Spectra

All calculations were performed using Gaussian G16W software with a GaussView 6 graphical editor. First, the structure of amygdalin was generated and optimized using the hybrid Lee, Parr and Young potential and the B3LYP/6–31+G(2d,2p) functional base. After the optimization of the structure, the model of amygdalin was subjected to the calculation of UV-VIS spectra, optical rotation, and single point energy. UV-VIS spectra were predicted for singlet-only excitation states in the TD-SCF model, and the PCM solvation model was used. All simulations were performed using B3LYP hybrid functional 4-Slater-type functional bases: 6–31+G(2d,2p), 6–31++G(2d,2p), 3–21+G* and 3–21G. Simulations were performed for models with the addition of the solvent effect of water or ethanol, or without such correction (gas-state).

2.2.4. Determination of Polyphenol Concentrations

Phenolic acids and flavonoids were quantitatively evaluated in the tested samples according to the method of Stuper-Szablewska et al. [22]. The tested samples of the liquor and brandy were subjected to alkaline and acidic hydrolysis before chromatographic determination. The analysis was performed using an Acquity H class UPLC system (USA) with a Waters Acquity PDA detector. As a stationary phase, an Acquity UPLC® BEH C18 column (100 mm × 2.1 mm, particle size 1.7 µm) (Waters, Ireland) was used. The elution was carried out in a gradient with the following composition: A, acetonitrile with 0.1% formic acid; B, 1% aqueous formic acid mixture (pH = 2), given with a flow rate of 0.4 mL/min. The internal standard method was used to detect the individual compounds. The detection was performed at wavelengths λ = 320 nm and 280 nm, and the results were expressed as mg/100 g DM. Compounds were identified based on comparing the retention time of the analyzed peak with the retention time of the chromatographic standard. The detection limit for individual compounds was 1 µg/g DM. The retention times for phenolic acids (PubChem CID numbers in paratheses) were as follows: protocatechuic acid (72) 1.56 min, gallic acid (370) 4.85 min, p-coumaric acid (637542) 8.06 min, 2,5-dihydroxybenzoic acid (3469) 9.55 min, 4-hydroxybenzoic acid (135) 9.89 min, chlorogenic acid (1794427) 12.00 min, caffeic acid (689043) 15.20 min, syringic acid (10742) 15.60 min, sinapic acid (637775) 17.10 min, ferulic acid (445858) 19.00 min, salicylic acid (338) 17.85 min, trans-cinnamic acid (444539) 20.00 min, and vanillic acid (8468) 21.05 min. The retention times for flavonoids were as follows: apigenin (5280443) 1.10 min, vitexin (5280441) 8.00 min, kaempferol (528063) 11.00 min, luteolin (5280445) 16.90 min, quercetin (5280343) 17.00 min, naringenin (932) 17.50 min, rutin (5280805) 19.00 min, and catechin (9064) 19.50 min.

2.2.5. Chlorophyll and Total Carotenoid Fractions

Chlorophyll A (CA), chlorophyll B (CB) and total carotenoid (TC) concentrations were determined using the spectrometry method according to the Abou-Arab method [23]. The absorbance of the samples was measured at three wavelengths—440 nm (A440); 644 nm (A644) and 662 nm (A662)—using a Specord S40 spectrophotometer (Analytik Jena, Jena, Germany) and a 10 mm cuvette.
CA, CB and TC concentrations (mg/L) were determined using the following equations:
C A = 9.784 × A 662 0.99 × A 644
C B = 21.426 × A 644 4.65 × A 662
T C = 4.695 × A 440 0.369 × ( C A + C B )

2.2.6. Antiradical Capacity

The antioxidant activity was evaluated against ABTS and independently against DPPH radicals.
The ABTS scavenging test was conducted via a modification of the method developed by Re et al. [24], which has been fully described in our previous work [17]. The measurements were taken as follows: 20 μL of the tested beverage was added to 980 µL of the ABTS radical solution. Absorbance values were recorded precisely 40 s after the sample addition, and compared against the blank, which was 980 μL ABTS solution. The antioxidant potential of each sample was measured in triplicate, and the final values were expressed as mmol Trolox equivalents (TE)/L extract. For the calibration curve (r2 = 0.9508), we applied Trolox standard solutions (100–1000 μM).
A methanolic solution of DPPH was used as part of an alternative method of visualizing the antioxidant activity. The test was conducted using O’Sullivan et al.’s method [25]. The sample absorbance was recorded at λ = 515 nm (Meterech SP 880, Taiwan). The respective concentrations of Trolox (Sigma-Aldrich, Germany) were used as standards to construct a calibration curve (r2 = 0.9948). The results are expressed as mM Trolox.

2.3. Statistical Analysis

One-way ANOVA was used to present the significant differences between the tested samples in terms of tested parameters using the least significant difference (LSD). An α value lower than 0.05 was assumed as the level of significance. Statistical analyses were performed using Origin Pro 2021 (Germany).

3. Results and Discussion

The two tested spirits showed significant differences in color, extract residue after alcohol vaporization and relative viscosity (Table 1). Liquor was also found to be more reddish and greenish (higher a* and b* values), which provided the overall characteristic straw color. However, the overall color comparison, represented by the ΔE value, revealed that the differences between both tested beverages were not significant according to the CIE L*a*b* system guidelines. The differences in color may result from the ratio of total carotenoids, flavonoids and anthocyanins extracted from the matrix. Differences observed in the contents of extracts from the beverages after alcohol vaporization (39.0 Bx for liquor and 17.0 for Bx for brandy) may support this claim. The relative viscosity could be directly affected by the difference in water–ethanol ratios between both tested beverages.
The prepared beverages had noticeable sweet and fruity sensory bouquets, with a characteristic break of tart flavor for the liquor and only sour for the brandy. These sour and tart notes are characteristic of the cornelian cherry taste [26]. From the point of view of the potential manufacturer of the product, the two prepared alcoholic beverages have interesting sensory bouquets, which could interest the consumer.
Also important is the lack of bitterness perceived, which discouraged some of the evaluators from tasting both products. The perception of bitterness in foods depends on the presence of compounds that interact with bitter taste receptors located on tongue. Overall, 25% of the human population has an overactive TAS2R38 gene, which makes them very sensitive to bitter tastes. This was reflected in the lower consumption of vegetables (by 200 portions) in this group [27,28].
The production process of alcoholic beverages comprises not only basic ingredients, i.e., spirtuose and treated water, but also aroma and flavor additives [29,30,31,32]. Plant aromas may be added in the form of distillates, macerates or tinctures. The aromatization process may also precede the distillation. The plant ingredients are key aroma additives in the production of herbal spirituoses, as well as in bitters and spiced vodkas [32]. The selection of materials, their proportions, and their aroma extraction methods allow the creation of unique recipes for alcoholic beverages, affording them unique tastes and flavors [30,32].
The highest SP energy was noted for amygdalin in the gas state (Table 2). Water and ethanol decreased the internal energy of the molecule, due to the diffusion of electron density between the molecules of the amygdalin and solvent. The key role in diffusion may be played by the hydroxyl groups in hexose moieties of amygdalin. The localization of OH groups in alternating axial/equatorial conformations may facilitate the formation of hydrogen bonds between the groups and the solvent. The observed SP value, which was lower for water than for ethanol, may confirm this hypothesis.
Additionally, differences observed in optical rotation and UV-VIS spectra may suggest such a mechanism. For water, the lowest α values were observed (96.36° for 6–31+g(2d,2p)), and for the gas state, these values were the highest (100.41° for the same base function). The UV-VIS spectrum of amygdalin exhibited three peaks in the ultraviolet range. The first peak can be observed at 232 nm, but the most intense peak was located at 235 nm. Both water and ethanol cause a solvatochromic effect, shifting the first two peaks toward the high-energy regions of UV-VIS spectra (Table 2). Because the solvation effect on the overall molecule was the opposite, these two peaks must be characteristic of the hydrophobic part of amygdalin, i.e., the phenyl ligand. However, the intensity of the 235 nm peak increased along with the hypochromic shift. This may show that the excitation state specific to this peak occurs more easily in the presence of a polar solvent. Such behavior is rather characteristic of the cyanide group. The last peak observed at 240 nm occurred with few bathochromic effects in the presence of ethanol and water. The lack of additional diffusion potential in the 3–21+g basis set resulted in differences in spectral and optical rotations compared to the results obtained for 3–21+G*. This indicates that there is no observable effect of the polar solvent on the diffusion of electron density, especially for those electrons located at the hydroxyl ligands of dextrose groups.
Taking these findings into account, calculations were performed without additional correction for polarity in 6–31G (6–31++G(2d,2p)). After including the additional base set in the proposed model, the calculated results were comparable with the 6–31++G(2d,2p) base set. This shows the special role played by virtual orbitals in the diffusion of energy density, which is also associated with the photoelectric properties observed in UV-VIS spectra and optical rotation. Aharon and Caricato [33] showed that the use of 3–21G base sets with the addition of aug-cc-pVDZ and aug-cc-pVTZ in the calculation of the optical polarity of various chiral compounds resulted in a low level of error (approx. 4%) compared with their real optical densities. Moreover, Suendo and Viridi [34] reported that in an analysis of TD-DFT 6–31++G(d,p), a correction factor of 0.844 must be considered, but the application of the PCM solvent model decreased the error value not only for TD-DFT 6–31++G(d,p) but also in other discussed functionals. However, this error decrease was rather small, which corresponds with the findings of the presented study, indicating that the effect of solvent polarity is not a major factor.
The predicted bonds for amygdalin may correspond well with the actual ones (Table 2). In both models, the amygdalin maximum oscillates between 233 and 234 nm. This result may suggest that the determination of amygdalin content using UV-VIS detectors should be performed at an analytical wavelength of 235 nm, rather than the routine 215 nm, as described in Section 2.2.1. What is more, the simulated UV-VIS spectra and α values are similar for models including the polarity effects of water and ethanol. Thus, all analytical methods involving the testing of amygdalin in pure water and ethanol–water matrices can be compared without the need to change the analytical wavelength. All the models prepared in this study oscillate satisfactorily within this range.
In the tested beverages, a low concentration of amygdalin was confirmed (Table 3). The mean concentration of amygdalin in brandy was above 10 mg/L, while the remaceration of C. mas fruits resulted in trace concentrations of amygdalin in the liquor (under 2 mg/L). This difference shows that the first maceration of the cornelian cherry fruits resulted in a high yield of extracted amygdalin. The remaceration process used in the preparation of liquor could involve amygdalin decay and enanciomerization, which has been described below in the theoretical introduction section of this paper. The amygdalin level detected in the brandy was similar to that in the cherry liquor analyzed by Senica et al. (16 mg/L). Nonetheless, various unit operations under the material may lead to significant losses of amygdalin, and therefore, lower toxicity.
The measured local maxima in the tested alcoholic beverages show that the predominant compounds in the liquor were catechin (301 mg/L), naringenin (281 mg/L), rutin (106 mg/L) and quercetin (115 mg/L). The cornelian cherry brandy was rich mostly in the same compounds, but at higher concentrations (345, 378, 169 and 201 mg/L, respectively), which may indicate that the higher ethanol ratio in the macerate facilitated the extraction of flavonoids, but not the extraction of amygdalin. The preparation of alcoholic beverages affects not only their sensory properties but also their bioactivity. In our previous work [35], we observed that the freezing of cornelian cherry fruits may have a positive effect on the yield of the process. Tinctures prepared with frozen fruits resulted in higher dry mass and ash content, but had no effect on the total content of polyphenols. However, a tincture prepared with frozen fruits was a better radical-scavenger than a tincture made of nonfrozen fruits.
The cornelian cherry liquor and brandy distillates were characterized by an ethanol content representing 99.58% and 99.77% of all volatile compounds, respectively. The aldehyde concentrations in the two samples (156.90 and 158.09 mg/L) were not significantly different (p < 0.05) (Table 4) and complied with the requirements for raw fruit spirits (<0.2 g/L of spirit 100%; PN-A-79523). Tesević et al. [20] noted a slightly higher average concentration of acetaldehyde of 18.96 g/hL (189.60 mg/L) in alcoholic beverages obtained from the fruits of cornelian cherry. However, the concentration of alcohols in cornelian cherry liquor (17.53 mg/L) was significantly (p < 0.05) higher than in cornelian cherry brandy (7.23 mg/L), but both values are below the acceptable standard (<4.0 g/L of raw fruit spirit 100% and <1.0 g/L of spirit 100% for liquors). Higher average values of alcohols (327.80 g/hL) were detected by Tesević et al. [36]. Methanol accounted for the largest percentage of all the other volatile compounds in both liquor (0.19%) and brandy (0.10%) (Figure 1). The methanol levels determined in this study were lower than those determined by both Tesević et al. [20] (613 g/hL) and Alonso et al. [37] (113.9–349.6 g/hL). The contents of methanol (342.15 and 264.31 mg/L for cornelian cherry liquor and brandy, respectively) were in line with the maximum limit for methanol in fruit distillates, which is 1000 g/hL of 100% spirit (EC 110/2008) [19] and 0.8 g/L in raw fruit spirit (PN-A-79523) [20].
Significant differences in antiradical capacity were observed between the liquor and the brandy (Table 5). The tested beverages scavenged DPPH radicals more efficiently than ABTS cationic radicals (over 125-fold better for liquor). What is more, the brandy, which was a better ABTS-scavenging agent, was found to be threefold less effective at quenching DPPH radicals than the liquor. These differences may result from various concentrations of the bioactive compounds in these two beverages. In the preliminary study [35], the antiradical activities of ABTS and DPPH were 12.1 and 14.5 mM Trolox, respectively. The tenfold higher DPPH scavenging strength obtained in this study may be attributed to the difference in ethanol–water ratios. In a study by Sun et al. [38], 75% ethanol was the best solvent for obtaining a high-antiradical extract with a total phenolic count of 164.2 mg gallic acid per g and a total flavonoid content of 282.8 mg rutin per g. The ABTS and DPPH results were similar in low-alcoholic Cornus-mas-based fermented beverages and worts [39]. However, in the case of fermented products, anti-radical capacity changes with fermentation time and the concentration of secondary metabolites [40]. Moreover, the results collected for the alcoholic beverages in this study are also in line with those from our previous paper dedicated to the antioxidant activity of aqueous and 40%-ethanol extracts of cornelian cherry fruits. In that work, the ABTS results were noticeably related to electron-transfer activity measured using cycle voltammetry (CV) and square-wave voltammetry (SWV) techniques. This tendency results from the single-electron transfer (SET) mechanism, which plays a key role in ABTS and DPPH scavenging tests [41]. However, according to Ivanova et al. [42], DPPH also involves a hydrogen active transfer (HAT) mechanism, which could result in a negative relationship with the CV and SWV findings. As part of the side reactions between the extract constituents, an oxygen may have been recorded and affected the overall electrochemical signal.
Additionally, we noted a negative relationship between ABTS- and DPPH-scavenging activities. However, this contradiction may originate from the different tendencies of secondary plant metabolites to react with a single radical rather than from any side reaction affecting the measurement. In our previous paper, we noted a relationship between ABTS-scavenging results and total phenolic count measured using the Folin–Ciocalteu reagent [17]. The reagent’s activity is based on SET, similar to ABTS. For the Folin–Ciocalteu reagent, ellagic acid, quercetin, and rutin showed strong interactions, while the highest activity against ABTS was noted for flavanol monomers and oligomers [43,44]. However, quercetin also had high activity against ABTS in the cited study.
Meanwhile, the highest activities against DPPH were noted for chlorogenic acid, quercetin 3-(malonylglycoside), rutin and isoquercetin [45]. On the other hand, Platzer et al. [44] observed the highest activity against DPPH for flavanol oligomers. Also, other works have shown that tannins play a key role in DPPH scavenging [46,47]. However, we did not analyze the prepared alcoholic beverages for tannin content, and so we cannot confirm this tendency.
Cinnamic acid derivatives may also be very potent antioxidants due to their ability to act via the HAT mechanism, forming a stable phenoxyl radical [48,49]. The high-DPPH activity of the liquor may have resulted from the presence of cinnamic acid, as the content of this compound was significantly higher that in the brandy (Table 3).

4. Conclusions

Cornelian cherry (Cornus mas L.) may be a good raw material for alcohol production. The use of frozen C. mas fruits allowed the preparation of two products in a single process, which may be consistent with a “zero waste” strategy. After the first maceration, the fruits are subjected to a subsequent process with the addition of inverted saccharose. Thus, it is possible to obtain a product with a high antiradical effect and high content of polyphenols. Recycling the fruits after the first maceration process allows the development of a new product with noticeable functional and sensory properties and with low amygdalin content.
The modeling of amygdalin showed that its optical and spectrochemical properties are similar to those of water and ethanol solvents, which enables the application of methods of amygdalin determination to all ethanol–water matrices with no difference in the ratio of the solvents. Also, the fact that the maximum value of amygdalin absorption is 235 nm should be considered in the design of future chromatographic and spectrochemical methods.
The prepared liquor showed significantly higher antioxidant activity against DPPH and the concentration of volatile compounds. Although almost no perceivable differences were found between the two spirits in terms of their smell and aroma, the prepared brandy had a stronger sensory bouquet and more intense and appealing colors.
To conclude, we obtained two interesting alcoholic beverages from one raw material, which could satisfy the demands of different customers, and may be produced in one manufacturing process.

Author Contributions

Conceptualization: J.K.-C.; data curation: O.S. and K.S.; formal analysis: O.S. and K.S.; funding acquisition: J.K.-C.; investigation: O.S., H.J., K.S.-S. and K.S.; methodology: O.S., H.J. and K.S-S.; project administration: B.S. and J.K.-C.; resources: B.S. and J.K.-C.; software: O.S.; supervision: J.K.-C.; validation: B.S.; visualization: O.S.; writing—original draft: O.S., B.S. and K.S.; writing—review and editing: B.S. and J.K.-C. All authors have read and agreed to the published version of the manuscript.

Funding

This work was co-financed as a development application project (J.K-C.): “Functional chocolate lines with cornelian cherry fruit preparations as a matrix for pro-health ingredients”, conducted within the “Innovation Incubator” program, realized as part of the out-competition project of the Ministry of Science and Higher Education: “Support in scientific research management and commercialization of R&D results in research units and enterprises”, co-financed with resources of the European Union under the Smart Growth Operational Program 2014–2020 (Act 4.4) MNiSW/2019/170/RID.

Data Availability Statement

Raw data of in silico results is available in the RepOD database at the link https://doi.org/10.18150/TYNBQT (Accessed on 20 January 2024). All other data will be available from the corresponding author on reasonable request.

Conflicts of Interest

The authors declare no conflicts of interest.

References

  1. Coldea, T.E.; Socaciu, C.; Mudura, E.; Socaci, S.A.; Ranga, F.; Pop, C.R.; Vriesekoop, F.; Pasqualone, A. Volatile and Phenolic Profiles of Traditional Romanian Apple Brandy after Rapid Ageing with Different Wood Chips. Food Chem. 2020, 320, 126643. [Google Scholar] [CrossRef]
  2. López, F.; Rodríguez-Bencomo, J.J.; Orriols, I.; Pérez-Correa, J.R. Fruit Brandies. In Science and Technology of Fruit Wine Production; Elsevier Inc.: Amsterdam, The Netherlands, 2017; pp. 531–556. ISBN 9780128010341. [Google Scholar]
  3. Alamprese, C.; Pompei, C. Influence of Processing Variables on Some Characteristics of Nocino Liqueur. Food Chem. 2005, 92, 203–209. [Google Scholar] [CrossRef]
  4. Graf, B.A.; Milbury, P.E.; Blumberg, J.B. Flavonols, Flavones, Flavanones, and Human Health: Epidemiological Evidence. J. Med. Food 2005, 8, 281–290. [Google Scholar] [CrossRef] [PubMed]
  5. Pandey, K.B.; Rizvi, S.I. Plant Polyphenols as Dietary Antioxidants in Human Health and Disease. Oxid. Med. Cell Longev. 2009, 2, 270–278. [Google Scholar] [CrossRef] [PubMed]
  6. Simonetti, P.; Pietta, P.; Testolin, G. Polyphenol Content and Total Antioxidant Potential of Selected Italian Wines. J. Agric. Food Chem. 1997, 45, 1152–1155. [Google Scholar] [CrossRef]
  7. Lugasi, A. Polyphenol Content and Antioxidant Properties of Beer. Acta Aliment. 2003, 32, 181–192. [Google Scholar] [CrossRef]
  8. Gupta, A.; Sanwal, N.; Bareen, M.A.; Barua, S.; Sharma, N.; Joshua Olatunji, O.; Prakash Nirmal, N.; Sahu, J.K. Trends in Functional Beverages: Functional Ingredients, Processing Technologies, Stability, Health Benefits, and Consumer Perspective. Food Res. Int. 2023, 170, 113046. [Google Scholar] [CrossRef]
  9. Finassi, C.M.; Calixto, L.A.; Segura, W.; Bocato, M.Z.; Barbosa Júnior, F.; Fonseca, F.L.A.; Lamy, E.; Castelo, P.M. Effect of Sweetened Beverages Intake on Salivary Aspartame, Insulin and Alpha-Amylase Levels: A Single-Blind Study. Food Res. Int. 2023, 173, 113406. [Google Scholar] [CrossRef]
  10. Tamayo-Sánchez, J.C.; Meza-González, D.A.; Warren-Vega, W.M.; Zárate-Guzmán, A.I.; Romero-Cano, L.A. Advances in the Development of Tailor-Made Color Alcoholic Beverages Based on an Accelerated Maturation Process. Food Res. Int. 2023, 169, 112859. [Google Scholar] [CrossRef]
  11. Toomey, V.M.; Nickum, E.A.; Flurer, C.L. Cyanide and Amygdalin as Indicators of the Presence of Bitter Almonds in Imported Raw Almonds. J. Forensic Sci. 2012, 57, 1313–1317. [Google Scholar] [CrossRef]
  12. Hamel, J. A Review of Acute Cyanide Poisoning with a Treatment Update. Crit. Care Nurse 2011, 31, 72–82. [Google Scholar] [CrossRef] [PubMed]
  13. Shim, S.M.; Kwon, H. Metabolites of Amygdalin under Simulated Human Digestive Fluids. Int. J. Food Sci. Nutr. 2010, 61, 770–779. [Google Scholar] [CrossRef] [PubMed]
  14. Barakat, H.; Aljutaily, T.; Almujaydil, M.S.; Algheshairy, R.M.; Alhomaid, R.M.; Almutairi, A.S.; Alshimali, S.I.; Abdellatif, A.A.H. Amygdalin: A Review on Its Characteristics, Antioxidant Potential, Gastrointestinal Microbiota Intervention, Anticancer Therapeutic and Mechanisms, Toxicity, and Encapsulation. Biomolecules 2022, 12, 1514. [Google Scholar] [CrossRef] [PubMed]
  15. Song, Z.; Xu, X. Advanced Research on Anti-Tumor Effects of Amygdalin. J. Cancer Res. Ther. 2014, 10, 3. [Google Scholar] [CrossRef] [PubMed]
  16. Schrenk, D.; Bignami, M.; Bodin, L.; Chipman, J.K.; del Mazo, J.; Grasl-Kraupp, B.; Hogstrand, C.; Hoogenboom, L. (Ron); Leblanc, J.C.; Nebbia, C.S.; et al. Evaluation of the Health Risks Related to the Presence of Cyanogenic Glycosides in Foods Other than Raw Apricot Kernels. EFSA J. 2019, 17, e05662. [Google Scholar] [CrossRef] [PubMed]
  17. Szczepaniak, O.M.; Ligaj, M.; Kobus-Cisowska, J.; Maciejewska, P.; Tichoniuk, M.; Szulc, P. Application for Novel Electrochemical Screening of Antioxidant Potential and Phytochemicals in Cornus mas Extracts. CYTA-J. Food 2019, 17, 781–789. [Google Scholar] [CrossRef]
  18. He, X.; Gaca, A.; Jeleń, H.H. Determination of Volatile Compounds in Baijiu Using Simultaneous Chromatographic Analysis on Two Columns. J. Inst. Brew. 2020, 126, 206–212. [Google Scholar] [CrossRef]
  19. (EC) No 110/2008; Regulation (EC) No 110/2008 of the European Parliament and of the Council of 15 January 2008 on the Definition, Description, Presentation, Labelling and the Protection of Geographical Indications of Spirit Drinks and Repealing Council Regulation (EEC) No 1576/89. Official Journal of the European Union: Luxembourg, 2008.
  20. Polish Standard PN-A-79523: 2002; Raw Spirits. Polish Committee for Standardisation: Warsaw, Poland, 2002.
  21. Miao, X.; Zhao, Z.; Zhu, H.; Li, M.; Zhao, Q. Comparison of Second-Derivative Spectrophotometry and HPLC for Determination of Amygdalin in Wild Apricot Kernels. ScienceAsia 2013, 39, 444–447. [Google Scholar] [CrossRef]
  22. Stuper-Szablewska, K.; Kurasiak-Popowska, D.; Nawracała, J.; Perkowski, J. Response of Non-Enzymatic Antioxidative Mechanisms to Stress Caused by Infection with Fusarium Fungi and Chemical Protection in Different Wheat Genotypes. Chem. Ecol. 2017, 33, 949–962. [Google Scholar] [CrossRef]
  23. Abou-Arab, A.E.; Abou-Arab, A.A.; Abu-Salem, M.F. Physico-Chemical Assessment of Natural Sweeteners Steviosides Produced from Stevia Rebaudiana Bertoni Plant. Afr. J. Food Sci. 2010, 4, 269–281. [Google Scholar] [CrossRef]
  24. Re, R.; Pellegrini, N.; Proteggente, A.; Pannala, A.; Yang, M.; Rice-Evans, C. Antioxidant Activity Applying an Improved ABTS Radical Cation Decolorization Assay. Free Radic. Biol. Med. 1999, 26, 1231–1237. [Google Scholar] [CrossRef]
  25. O’Sullivan, A.M.; O’Callaghan, Y.C.; O’Connor, T.P.; O’Brien, N.M. Comparison of the Antioxidant Activity of Commercial Honeys, before and after in-Vitro Digestion. Pol. J. Food Nutr. Sci. 2013, 63, 167–171. [Google Scholar] [CrossRef]
  26. Szczepaniak, O.M.; Kobus-Cisowska, J.; Kusek, W.; Przeor, M. Functional Properties of Cornelian Cherry (Cornus mas L.): A Comprehensive Review. Eur. Food Res. Technol. 2019, 245, 2071–2087. [Google Scholar] [CrossRef]
  27. Li, J.; Peng, S.; Huo, M.; Cao, Y.; Chen, Z.; Zhang, Y.; Qiao, Y. Discovery of the Relationship between Bitter Taste and Bitter Flavor (Efficacy) Based on HTAS2Rs. J. Tradit. Chin. Med. Sci. 2023, 10, 170–178. [Google Scholar] [CrossRef]
  28. Lu, Z.; Xie, G.; Wu, D.; Yang, L.; Jin, Z.; Hu, Z.; Xu, X.; Lu, J. Isolation and Identification of the Bitter Compound from Huangjiu. Food Chem. 2021, 349, 129133. [Google Scholar] [CrossRef] [PubMed]
  29. Gupta, A.K.; Dhua, S.; Pratiksha; Kumar, V.; Naik, B.; Magwaza, L.S.; Ncama, K.; Opara, U.L.; McClements, D.J.; Mishra, P. Current and Emerging Applications in Detection and Removal of Bitter Compounds in Citrus Fruit Juice: A Critical Review. Food Biosci. 2023, 55, 102995. [Google Scholar] [CrossRef]
  30. Tirado-Kulieva, V.A.; Hernández-Martínez, E.; Minchán-Velayarce, H.H.; Pasapera-Campos, S.E.; Luque-Vilca, O.M. A Comprehensive Review of the Benefits of Drinking Craft Beer: Role of Phenolic Content in Health and Possible Potential of the Alcoholic Fraction. Curr. Res. Food Sci. 2023, 6, 100477. [Google Scholar] [CrossRef]
  31. Luo, Y.; Kong, L.; Xue, R.; Wang, W.; Xia, X. Bitterness in Alcoholic Beverages: The Profiles of Perception, Constituents, and Contributors. Trends Food Sci. Technol. 2020, 96, 222–232. [Google Scholar] [CrossRef]
  32. Tonutti, I.; Liddle, P. Aromatic Plants in Alcoholic Beverages. A Review. Flavour. Fragr. J. 2010, 25, 341–350. [Google Scholar] [CrossRef]
  33. Aharon, T.; Caricato, M. Compact Basis Sets for Optical Rotation Calculations. J. Chem. Theory Comput. 2020, 16, 4408–4415. [Google Scholar] [CrossRef]
  34. Suendo, V.; Viridi, S. Ab Initio Calculation of UV-Vis Absorption Spectra of a Single Chlorophyll a Molecule: Comparison Study between RHF/CIS, TDDFT, and Semi-Empirical Methods. ITB J. Sci. 2012, 44A, 93–112. [Google Scholar] [CrossRef]
  35. Szczepaniak, O.; Kobus-Cisowska, J.; Kmiecik, D. Freezing Enhances the Phytocompound Content in Cornelian Cherry (Cornus mas L.) Liqueur. Czech J. Food Sci. 2020, 38, 259–263. [Google Scholar] [CrossRef]
  36. Tešević, V.; Nikićević, N.; Milosavljević, S.; Bajić, D.; Vajs, V.; Vučković, I.; Vujisić, L.; Dordević, I.; Stanković, M.; Veličković, M. Characterization of Volatile Compounds of “Drenja”, an Alcoholic Beverage Obtained from the Fruits of Cornelian Cherry. J. Serbian Chem. Soc. 2009, 74, 117–128. [Google Scholar] [CrossRef]
  37. Alonso, E.; Torrado, A.; Guerra, N.P. Major Volatile Composition of Four Distilled Alcoholic Beverages Obtained from Fruits of the Forest. Chem. Eng. Trans. 2015, 44, 253–258. [Google Scholar] [CrossRef]
  38. Sun, C.; Wu, Z.; Wang, Z.; Zhang, H. Effect of Ethanol/Water Solvents on Phenolic Profiles and Antioxidant Properties of Beijing Propolis Extracts. Evid.-Based Complement. Altern. Med. 2015, 2015, 595393. [Google Scholar] [CrossRef] [PubMed]
  39. Adamenko, K.; Kawa-Rygielska, J.; Kucharska, A.; Piórecki, N. Fruit Low-Alcoholic Beverages with High Contents of Iridoids and Phenolics from Apple and Cornelian Cherry (Cornus mas L.) Fermented with Saccharomyces Bayanus. Pol. J. Food Nutr. Sci. 2019, 69, 307–317. [Google Scholar] [CrossRef]
  40. Polanowska, K.; Varghese, R.; Kuligowski, M.; Majcher, M. Carob Kibbles as an Alternative Raw Material for Production of Kvass with Probiotic Potential. J. Sci. Food Agric. 2021, 101, 5487–5497. [Google Scholar] [CrossRef]
  41. Siddeeg, A.; AlKehayez, N.M.; Abu-Hiamed, H.A.; Al-Sanea, E.A.; AL-Farga, A.M. Mode of Action and Determination of Antioxidant Activity in the Dietary Sources: An Overview. Saudi J. Biol. Sci. 2021, 28, 1633–1644. [Google Scholar] [CrossRef] [PubMed]
  42. Ivanova, A.; Gerasimova, E.; Gazizullina, E. Study of Antioxidant Properties of Agents from the Perspective of Their Action Mechanisms. Molecules 2020, 25, 4251. [Google Scholar] [CrossRef]
  43. Everette, J.D.; Bryant, Q.M.; Green, A.M.; Abbey, Y.A.; Wangila, G.W.; Walker, R.B. Thorough Study of Reactivity of Various Compound Classes toward the Folin-Ciocalteu Reagent. J. Agric. Food Chem. 2010, 58, 8139–8144. [Google Scholar] [CrossRef]
  44. Platzer, M.; Kiese, S.; Herfellner, T.; Schweiggert-Weisz, U.; Miesbauer, O.; Eisner, P. Common Trends and Differences in Antioxidant Activity Analysis of Phenolic Substances Using Single Electron Transfer Based Assays. Molecules 2021, 26, 1244. [Google Scholar] [CrossRef]
  45. Katsube, T.; Imawaka, N.; Kawano, Y.; Yamazaki, Y.; Shiwaku, K.; Yamane, Y. Antioxidant Flavonol Glycosides in Mulberry (Morus Alba L.) Leaves Isolated Based on LDL Antioxidant Activity. Food Chem. 2006, 97, 25–31. [Google Scholar] [CrossRef]
  46. Peng, K.; Lv, X.; Zhao, H.; Chen, B.; Chen, X.; Huang, W. Antioxidant and Intestinal Recovery Function of Condensed Tannins in Lateolabrax Maculatus Responded to in Vivo and in Vitro Oxidative Stress. Aquaculture 2022, 547, 737399. [Google Scholar] [CrossRef]
  47. Gao, N.; Cui, H.; Lang, Y.; Zhang, W.; Shu, C.; Wang, Y.; Bian, Y.; Li, D.; Li, B. Conversion of Condensed Tannin from Chokeberry to Cyanidin: Evaluation of Antioxidant Activity and Gut Microbiota Regulation. Food Res. Int. 2022, 158, 111456. [Google Scholar] [CrossRef] [PubMed]
  48. Magalhães dos Santos, D.; Sanches, M.P.; Poffo, C.M.; Parize, A.L.; Sagrera Darelli, G.J.; Rodrigues de Lima, V. Syringic and Cinnamic Acids Antiradical/Antioxidant Activities as R. Ferruginea Extract Components and Membrane Physico-Chemical Influence. J. Mol. Struct. 2020, 1220, 128749. [Google Scholar] [CrossRef]
  49. Bayrakçeken Güven, Z.; Saracoglu, I.; Nagatsu, A.; Yilmaz, M.A.; Basaran, A.A. Anti-Tyrosinase and Antimelanogenic Effect of Cinnamic Acid Derivatives from Prunus Mahaleb L.: Phenolic Composition, Isolation, Identification and Inhibitory Activity. J. Ethnopharmacol. 2023, 310, 116378. [Google Scholar] [CrossRef] [PubMed]
Figure 1. Percentage of volatile compounds in cornelian cherry liquor and brandy distillates (99.58% ethanol in cornelian cherry liquor distillate and 99.77% ethanol in cornelian cherry brandy distillate).
Processes 12 00237 g001
Table 1. Physicochemical and sensory characteristics of the tested Cornus mas beverages.
SampleLiquorBrandy
Organoleptic parameters:
ColorStrawDark reddish
ClarityTransparentTransparent
AromaSpecific, sweet and fruity (cornelian cherry fruit noticeable), delicate, pleasantSpecific, sweet and fruity (cornelian cherry fruit slightly noticeable), pleasant
TasteSweet, slightly fruity (cornelian cherry fruit noticeable), slightly sour, harmoniousSlightly sweet, slightly fruity (cornelian cherry fruit noticeable), tart, harmonious
Physicochemical parameters
Alcohol content at 20 °C (%v/v)22.2 ± 0.5 a34.8 ± 0.5 b
Extract after alcohol distillation (Bx)39.0 ± 0.5 b17.0 ± 0.5 a
pH3.7 ± 0.2 a3.8 ± 0.2 a
Centrifugation residue (g/L)<0.1<0.1
Relative viscosity 12.7 ± 0.2 b4.83 ± 0.23 a
Color-instrumental measurement
CIE Lab system
L* = 21.5 ± 1.2 a
a* = 3.2 ± 0.2 b
b* = 0.05 ± 0.02 b
L* = 21.2 ± 0.2 a
a* = 2.4 ± 0.2 a
b* = −0.19 ± 0.02 a
ΔE = 0.89
n = 3; liquid water as a reference; a,b superscript uppercase letters indicate significant differences between samples (p < 0.05).
Table 2. In silico determination of amygdalin properties.
Basis Set/SolventGas StateWaterEthanol
single point energy (kJ/mol)
b3lyp/6–31+g(2d,2p)−4,255,888.40−4,259,820.71−4,259,816.57
b3lyp/6–31++g(2d,2p)−4,256,234.30−4,256,323.02−4,256,318.61
b3lyp/3–21+g*−4,233,830.95−4,233,945.76−4,233,939.93
b3lyp/3–21+g−4,233,319.52−4,233,435.80−4,233,429.99
optical rotation angle
b3lyp/6–31+g(2d,2p)100.4196.3697.49
b3lyp/6–31++g(2d,2p)100.0195.4196.12
b3lyp/3–21+g*111.10105.86106.73
b3lyp/3–21+g111.10105.86106.73
UV spectra: wavelength (nm); ε
b3lyp/6–31+g(2d,2p)239.77240.19240.21
0.00400.00730.0073
235.90228.40228.60
0.01440.11030.1095
232.75219.90220.66
0.02530.00570.0065
b3lyp/6–31++g(2d,2p)239.00239.46239.48
0.00400.00740.0075
235.28227.61227.80
0.01380.11580.1150
232.13218.82219.61
0.02680.00540.0063
b3lyp/3–21+g*233.91234.58234.59
0.00380.00890.0089
232.62223.70223.88
0.01030.12940.1284
229.26214.61215.47
0.03050.00530.0061
b3lyp/3–21+g233.91234.58234.58
0.00380.00890.0089
232.62233.70223.88
0.01030.12940.1284
229.26214.61215.47
0.03050.00530.0061
UV-VIS spectraliquorbrandy
Λmax (nm); 233234
Absorbance0.313970.46112
Table 3. Concentrations (mg/L) of phenolic acids, flavonoids, amygdalin, total carotenoids and chlorophyll fractions in the tested beverages.
SampleGallic Acid2,5-DHBA4-HBAPCACaffeic AcidSyringic Acidp-Coumaric AcidFerulic AcidCGASinapic Acidt-Cinnamic AcidCACB
brandy14.22 ± 0.22 a1.30 ± 0.10 a22.35 ±
0.67 a
13.50 ±
0.19 b
33.10 ±
2.10 a
12.60 ±
0.98 a
3.31 ± 0.15 b28.52 ±
2.12 b
6.10 ± 0.57 a1.14 ±
0.17 b
5.32 ± 1.21 a1.66 ±
0.00 b
4.08 ±
0.01 b
liquor16.10 ± 0.31 b1.60 ±
0.12 a
21.20 ±
0.54 a
10.40 ±
0.09 a
36.50 ±
2.22 a
10.40 ± 1.02 a2.80 ± 0.62 a16.31 ±
1.15 a
5.21 ± 0.38 a0.70 ± 0.02 a8.93 ± 1.98 b0.53 ±
0.00 a
1.24 ±
0.00 a
samplevanillic acidsalicyl acidNaringeninvitexinrutinquercetinapigeninkaempferolluteolincatechinamygdalinTC
brandy15.60 ± 2.152.25 ± 0.77 a378.31 ±
9.17 b
34.52 ±
2.46 b
169.13 ±
7.35 b
201.33 ±
9.36 b
79.11 ±
5.38 b
17.42 ±
2.16 b
10.70 ±
0.39 b
345.23 a ± 10.5210.64 ±
12.10 a
6.57 ±
0.00 b
liquor14.90 ± 1.988.64 ± 0.94 b281.56 ±
10.02 a
12.61 ±
1.07 a
106.3 ±
4.13 a
115.46 ±
5.72 a
51.20 ±
3.16 a
6.56 ± 1.52 a2.12 ± 0.91 a300.71 a ± 11.431.45 ± 2.05 a1.58 ±
0.00 a
2,5-DHBA—2,5-dihydroxybenzoic acid; 4-HBA—4-hydroxybenzoic acid; CGA—chlorogenic acid; CA—chlorophyll A; CB—chlorophyll B; TC—total carotenoids. a,b rows of different lowercase letters show significant (p < 0.05) differences between mean values.
Table 4. The concentration (mg/L 100% spirit) of volatile compounds in distillates from cornelian cherry liqueur and brandy.
Compound (PubChem CID)Description of the OdorCornelian Cherry LiqueurCornelian Cherry Brandy
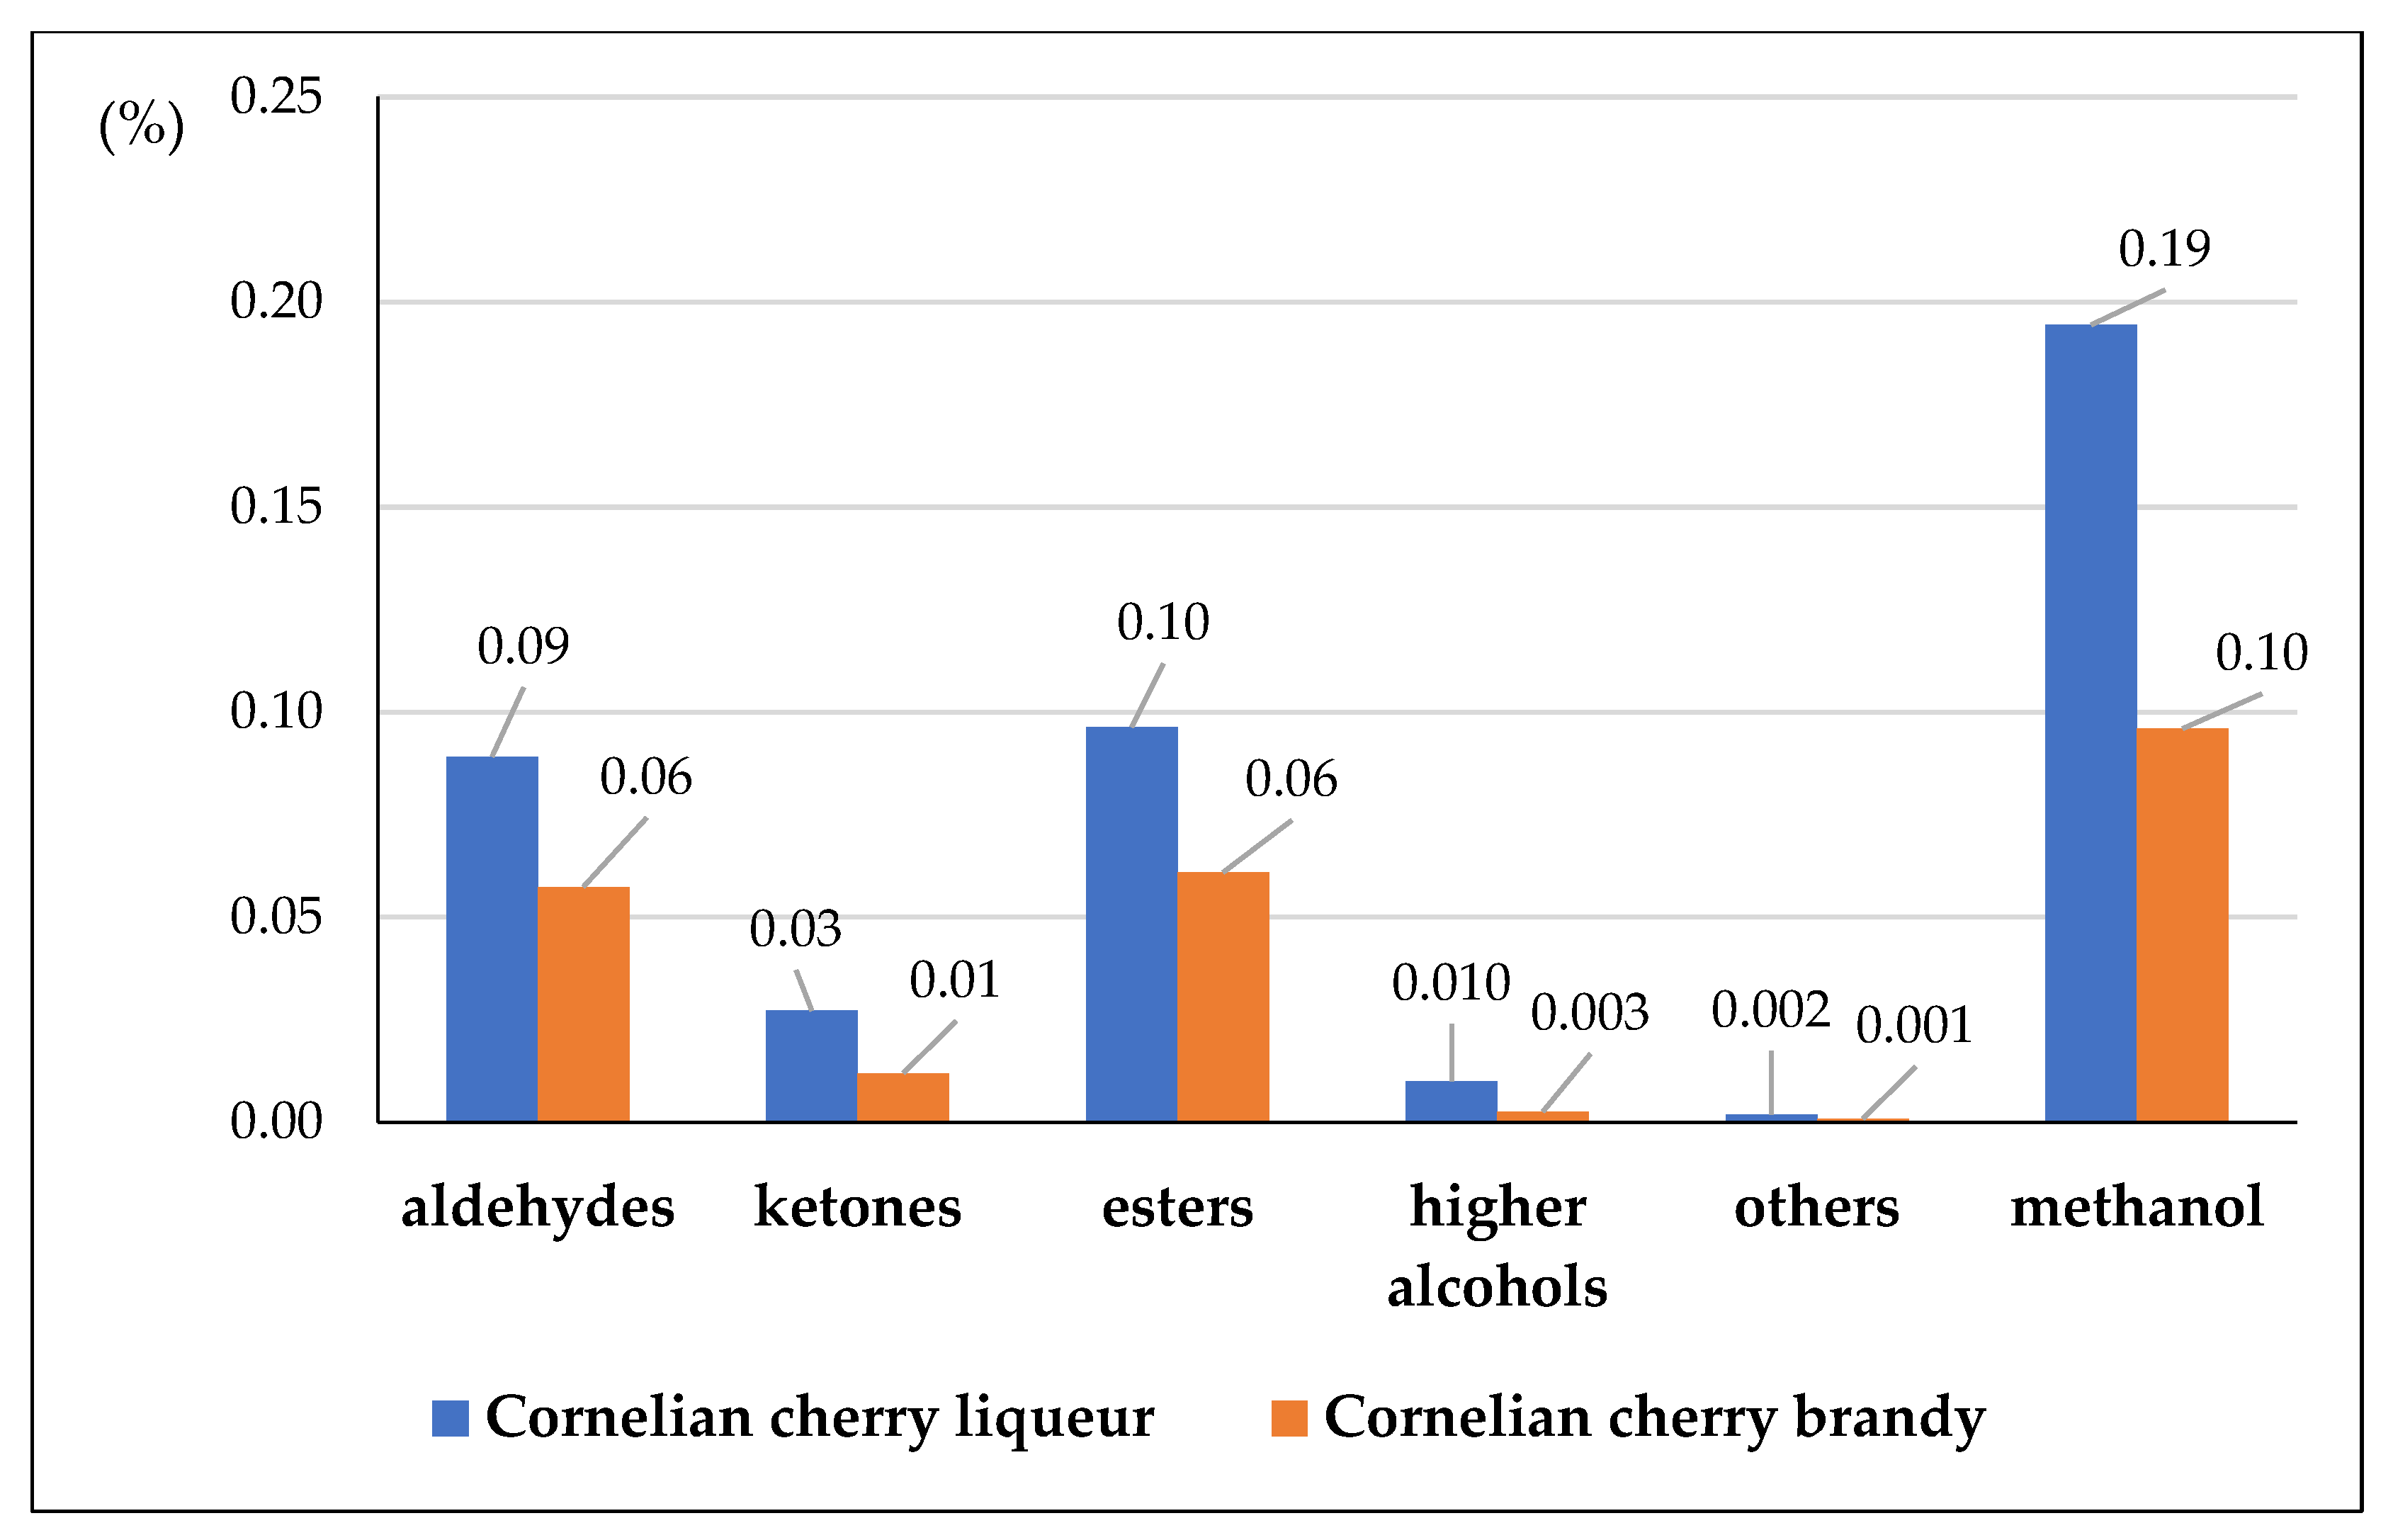
Aldehydes

Ketones
Esters


Higher alcohols


Others
Methanol (887)
Total volatiles
acetaldehyde (177)
1.1-diethoxyethane (92620)
propan-2-one (180)
ethyl acetate (8857)
ethyl pentanoate (10882)
propyl acetate (7997)
butan-1-ol (263)
3-methylbutan-1-ol (31260)
hexan-1-ol (8103)
heptan-1-ol (8129)
2-phenylethanol (6054)
2.3.5-trimethylpyrazine (26808)
fruity
fruity
solvent-like, pungent
solvent-like
fruity
petrol-like
medicinal, fusel
fusel oil
fatty, fruity, woody
not found
floral, honey-like
earthy
pungent, aromatic
-
146.57 ± 0.82 b
15.11 ± 1.76 a
47.12 ± 0.44 b
149.68 ± 3.06 b
3.60 ± 0.33
15.81 ± 0.05 a
3.67 ± 0.18 b
2.11 ± 0.16 b
2.21 ± 0.50
3.81 ± 0.33 b
4.69 ± 1.10
3.38 ± 0.03 b
342.15 ± 1.46 b
737.36 ± 11.39 b
127.87 ± 3.77 a
29.42 ± 2.25 b
33.01 ± 1.02 a
133.26 ± 5.25 a
2.95 ± 0.48
31.61 ± 2.70 b
2.62 ± 0.03 a
1.19 ± 0.01 a
1.66 ± 0.04
2.28 ± 0.10 a
nd
1.85 ± 0.07 a
264.31 ± 9.88 a
632.84 ± 26.61 a
a,b rows of different lowercase letters show significant (p < 0.05) differences between mean values; nd—not detected. Odors based on: Leibniz-lsb@TUM Odorant Database (https://www.leibniz-lsb.de/en/databases/leibniz-lsbtum-odorant-database/start/ (Accessed on 15 January 2024)) and The Good Scents Company Information System (https://www.thegoodscentscompany.com/ (Accessed on 15 January 2024)).
Table 5. Antiradical activity of the tested beverages.
SampleABTS (mM Trolox) *DPPH (mM Trolox)
liquor1.3 a ± 0.4163.6 a ± 24.9
brandy2.6 b ± 0.552.9 b ± 1.3
* N = 5; N = 3; superscript lowercase letters indicate significant differences between samples (p < 0.05).
Disclaimer/Publisher’s Note: The statements, opinions and data contained in all publications are solely those of the individual author(s) and contributor(s) and not of MDPI and/or the editor(s). MDPI and/or the editor(s) disclaim responsibility for any injury to people or property resulting from any ideas, methods, instructions or products referred to in the content.

