1. Introduction
The automotive AC electromagnetic clutch serves as a crucial link between the engine and the AC compressor [
1]. Its primary function is to transmit power generated by the engine to the compressor, ensuring the proper functioning of the vehicle AC system [
2]. This power transmission is achieved through the friction between the pulley and the drive disc, allowing for efficient operation [
3,
4]. The automotive AC electromagnetic clutch is primarily composed of three main components: the pulley assembly, coil assembly, and drive plate assembly [
5]. The electromagnetic coil is securely fixed onto the AC compressor housing, while the drive plate is connected to the main shaft of the compressor. The pulley is mounted on the compressor head cover through bearings, allowing it to rotate freely. During operation, when the AC switch is activated, current flows through the electromagnetic coil, resulting in the generation of an electromagnetic attraction force. This force facilitates the engagement of the compressor drive plate with the pulley, enabling the transmission of engine torque to the compressor’s main shaft. Consequently, the compressor is set into motion, effectively performing the cooling or heating function of the AC system. Conversely, when the AC switch is deactivated, the supply of current to the electromagnetic coil is interrupted, causing the electromagnetic attraction force to dissipate. The action of the spring plate comes into play, leading to the disengagement of the drive plate and pulley. This disengagement results in the cessation of compressor operation [
6,
7].
The tribological performance of the clutch, particularly the static friction between the friction plates, plays a critical role in determining the clutch’s working characteristics and service life [
8,
9]. Numerous scholars have extensively researched and developed theoretical models, such as dynamics and thermodynamics, along with finite element models [
10,
11], to understand the torque characteristics of clutches. These models employ simulations and experimental research to investigate the influence of various working condition parameters on torque, temperature, and other operational characteristics [
12,
13,
14]. Myklebust et al. [
15] conducted a comprehensive study on torque transmission in clutches for heavy trucks. Through numerical simulations and experiments, they observed that torque characteristics were largely unrelated to relative slip speed but strongly influenced by temperature. Additionally, the researchers developed and validated a dynamic temperature model specifically for clutches, achieving a validation error of only 3% of the maximum engine torque. These findings shed light on the complex dynamics of clutch performance, offering valuable insights for optimization and improvement. The significance of studying temperature distribution in clutches was highlighted by Meng et al. [
16]. In their research, they developed a theoretical model to analyze the two-dimensional transient temperature field of the friction plate. Using a finite element analysis, they investigated the radial and axial temperature fields on the friction plate surface under various operating conditions. The researchers identified four distinct stages of temperature change throughout a single connection and disconnection cycle. This study provides valuable insights into the operational characteristics of clutches and offers the potential for optimizing their performance.
Unlike clutches in the transmission system, AC electromagnetic clutches require prolonged engagement to maintain stable frictional torque output after the AC is activated [
17]. Despite numerous studies on clutch tribological properties, there is a noticeable gap in research regarding the operating characteristics and performance requirements specific to electromagnetic clutches used in automotive AC systems. The primary objective is to examine the impact of various operating conditions on the dynamic performance of automotive AC electromagnetic clutches. The dynamic torque characteristics of the clutch and the operating characteristics of the AC compressor are investigated through a dynamic torque bench test. The influences of rotational speed and on/off time on operating parameters such as dynamic torque and exhaust pressure are analyzed. Meanwhile, thermal photographs collected during the test provide insights into the temperature distribution of the suction cup’s outer end face. The significance of this paper lies in the initial experimental work conducted to validate the feasibility of the theoretical formulas and provide valuable insights and data for researchers in the field of automotive AC electromagnetic clutches. The experimental results obtained will serve as a reference to develop, validate, and refine a dynamic finite element method (FEM) model. This FEM model will play a crucial role in further exploring the dynamic characteristics of automotive AC electromagnetic clutches, thereby enhancing our understanding of their behavior.
2. Materials and Methods
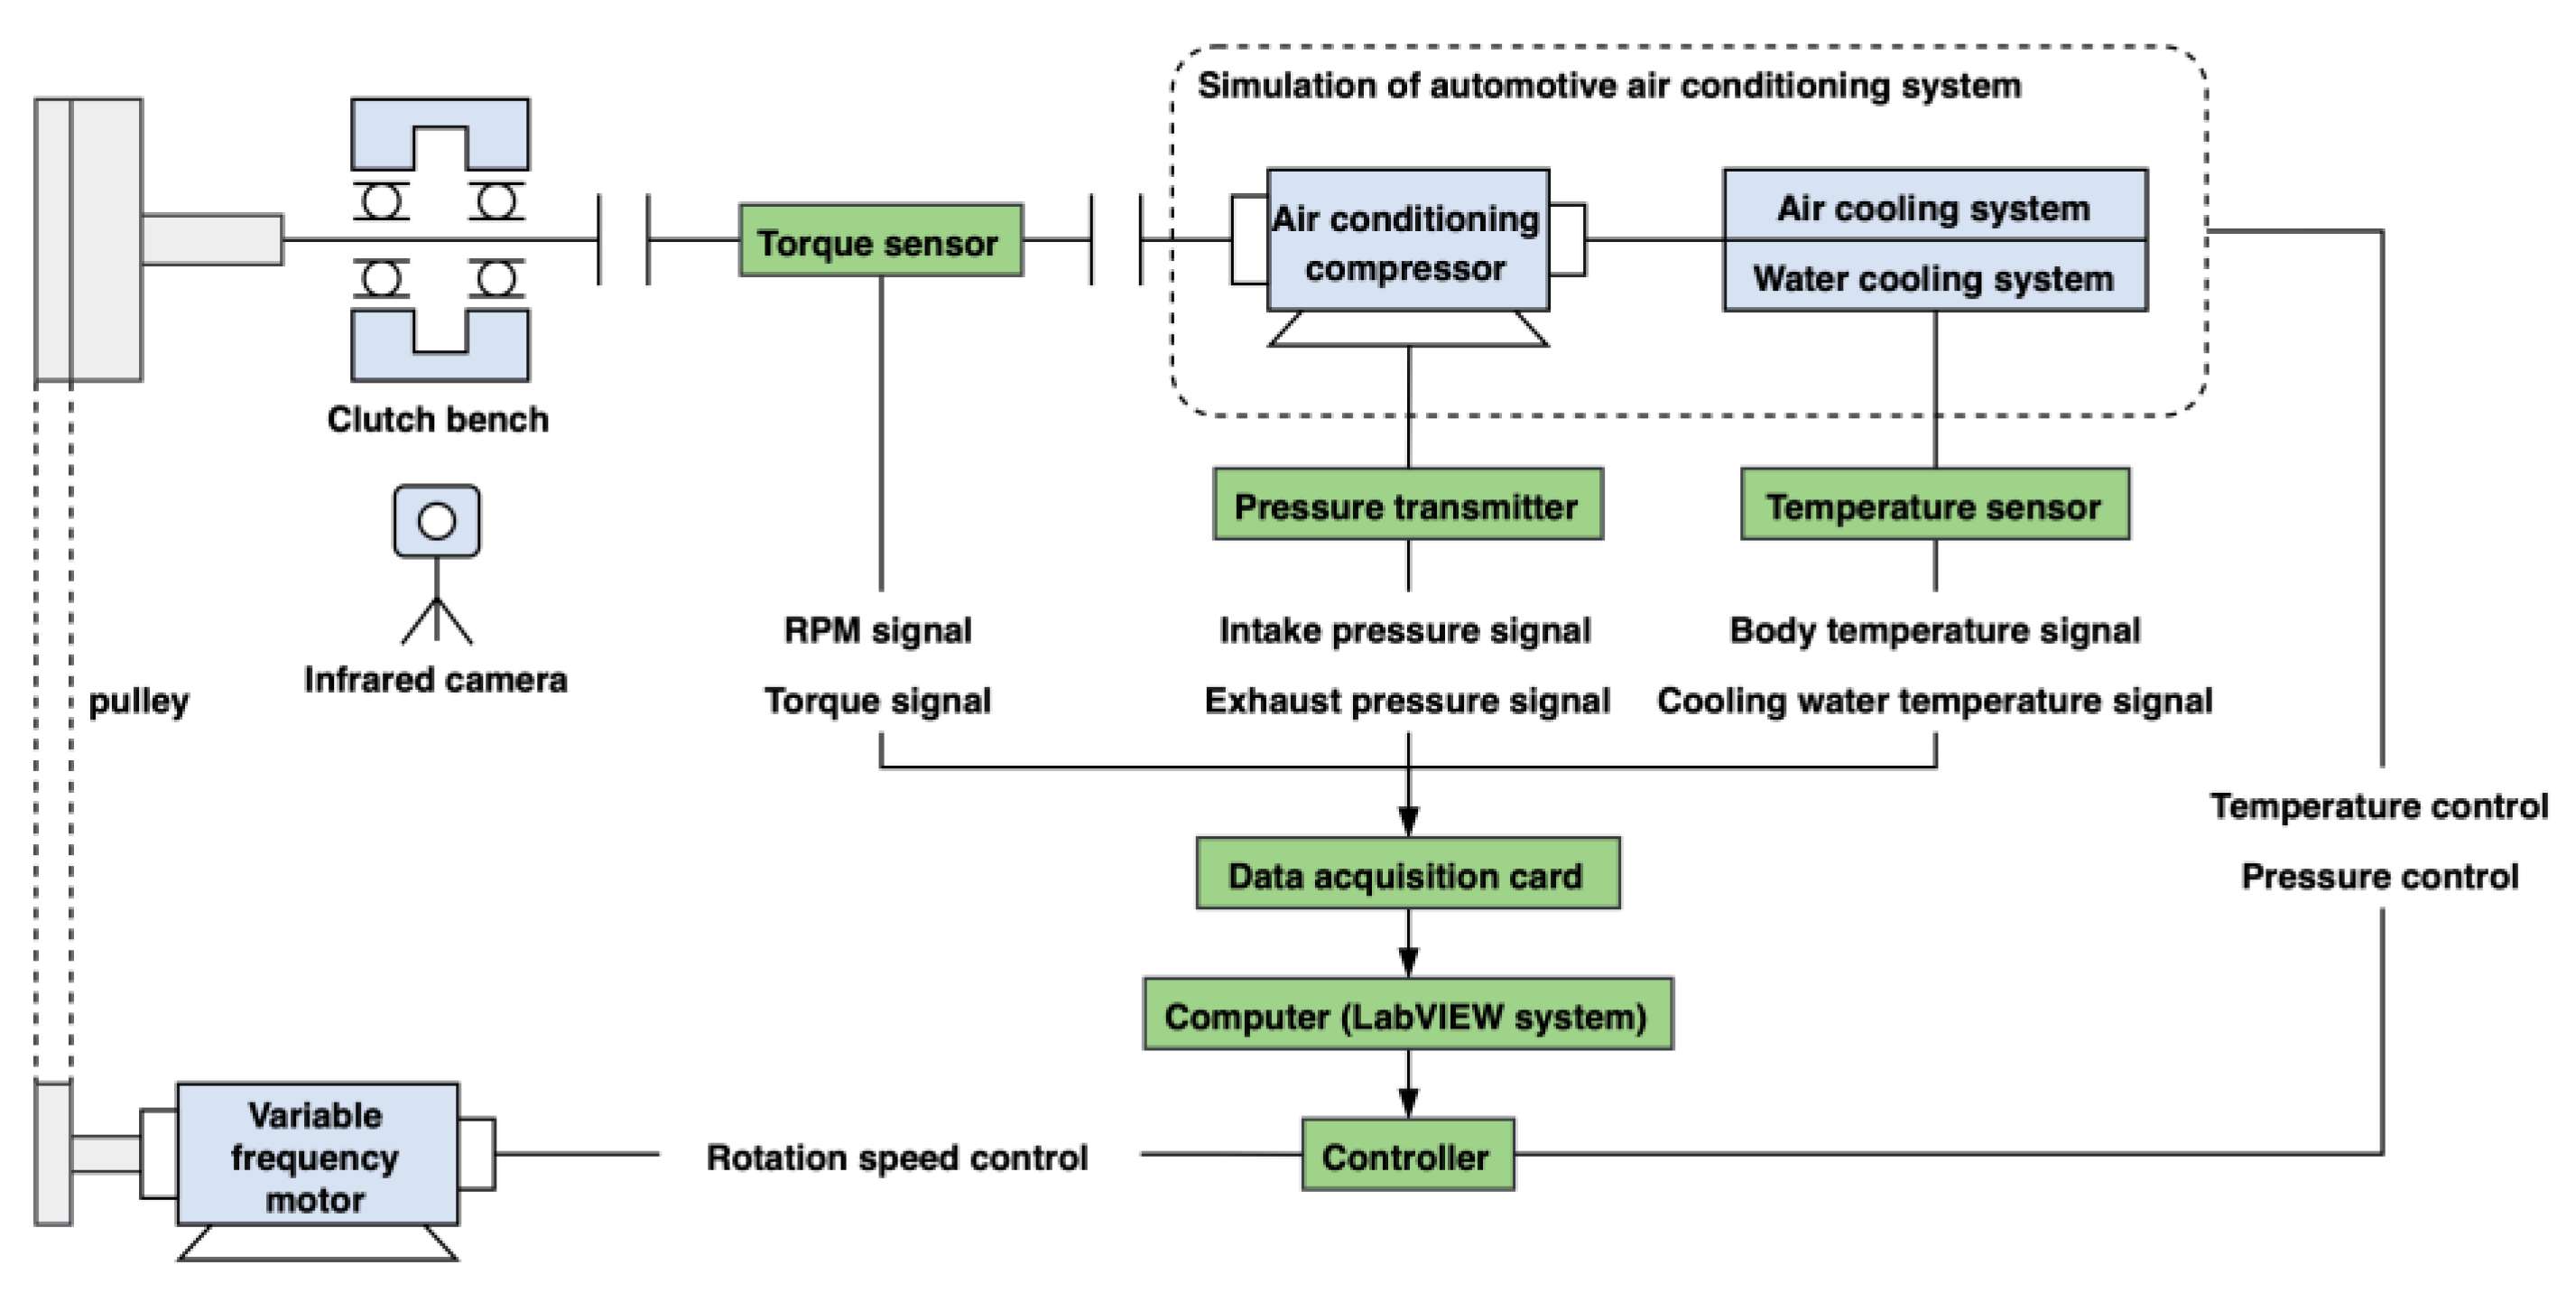
In this study, an automotive AC electromagnetic clutch characteristic test system was employed. This system offers easy mounting and dismounting capabilities, as well as convenient gap adjustment, while ensuring manufacturing dimensions and mounting accuracy of each component. It is well suited for conducting durability tests on various types and sizes of electromagnetic clutches found in the market.
Figure 1 illustrates the system, which comprises four main parts: the electromagnetic clutch bench section, the inverter motor drive section, the automotive AC load section, and the sensor test control section. To accurately replicate the actual operation of the automotive AC system and the electro-magnetic clutch, a QABP inverter motor was chosen for the power unit section. By connecting the transmission mechanism and the pulley flywheel set, and utilizing the inverter for precise motor speed control, different input speeds at the pulley end can be simulated effectively. In the load section, the system was equipped with an AC compressor, cooling system, ventilation system, and other relevant equipment to accurately simulate the real environment of an automotive AC system. The control and measurement unit comprises speed sensors, torque sensors, temperature sensors, pressure transmitters, and integrated controllers, among others. This unit facilitates the collection, processing, and display of data related to speed, torque, temperature, and pressure. The physical diagram of the main devices in the test system is depicted in
Figure 2.
Table 1 presents the specific performance parameters of the system.
In this study, a dry single-plate electromagnetic clutch with a specific structure was utilized. The clutch, as illustrated in
Figure 3a, is composed of multiple components. The pulley serves as the active part, receiving torque from the engine output shaft. The suction cup and the hub, on the other hand, function as the driven parts, making contact with the left end face of the pulley and the friction plate solely under the influence of electromagnetic force. The motion of the suction cup, hub, and the main shaft of the compressor is driven through the utilization of the friction torque generated between the friction plate, composed of friction-enhancing material, and the metal surface roughened by the grinding wheel [
18]. The friction plate material used in the clutch has a hardness of 487 MPa and a density of 1.85 g/cm
3. The chemical composition of the material can be found in
Table 2. Additionally, the clutch engagement gap was measured to be 0.5 mm. When the electromagnetic coil is energized, it generates an electromagnetic attraction force of 6860 N. Furthermore, as shown in
Figure 3b, the friction plate is inserted into the groove on the right end of the pulley, extending axially beyond the pulley end face by more than 0.05 mm.
The electromagnetic clutch utilizes a dry friction pair formed between the friction plate and the suction cup to transmit torque from the engine to the AC compressor. The magnitude of the friction torque is predominantly influenced by factors such as the contact area, material friction coefficient, and normal load. Mathematically, it can be expressed as follows [
19]:
where
represents the total frictional torque.
and
are the friction torques between the friction plate and the suction cup, and between the pulley end face and the suction cup, respectively.
and
are the friction coefficients.
is the normal force when the suction cup is in complete contact with the pulley end face.
and
are the inner and outer radius of the friction plate ring.
and
are the inner and outer radius of the suction cup. In the case of the pulley’s metal surface or the friction plate, when there is a relative angular velocity and sliding friction with the suction cup, frictional heat flux is generated between the contact surfaces. Frequent engagement conditions can lead to the formation of local high temperatures, which have a significant impact on the clutch’s performance and mechanical strength. The temperature model of the clutch can be expressed as follows [
20]:
where
,
and
represent the heat flux density of the friction plate, pulley, and suction cup, respectively.
is the heat flux density of the material’s radial cross-section.
,
and
are the thermal conductivity coefficients of the materials.
,
, and
are the density of the materials.
,
, and
are the specific heat capacities of the materials.
is the thermal conductivity.
is the relative angular velocity.
Although theoretical formulas can provide an approximate description, it is important to note that the actual situation may be more complex. Therefore, a phenomenological model is needed to validate the feasibility of the formulas through experimental data and to comprehensively describe the dynamic working process of the AC electromagnetic clutch.
To investigate the influence of operating parameters on the dynamic operating characteristics of electromagnetic clutches, several sets of short-time break-in tests were conducted on clutch samples. The tests involved varying the rotational speed and the single clutch on–off time (set to be equal for on and off time). Specifically, the rotational speed was selected at 500 rpm intervals, ranging from 2000 rpm to 4500 rpm, covering the low-, medium-, and high-speed ranges. The effect of durability factors on the dynamic characteristics of the clutches was considered by adjusting the on/off times, which were set at 3, 5, and 10 s. Each test condition corresponded to a total running time of 5 min, during which the clutches operated in a cyclic on–off state.
In this study, dynamic torque, exhaust pressure, and friction surface temperature were utilized to comprehensively evaluate the dynamic characteristics of the clutch during operation. To measure the torque and speed of the AC compressor, a torque/speed sensor was employed. The frequency signals from the sensor were converted, read, and recorded using a frequency transmitter and an NI-9215 voltage acquisition card. In addition, the AC compressor inlet and exhaust pressures were measured using a pressure transmitter, and the current signals from the pressure transmitter were read and recorded through an NI-9203 current acquisition card. During the clutch break-in and operating parameter acquisition process, the outer end face of the suction cup hub assembly was captured five times using an IR thermal imaging camera (FORTIC226) at one-minute intervals. The temperature data of the friction surfaces were obtained by combining the highest temperature recorded in the image with the temperatures measured at three marked points on the friction ring. These marked points were positioned at approximately 120° intervals in the radial direction [
21,
22].
3. Results and Discussions
This section provides an overview of the dynamic operating characteristics of automotive AC electromagnetic clutches, focusing on torque output, exhaust pressure, and IR temperature. In the test system, the control module is responsible for performing steady-state control of two parameters: rotational speed and on/off time. This control is carried out for each sub-working condition, allowing the system to accurately measure the dynamic torque and exhaust pressure values under each specific operating condition. The analog signals obtained from the data acquisition equipment undergo conversion and filtering processes to obtain the precise digital signals for measured torque and pressure. To ensure accuracy, 10 cycles measured within a 5 min timeframe were taken for an analysis under each working condition.
As depicted in
Figure 4a for the speed of 2500 rpm, a dynamic torque time variation curve with a 5 s on/off time is presented. It is evident that the dynamic torque in each cycle initially increases rapidly to its peak value due to the suction and impact effect of the suction cup. Subsequently, it decreases and stabilizes for a certain period of time. Then, with the disappearance of the electromagnetic suction force, the torque rapidly declines back to nearly zero. However, it should be noted that the theoretical calculations assume a constant torque value, which is not in line with the observed dynamic torque variation. A torque with a time curve for a single cycle is extracted and depicted in
Figure 4b. This curve provides a more detailed understanding of the torque fluctuations during the operation of the AC electromagnetic clutch. To evaluate the dynamic torque transmission characteristics of the clutch, the maximum torque and operating torque are selected as the primary indicators. The maximum torque represents the peak torque value within a single cycle and reflects the clutch’s maximum transmission capacity under specific operating conditions [
23]. On the other hand, the operating torque is the average value within the torque oscillation interval after the peak torque, representing the clutch’s average torque transmission level during actual operation [
24]. To account for torque variations at different on/off times, this study introduces the concepts of average maximum torque and average operating torque. The average maximum torque is the mean value of the maximum torque at a constant speed but with different on/off times. Similarly, the average operating torque is the average value of the operating torque at the same speed but with different on/off times.
The maximum torque and the average maximum torque versus speed and on/off time are shown in
Figure 5. The maximum torque of the clutch is primarily concentrated within the range of 12 to 15 N·m. As illustrated in
Figure 5a, it is evident that the compressor output does not strictly adhere to a linear relationship with the input or operating parameters. Instead, it displays a non-linear behavior. Therefore, the relationship between operating torque and on/off time is essentially proportional. At lower and higher speeds, the on/off time has a more pronounced effect on the maximum torque. However, at intermediate speeds, the impact of increasing or decreasing the on/off frequency on the peak torque is not significant.
Figure 5b reveals that the maximum torque of the clutch behaves differently at different speeds. It initially increases and then decreases as the rotational speed rises from 2000 rpm to 4500 rpm. The highest value of 15.05 N·m is achieved at 3000 rpm.
Figure 6 displays the operating torque and average operating torque as a function of rotational speed and on/off time. The operating torque of the AC compressor is mainly concentrated within the range of 10 to 13 N·m.
Figure 6a demonstrates that the operating torque is generally positively related to the on/off time. This suggests that adjusting the on/off time significantly affects the operating torque in most cases. However, it is worth noting that at a speed of 3500 rpm, the influence of on/off time on operating torque is weaker. Additionally, at higher speeds, increasing the on/off time from 5 to 10 s does not significantly increase the operating torque. This suggests that factors like bearing friction and aerodynamic drag have a more pronounced limiting effect on torque at high rotational speeds.
Figure 6b shows a similar trend to the maximum torque, with the operating torque of the compressor increasing and then decreasing as the speed rises from 2000 rpm to 4500 rpm. There is an optimal operating torque value of 13.35 N·m at 3000 rpm, indicating that the AC compressor’s operating torque has a specific optimum at different speeds.
As shown in
Figure 7a, the time variation curve of the exhaust pressure at a speed of 2500 rpm and an on/off time of 5 s is displayed. It is observed that the exhaust pressure in each cycle gradually increases from the lowest point to the peak when the clutch engages. Subsequently, when the clutch disconnects, the pressure rapidly drops back to the lowest value. During the rising stage, the growth rate of pressure is higher in the early phase, and it gradually slows down as it approaches the peak. Similarly, during the falling stage, the growth rate follows a similar pattern, with the rate of pressure decline gradually slowing down until it reaches the lowest pressure and stabilizes. This behavior can be attributed to the cooling system’s regulation of water temperature, which requires a longer response time. The total duration of the 10 cycles in the pressure curve is approximately 100 s, with each individual cycle lasting around 10 s, consistent with the set on/off time as well. Additionally, a torque–time curve for a single cycle is depicted in
Figure 7b. To comprehensively assess the operating characteristics of the AC compressor, this study selected the maximum and minimum pressures as evaluation indicators. Additionally, the concepts of average maximum pressure and average minimum pressure were introduced. The average maximum pressure is defined as the average value of the maximum pressure at the same rotational speed but with different on/off times. Similarly, the average minimum pressure is the average value of the minimum pressure at the same rotational speed but with different on/off times [
25,
26].
The relationship between the maximum pressure and the average maximum pressure with rotational speed and on/off time is indeed depicted in
Figure 8. The maximum exhaust pressure of the AC compressor is primarily concentrated within the range of 1.20 to 1.30 MPa.
Figure 8a demonstrates that the maximum pressure shows a clear positive growth trend with increasing on/off time. Notably, the most significant increase in maximum pressure occurs when the on/off time increases from 3 s to 5 s.
Figure 8b reveals that the maximum pressure initially increases and then decreases as the rotational speed rises from 2000 rpm to 4500 rpm. The maximum value of 1.33 MPa is reached at a rotational speed of 3000 rpm. The figure presented in
Figure 9 aptly illustrates the relationship between the minimum pressure and the average minimum pressure concerning the rotational speed and on/off time. The minimum exhaust pressure of the AC compressor is mainly concentrated within the range of 0.84 to 0.88 MPa. Unlike the trend of the maximum pressure with on/off time,
Figure 9a shows that the minimum pressure is generally inversely related to the on/off time. The decrease in minimum pressure is not significant when the on/off time increases from 3 s to 5 s. However, when the on/off time is further increased to 10 s, the minimum pressure experiences a significant reduction.
Figure 9b indicates that the minimum pressure increases and then decreases as the rotational speed rises from 2000 rpm to 4000 rpm. At a rotational speed of 4500 rpm, the average minimum pressure tends to increase. At lower speeds, increasing the speed has a more pronounced effect on increasing the minimum pressure. At higher speeds, the impact of increasing the speed on the minimum pressure is limited.
Subsequently, an in-depth analysis of the friction surface temperature data obtained from the clutch dynamic torque characteristic test is undertaken. It is crucial to acknowledge that during the assembly process, it is customary for the friction disc to maintain a slight distance of approximately 0.05 mm above the metal surface of the pulley [
27]. Consequently, the primary component responsible for carrying the friction torque during the initial wear stage is the friction ring belt [
28,
29]. Due to the generation of heat during friction, a substantial amount of heat is produced during the slip-grinding phase, leading to a significant temperature rise within the contact surface of this ring belt. The IR thermograms of the clutch at the moment of connection and disconnection are depicted in
Figure 10. These thermograms were captured under specific test conditions, including a speed of 3000 rpm, an on–off time set to 10 s, and a break-in time of approximately 5 min. By referring to the temperature scale, it becomes evident that the higher temperature region predominantly concentrates in the area of the friction disc’s ring belt. To analyze the temperature distribution more precisely, three marked points (Sp1, Sp2, and Sp3) with radial positions at an angle of 120° are selected within the ring belt. The changes in temperature at these marked points during the moment of connection and disconnection are observed. The findings indicate a significant temperature discrepancy among the three markers during clutch connection, whereas the temperatures of the three markers at the moment of disconnection exhibit relatively consistent values. This discrepancy can be attributed to the fact that during disconnection, the clutch remains in a rotating state, resulting in a relatively uniform heat distribution. To further validate the feasibility of formula 2, theoretical calculations were performed for a rotational speed of 4500 rpm and an on/off time of 3 s. The thermal conductivity of the suction cup and friction plate materials was assumed to be consistent with the experimental data. The theoretical calculations indicate that the surface temperature range of the friction plate falls between 50.15 °C and 57.65 °C, while the surface temperature range of the suction cup lies between 36.15 °C and 52.15 °C.
Figure 11 shows an infrared thermal image taken under the same operating conditions. It can be observed that the measured temperatures fall within this range, confirming the accuracy of the measurements. However, it should be noted that the temperature distribution is non-uniform, indicating that the actual temperature distribution is more complex than what can be calculated theoretically. At higher speeds and shorter on/off durations, the temperature of the friction ring zone exhibits a significant increase, resulting in a more uneven temperature distribution. During clutch connection, the temperature disparity between the highest temperature point and other regions becomes more pronounced. Consequently, it is crucial to investigate the variations in the maximum temperature within the ring belt and the average temperature at the marked points separately.
To initiate the analysis, the maximum temperature versus time course and the temperature change versus on/off time for each speed condition are examined.
Figure 12 illustrates these relationships for rotational speeds ranging from 2000 rpm to 4500 rpm. Notably, as the rotational speed increases, the maximum temperature versus time curves exhibit distinct changes. At a rotational speed of 2000 rpm, the relationship between the maximum temperature and the break-in time and on/off time is not evident. However, for other rotational speed conditions, the maximum temperature generally exhibits an increasing trend as the break-in time increases. This observation suggests that the frictional heating effect of the clutch at higher speeds gradually intensifies over time. Furthermore, as the on/off time is extended from 3 s to 10 s, the maximum temperature values increase during the break-in process, reaffirming the impact of on/off time on clutch temperature. It is worth noting that for a speed of 2500 rpm, the maximum temperatures remain relatively stable during the initial stages of break-in as the on/off time increases from 3 s to 5 s. Nevertheless, toward the end of the break-in period, the influence of on/off time on the maximum temperature becomes progressively significant. In the speed range of 3000 rpm to 4500 rpm, the maximum temperature at the moment of connection consistently rises during the break-in process. Conversely, the maximum temperature at the moment of disconnection shows a faster rate of increase. Under the condition of a 3 s on/off time, the maximum temperature at the moment of disconnection surpasses the maximum temperature at the moment of engagement. This disparity could be attributed to the fact that during disconnection, the clutch has just undergone a period of slippery wear. Compared to the moment of connection, which has experienced a period of disconnection time, incomplete heat dissipation in certain areas leads to localized high temperatures.
In the following section, the analysis shifts its focus to the average temperature of the three marked points on the contact surface of the friction ring belt. The relationship between the average temperature and time, as well as its correlation with the on/off time, is examined for each rotational speed condition.
Figure 13 illustrates the average temperature–time relationship curves from 2000 rpm to 4500 rpm, depicted as (a) to (f), respectively. At a speed of 2000 rpm, it can be observed that the average temperature of the friction ring belt has not yet stabilized at the moment of clutch connection, and its relationship with the break-in time is not evident. However, at the moment of disconnection, the average temperature demonstrates a gradual increase. Interestingly, its relationship with the on/off time differs from that of other speed conditions. It is noteworthy that when the on/off time is shortened, the average temperature of the friction ring belt decreases, despite observing higher temperatures at 5 s of connection/disconnection. This phenomenon could be attributed to the fact that at low rotational speeds, less frictional heat is generated, and the duration of heat dissipation has a weaker impact on temperature change. At 2500 rpm, the average temperature exhibits a generally positive relationship with the increase in break-in time. However, both the moment of connection and disconnection show a decrease in average temperature during the break-in process. Possible explanations for this observation include measurement errors or favorable cooling conditions. In the speed range of 3000 rpm to 4500 rpm, the average temperature at the moment of clutch engagement shows a consistent and increasing trend during the break-in process. This trend reflects the fact that within this rpm range, the generation of frictional heat intensifies as the rotational speed increases, resulting in a higher average temperature.
To further examine the impact of rotational speed on the temperature of the friction surface, two plots depicting the maximum temperature and average temperature as functions of rotational speed (
Figure 14 and
Figure 15) were generated. In the low-speed range, the on/off time exhibits a relatively weak influence on both the maximum temperature of the friction surface and the average temperature of the friction ring belt at the moment of connection/disconnection. However, in the high-speed range, particularly under the working condition with a 3 s on/off time, the rotational speed significantly affects both the maximum and average temperatures. Therefore, it is advisable to minimize high-frequency on/off conditions in the high-speed region to prevent excessively high temperatures on the friction surface.


