Article

Low-Carbon Economic Dispatch of Virtual Power Plant Considering Hydrogen Energy Storage and Tiered Carbon Trading in Multiple Scenarios

1
School of Electrical Engineering, Xi’an University of Technology, Xi’an 710048, China
2
Electric Power Research Institute of State Grid Shaanxi Electric Power Company, Xi’an 710199, China
*
Author to whom correspondence should be addressed.
Processes 2024, 12(1), 90; https://doi.org/10.3390/pr12010090
Submission received: 31 October 2023 / Revised: 8 December 2023 / Accepted: 21 December 2023 / Published: 30 December 2023
(This article belongs to the Section Energy Systems)

Abstract

:
Reducing carbon emissions and increasing the integration of new energy sources are key steps towards achieving sustainable development. Virtual power plants (VPPs) play a significant role in enhancing grid security and promoting the transition to clean, low-carbon energy. The core equipment of the VPP, the CHP unit, utilizes a thermal engine or power station to generate electricity and useful heat simultaneously. However, the intermittent and volatile nature of renewable energy sources, as well as the “heat-driven power generation” mode of combined heat and power (CHP) units, presents contradictions that severely affect their peak-shifting capability and lead to high carbon emissions. To address these issues, a novel VPP is established by integrating traditional power plants with carbon capture and hydrogen energy storage. This approach utilizes a “hydrogen energy storage–electric boiler” decoupling method to address the operational mode of CHP, strengthens the coupling relationship between electric and thermal hydrogen loads, and considers a tiered carbon-trading mechanism. With the net profit of the VPP as the optimization objective, the model balances economic and environmental considerations and establishes a low-carbon economic dispatch model for the VPP. A genetic algorithm is employed for solving, and three different dispatch strategies are set for simulation in three distinct seasonal scenarios. The comprehensive comparative analysis of the dispatch results reveals a reduction in carbon emissions and an increase in net profit to varying degrees across all three seasons. Overall, the proposed dispatch strategy demonstrates the ability to enhance the new energy-integration capacity and total revenue of a VPP while simultaneously achieving the goal of reducing carbon emissions.

1. Introduction

With the increasing global energy crisis and pollution issues, reducing carbon dioxide emissions and efficiently utilizing distributed energy sources have become major tasks for countries worldwide. However, distributed energy faces challenges, such as uneven resource distribution, the lack of coordination in its management, and inefficient scheduling. Therefore, new technologies, such as smart grids, energy hubs, integrated energy systems (IES), and virtual power plants (VPP), have been introduced to achieve multi-energy coordinated supply and the cascaded utilization of energy resources [1,2]. These technologies play a crucial role in the large-scale and efficient utilization of renewable energy, as well as in building efficient, secure, green, and low-carbon power systems.
As a new type of technology, the virtual power plant (VPP) can aggregate distributed energy sources through advanced control, measurement, and communication technologies to achieve coordinated and optimized operation, therefore improving overall stability and competitiveness in the electricity market [3]. As a distributed energy grid technology, a VPP can monitor and regulate flexible resources, allowing them to participate in electricity system energy trading, frequency regulation, peak load regulation, and other ancillary services. This promotes the coordinated interaction between the source, the grid, the load, and the storage” in the new power system and can also optimize and schedule traditional thermal power, centralized renewable energy bases, or other forms of energy to promote the smooth operation of the power system. The use of market-price-incentive mechanisms can fully tap the potential of user-side resource regulation, and a series of hardware and software technologies, such as the Internet of Things and big data, can aggregate different types of operators to enable their participation in the electricity market [3]. Previous research on VPPs has focused mainly on optimization and scheduling, increasing the consumption of new energy, reducing the impact of distributed resource fluctuations on the power system, and energy conservation and emission reductions. Future research should focus on the trading rules of VPPs in the medium- and long-term electricity and spot markets, as well as in ancillary service markets, to promote the establishment of market mechanisms adapted to the new power system.
So far, VPPs have been piloted and practiced in most of the provinces in China, and they have participated in various market models, such as ancillary markets and spot markets. For example, since its launch in December 2019, the Jibei VPP has participated in the North China electricity market clearance for over 3200 h, with a cumulative increase in new energy generation of 34.12 GWh [4]. In addition, on 16 July 2021, China’s national carbon-trading market was officially launched, with the power industry being the first to be included in carbon-emission management [5]. Building a new power system based on new energy and vigorously developing distributed resources are important ways for China to achieve green energy transformation, carbon neutrality, and peak carbon emissions [6,7]. Most researchers studying VPPs focus on operational optimization. Wang and Wu proposed a peak load optimization strategy based on a unified model of VPP adjustable space, which verified that VPPs can ensure the reliability of power system operations [8,9]. Falabretti and Gougheri proposed a two-stage robust optimization model considering wind power uncertainty, generating their own trading strategy. This trading strategy can realize the internal thermal power joint optimization operation of VPPs, help VPPs achieve internal resource optimization scheduling, and maximize VPPs’ market revenue [10,11]. Renos Rotas et al. utilized adaptive dynamic building envelope structures (ADBEs) to evaluate the annual performance improvements of two actual building spaces with installed ADBEs. The results indicated that the ADBE system can reduce energy consumption in building spaces, increase renewable energy source (RES) collection, and enhance indoor thermal quality [12]. Wang et al. employed the thermal characteristics of pipelines and buildings, as well as thermal comfort elasticity, to transfer cooling loads and electricity loads. They aimed to minimize the total cost of coal consumption by thermal power units, minimize penalty costs for curtailed electricity, and minimize carbon-trading costs. Using a mixed-integer linear-programming algorithm, they successfully mitigated carbon-trading cost, coal consumption cost, and curtailment rate [13]. However, according to the IEA’s “CO2 Emissions in 2022” report, global CO2 emissions associated with the energy and industrial sectors reached 36.8 billion tons in 2022. In particular, China’s CO2 emissions decreased by 23 million tons, reaching 12.1 billion tons, accounting for approximately one third of the total global carbon emissions. In 2021, China’s per capita carbon emissions were 8.4 tons, surpassing the levels of developed countries and significantly exceeding those of other emerging economies. Since the beginning of the 21st century, China has continuously reduced its carbon intensity, and by 2021, the carbon emissions intensity per unit of GDP had decreased to 0.45 tons of CO2 per thousand USD. However, it remains the highest among the major economies worldwide in terms of carbon intensity. Therefore, improving the consumption rate of renewable energy and reducing carbon emissions have become key issues for VPPs and a crucial step in promoting the green transformation of China’s power system.
In recent years, the carbon capture and storage (CCS) system has received widespread attention as a new technology capable of sequestering carbon dioxide and reducing carbon emissions. MacDowell et al. [14] provided an overview of this technology and demonstrated its potential to achieve 80–90% emissions reduction targets. Cui et al. [15] analyzed the “energy time-shifting characteristics” of carbon-capture plants and achieved peak shaving through liquid storage operation. Zhou et al. [16] established a dual-carbon quantity model for liquid storage CCS systems and constructed a real-time two-stage low-carbon economic dispatch model with the goal of maximizing net revenue in the electricity and carbon-trading markets. Chen et al. [17] considered the operation mechanisms of carbon-capture power plants (CCPP) and carbon transport systems and combined them with an economic dispatch model. In addition, Zhong et al. [18] introduced a carbon-capture system and tower photothermal power station into a virtual power plant and verified the high-efficiency coordination ability between carbon-capture systems and renewable-energy power plants. Therefore, introducing a carbon-capture system into virtual power plants can reduce their carbon emissions and improve their flexible dispatch capability. At the same time, the energy consumption of carbon capture is a movable and adjustable load. By controlling it, CCPP has the characteristics of flexible operation and rapid adjustment of power generation. Compared with traditional power plants, CCPP can reduce carbon emissions and adjust power to cope with random fluctuations in WT and PV power. Carbon trading is also one of the main measures to reduce carbon emissions in virtual power plants. The tiered can help the system find a balance between low carbon and economy. Refs. [19,20,21] introduced carbon-trading cost into the dispatch models of integrated energy systems (IES), verified the inhibitory effect of the tiered on carbon emissions, and studied and analyzed the impact of the tiered on the low carbon and economy of IES. Yang et al. compared the traditional carbon-trading mechanism with the tiered and found that the tiered can achieve more carbon emissions reductions, and the increase in system cost for participating in tiered is smaller when achieving the same emissions reduction targets [22]. Li et al. combined the actual carbon emissions of gas turbines and boilers to construct a comprehensive energy system carbon-trading mechanism. Finally, a low-carbon optimal operation model for integrated energy systems is established with the minimum objective function of energy purchase cost, carbon-trading cost, and operation and maintenance cost [23]. Therefore, it is evident that tiering plays an important role in reducing carbon emissions, and this paper will introduce it to reduce VPP carbon emissions.
However, in the three regions of China, the heating work in winter is usually completed by combined heat and power (CHP) units, which prioritize meeting the heat load demand and often operate in the “heat-driven power generation” mode, resulting in the forced power output of the units maintaining a relatively high level. Due to the thermal-electric coupling characteristics of CHP units, the adjustable range of electric output to meet user heating demand is reduced, which reduces the flexibility of CHP units and seriously affects the ability of virtual power plants (VPPs) to consume new energy sources [24]. There are two main ways to decouple heat and electricity for CHP units: configuring thermal storage tanks and electric heating equipment, both of which can enhance the peak-shaving ability of CHP units [25,26]. However, the consumption of distributed energy sources such as wind and photovoltaics is also an urgent problem to be addressed, and hydrogen storage as an emerging technology in recent years is composed of electrolyzers, fuel cells, and hydrogen storage tanks. When the load is in the valley period, the electrolyzer electrolyzes water to produce hydrogen, realizing energy conversion from electricity to hydrogen, which is injected into the hydrogen storage tank for storage; when the load is in the peak period, the stored hydrogen energy is converted into electrical energy through a hydrogen fuel cell, which optimizes the operation of VPPs. Gang et al. established an optimal energy storage scheduling model for a wind-solar-hydrogen integrated system that includes multiple energy storage devices such as electricity, heat, and hydrogen. The results show that the proposed energy storage model can reduce the total operating cost and improve the flexibility of system regulation while ensuring safe system operation [27]. Kiryanova et al. simulated the economics of wind turbines with and without hydrogen storage devices and ultimately concluded that hydrogen storage systems can effectively improve the utilization efficiency of renewable energy sources [28]. Razmi et al. proposed an innovative hybrid model of a solar device based on a parabolic trough collector, proton exchange membrane electrolyzer, and fuel cell, selecting the best working fluid and ideal working conditions for the solar device with the minimum cost rate and maximum energy efficiency, demonstrating that hydrogen storage has good economic and environmental benefits as well as the ability to store energy for a long time [29]. It can be seen that traditional energy storage and hydrogen storage are both aimed at smoothing wind power output fluctuations and reducing cost, but due to the single form of energy conversion, the role of traditional energy storage in waste heat co-utilization and carbon-emission reduction is relatively limited. Compared with traditional energy storage, hydrogen storage has significant advantages in the flexibility and economy of power system regulation and seasonal energy storage, so hydrogen storage is expected to play a greater role in building low-carbon, green, comprehensive energy systems. However, most studies only consider electric–hydrogen coupling and do not consider the heat energy generated by the combustion of hydrogen gas in the hydrogen storage system’s fuel cell.
Based on the above analysis, existing research mainly focuses on individual studies of renewable energy integration and carbon-emission reduction in VPPs, with few studies on the integrated problem and the coupling relationship between them. Therefore, to address the complex coupling interaction between renewable energy consumption and carbon-emission reduction in VPPs, this paper proposes a novel approach by aggregating combined heat and power (CHP), carbon capture and storage, wind farms, photovoltaic power stations, electric boiler, and hydrogen storage system into a new type of virtual power plant. Furthermore, a low-carbon economic dispatch model for the VPP is established, considering the tiered carbon-trading mechanism. By adjusting the hydrogen energy storage system unit coupled with electricity-heat-hydrogen, and at the same time, the combined electric boiler makes full use of its decoupling CHP unit’s “heat-determined power” working mode, giving full play to the operation flexibility of the CHP unit, effectively improving the energy utilization efficiency in the system, reducing the cost of other equipment and carbon emissions, and improving the economic benefits of VPPs.
The main contributions of this paper are as follows:
(1)
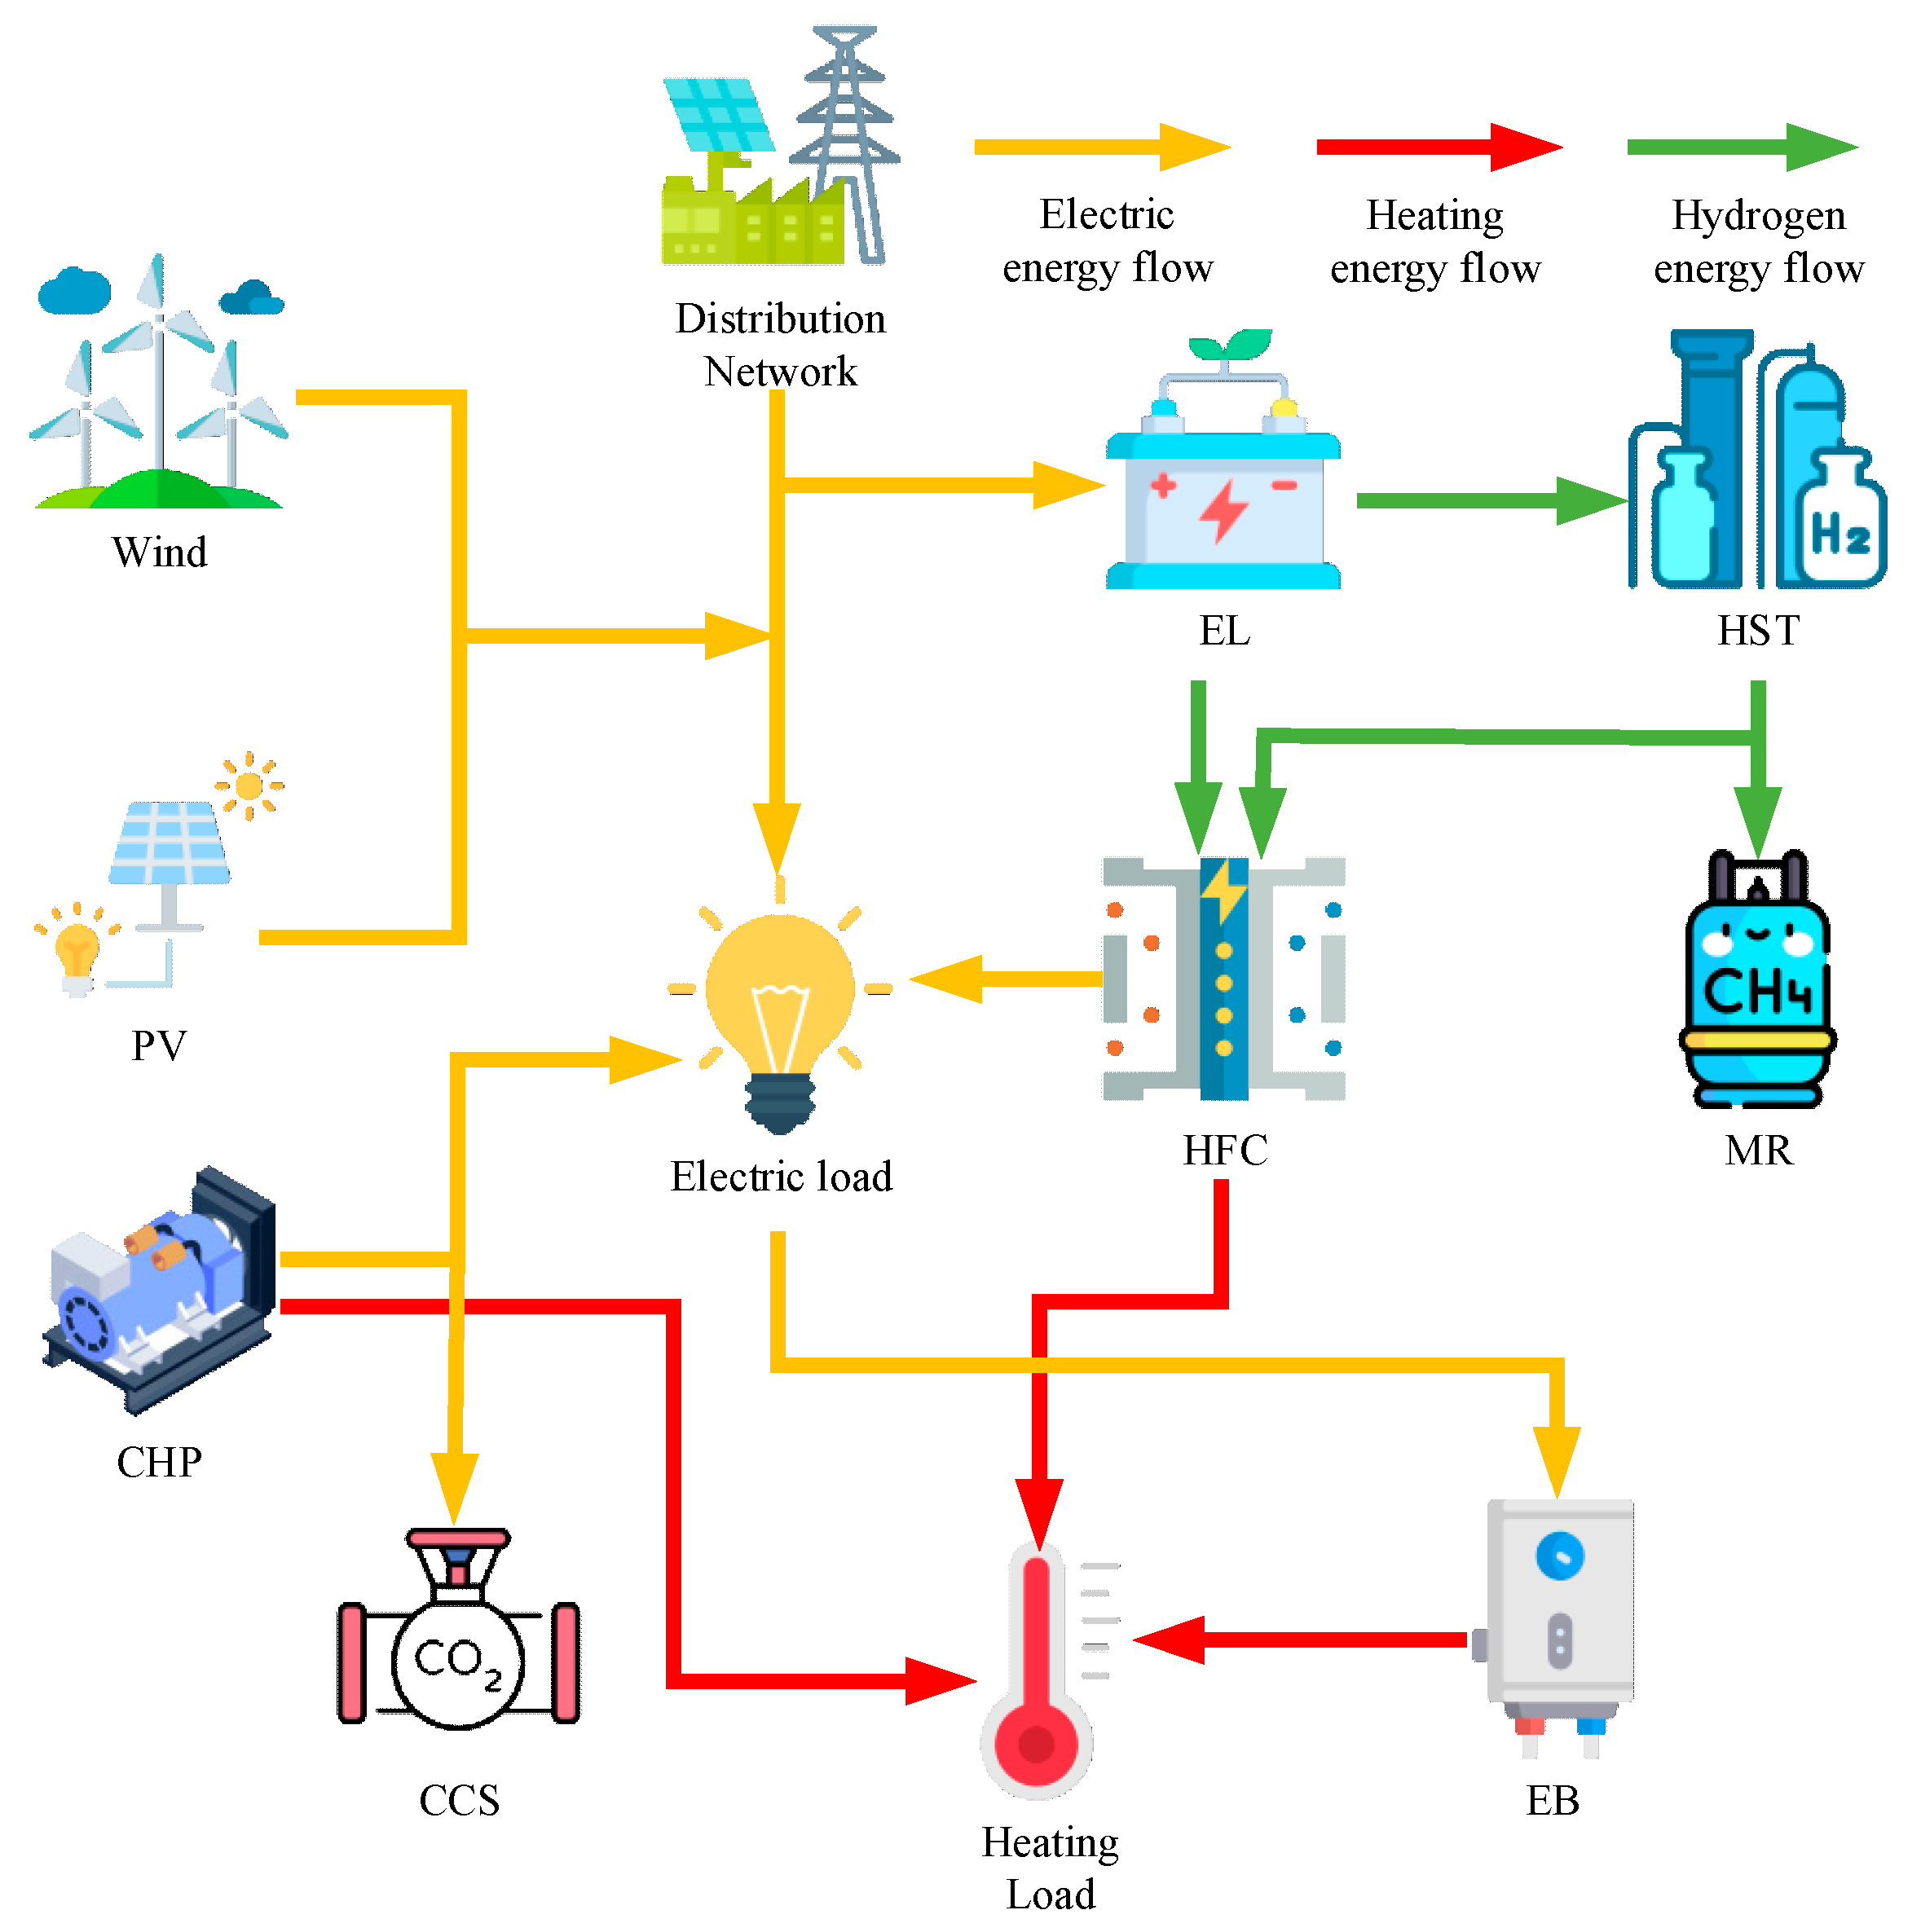
A new VPP structure is designed by integrating hydrogen energy storage and carbon capture into the traditional VPP. The surplus wind and solar resources are converted into hydrogen energy through hydrogen storage, and the carbon emissions from CHP generation are captured and stored or transported to MR, and CO2 is converted into CH4, achieving the optimization effect of the electric–thermal–carbon–hydrogen cycle.
(2)
Based on the new VPP structure, a low-carbon economic scheduling model is established considering the tiered carbon trading, which takes into account factors such as revenue, renewable energy consumption, and carbon emissions. The model is solved using a genetic algorithm.
(3)
Different scheduling strategies are proposed for three different scenarios: cooling season, transition season, and heating season. By selecting some parameters for comprehensive comparison, it shows that the proposed scheduling approach has high practicality and economic benefits, effectively improving the VPP’s ability to integrate renewable energy generation, mitigating the problem of mismatch between renewable energy output and load demand, achieving source–load balance, promoting VPP’s low-carbon transformation, strengthening electric–thermal load coupling and complementary use, and has strong academic significance and engineering application value.
The rest of this paper is organized as follows: Section 2 describes the operating framework of the VPP and introduces the hydrogen energy storage system and tiered carbon-trading model. Section 3 presents the objective function and model-solving process of the VPP. Section 4 provides the system parameters, simulation results, and analysis. Finally, Section 5 summarizes the research results in this paper.

2. Framework for VPP Operation with Hydrogen Storage and Carbon Trading

2.1. Composition of Virtual Power Plant (VPP)

Virtual power plant (VPP) integrates various energy sources such as wind power, photovoltaic (PV), thermal power, hydropower, and natural gas within a specific region. It establishes a unified virtual control center to manage and dispatch energy resources. In a broader sense, by incorporating technologies like demand response, energy storage, electric vehicles, as well as communication and control technology, the integration of supply and demand sides can be achieved to realize the flexible linkage of source load and the orderly access of distributed power supply. However, the traditional VPP heavily relies on coal-fired or combined heat and power (CHP) units, resulting in high carbon emissions and low utilization efficiency of clean energy, which hinders the implementation of China’s 30–60 plan. In contrast, the combined system of carbon capture and storage (CCS) and hydrogen energy storage can effectively sequester a large amount of carbon dioxide and convert it into methane, therefore promoting a zero-carbon-oriented energy planning at the level of the power supply chain. This provides a feasible pathway for emission reduction, improving energy utilization efficiency, and implementing carbon neutrality strategies. Therefore, integrating CCS and hydrogen storage systems into the VPP can effectively control carbon emissions.
The proposed framework for the VPP, as illustrated in Figure 1, includes PV, wind power, CHP, CCS, hydrogen storage system, and electric boiler. By introducing hydrogen storage and electric boiler into the VPP, a portion of the CO2 emitted from the combustion of coal in CHP units can be captured and stored using carbon-capture devices. Additionally, hydrogen produced by the hydrogen storage system can be converted into methane through a methane reactor. The generated methane can be directly sold. Furthermore, hydrogen fuel cells can generate electricity and heat by burning hydrogen, which can be operated in conjunction with an electric boiler. This further decouples the CHP units from thermal-based electricity generation, leading to a reduction in carbon emissions, lowering system energy costs, and improving economic benefits.

2.2. Hydrogen Energy Storage Model and Methanation Process

Hydrogen energy storage system [30,31] and the principle of carbon dioxide methanation process: EL first converts electrical energy into hydrogen energy. A portion of the hydrogen energy is inputted into the MR along with CO2 to synthesize natural gas, while another portion is directly supplied to HFC for conversion into electrical and thermal energy, and the remaining portion is stored in a hydrogen storage tank. The direct conversion of hydrogen energy into electrical and thermal energy by HFC improves energy efficiency and does not produce CO2. It can be seen that supplying hydrogen energy directly to HFC has multiple benefits. The energy conversion model described above can be summarized as follows:
(1)
Electrolysis cell equipment (EL)
P e l , H 2 ( t ) = η e l P e l ( t )
P e l min P e l ( t ) P e l max
Δ P e l min P e l ( t + 1 ) P e l ( t ) Δ P e l max
In the equation, P e l ( t ) is the electrical energy input to EL in time period t; P e l , H 2 ( t ) is the hydrogen energy output from EL in time period t; η e l is the energy conversion efficiency of EL; P e l max and P e l min are the upper and lower limits of electrical energy input to EL, respectively; Δ P e l max and Δ P e l min are the upper and lower limits of EL’s ramp rate.
(2)
Hydrogen fuel cell (HFC)
P H F C , e ( t ) = η H F C e P H 2 , H F C ( t )
H H F C , h ( t ) = η H F C h P H 2 , H F C ( t )
P H 2 , H F C min P H 2 , H F C ( t ) P H 2 , H F C max
Δ P H 2 , H F C min P H 2 , H F C ( t + 1 ) P H 2 , H F C ( t ) Δ P H 2 , H F C max
In the equation, P H 2 , H F C ( t ) is the hydrogen energy input to the HFC in time period t; η H F C e is the hydrogen-to-electricity conversion efficiency of the HFC; η H F C h is the hydrogen-to-thermal energy conversion efficiency of the HFC; P H 2 , H F C min and P H 2 , H F C max are the upper and lower limits of the hydrogen energy input to the HFC, respectively; Δ P H 2 , H F C max and Δ P H 2 , H F C min are the upper and lower limits of the ramp rate of the HFC.
(3)
Hydrogen storage tank (HST)
P E S H 2 ( t ) = η H 2 c h r P H 2 c h r ( t ) P H 2 d i s ( t ) η H 2 d i s
S H 2 ( t ) = S H 2 ( t 1 ) + P E S H 2 ( t ) Δ t
S H 2 , min S H 2 ( t ) S H 2 , max
S H 2 ( 0 ) = S H 2 ( T )
P H 2 d i s ( t ) P H 2 c h r ( t ) = 0
In the equations, η H 2 c h r is the hydrogen charging efficiency of the hydrogen storage tank; η H 2 d i s is the hydrogen discharging efficiency of the hydrogen storage tank; P E S H 2 ( t ) is the hydrogen charging power of the hydrogen storage tank at time t. S H 2 ( t 1 ) and S H 2 ( t ) are the hydrogen storage levels of the hydrogen storage tank at times t and t − 1, respectively. S H 2 , min and S H 2 , max are the lower and upper limits of the hydrogen storage tank capacity, respectively. T is the scheduling period, which is 24 h. Δ t is scheduling step size, 1 h.
(4)
Methane reactor (MR)
P M g , g ( t ) = η M R P H 2 , M R ( t )
P H 2 , M R min P H 2 , M R ( t ) P H 2 , M R max
Δ P H 2 , M R min P H 2 , M R ( t + 1 ) P H 2 , M R ( t ) Δ P H 2 , M R max
In the equation, P H 2 , M R ( t ) is the hydrogen power input to the methane reactor in time period t; P M g , g ( t ) is the methane power output; η M R is the conversion efficiency of the methane reactor; P H 2 , M R max and P H 2 , M R min are the upper and lower limits of the hydrogen power input, respectively; Δ P H 2 , M R max and Δ P H 2 , M R min are the upper and lower limits of the ramp rate of the methane reactor.

2.3. Tiered Carbon-Trading Model

The carbon-trading mechanism controls carbon emissions by establishing legal carbon-emission rights and allowing producers to trade them on the market. The regulatory agencies first allocate carbon-emission quotas to each carbon-emission source, and manufacturers produce and emit carbon within their allocated quotas. If actual carbon emissions are lower than the allocated quota, the remaining quota can be traded on the carbon-trading market; otherwise, additional carbon-emission quotas must be purchased.
The tiered carbon-trading mechanism model is mainly composed of three parts: the carbon-emission quota model, the actual carbon-emission model, and the tiered carbon-emission trading model. The carbon-emission sources in this paper mainly come from purchased electricity and CHP. Some of the carbon is captured and stored by CCS, and some is synthesized into methane by MR for sale. The rest of the emissions are optimized, which realizes the optimization of the electricity–heat–carbon–hydrogen cycle and promotes the low-carbon transformation of VPP.
(1)
VPP Carbon-Emission Quota Allocation Model.
There are two main types of carbon-emission sources in VPP: purchasing electricity from the superior power grid and CHP. Currently, the most commonly used quota allocation method in China is free allocation, and this paper assumes that the purchased electricity from the superior power grid is generated by coal-fired units [32].
{ E v p p , a = E q , a + E b u y , a E q , a = t = 1 24 i θ δ h ( H c h p i ( t ) + ϕ P c h p i ( t ) ) E b u y , a = χ g t = 1 24 P g r i d , b u y ( t )
In the equation, E v p p , a , E q , a and E b u y , a are the carbon-emission quota for VPP, CHP, and purchasing electricity from the superior power grid, respectively; δ h is the carbon-emission quota for unit heat supply; ϕ is the conversion factor for converting electricity generation into heat supply; χ g is the carbon-emission quota assigned to unit purchased electricity; H c h p i ( t ) and P c h p i ( t ) are the thermal output and electrical output of the ith CHP in time period t; P g r i d , b u y t is the electrical power input from the superior power grid to VPP.
(2)
Actual Carbon Emissions of VPP
The carbon-capture device can partially sequester the CO2 generated by VPP, and additionally, the MR can absorb a portion of CO2 during the hydrogen-to-methane conversion process. Therefore, the actual carbon-emission model is as follows:
{ E v p p = E b u y + E c h p E M R E C C S E b u y = t = 1 24 ( a 0 + a 1 P g r i d , b u y ( t ) + a 2 P g r i d , b u y 2 ( t ) ) E c h p = t = 1 24 i θ ( b 0 + b 1 P t o t a l i ( t ) + b 2 ( P t o t a l i ( t ) ) 2 ) P t o t a l i ( t ) = P c h p i ( t ) + H c h p i ( t ) E M R = t = 1 24 ϖ P M R   ( t ) E C C S = t = 1 24 E C C S ( t )
In the equation, E v p p is the actual carbon emissions of VPP, E c h p is the carbon emissions of CHP, E b u y is the purchased electricity from the superior power grid by VPP, E M R is the amount of CO2 absorbed by MR, E C C S is the amount of CO2 sequestered by CCS. P g r i d , b u y ( t ) is the purchased electricity power from the superior power grid by VPP in time period t. a 0 , a 1 , a 2 and b 0 , b 1 , b 2 are the carbon-emission calculation parameters for purchased electricity power and CHP output, respectively. P c h p i ( t ) and H c h p i ( t ) are the electrical output and thermal output of the ith CHP in time period t. θ is the number of CHP. P M R ( t ) is the hydrogen power input to the MR in time period t. ϖ is the parameter for CO2 absorption during the hydrogen-to-natural-gas conversion process in the MR equipment. E C C S ( t ) is the amount of CO2 sequestered by CCS at time t.
(3)
Tiered Carbon-Trading Model.
The tiered carbon-trading model adopts a tiered carbon price, which sets different carbon-emission ranges based on the difference between actual carbon emissions and carbon quotas. Each range corresponds to a different unit carbon-trading price. When the difference between actual carbon emissions and carbon quotas exceeds the set range, the carbon-trading price for the excess emissions also increases. The greater the difference, the higher the corresponding carbon-trading price. The cost calculation expression for the tiered carbon-trading model is as follows [32]:
E v p p , t = E v p p E v p p , a
F C O 2 = { λ E v p p , t E v p p , t l λ ( 1 + α ) ( E v p p , t l ) + λ l l E v p p , t 2 l λ ( 1 + 2 α ) ( E v p p , t 2 l ) + λ ( 2 + α ) l 2 l E v p p , t 3 l λ ( 1 + 3 α ) ( E v p p , t 3 l ) + λ ( 3 + 3 α ) l 3 l E v p p , t 4 l λ ( 1 + 4 α ) ( E v p p , t 4 l ) + λ ( 4 + 6 α ) l 4 l E v p p , t
In the equation, F C O 2 is the tiered carbon-trading cost, λ is the base carbon-trading price, l is the length of the carbon-emission range, α is the rate of price increase.

3. Virtual Power Plant Low-Carbon Economic Dispatch Model

3.1. Objective Function

To maximize the economic benefit of the virtual power plant over a 24-h scheduling period, a low-carbon dispatch model is constructed. The expression for the objective function is as follows:
max F = max ( F s a l e F o m F m a i n F C O 2 )
In the equation, F s a l e is the revenue from electricity, heating, and gas sales of the VPP, F o m is the annual operating cost of the VPP, F m a i n is the annual equipment maintenance cost of the VPP, and F C O 2 is the carbon-trading cost.

3.1.1. Revenue from Selling Electricity, Heat, and Gas for a Virtual Power Plant (VPP)

F s a l e = t = 1 24 [ α ( t ) ( P w i n d ( t ) + P p v ( t ) + P H F C , e ( t ) + i θ P c h p i ( t ) P c c s ( t ) P e l ( t ) P E H ( t ) ) + β ( t ) ( i θ H c h p i ( t ) + H E H ( t ) + H H F C , h ( t ) ) + γ ( t ) P M g , g ( t ) ]
In the equation, i is the index of the CHP unit. θ is the total number of CHP units in the VPP. P c h p i ( t ) and H c h p i ( t ) are the electricity and heat output of the ith CHP unit at time t, respectively. P w i n d ( t ) and P p v ( t ) are the power output of the wind and photovoltaic power plants at time t, respectively. P E H ( t ) and H E H ( t ) are the electric-to-heat conversion power and heat supply power of the electric boiler at time t, respectively. P c c s ( t ) is the total energy consumption of the CCS at time t. P H F C , e ( t ) and H H F C , h ( t ) are the power output of the hydrogen fuel cell for electricity and heat supply, P e l ( t ) is the power consumption of the electrolyzer, respectively, at time t. P M g , g ( t ) is the output power of the methane reactor at time t. α ( t ) , β ( t ) and γ ( t ) are the selling prices of electricity, heat, and gas for the VPP at time t, respectively.

3.1.2. Operating Cost of a Virtual Power Plant (VPP)

The operating cost of a virtual power plant (VPP) includes CHP unit fuel cost, purchased electricity cost from the main power grid, wind and solar curtailment penalty costs, CCS equipment carbon capture and storage costs, and environmental costs.
F o m = F f u e l + F g r i d + F w a s t e + F F Q + F C B
(1)
The Fuel Cost of Combined Heat and Power (CHP) Units
F f u e l = i θ φ [ c 0 + c 1 P c h p i ( t ) + c 2 H c h p i ( t ) + c 3 ( P c h p i ( t ) ) 2 + c 4 P c h p i ( t ) H c h p i ( t ) + c 5 ( H c h p i ( t ) ) 2 ]
In the equation, F f u e l is the cost of purchasing coal for the CHP units. φ is the unit price of standard coal. c 0 , c 1 , c 2 , c 3 , c 4 , c 5 is the fitting coefficient for the coal consumption characteristics of the CHP units.
(2)
The Purchased Electricity Cost
F g r i d = t = 1 24 C g r i d , b u y ( t ) P g r i d , b u y ( t )
In the equation, F g r i d is the cost of purchasing electricity from the main power grid for the virtual power plant (VPP). P g r i d , b u y ( t ) is the power purchased by the VPP from the main power grid during time period t. C g r i d , b u y ( t ) is the unit price of electricity purchased by the VPP from the main power grid during time period t.
(3)
The Cost of Curtailment for Wind and Solar Power
F w a s t e = t = 1 24 [ C w a s t e , w i n d P w a s t e , w i n d ( t ) + C w a s t e , p v P w a s t e , p v ( t ) ]
P w a s t e , w i n d ( t ) = P w i n d 0 ( t ) P w i n d ( t )
P w a s t e , p v ( t ) = P p v 0 ( t ) P p v ( t )
In the equation, F w a s t e is the cost of curtailment for the virtual power plant (VPP). C w a s t e , w i n d and C w a s t e , p v are the penalty fees per unit of curtailed wind and solar power. P w i n d 0 ( t ) and P p v 0 ( t ) the potential generation capacity of solar and wind power during time period t. P w i n d ( t ) and P p v ( t ) are the actual generation capacity of solar and wind power during time period t.
(4)
Cost of CO2 Capture and Storage (CCS)
F F Q = t = 1 24 k F Q E C C S ( t )
P C C S ( t ) = P B + P R ( t )
P R ( t ) = w C E C C S ( t )
In the equation, k F Q is the cost coefficient of carbon capture and storage (CCS), E C C S ( t ) is the total energy consumption of CCS during time period t, P B is the baseline energy consumption of CCS, also known as fixed energy consumption, P R ( t ) is the operating energy consumption of CCS, which can be calculated based on the amount of CO2 captured, w C is the energy required to process one unit of CO2.
(5)
Environmental Cost of VPP
The environmental cost of a virtual power plant can be calculated based on the amount of pollutants emitted by CHP units during time period t, using the following formula [33],
F C B = t = 1 24 [ j m v e j d e j i θ ( P c h p i ( t ) + H c h p i ( t ) ) + v j ]
In the equation, m is the type of different pollutants, which mainly include SO2, NOX, CO2, CO, etc. v e j is the control cost of the jth pollutant, d e j is the amount of the jth pollutant emitted per unit output of the CHP unit, and v j is the penalty cost for emitting the jth pollutant by the CHP unit.

3.1.3. Operational and Maintenance Cost of VPP

The operational and maintenance costs of the virtual power plant (VPP), including the hydrogen energy storage system, electric boiler, and carbon-capture power plant, can be referred to as follows.
F m a i n = F H 2 + F c h s o m + F e p o m
(1)
Operational and Maintenance Cost of Hydrogen Energy Storage System
F H 2 = ( C e l Q e l + C f c Q f c + C h s t Q h s t + C M R Q M R )
In the equation, C e l , C f c , C h s t and C M R are the unit operational and maintenance costs of the electrolyzer, hydrogen fuel cell, hydrogen storage tank, and methane reactor, respectively, Q e l , Q f c , Q h s t and Q M R are the installed capacity of the electrolyzer, hydrogen fuel cell, hydrogen storage tank, and methane reactor, respectively.
(2)
Operational and Maintenance Cost of Carbon-Capture Power Plants [34].
F c h s o m = χ 1 χ ( F c h s + F f u e l )
F c h s = ρ c V c 365 n ( 1 s ) ( 1 + 18.6 % )
In the equation, χ is the proportion of operational and maintenance costs to the total cost. F c h s is the depreciation cost of the carbon-capture power plant. F f u e l is the coal consumption cost of the combined heat and power (CHP) unit. ρ c is the unit cost of capacity. V c is the total installed capacity. n is the service life. s is the line loss rate [35].
(3)
Operational and Maintenance Cost of Electric Boiler
F e p o m = ρ E V E δ 365
In the equation, ρ E is the installation cost required for a unit capacity of an electric boiler, and V E is the installed capacity of the electric boiler. δ is the proportion of annual maintenance costs of the electric boiler to the total construction cost.

3.1.4. Carbon-Trading Cost

Refer to Equation (19).

3.2. Constraint Conditions

3.2.1. The Constraint on Wind and Solar Power Output

0 P w i n d 0 ( t ) P w i n d , N
0 P p v 0 ( t ) P p v , N
In the equation, P w i n d , N and P p v , N are the rated installed capacity of wind farms and solar power plants, respectively.

3.2.2. The Constraint of Electricity Balance

i θ P C H P i ( t ) + P p v ( t ) + P w i n d ( t ) + P g r i d , b u y ( t ) + P H F C , e ( t ) = P l o a d ( t ) + P e l ( t ) + P E H ( t ) + P C C S ( t )
0 P g r i d , b u y ( t ) P g r i d , b u y max
In the equation, P g r i d , b u y ( t ) is the purchasing power from VPP to the higher-level power grid during time period t. P H F C , e ( t ) is the power input of hydrogen fuel cells during time period t. P l o a d ( t ) is the electric load power during time period t. P e l ( t ) is the power of the electrolyzer during time period t. P E H ( t ) is the power of the electric boiler during time period t. P C C S ( t ) is the power of the carbon capture and storage (CCS) system during time period t. P g r i d , b u y max is the upper limit of purchasing power.

3.2.3. The Constraint of Thermal Balance

i θ H C H P i ( t ) + H E H ( t ) + H H F C , h ( t ) = H l o a d ( t )
In the equation, H E H ( t ) is the thermal power converted by an electric boiler in time period t, H H F C , h ( t ) is the thermal power input by hydrogen fuel cells in time period t, and H l o a d ( t ) is the thermal load power in time period t.

3.2.4. The Constraint of Hydrogen Power Balance

P e l , H 2 ( t ) = P H 2 , M R ( t ) + P H 2 , H F C ( t ) + P E S H 2 ( t )
In the equation, P e l , H 2 ( t ) is the hydrogen production power of the electrolyzer. P H 2 , M R ( t ) is the hydrogen consumption power of the methane reactor. P H 2 , H F C ( t ) is the hydrogen consumption power of the hydrogen fuel cell. P E S H 2 ( t ) is the hydrogen storage power in the hydrogen storage tank.

3.2.5. The Constraints of the Hydrogen Energy Storage System

EL, MR, HFC, and HST can be described by Equations (1)–(15).

3.2.6. The Constraints on Carbon-Capture Quantity for CCS

To ensure the utilization and regular maintenance of CCS, a minimum capture rate must be set. Therefore, the constraint on the carbon-capture quantity for CCS can be expressed as follows [36],
η min E C H P ( t ) E C C S ( t ) η max E C H P ( t )
In the equation, where η max and η min are the upper and lower bounds of the carbon-capture rate for CCS devices, respectively.

3.2.7. Capacity Constraint of Electric Boiler

0 H E H ( t ) H E H
In the equation, H E H is the capacity for configuring electric boiler.

3.2.8. Constraint on Electric–Thermal Conversion of Electric Boiler

H E H ( t ) = η E H P E H ( t )
In the equation, η E H is electric–thermal conversion efficiency during the operation of an electric boiler.

3.2.9. Constraints on Thermal and Electric Output and Ramping of CHP Units

{ P C H P i , min P C H P i ( t ) P C H P i , max H C H P i , min H C H P i ( t ) H C H P i , max R C H P i , d o w n P C H P i ( t + 1 ) P C H P i ( t ) R C H P i , u p
In the equation, P C H P i , max and P C H P i , min are the lower and upper limits of electric power for the ith CHP unit, H C H P i , max and H C H P i , min are the lower and upper limits of thermal power for the ith CHP unit, R C H P i , u p and R C H P i , d o w n are the upper and lower limits of ramping rate for the ith CHP unit.

3.2.10. Operational Region Constraints for Combined Heat and Power Generation

Due to the thermoelectric coupling characteristics and the unique operation mode of heat-driven electricity generation, specific thermoelectric operating ranges exist for two types of heat-driven electricity generation units [36].
For backpressure CHP units, the electrical output and heat output need to maintain a certain proportional relationship. This is represented by the slope of the line in Figure 2a. When operating in a “heat-led” mode, this type of unit has only one operational state, namely.
P C H P i ( t ) = γ C H P H C H P i ( t ) = P C H P max P C H P min H C H P max H C H P min H C H P i ( t )
In the equation, P C H P max and P C H P min are the maximum and minimum electric output of the ith CHP unit, respectively, H C H P max and H C H P min are the maximum and minimum thermal output of the ith CHP unit, respectively.
The operational range of an absorption-type CHP unit, considering both thermal and electric output, is depicted in Figure 2b. The constraints on the operational range of the absorption-type CHP unit, considering both thermal and electric output, can be represented by the following equation.
{ P C H P i , min c v 2 i H C H P i ( t ) P C H P i ( t ) P C H P i , max c v 1 i H C H P i ( t )   0 H C H P i H C H P m e d c m i ( H C H P i ( t ) H C H P i , m e d ) + P C H P i , min P C H P i ( t ) P C H P i , max c v 1 i H C H P i ( t ) H C H P i m e d H C H P i H C H P i , max
In the equation, P C H P i , max and P C H P i , min are the maximum and minimum electric outputs of the ith CHP unit, respectively. H C H P i max and H C H P i min are the maximum and minimum thermal output of the ith CHP unit, respectively. H C H P i m e d is the thermal output corresponding to the minimum electric output of the ith CHP unit. c v 1 i and c v 2 i are the decrease in maximum and minimum output under constant turbine intake when extracting a unit of heat for the ith unit. c m i is the coefficient of the ratio between electric output and thermal output when the ith CHP unit operates under back pressure conditions.

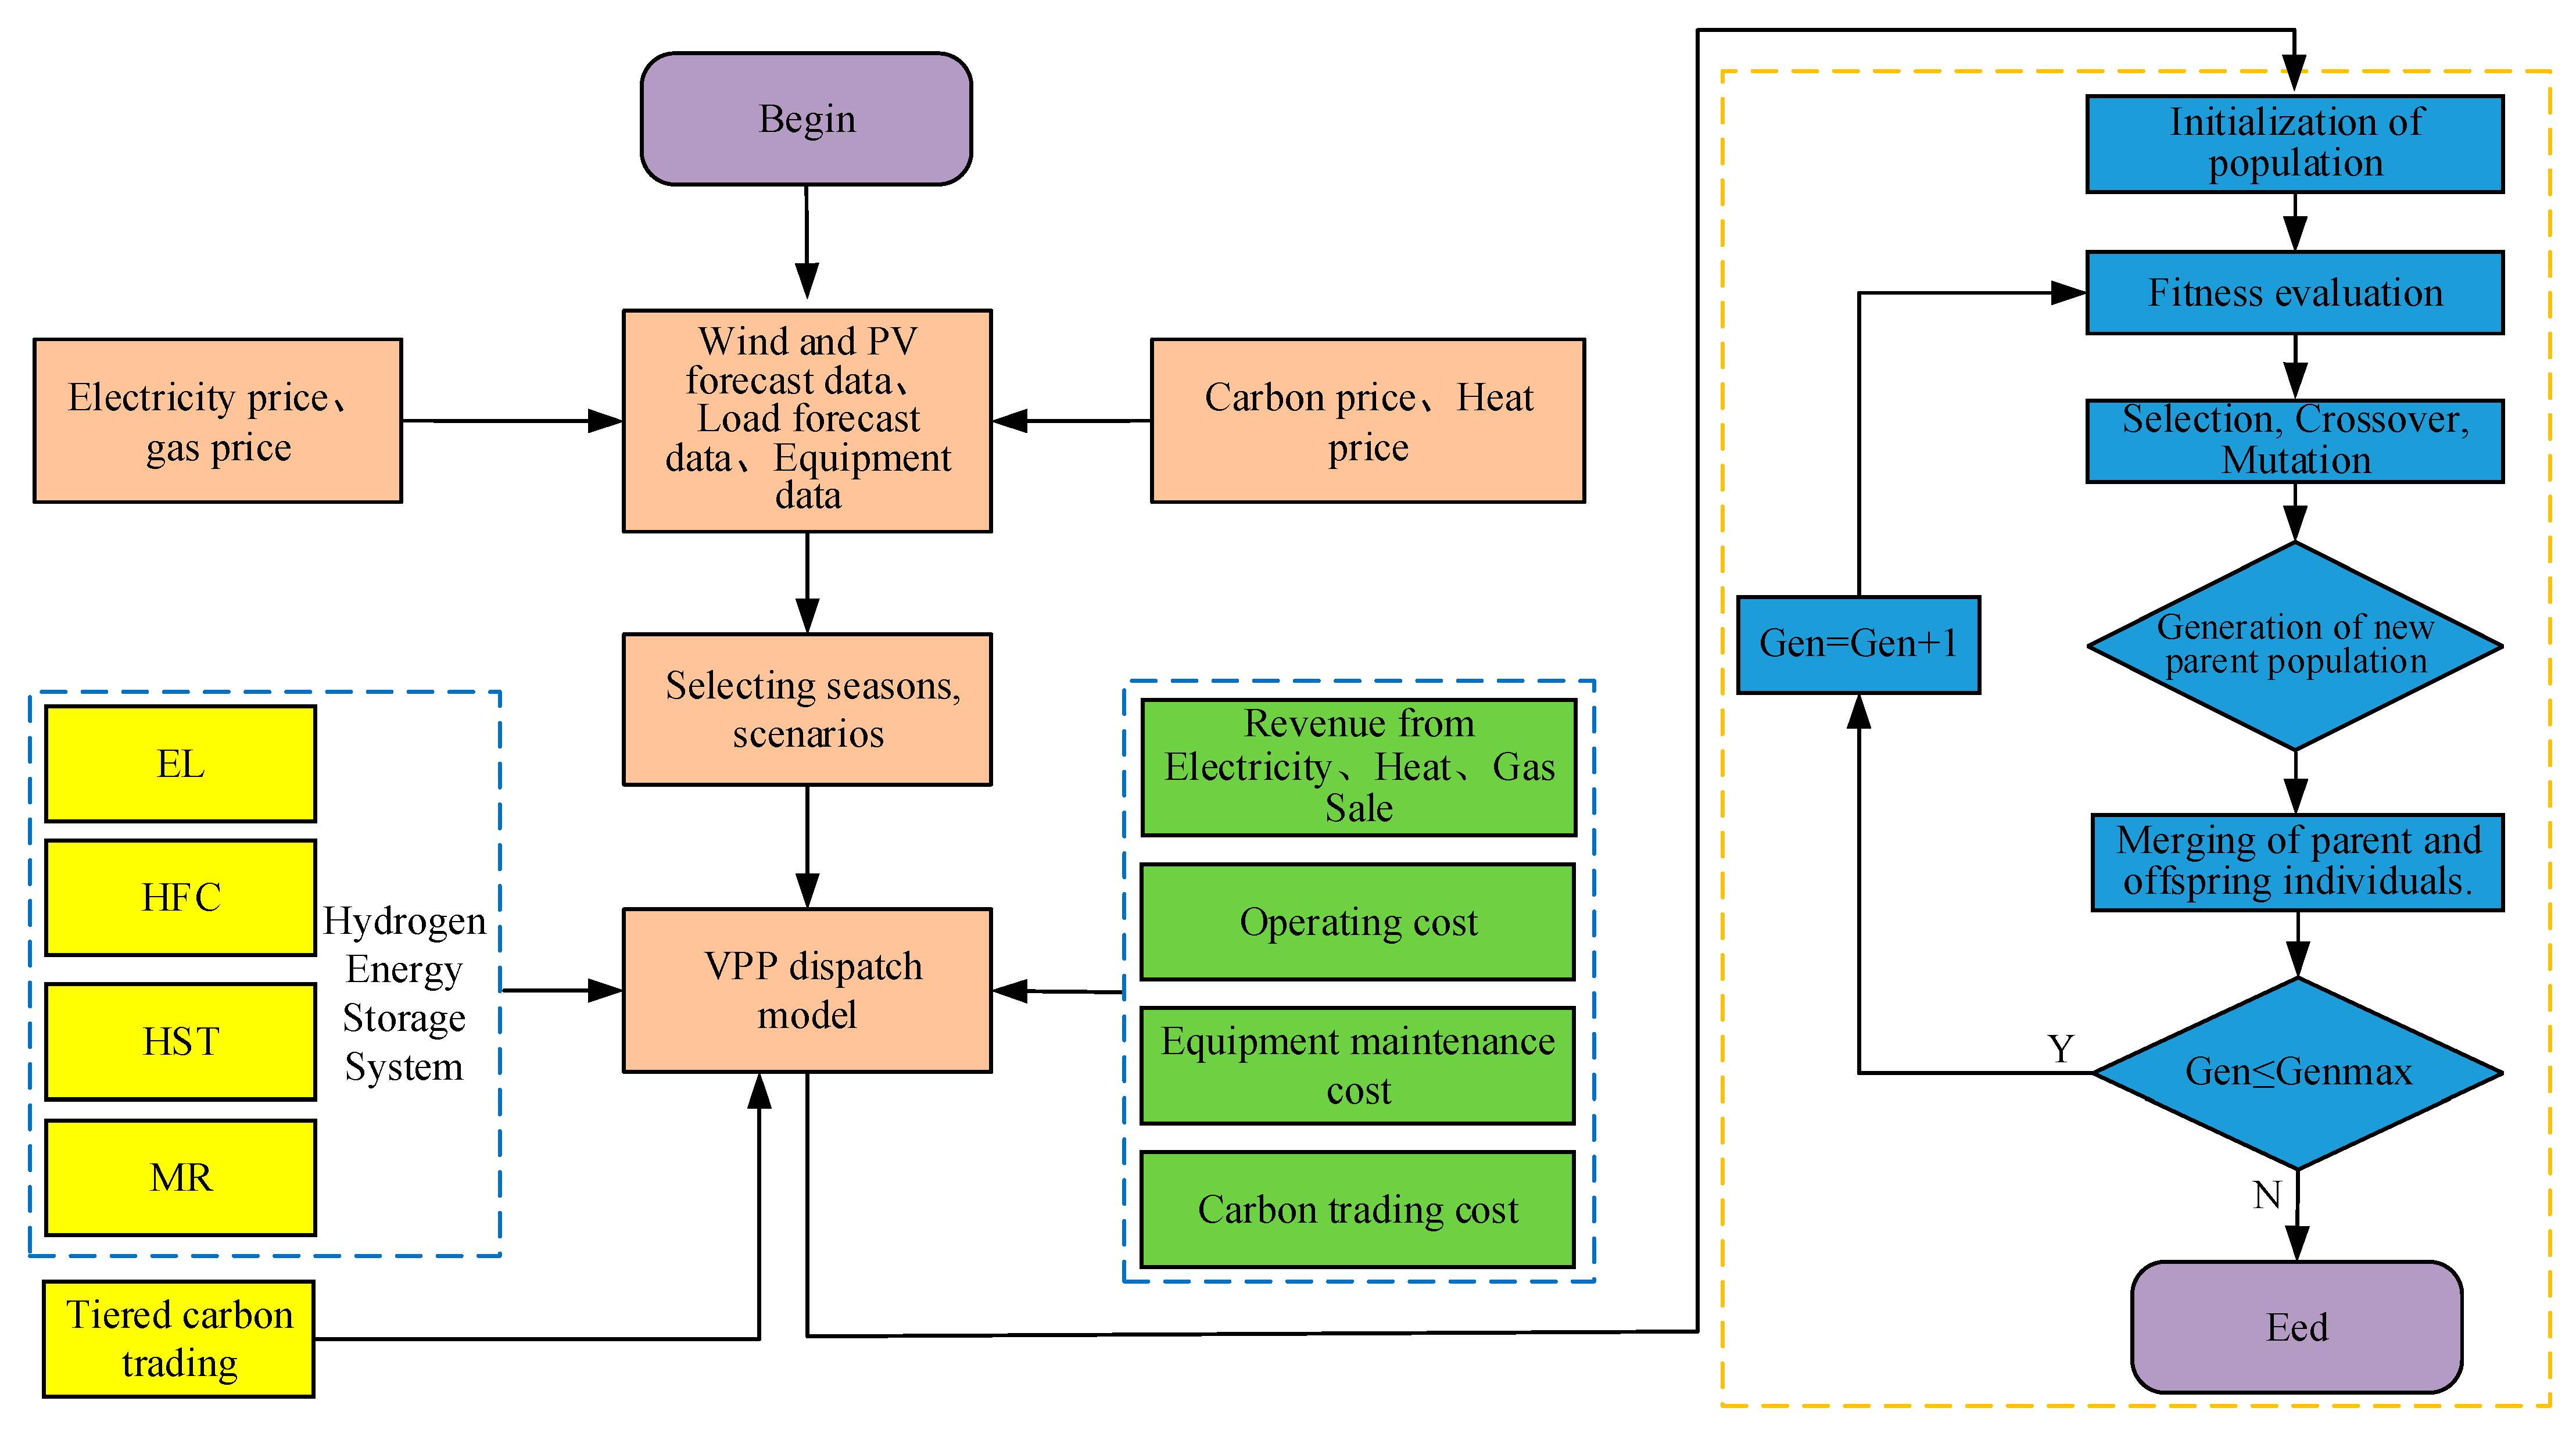
3.3. Algorithm Flowchart for Model Solving

The VPP low-carbon economic dispatch model established in the first two sections of this chapter is solved using a genetic algorithm, and the solving process is shown in Figure 3.
The solving process of the VPP low-carbon economic dispatch model is as follows: First, input the predicted data of wind power, photovoltaic power, and load for all three seasons, as well as equipment parameters, electricity, heat, gas, carbon prices, etc. Second, select different seasons, consider different scenarios, and choose corresponding data and the VPP low-carbon economic dispatch model as the original data for model solving. Finally, use the electrical and thermal output of some equipment as the fitness calculation (VPP net profit), perform selection, crossover, and mutation operations to generate a new parent population, merge the two populations, determine if the iteration number has been reached, if not, start iterative optimization until the maximum iteration number is reached, end the solving process, and output the final optimization results.

4. Case Study Analysis

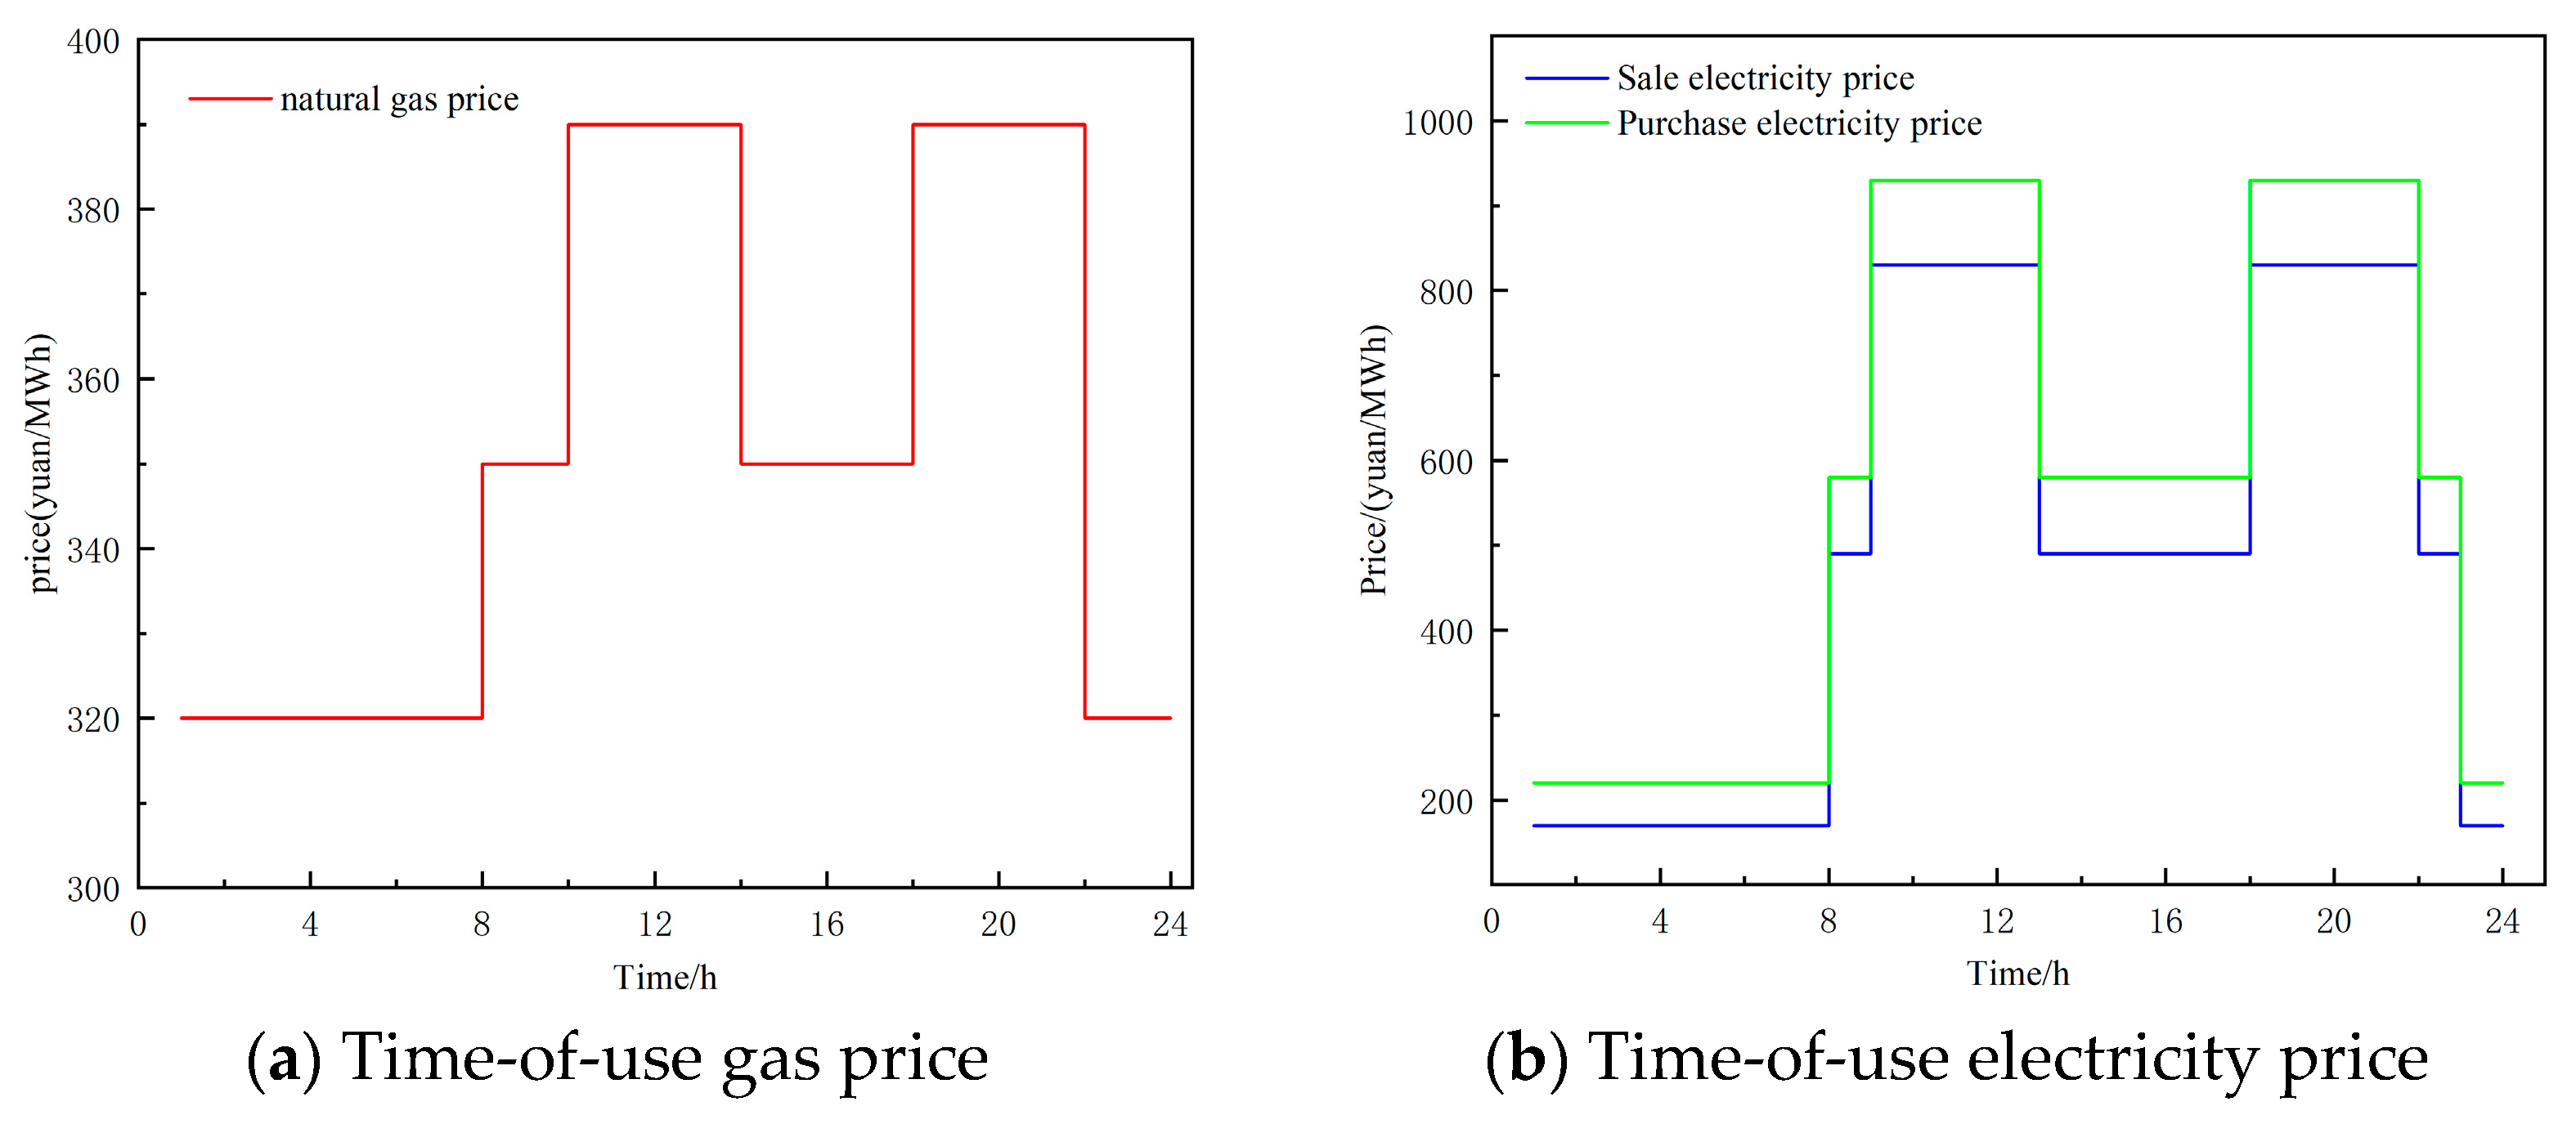
4.1. Case Study Parameters

To validate the effectiveness of the proposed low-carbon economic model, a case study is set up for verification. Optimize the scheduling with 24 h a day as a cycle. The installed capacity of the virtual power plant generators is as follows: 372 MW for CHP units (consisting of one backpressure CHP unit and one extraction-condensing CHP unit), 220 MW for the wind farm, and 100 MW for the solar power station. The carbon-trading prices are set at 90 CNY/t for both traditional carbon trading and tiered carbon trading, with an interval length (l) of 200 tons and a price growth rate (α) of 25%. The parameters of the VPP system equipment are shown: the coal consumption characteristics of the CHP units are shown in Table 1, and the environmental cost parameters are shown in Table 2. The electricity and gas prices of the VPP are shown in Figure 4, with a heat price of 90 CNY/MWh. The calculations were performed on a computer equipped with an Intel Core i7-10750H 2.60 GHz processor and 16 GB of memory. The model is written by MATLAB and solved by a genetic algorithm.
The coal consumption characteristics parameters of the two CHP units are shown in Table 1.
The environmental cost parameters associated with pollutants generated by the two CHP units are shown in Table 2.
The energy price of VPP, as shown in Figure 4, mainly includes natural gas prices, selling electricity prices, and purchasing electricity prices.

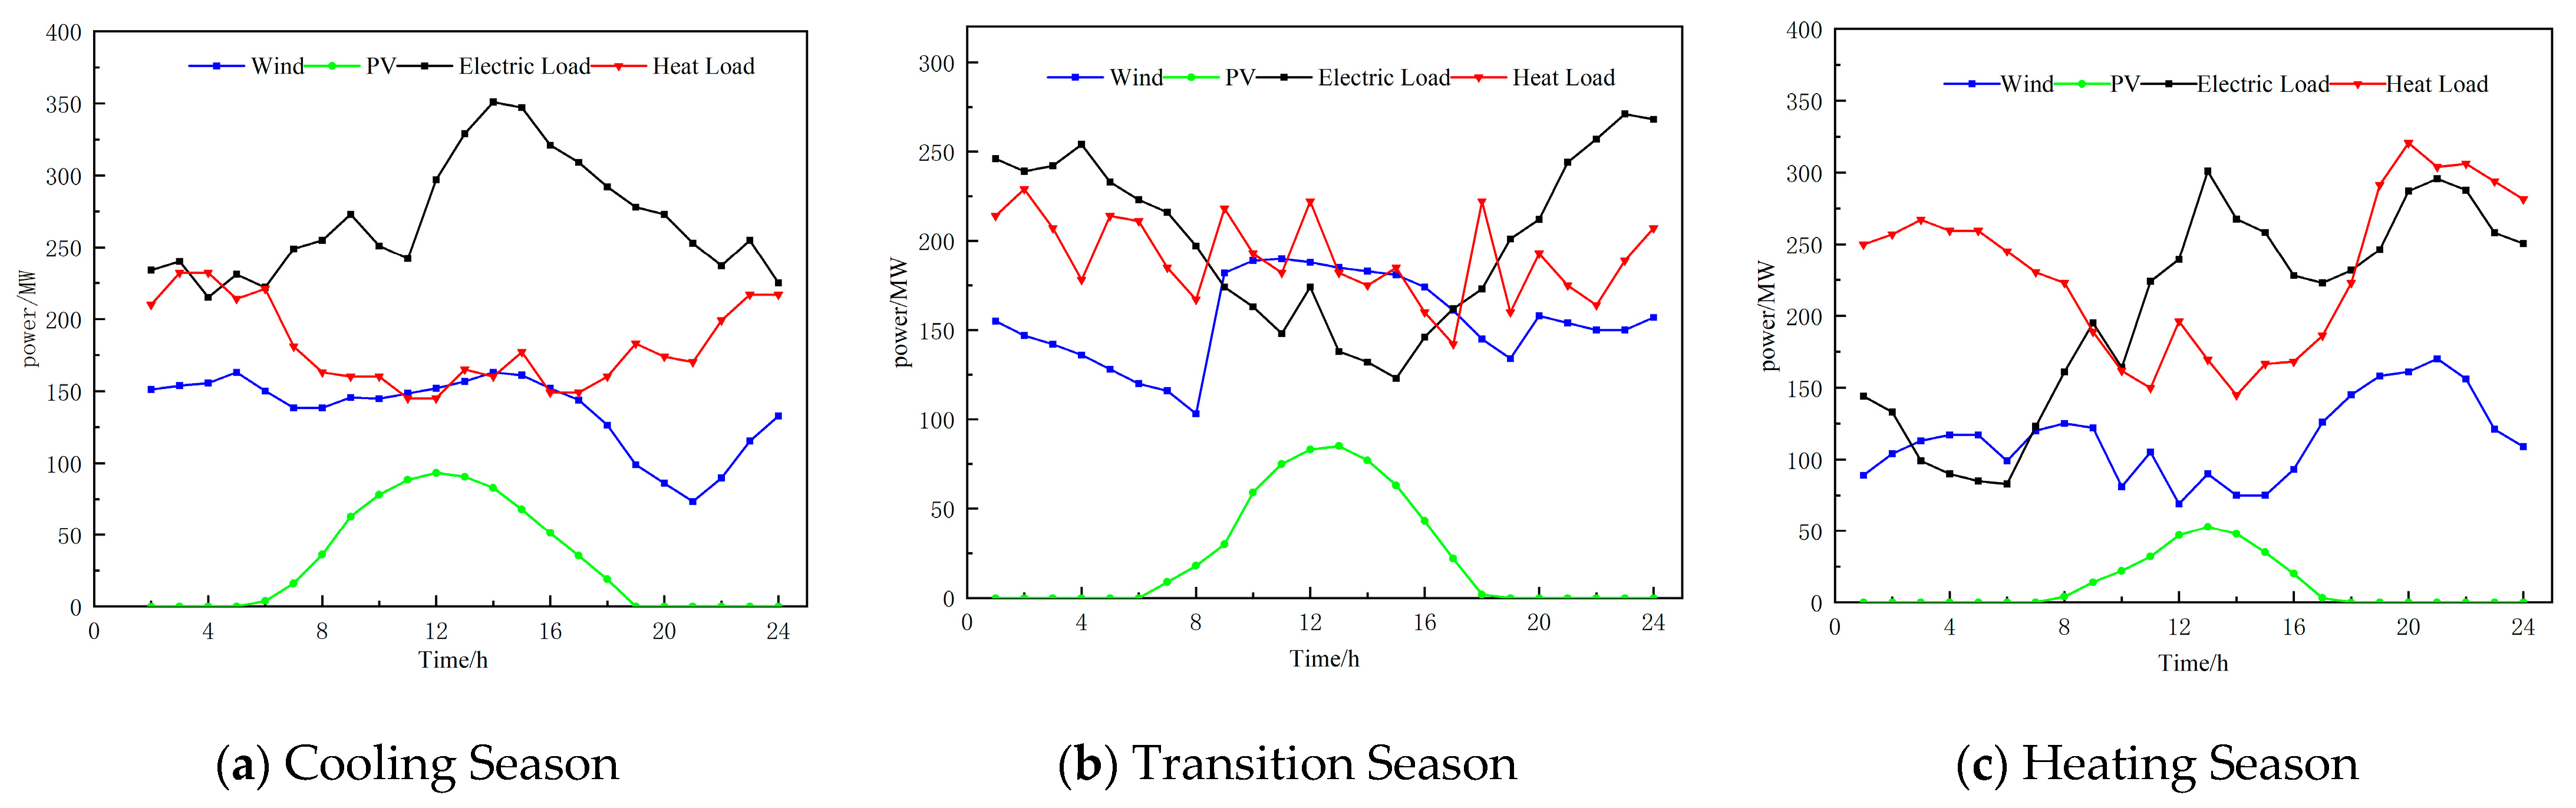
4.2. Scenario Setting

To verify the effectiveness and rationality of considering hydrogen energy storage and the tiered carbon trading in the VPP optimization scheduling model, the CCS equipment is installed on the CHP unit, and the following three scenarios are set for simulation under the input data of wind and solar load forecasts for the cooling season, transition season, and heating season. Finally, the scheduling results are analyzed to provide corresponding scheduling strategies.
Scenario 1. The CHP unit is decoupled with an electric boiler and without hydrogen energy storage, considering the traditional carbon-trading mechanism.
Scenario 2. The CHP unit is decoupled with an electric boiler and with hydrogen energy storage, considering the traditional carbon-trading mechanism.
Scenario 3. The CHP unit is decoupled with an electric boiler and with hydrogen energy storage, considering the tiered carbon-trading mechanism.

4.3. Analysis of Scheduling Results under Different Scenarios

The predicted data for wind power, photovoltaic power, electric load, and heat load for the cooling season, transition season, and heating season are shown in Figure 5. By comparing the VPP’s electricity and heat sales revenue, fuel cost, wind and solar curtailment cost, and carbon emissions under the three scenarios set in the three seasons, the optimal scheduling strategy was selected and analyzed.

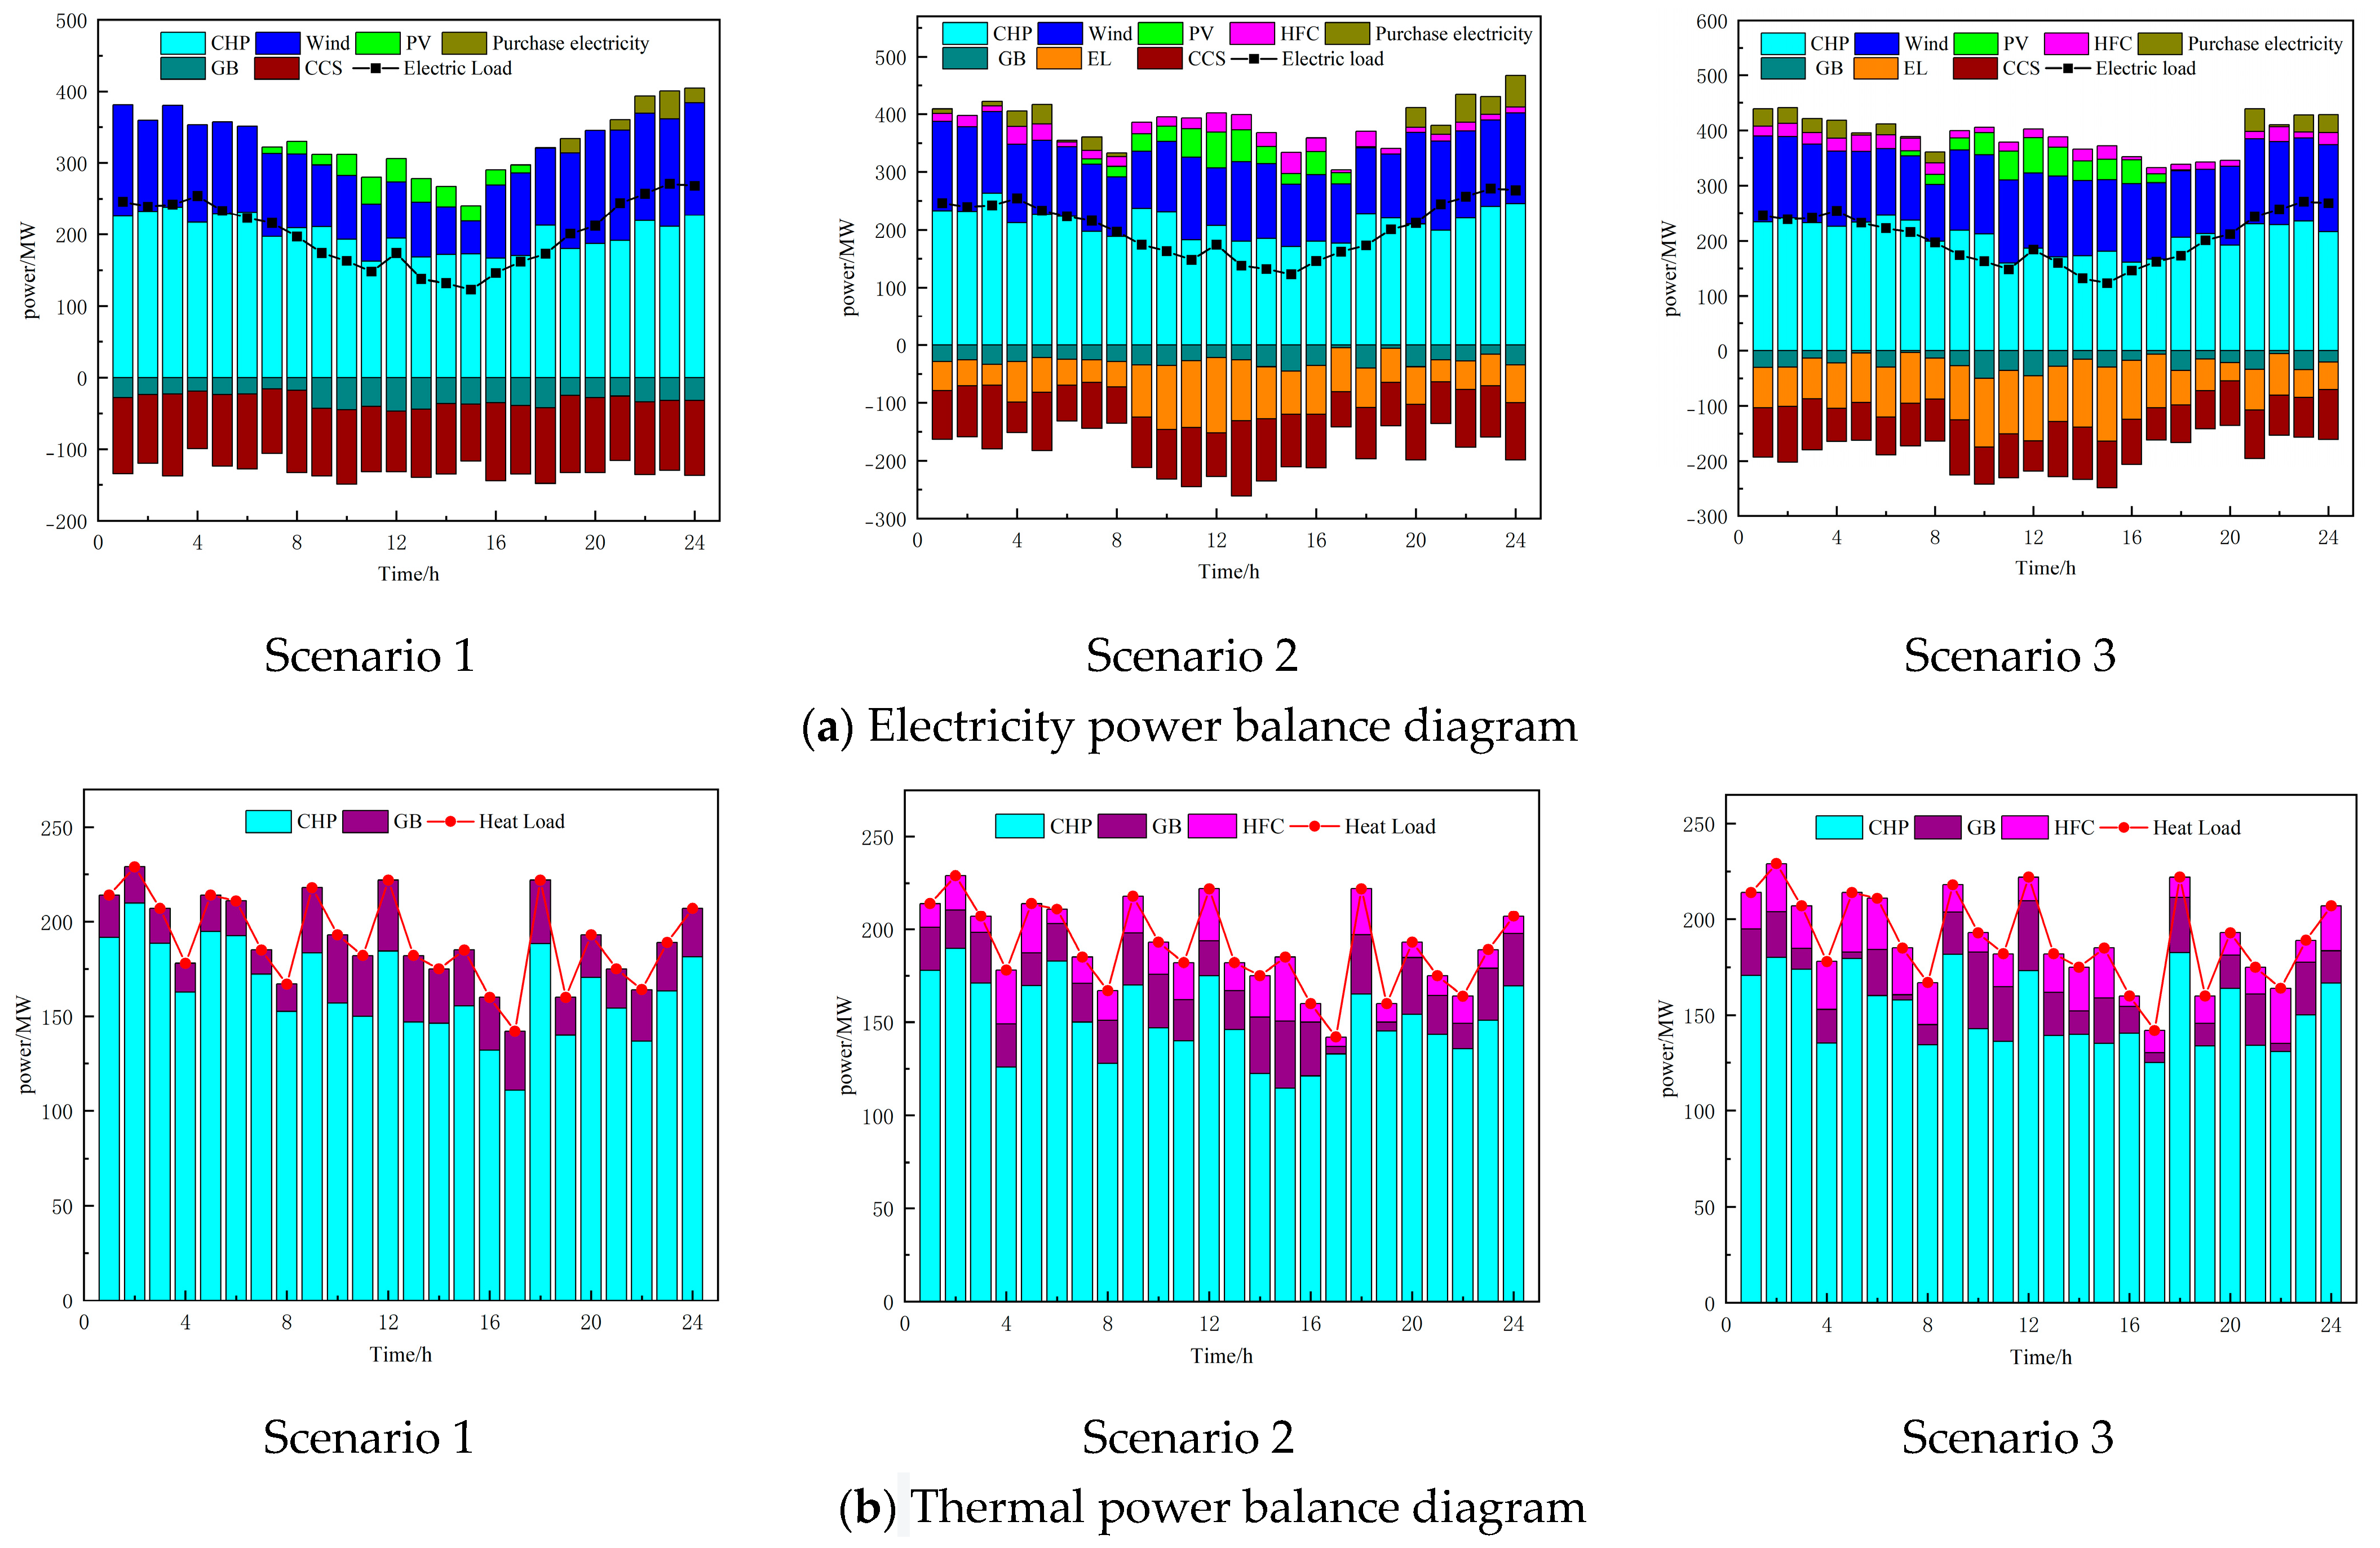
4.3.1. Analysis of Scheduling Results during the Cooling Season

The analysis of scheduling results during the cooling season is shown in Figure 6, which displays the electric-power and heat-power balance in three different scenarios. The parameter comparison of VPP revenue under different scenarios is presented in Table 3.
Combining Figure 6 and Table 3, it can be observed that due to the “heat-driven electricity” constraint, the output power of the combined heat and power (CHP) units cannot be reduced, resulting in a large amount of curtailed wind and solar power in Scenario 1. This leads to significant curtailment costs. In Scenario 2, the introduction of a hydrogen energy storage system allows for greater integration of wind and solar power during periods of high generation. During the peak load period, the system can release electricity and heat, reducing the output of CHP units and thus lowering fuel costs. Therefore, the fuel cost in Scenario 2 is reduced by 24.25%. However, the introduction of the hydrogen energy storage system leads to a 4.7% decrease in revenue from selling electricity, heat, and gas due to considerations of its operation and maintenance cost. To reduce carbon emissions, the purchasing cost of electricity increases by 26%. At the same time, the carbon transaction cost and carbon emissions are reduced by 28.43% and 9.04 %, respectively, but the net income is increased by 29.71%. In Scenario 3, the tiered carbon-trading mechanism is introduced based on Scenario 2, which further reduces the fuel cost by 11.55% and increases the integration of wind and solar power, leading to a 4.27% reduction in curtailment cost. The purchasing cost of electricity decreases by 38.62%, and the cost of carbon trading and carbon emissions are reduced by 43.67% and 36.64%, respectively. Although there is a 0.87% decrease in revenue from selling electricity, heat, and gas, the overall net profit increases by 15.6%. Therefore, under cooling season conditions, it can be concluded that the proposed model in this paper can increase the integration of wind and solar power, reduce carbon emissions, and improve the economic benefits of the virtual power plant (VPP), demonstrating its practicality.
As shown in Figure 6, the power balance diagram for Scenario 3 is as follows: From 1:00 to 5:00, when the photovoltaic (PV) power is zero, and the wind power is relatively low while the heat demand and electricity load are high, wind power is fully absorbed. The absorbed wind power is used for heat generation through an electric boiler and supplied by a combined fuel cell to reduce the heat output of the CHP units. This not only reduces the fuel cost but also enhances the flexibility and peak-shaving ability of the system. The remaining wind power is consumed through electrolyzer and carbon-capture devices to maintain a low carbon level. Due to the need to maintain the power balance, the VPP purchases a small amount of electricity from the main grid. From 6:00 to 14:00, the heat demand decreases sharply and reaches a low point, while the electricity load increases rapidly and enters the peak period. At this time, due to the low heat demand and the constraint of “heat-driven electricity,” the fuel cell and electric boiler outputs are limited by the minimum heat output of the CHP units. Therefore, the heat output of the CHP units is low, leading to a decrease in electricity output and a reduction in carbon emissions. The carbon-capture output decreases, and the electrolyzer output increases to consume the remaining wind and solar power. Additionally, more hydrogen gas is produced for methane synthesis to improve the profitability of selling gas. To maintain the power balance, the VPP experiences occasional curtailment and purchases a small amount of electricity. From 15:00 to 20:00, the electricity load decreases rapidly, and the heat demand gradually increases. At the same time, the power output of PV and wind decreases. This leads to an increase in the heat output of the CHP units. The electric boiler and fuel cell increase their heat outputs to reduce the heat output of the CHP units, resulting in a decrease in carbon-capture output. The electricity output of the CHP units increases, and to maintain the power balance, the VPP must purchase electricity from the main grid. This occurs during a period of high electricity prices, resulting in higher purchasing costs. From 21:00 to 24:00, the electricity load continues to decrease, the heat demand increases and the wind power also increases. The PV power is zero at this time. The fuel cell bears most of the remaining heat demand, and the VPP has high electricity and heat outputs, leading to higher carbon emissions. Therefore, the carbon-capture device output increases while the electrolyzer output decreases. There is no wind curtailment, but there are occasional small amounts of electricity purchases, which reduces its economic benefits. However, compared with Scenario 1 and Scenario 2, its power purchase cost is still low. Therefore, the overall net economic benefit is higher than the former two. Based on the above analysis, it can be concluded that the proposed model in this paper can increase the integration of wind and solar power, reduce carbon emissions, and improve the economic benefits of the VPP under cooling season conditions.

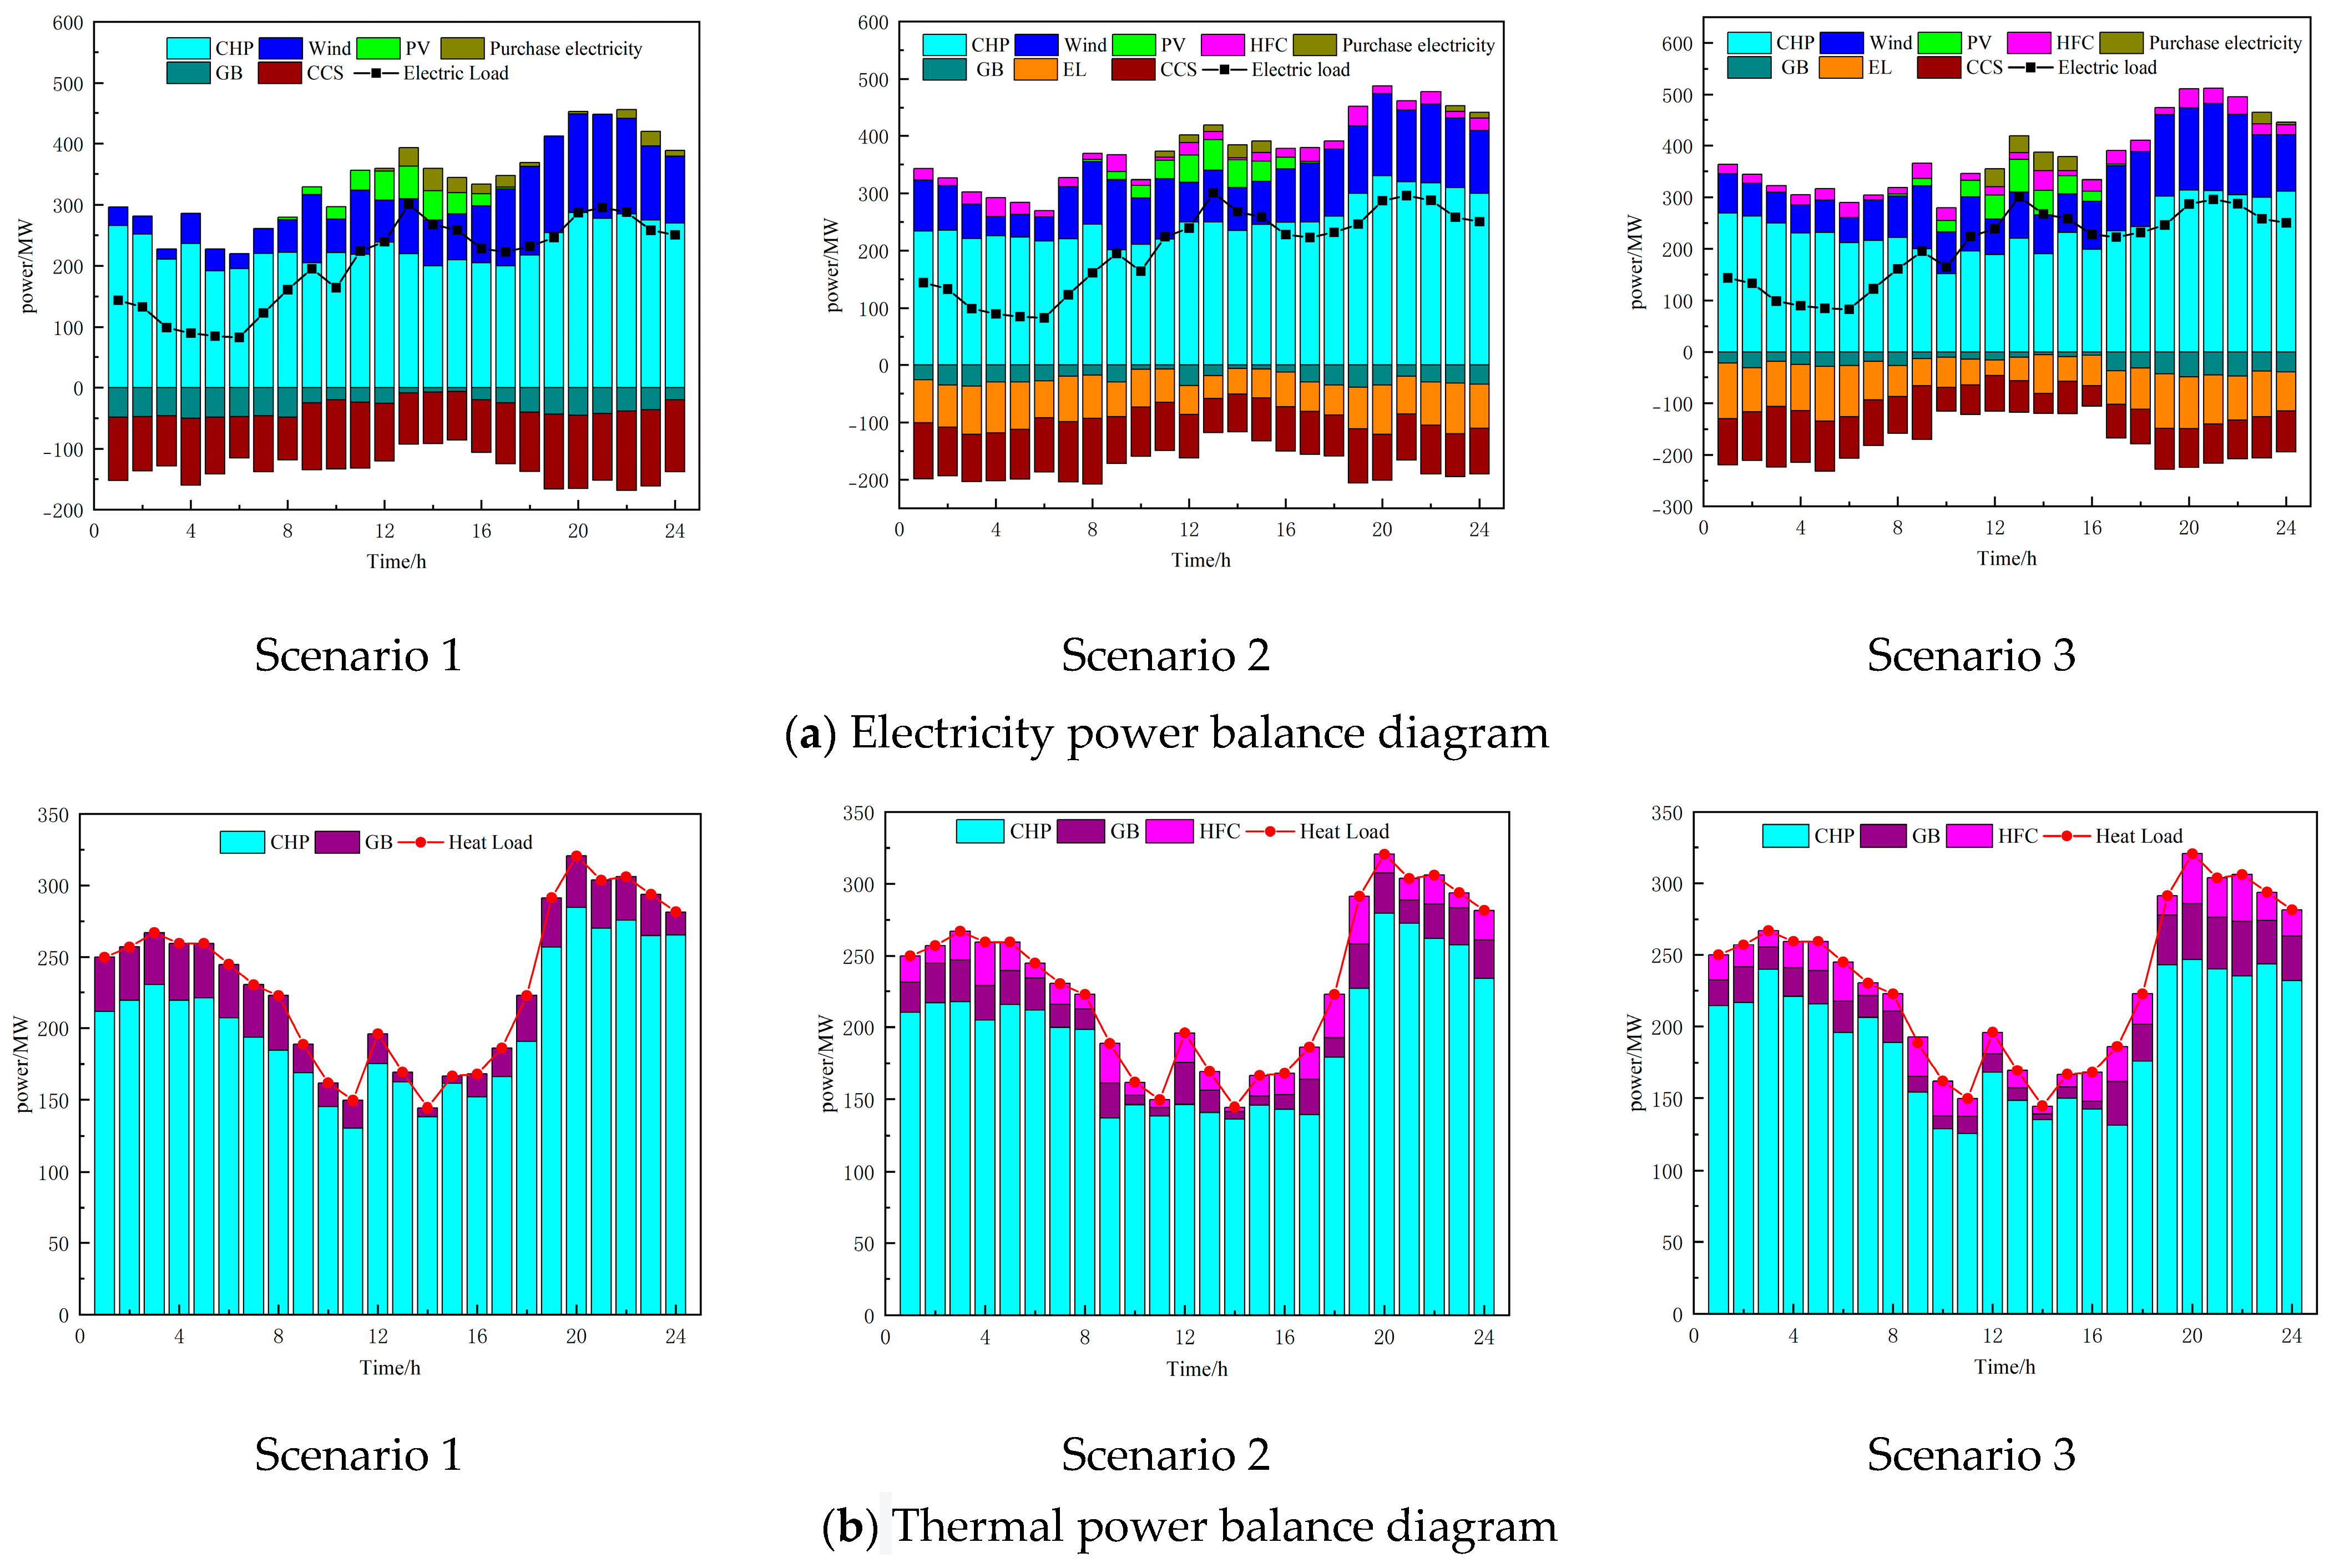
4.3.2. Analysis of Scheduling Results during the Transition Season

The analysis of scheduling results during the transition season is shown in Figure 7, which displays the electric-power and heat-power balance in three different scenarios. The parameter comparison of VPP revenue under different scenarios is presented in Table 4.
Based on Figure 7 and Table 4, it can be seen that due to the “heat-driven electricity” mode, the output of the CHP unit cannot be reduced, which leads to a large amount of wind and solar power being wasted during periods of low electricity demand. In particular, there is a long period of wind power curtailment during the transition season, resulting in high costs for wind and solar power curtailment, as well as high fuel costs and carbon emissions in Scenario 1. Scenario 2 introduces a hydrogen energy storage system, which can absorb excess wind and solar resources, increase the consumption of wind and solar power, and reduce the electricity and heat output of the CHP unit, therefore reducing the carbon emissions of the VPP. Compared with Scenario 1, the fuel cost, wind, and solar power curtailment cost, carbon-trading cost, and carbon emissions are reduced by 21.82%, 33.31%, 33.85%, and 10.28%, respectively, while the revenue of the VPP increases by 24.02%. Compared with Scenario 2, Scenario 3 introduces the tiered carbon-trading mechanism, which further optimizes the output of CHP, making it decline. The fuel cost decreased by 7.44%, while carbon emissions and carbon-trading costs decreased by 38.64% and 40%, respectively. The cost of purchasing electricity, the cost of abandoning wind and solar, and carbon emissions decreased by 32.10%, 28.39%, and 38.64%, respectively, but the net income increased by 12.24%. Therefore, it can be seen that when considering transitional seasons as inputs, the low-carbon economic dispatch model of the VPP established in this paper still possesses high economic benefits and the ability to reduce carbon emissions, demonstrating its practicality.
As can be seen from the electrothermal power balance diagram of Scenario 3 in Figure 7, during the 1:00–8:00 period, the PV output is almost zero, wind power gradually decreases, and the heat load fluctuates within a small range at a high level. The electric boiler consumes some of the wind power and converts it into heat energy, while the rest of the wind power is consumed by the carbon capture and the electrolyzer. To maintain the heat-power balance and reduce the heat output of the CHP unit, the fuel cell output is high, generating a large amount of heat and electricity to meet the demand. However, due to the high electric and heat output, the carbon emissions of the VPP remain high, which requires the carbon capture and the electrolyzer to increase their output to reduce carbon emissions, resulting in insufficient wind and solar power to meet the electricity demand. Therefore, the VPP has to purchase electricity from the main grid, increasing its purchase cost. During the period of 9:00–16:00, the electricity demand continues to decrease and remains at a low level throughout the day. The PV output slowly increases, but wind power rapidly increases and remains at a high level. The heat load still fluctuates within a small range, and the electric boiler output increases, while the fuel cell output decreases and the electrolyzer output increases to consume more wind and solar power. However, due to the “heat-driven electricity” mode of the CHP unit and the capacity constraints of the electrolyzer, wind and solar power curtailment occurs, increasing the cost of wind and solar power curtailment. During the 17:00–24:00 period, the electricity demand rapidly increases again, while the heat load still fluctuates within a small range. The PV output gradually decreases to zero, and wind power also decreases. At this time, the electric boiler output decreases, and the fuel cell burns a large amount of hydrogen to provide heat and electricity, increasing the flexibility and adjustability of the CHP unit’s electricity output. However, due to the high output of the CHP unit, the carbon emissions of the VPP remain high. To maintain a low level of carbon emissions, the carbon capture facility output increases, while the hydrogen storage tank and the electrolyzer output supply more hydrogen to promote CO2 methanation, reducing carbon emissions while also increasing gas sales revenue. In some periods, wind and solar power curtailment and electricity purchases still occur, but compared with Scenario 2, the amount of wind and solar power curtailment and electricity purchases is smaller, resulting in higher net income. In conclusion, the VPP low-carbon economic dispatch model established in this paper still has high economic benefits and carbon-emission reduction capability when used as input during the transition season.

4.3.3. Analysis of Scheduling Results during the Heating Season

The analysis of scheduling results during the heating season is shown in Figure 8, which displays the electric-power and heat-power balance in three different scenarios. The parameter comparison of VPP revenue under different scenarios is presented in Table 5.
Based on Figure 8 and Table 5, it can be seen that in Scenario 1, which only includes electric boiler and carbon capture, all costs are higher than the other two scenarios. In contrast, Scenarios 2 and 3 incorporate a hydrogen energy storage system, resulting in a higher consumption of wind and solar resources and a decrease in the CHP unit’s heat and power output. This reduces the cost of curtailed wind and solar energy, as well as fuel costs. Compared to Scenario 1, Scenario 2’s fuel cost decreased by 19.42%, while its carbon-trading cost and emissions decreased by 34.94% and 23.16%, respectively, and VPP’s net income increased by 12.77%. Compared to Scenario 2, Scenario 3 introduces the tiered carbon-trading mechanism that optimizes CHP output, reducing carbon emissions and trading costs. The fuel cost was reduced by 14.22%, curtailed wind and solar energy costs decreased by 35.3%, and carbon-trading cost and carbon emissions decreased by 44.68% and 26.39%, respectively. Although the power purchase cost has increased by 58.65%, the power purchase cost of Scenarios 2 and 3 is still lower than that of Scenario 1. At the same time, the net income of Scenario 3 increased by 5.88%. Therefore, the VPP low-carbon economic dispatch model established in this paper can optimize the output of VPP equipment, reduce operating costs and carbon emissions, and improve economic benefits during the heating season.
Figure 8’s power balance diagram for Scenario 3 shows that during the 1:00–8:00 period, the electrical load first decreases and then rapidly increases, while the thermal load is in the early peak period and gradually decreases. At this time, the photovoltaic output is almost zero, and wind power output is low and slowly increasing. Due to the high thermal load, the electric boiler converts wind power into heat, while the fuel cell burns hydrogen to generate heat and electricity to meet the demand for electric heat load. However, due to the thermal load being high and the electric load being low, a large amount of wind power is curtailed, resulting in high curtailed wind and solar energy costs, although still lower than Scenarios 1 and 2. During the period of 9:00–13:00, the electrical load rapidly increases and is in the first peak period of the day, while the thermal load is at the trough level of the whole day. Meanwhile, the photovoltaic power output gradually increases to its peak, and wind power begins to fluctuate and decrease. Due to the reduction of heat load, limited by the minimum heat output of CHP units, the capacity of convertible heat energy of electric boilers and fuel cells is reduced, which reduces the amount of wind power photovoltaic consumption. CHP unit’s power output decreases, reducing carbon emissions, and thus, carbon-capture output also decreases. However, due to the high electrical load, wind and solar energy shortages occur, and VPP must purchase electricity from the main grid to maintain power balance. During the period of 14:00–20:00, the thermal load rapidly increases and is in the peak period, while the electrical load first decreases and then slowly increases, also in the second peak period. At this time, wind power also starts to increase and is in the peak period of the day, while photovoltaic power gradually decreases to zero. Due to the rapid increase in thermal load, the electric boiler consumes more wind power, and the fuel cell burns more hydrogen to reduce CHP heat output and decouple heat and electricity to maintain the CHP unit’s flexibility and peak-shaving ability. However, the CHP unit’s heat and power output still slowly increased, resulting in VPP’s highest carbon emissions of the day. Carbon-capture output and the electrolyzer output increase to reduce carbon emissions, and hydrogen is produced to supply the fuel cell and methane generator to reduce system carbon emissions and increase gas sales revenue. Although wind power is fully consumed at this time, there is still a shortage of electricity, and VPP has to purchase electricity from the main grid to maintain the balance of electric energy. Due to the peak in electricity purchase prices during this period, the cost of electricity purchase in Scenario 3 is higher. During the period of 21:00–24:00, the thermal load, electrical load, and wind power output all begin to decrease, and the photovoltaic output is zero. The electric boiler output decreases slightly, while the hydrogen fuel cell output increases to reduce CHP heat output and decouple heat and electricity. However, due to the high thermal load, CHP heat output remains high, and there is also a high demand for electricity, resulting in high carbon emissions for VPP. Carbon-capture output and the electrolyzer output increase to reduce carbon emissions, and hydrogen is produced to supply the fuel cell and methane generator to reduce system carbon emissions and increase gas sales revenue. Although wind power is fully consumed during this period, there is still a shortage of electricity, and VPP must purchase electricity from the main grid, resulting in higher purchased electricity costs. However, compared to the first two scenarios, Scenario 3 still has a higher net income.
In summary, this section establishes three different scenarios using power supply season, transition season, and heating season as load inputs for simulation. The parameters of heat, electricity, and gas sales, fuel cost, purchased electricity cost, carbon-trading cost, wind and solar curtailment cost, carbon emissions, and net income under different scenarios with the same load input are comprehensively compared. The simulation results show that the VPP low-carbon economic scheduling model considering hydrogen energy storage and the tiered carbon trading established in this paper shows high practicability in the power supply season, transition season, and heating season, which can reduce VPP carbon emissions, increase wind and solar consumption, and improve net income.

4.4. Sensitivity Analysis of VPP System Parameters

Hydrogen energy plays a crucial role in decoupling the heat and power coupling mode of CHP units, strengthening the coupling of electric and thermal loads, and improving the consumption of new energy sources in this paper. Similarly, different parameters of the carbon-trading mechanism can directly affect the internal operation of VPP. Therefore, this section focuses on the impact of these parameters on VPP’s carbon emissions and net profits. Using wind and solar load forecasting data for the transition season, simulation analysis was conducted under Scenario 3, and the results are shown in Figure 9 and Figure 10.

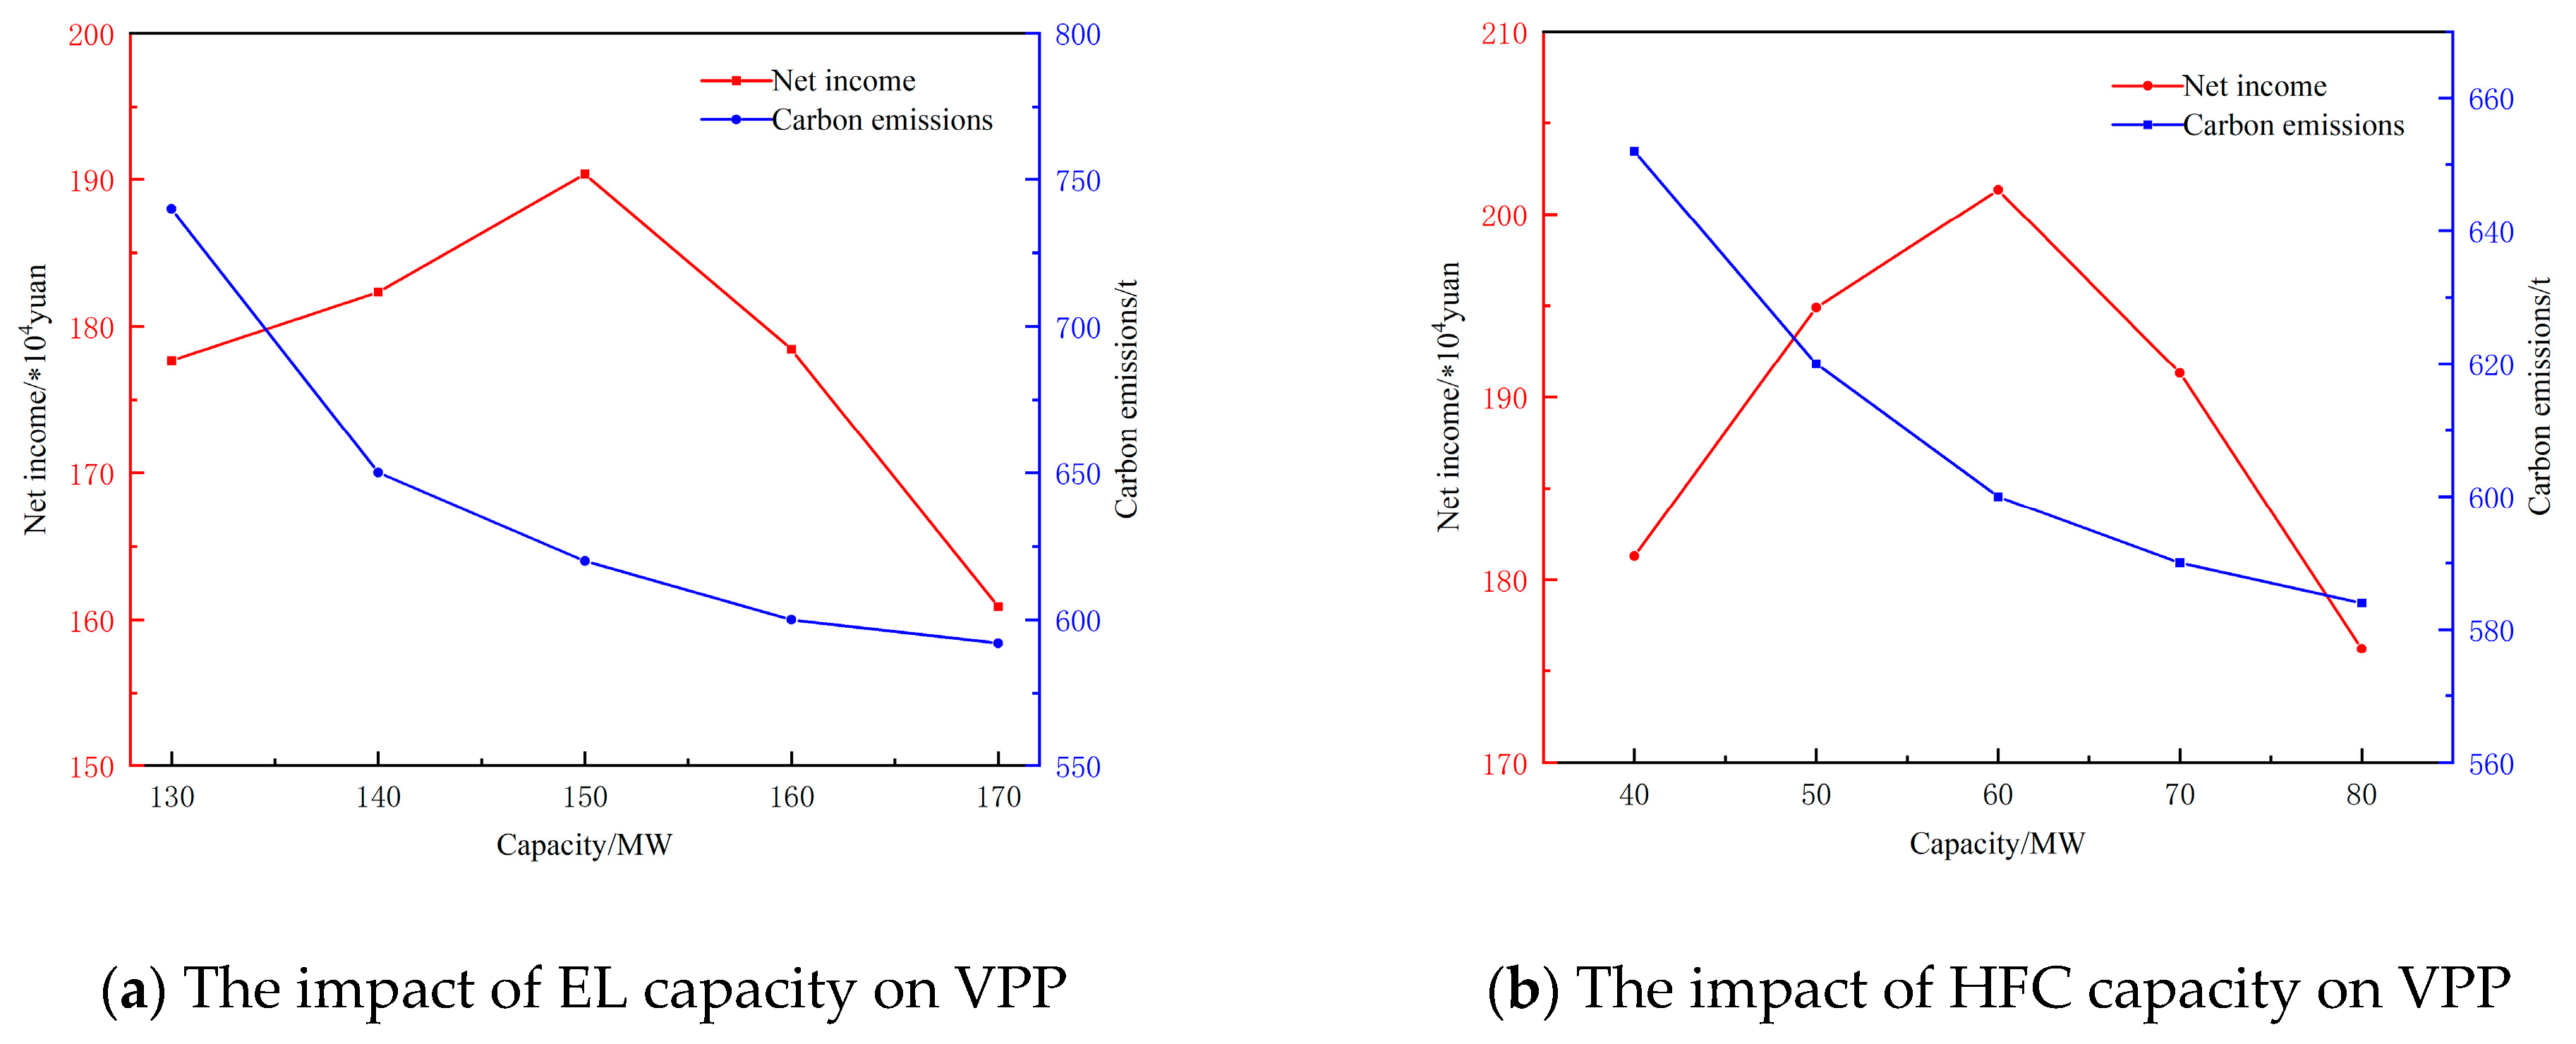
4.4.1. Sensitivity Analysis of Hydrogen Energy Storage System Equipment Capacity

The capacity of various hydrogen energy storage system equipment (the electrolyzer and hydrogen fuel cell) on the economic benefits and carbon emissions of VPP are studied, and the results are shown in Figure 9.
As shown in Figure 9a, when the capacity of the electrolyzer is less than 150 MW, as the configured capacity increases, more hydrogen is produced by the electrolyzer, and the fuel cell burns more hydrogen to generate electricity and heat, increasing the consumption of new energy and rapidly reducing the system’s carbon emissions. The benefits generated are greater than the operational cost, increasing the VPP’s net income. When the capacity exceeds 150 MW, although more hydrogen is produced, it cannot be fully utilized due to the limitations of the fuel cell and hydrogen storage tank, resulting in a waste of hydrogen resources and electrolyzer capacity, and the rate of carbon-emission reduction slows down. Moreover, the operational cost exceeds the benefits generated, leading to a decrease in the VPP’s net income.
As shown in Figure 9b, when the capacity of the fuel cell is less than 60 MW, as the configured capacity increases, the fuel cell can burn more hydrogen to generate more electricity and heat, reducing the output of the CHP unit and increasing the sales revenue of the VPP for electricity and heat, while also reducing carbon emissions. When the capacity exceeds 60 MW, although the configured capacity increases, it is limited by the electrolyzer and hydrogen storage tank, and the operational cost increases significantly, resulting in a decrease in the VPP’s net income. Although carbon emissions still decrease, the rate of reduction slows down and gradually approaches saturation.
According to the above analysis, from the perspective of carbon-emission reduction and increasing the consumption of new energy, it can be concluded that when the configured capacity of the electrolyzer is greater than 150 MW, and the hydrogen fuel cell capacity is greater than 60 MW, the VPP’s net income is maximized, and the carbon emissions are moderate. Further increasing the configured capacity will only lead to a decrease in the system’s net income and waste of capacity. Therefore, a reasonable setting of the capacity of the hydrogen energy storage system equipment can effectively guide the VPP’s carbon emissions, net income, and consumption of new energy.

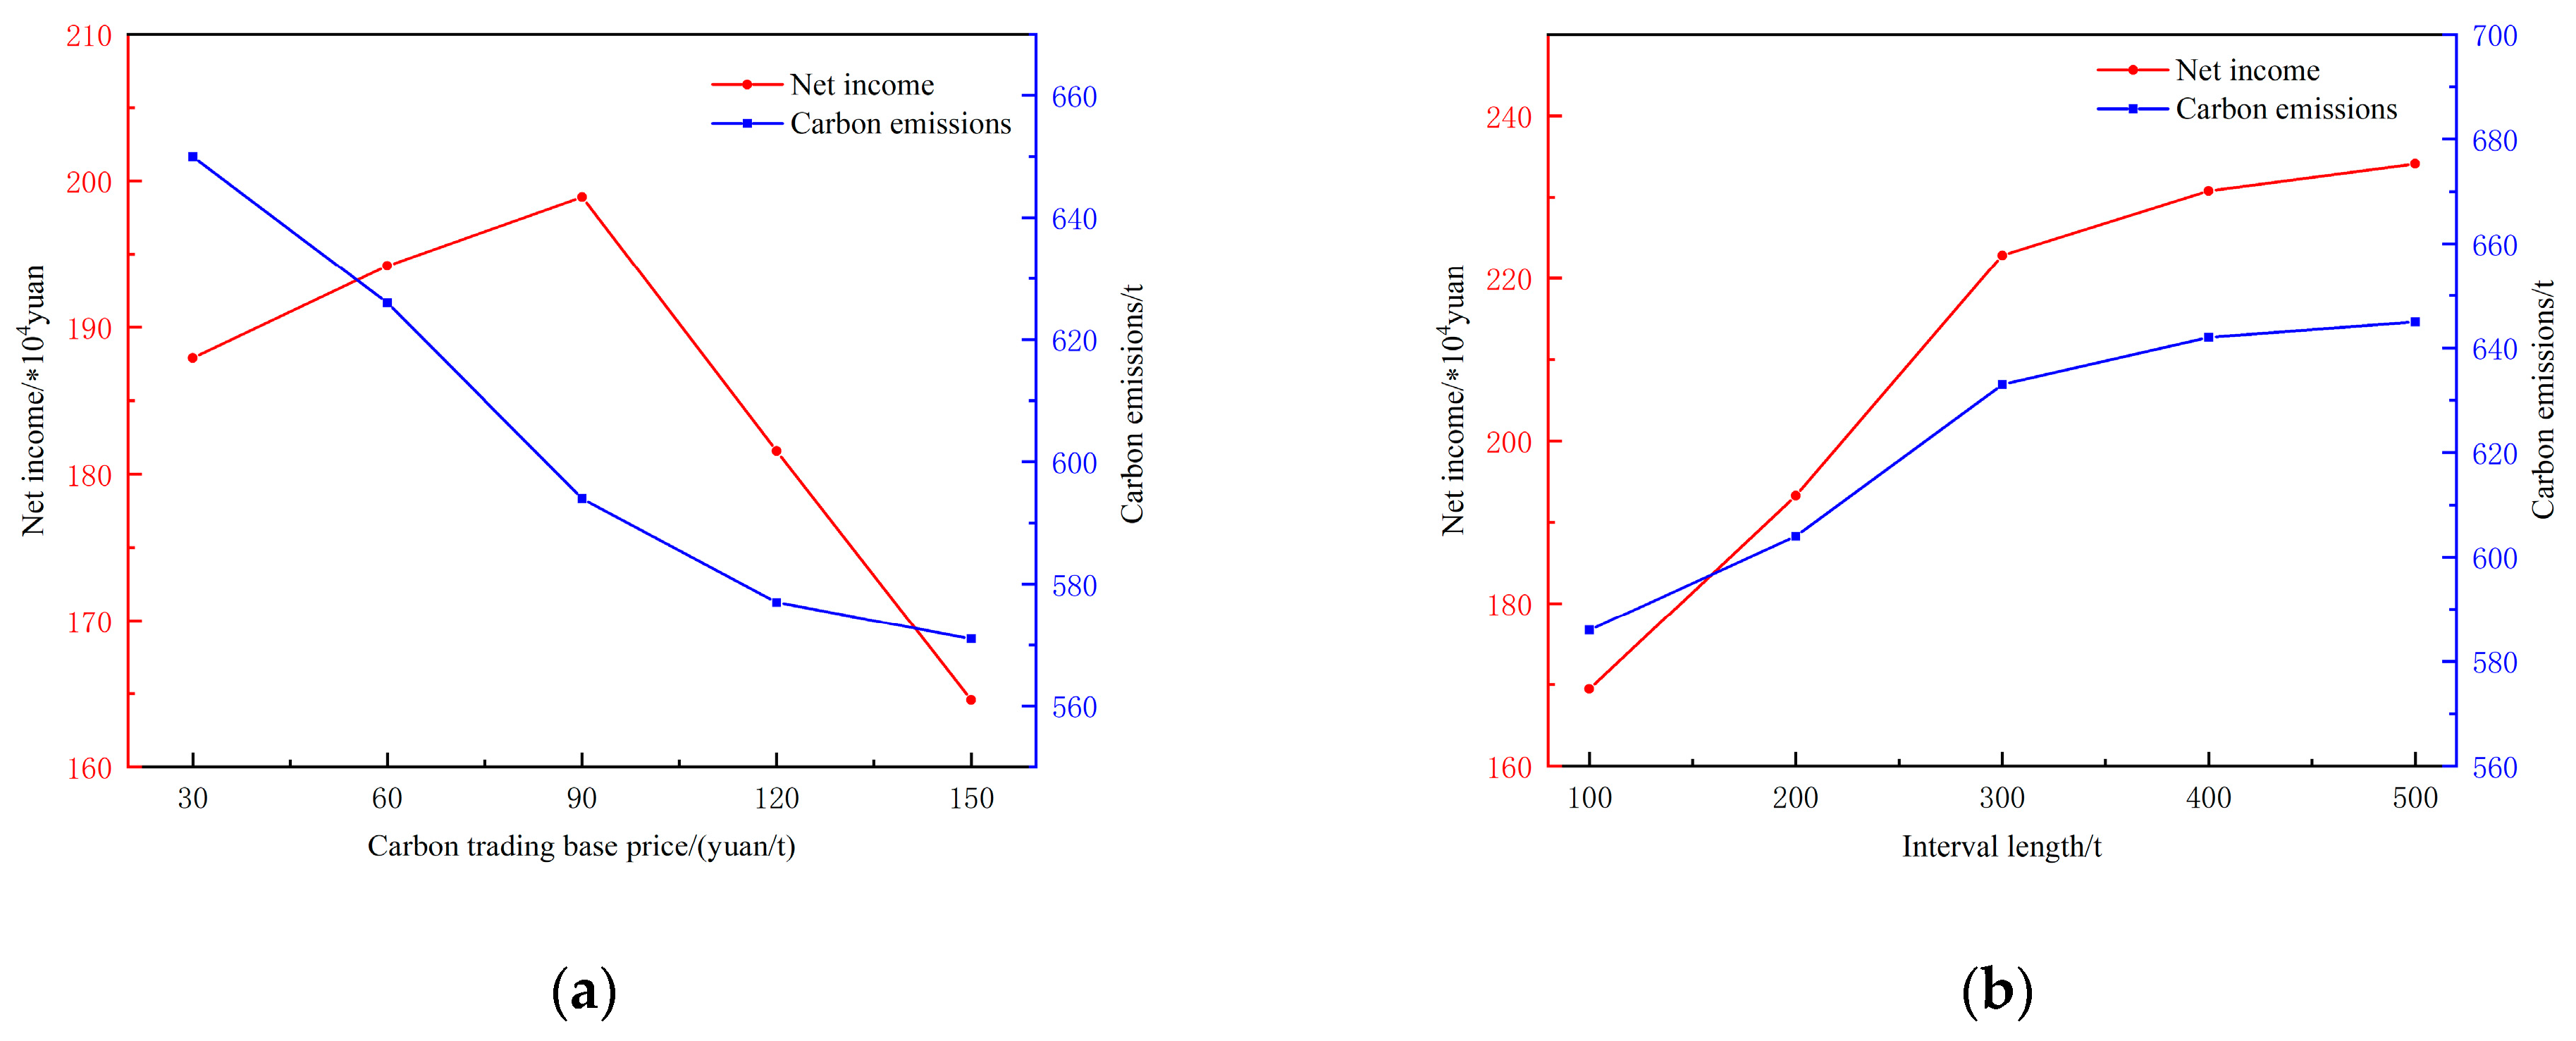
4.4.2. Sensitivity Analysis of Carbon-Trading Parameters

Now, we mainly analyze the impact of carbon-trading benchmark price and carbon-emission interval length on system carbon emissions and net income. The results are shown in Figure 10.
As shown in Figure 10a, when the carbon-trading benchmark price is greater than 90 CNY/t, as the carbon-trading benchmark price increases, the proportion of carbon-emission target cost also increases, and the role of carbon-trading cost becomes stronger. The VPP must reduce carbon emissions to reduce carbon-trading costs, so the carbon emissions also begin to decrease rapidly, and VPP’s profits also rapidly decrease when the carbon-trading benchmark price is less than 90 CNY/t. Although the carbon-trading price increases, the price is still relatively low, and the VPP’s carbon emissions increase. However, from the overall trend, the carbon-trading price has a relatively large impact on the system’s carbon emissions and net income. Therefore, from a long-term perspective, a reasonable carbon-trading price will have broader application prospects in reducing carbon emissions.
As shown in Figure 10b, when the interval length is less than 400 t, as the interval length increases, the carbon-trading price is at a low level because the increasing interval length reduces the punishment intensity of the tiered carbon-trading. VPP’s carbon emissions also rapidly increase, and VPP’s net income also increases. When the interval length is greater than 400 t, carbon emissions are traded based on the benchmark price and the first gradient price, and the impact of the interval length on carbon emissions is relatively small, the tiered carbon trading is transformed into fixed carbon trading, and VPP’s carbon emissions and net income slowly increase and tend to stabilize.
From the above analysis, it can be concluded that from the perspective of current energy conservation and emission reduction, when the carbon-trading benchmark price is greater than 90 CNY/t, VPP’s net income reaches its maximum. Although increasing the carbon benchmark price will continue to reduce carbon emissions, it will also lead to a sharp decline in VPP’s net income. When the interval length is less than or equal to 400 t, VPP’s carbon emissions and net income rapidly increase, while when the interval length is greater than 400 t, the system’s carbon emissions and net income slowly increase and tend to stabilize. The tiered carbon-trading mechanism has a poor binding force on the system’s carbon emissions. Therefore, setting a reasonable carbon-trading benchmark price and interval length can reasonably guide the system’s carbon emissions to achieve a balance between VPP’s low-carbon operation and economic operation.

5. Conclusions

This paper proposes an optimization and scheduling strategy for a virtual power plant (VPP) considering the complementary use of electric and thermal energy and the decarbonization of energy in multiple scenarios. By enabling the collaborative operation of multiple devices, the VPP achieves energy complementarity and optimized scheduling, leading to carbon reuse. The following conclusions can be drawn from the proposed scheduling strategy:
(1)
Introducing a hydrogen energy storage system and the tiered carbon-trading mechanism based on carbon capture facilitates carbon reuse. On one hand, it reduces carbon emissions from the VPP and increases the integration of renewable energy. On the other hand, the generated methane can be supplied to the natural gas consumption system, further enhancing the economic benefits of the VPP.
(2)
Through the collaborative operation of multiple units, the coupling of hydrogen energy storage and an electric boiler enables the decoupling of heat and power in combined heat and power (CHP) units. This effectively optimizes the output of CHP units, improves their operational flexibility and peak-shaving ability, reduces coal consumption cost, lowers carbon emissions, enhances the utilization of renewable energy generation, and mitigates the contradiction between renewable energy generation and electricity demand. It achieves a balance between supply and demand, optimizes the energy structure of the VPP, and improves its economic benefits.
(3)
Sensitivity analysis of the VPP’s low-carbon economic conditions is conducted by considering different parameters for the tiered carbon trading and the capacity of hydrogen energy storage devices. The results demonstrate that reasonable parameter settings and capacity configurations are more conducive to reducing carbon emissions and increasing the economic benefits of the VPP.
(4)
Lastly, three scenarios are established to comprehensively compare the scheduling results of different scenarios in the same season, considering different load inputs. This validates the practicality of the proposed model and demonstrates that the optimization and scheduling approach has high generality and economic benefits, effectively improving the VPP’s ability to integrate renewable energy generation and reduce carbon emissions.
However, this paper only considers measures to reduce carbon emissions from the supply side and does not address the demand response from the load side. Demand response has gradually matured and is of great significance for energy conservation, emission reduction, and promoting the integration of renewable energy. To tap into the resources on the load side, it is necessary to incorporate demand response into the VPP’s low-carbon economic scheduling model, treating VPP devices as dispatchable assets. This enables source–load interaction and further “peak shaving and valley filling” through demand response, reducing carbon emissions in the VPP, increasing the integration of renewable energy, enhancing the operational flexibility of the VPP, and reducing the impact of fluctuations in wind and solar energy.

Author Contributions

T.X. and Q.W. conceived and designed the experiments; T.X. and G.Z. performed the experiments/wrote the paper; G.Z. and K.Z. analyzed the data; H.L. contributed reagents/materials/analysis tools. All authors have read and agreed to the published version of the manuscript.

Funding

This research was funded by the Natural Science Basic Research Program of Shaanxi Province (2022JQ-534).

Data Availability Statement

Data are contained within the article.

Conflicts of Interest

Author Hua Li was employed by the company Electric Power Research Institute of State Grid Shaanxi Electric Power Company. The remaining authors declare that the research was conducted in the absence of any commercial or financial relationships that could be construed as a potential conflict of interest.

Abbreviations

WindWind Power
PVPhotovoltaic Power
CHPCombined Heat and Power Units
CCSCarbon Capture and Storage
ELElectrolyzer
HFCHydrogen Fuel Cell
MRMethane Reactor
HSTHydrogen Storage Tank
EBElectric Boiler
VPPVirtual power plant
IESIntegrated Energy System
CCPPCarbon-Capture Power Plant
P e l ( t ) The electrical energy input to EL in time period t
η e l The energy conversion efficiency of EL
P e l , H 2 ( t ) The hydrogen energy output from EL in time period t
P e l max The upper limit of electrical energy input to EL
P e l min The lower limit of electrical energy input to EL
Δ P e l max The upper limit of EL’s ramp rate
Δ P e l min The lower limit of EL’s ramp rate
P H 2 , H F C ( t ) The hydrogen energy input to the HFC in time period t
η H F C e The hydrogen-to-electricity conversion efficiency of the HFC
η H F C h The hydrogen-to-thermal energy conversion efficiency of the HFC
P H 2 , H F C max The upper limit of the hydrogen energy input to the HFC
P H 2 , H F C min The lower limit of the hydrogen energy input to the HFC
Δ P H 2 , H F C max The upper limit of the ramp rate of the HFC
Δ P H 2 , H F C min The lower limit of the ramp rate of the HFC
η H 2 c h r The hydrogen charging efficiency of the hydrogen storage tank
η H 2 d i s The hydrogen discharging efficiency of the hydrogen storage tank
S H 2 ( t ) The hydrogen storage level of the hydrogen storage tank at time t
S H 2 , max The upper limit of the hydrogen storage tank capacity
S H 2 , min The lower limit of the hydrogen storage tank capacity
TThe scheduling period, which is 24 h
Δ t The scheduling step size is 1 h
P H 2 , M R ( t ) The hydrogen power input to the methane reactor in time period t
P M g , g ( t ) The methane power output
η M R The conversion efficiency of the methane reactor
P H 2 , M R max The upper limit of the hydrogen power input
P H 2 , M R min The lower limit of the hydrogen power input
Δ P H 2 , M R max The upper limit of the ramp rate of the MR
Δ P H 2 , M R min The lower limit of the ramp rate of the MR
δ h The carbon-emission quota for unit heat supply
ϕ The conversion factor for converting electricity generation into heat supply
χ g The carbon-emission quota assigned to unit purchased electricity
P g r i d , b u y t The electrical power input from the superior power grid to VPP
a 0 , a 1 , a 2 The carbon-emission calculation parameters for purchased electricity power
b 0 , b 1 , b 2 The carbon-emission calculation parameters for CHP output
ϖ The parameter for CO2 absorption during the hydrogen-to-natural-gas conversion process in the MR equipment
i The index of the CHP unit
θ The total number of CHP units in the VPP
λ The base carbon-trading price
l The length of the carbon-emission range
α The rate of price increase
c 0 , c 1 , c 2 , c 3 , c 4 , c 5 The fitting coefficient for the coal consumption characteristics of the CHP unit
φ The unit price of standard coal
v e j The control cost of the jth pollutant
d e j The amount of the jth pollutant emitted per unit output of the CHP unit
v j The penalty cost for emitting the jth pollutant by the CHP unit
χ The proportion of operational and maintenance costs to the total cost
s The line loss rate
n The service life
δ The proportion of annual maintenance costs of the EB to the total construction cost
ρ E The installation cost required for a unit capacity of EB
R C H P i , u p The upper limit of ramping rate for the ith CHP unit
R C H P i , d o w n The lower limit of ramping rate for the ith CHP unit
H C H P i m e d The thermal output corresponding to the minimum electric output of the i-th CHP unit
c v 1 i The decrease in maximum output under constant turbine intake when extracting a unit of heat for the ith unit
c v 2 i The decrease in minimum output under constant turbine intake when extracting a unit of heat for the ith unit
c m i The coefficient of the ratio between electric output and thermal output when the ith CHP unit operates under back pressure conditions

References

  1. Kong, X.; Xiao, J.; Wang, C.; Cui, K.; Jin, Q.; Kong, D. Bi-level multi-time scale scheduling method based on bidding formulti-operator virtual power plant. Appl. Energy 2019, 249, 178–189. [Google Scholar] [CrossRef]
  2. Wei, C.; Xu, J.; Liao, S.; Sun, Y.; Jiang, Y.; Ke, D.; Zhang, Z.; Wang, J. A bi-level scheduling model for virtual power plants with aggregated thermostatically controlled loads and renewable energy. Appl. Energy 2018, 224, 659–670. [Google Scholar] [CrossRef]
  3. Naval, N.; Yusta, J.M. Virtua l power plant models and electricity markets-A review, Renewable and Sustainable. Energy Rev. 2021, 149, 111393. [Google Scholar]
  4. Wang, X.; Liu, Q. Development and practice of virtual power plant participating in power grid regulation and market operation. Autom. Electr. Power Syst. 2022, 46, 158–168. [Google Scholar]
  5. Xue, G.Y.; Wu, C.; Wang, H.R.; Zhang, H.M.; Li, Y.; Cui, M.L. Coordinated development mechanism of carbon market and power market under carbon peak and Neutrality goals. Electr. Power Sci. Eng. 2022, 38, 1–7. [Google Scholar]
  6. Ning, L.; Yuan, T.M.; Wu, H.T. New power system based on renewable energy in the context of dual carbon. Int. Trans. Electr. Energy Syst. 2022, 2022, 6428791. [Google Scholar] [CrossRef]
  7. Fang, G.; Chen, G.; Yang, K.; Yin, W.; Tian, L. Can green tax policy promote China’s energy transformation?—A nonlinear analysis from production and consumption perspectives. Energy 2023, 269, 126818. [Google Scholar] [CrossRef]
  8. Wang, S.Y.; Wu, W.C. Aggregate flexibility of Virtual power plant with temporal coupling constraints. IEEE Trans. Smart Grid 2021, 12, 5043–5051. [Google Scholar] [CrossRef]
  9. Wang, W.Y.; Liu, H.T.; Ji, Y. Unified modeling of virtual power plant adjustable space and optimal operation strategy for participating in peak shaving market. Autom. Electr. Power Syst. 2022, 46, 74–82. [Google Scholar]
  10. Falabretti, D.; Gulotta, F.; Siface, D. Scheduling and operation of RES-based virtual power plants with e-mobility: A novel integrated stochastic model. Int. J. Electr. Power Energy Syst. 2023, 144, 108604. [Google Scholar] [CrossRef]
  11. Gougheri, S.S.; Dehghani, M.; Nikoofard, A.; Jahangir, H.; Golkar, M.A. Economic assessment of multi-operator virtual power plants in electricity market: A game theory-based approach. Sustain. Energy Technol. Assess. 2022, 53, 102733. [Google Scholar] [CrossRef]
  12. Rotas, R.; Fotopoulou, M.; Drosatos, P.; Rakopoulos, D.; Nikolopoulos, N. Adaptive Dynamic Building Envelopes with Solar Power Components: Annual Performance Assessment for Two Pilot Sites. Energies 2023, 16, 2148. [Google Scholar] [CrossRef]
  13. Wang, Y.; Hao, L.; Zheng, L.; Chen, L.; Xu, F.; Chen, Q.; Min, Y. Low-Carbon Economic Dispatch of Electricity and Cooling Energy System. Processes 2023, 11, 2787. [Google Scholar] [CrossRef]
  14. MacDowell, N.; Florin, N.; Buchard, A.; Hallett, J.; Galindo, A.; Jackson, G.; Adjiman, C.S.; Williams, C.K.; Shah, N.; Fennell, P. An overview of CO2 capture technologies. Energy Environ. Sci. 2010, 3, 1645–1669. [Google Scholar] [CrossRef]
  15. Cui, Y.; Zeng, P.; Hui, X.; Li, H.; Zhao, J. Economic dispatch model of virtual power plant considering electricity consumption under a carbon trading mechanism. Power Syst. Technol. 2021, 45, 1877–1886. [Google Scholar]
  16. Zhou, R.; Sun, H.; Tang, X.; Zhang, W.; Yu, H. Economic dispatch model of virtual power plant considering electricity consumption under a carbon trading mechanism. Proc. CSEE 2018, 38, 1675–1683. [Google Scholar]
  17. Chen, D.; Liu, F.; Liu, S. Optimization of virtual power plant scheduling coupling with P2G-CCS and doped with gas hydrogen based on stepped carbon trading. Power Syst. Technol. 2022, 46, 2042–2054. [Google Scholar]
  18. Zhong, W.; Huang, S.; Cui, Y.; Xu, J.; Zhao, Y. Capture coordination in virtual power plant considering source-load uncertainty. Power Syst. Technol. 2020, 44, 3424–3432. [Google Scholar]
  19. Zhang, X.; Liu, X.; Zhong, J. Integrated energy system planning considering a reward and punishment ladder-type carbon trading and electric-thermal transfer load uncertainty. Proc. CSEE 2020, 40, 6132–6141. [Google Scholar]
  20. Zou, Y.; Zeng, A.; Hao, S.; Ning, J.; Ni, L. Multi-time-scale Optimal Scheduling of Integrated Energy Systems Under Stepped Carbon Trading Mechanism. Proc. CSEE 2023, 47, 2185–2198. [Google Scholar]
  21. Li, Y.; Han, M.; Shahidehpour, M.; Li, J.; Long, C. Data-driven distributionally robust scheduling of community integrated energy systems with uncertain renewable generations considering integrated demand response. Appl. Energy 2023, 335, 120749. [Google Scholar] [CrossRef]
  22. Cui, Y.; Zeng, P.; Zhong, W.; Cui, W.; Zhao, Y. Low-carbon economic dispatch of electricity-gas-heat integrated energy system based on ladder-type carbon trading. Electr. Power Autom. Equip. 2021, 41, 10–17. [Google Scholar]
  23. Li, Y.; Wang, B.; Yang, Z.; Li, J.; Chen, C. Hierarchical stochastic scheduling of multi-community integrated energy systems in uncertain environments via Stackelberg game. Appl. Energy 2022, 308, 118392. [Google Scholar] [CrossRef]
  24. Dou, C.; Zhou, X.; Zhang, T.; Xu, S. Economic Optimization Dispatching Strategy of Microgrid for Promoting Photoelectric Consumption Considering Cogeneration and Demand Response. J. Mod. Power Syst. Clean Energy 2020, 8, 557–563. [Google Scholar] [CrossRef]
  25. Martínez-Sánchez, R.A.; Rodriguez-Resendiz, J.; Álvarez-Alvarado, J.M.; Macías-Socarrás, I. Solar Energy-Based Future Perspective for Organic Rankine Cycle Applications. Micromachines 2022, 13, 944. [Google Scholar] [CrossRef] [PubMed]
  26. Marefati, M.; Mehrpooya, M.; Pourfayaz, F. Performance analysis of an integrated pumped-hydro and compressed-air energy storage system and solar organic Rankine cycle. J. Energy Storage 2021, 44, 103488. [Google Scholar] [CrossRef]
  27. Wu, G.; Li, T.; Xu, W.; Xiang, Y.; Su, Y.; Liu, J.; Liu, F. Chance-constrained energy-reserve co-optimization scheduling ofwind-photovoltaic-hydrogen integrated energy systems. Int. J. Hydrogen Energy 2022, 48, 6892–6905. [Google Scholar] [CrossRef]
  28. Kiryanova, N.; Matrenin, P.; Mitrofanov, S.; Kokin, S.; Safaraliev, M.K. Hydrogen energy storage systems to improve wind power plant efficiency considering electricity tariff dynamics. Int. J. Hydrogen Energy 2022, 47, 10156–10165. [Google Scholar] [CrossRef]
  29. Razmi, A.R.; Alirahmi, S.M.; Nabat, M.H.; Assareh, E.; Shahbakhti, M. A green hydrogen energy storage concept based on parabolic trough collector and proton exchange membrane electrolyzer/fuel cell: Thermodynamic and exergoeconomic analyses with multi-objective optimization. Int. J. Hydrogen Energy 2022, 47, 26468–26489. [Google Scholar] [CrossRef]
  30. Cui, Y.; Yan, S.; Zhong, W.; Wang, Z.; Zhang, P.; Zhao, Y. Optimal thermoelectric dispatching of regional integrated energy system with power-to-gas. Power Syst. Technol. 2020, 44, 4254–4264. [Google Scholar]
  31. Chen, J.; Hu, Z.J.; Chen, Y.G.; Chen, J.; Chen, W. Thermoelectric optimization of integrated energy system considering ladder-type carbon trading mechanism and electric hydrogen production. Electr. Power Autom. Equip. 2021, 41, 48–55. [Google Scholar]
  32. Sun, H.; Sun, X.; Kou, L.; Zhang, B.; Zhu, X. Optimal scheduling of park-level integrated energy system considering ladder-type carbon trading mechanism and flexible load. Energy Rep. 2023, 9, 3417–3430. [Google Scholar] [CrossRef]
  33. Yuan, G.; Chen, S.; Wang, L. Economic optimal dispatch of virtual power plant considering environmental benefits. Adv. New Renew. Energy 2015, 3, 398–404. [Google Scholar]
  34. Yuan, G.; Zhong, F.; Zhang, R.; Zhou, T. Combined heat and power scheduling optimization for Virtual power plant considering carbon capture and demand response. Power Syst. Technol. 2023, 47, 4458–4467. [Google Scholar] [CrossRef]
  35. Zhong, J.; Wang, Y.; Zhao, Z. Research on multi-objective robust optimization about low carbon generation expansion planning considering uncertainty. Acta Energiae Solaris Sin. 2020, 41, 114–120. [Google Scholar]
  36. Yuan, G.; Wang, L.; Wang, B. Optimal Dispatch of Heat-Power Load and Economy Benefit Analysis Based on Decoupling of Heat and Power of Virtual Power Plant. Proc. CSEE 2017, 37, 4974–4985. [Google Scholar]
Figure 1. Topological Structure of Virtual Power Plant (VPP).
Processes 12 00090 g001
Figure 2. Thermal-electric operating characteristics of backpressure CHP and extraction-condensing CHP.
Processes 12 00090 g002
Figure 3. Flowchart for model solving. (Purple: Algorithm start and end; Orange: Model data classification; Green: Components of the objective function; Yellow: Hydrogen energy storage system and stepwise carbon-trading model; Blue: Algorithm flow and logic).
Processes 12 00090 g003
Figure 4. VPP energy price chart.
Processes 12 00090 g004
Figure 5. Electric heating load demand and wind-solar power generation prediction curves in different seasons.
Processes 12 00090 g005
Figure 6. Power Balance Chart of Electricity and Heat during the Cooling Season.
Processes 12 00090 g006
Figure 7. Power Balance Chart of Electricity and Heat during the Transition Season.
Processes 12 00090 g007
Figure 8. Power Balance Chart of Electricity and Heat during the Heating Season.
Processes 12 00090 g008
Figure 9. The impact of hydrogen energy storage on VPP.
Processes 12 00090 g009
Figure 10. The impact of parameterization in the form of tiered carbon trading on VPP. (a) The impact of carbon-trading benchmark price on VPP. (b) The impact of interval length on VPP.
Processes 12 00090 g010
Table 1. Coal Consumption Characteristics Parameters of CHP Units.
Generator Unit c 0 c 1 c 2 c 3 c 4 c 5
CHP1120.030.020.00130.00170.00012
CHP2250.0120.0160.00120.00480.00013
Table 2. Environmental Cost Parameters of VPP.
Contaminantdej/(kg/(MWh))Vej (CNY/kg)Vj/ CNY
SO26.486.41.0
NOx2.888.02.0
CO26230.0440.01
CO0.10831.00.16
Table 3. Parameter Comparison of VPP Revenue under Different Scenarios during the Cooling Season.
Revenue from Sales of Electricity, Heat and Gas/
×104 CNY
Fuel Cost/×104 CNYPurchase Cost of Electricity/×104 CNYCost of Wind and Solar Power Curtailment/×104 CNYCarbon-Trading Cost/×104 CNYCarbon Emissions/tNet Income/×104 CNY
Scenario 1279.8998.6710.9919.7316.32127297.21
Scenario 2266.7374.7413.8517.1711.71157126.10
Scenario 3264.4166.118.509.836.59733146.25
Table 4. Parameter Comparison of VPP Revenue under Different Scenarios during the Transition Season.
Revenue from Sales of Electricity, Heat and Gas/×104 CNYFuel Cost/×104 CNYPurchase Cost of Electricity/×104 CNYCost of Wind and Solar Power Curtailment/×104 CNYCarbon-Trading Cost/×104 CNYCarbon Emissions/tNet Income/×104 CNY
Scenario 1342.52137.106.7629.5714.761070125.63
Scenario 2324.85107.1913.2719.728.85960155.81
Scenario 3323.8499.219.0114.125.31589174.89
Table 5. Parameter Comparison of VPP Revenue under Different Scenarios during the Heating Season.
Revenue from Sales of Electricity, Heat and Gas/×104 CNYFuel Cost/×104 CNYPurchase Cost of Electricity/×104 CNYCost of Wind and Solar Power Curtailment/×104 CNYCarbon-Trading Cost/×104 CNYCarbon Emissions/tNet Income/×104 CNY
Scenario 1312.80116.8613.0115.1319.231356148.78
Scenario 2301.1394.167.1612.0912.511042167.79
Scenario 3297.0280.7711.367.826.92767177.67
Disclaimer/Publisher’s Note: The statements, opinions and data contained in all publications are solely those of the individual author(s) and contributor(s) and not of MDPI and/or the editor(s). MDPI and/or the editor(s) disclaim responsibility for any injury to people or property resulting from any ideas, methods, instructions or products referred to in the content.

