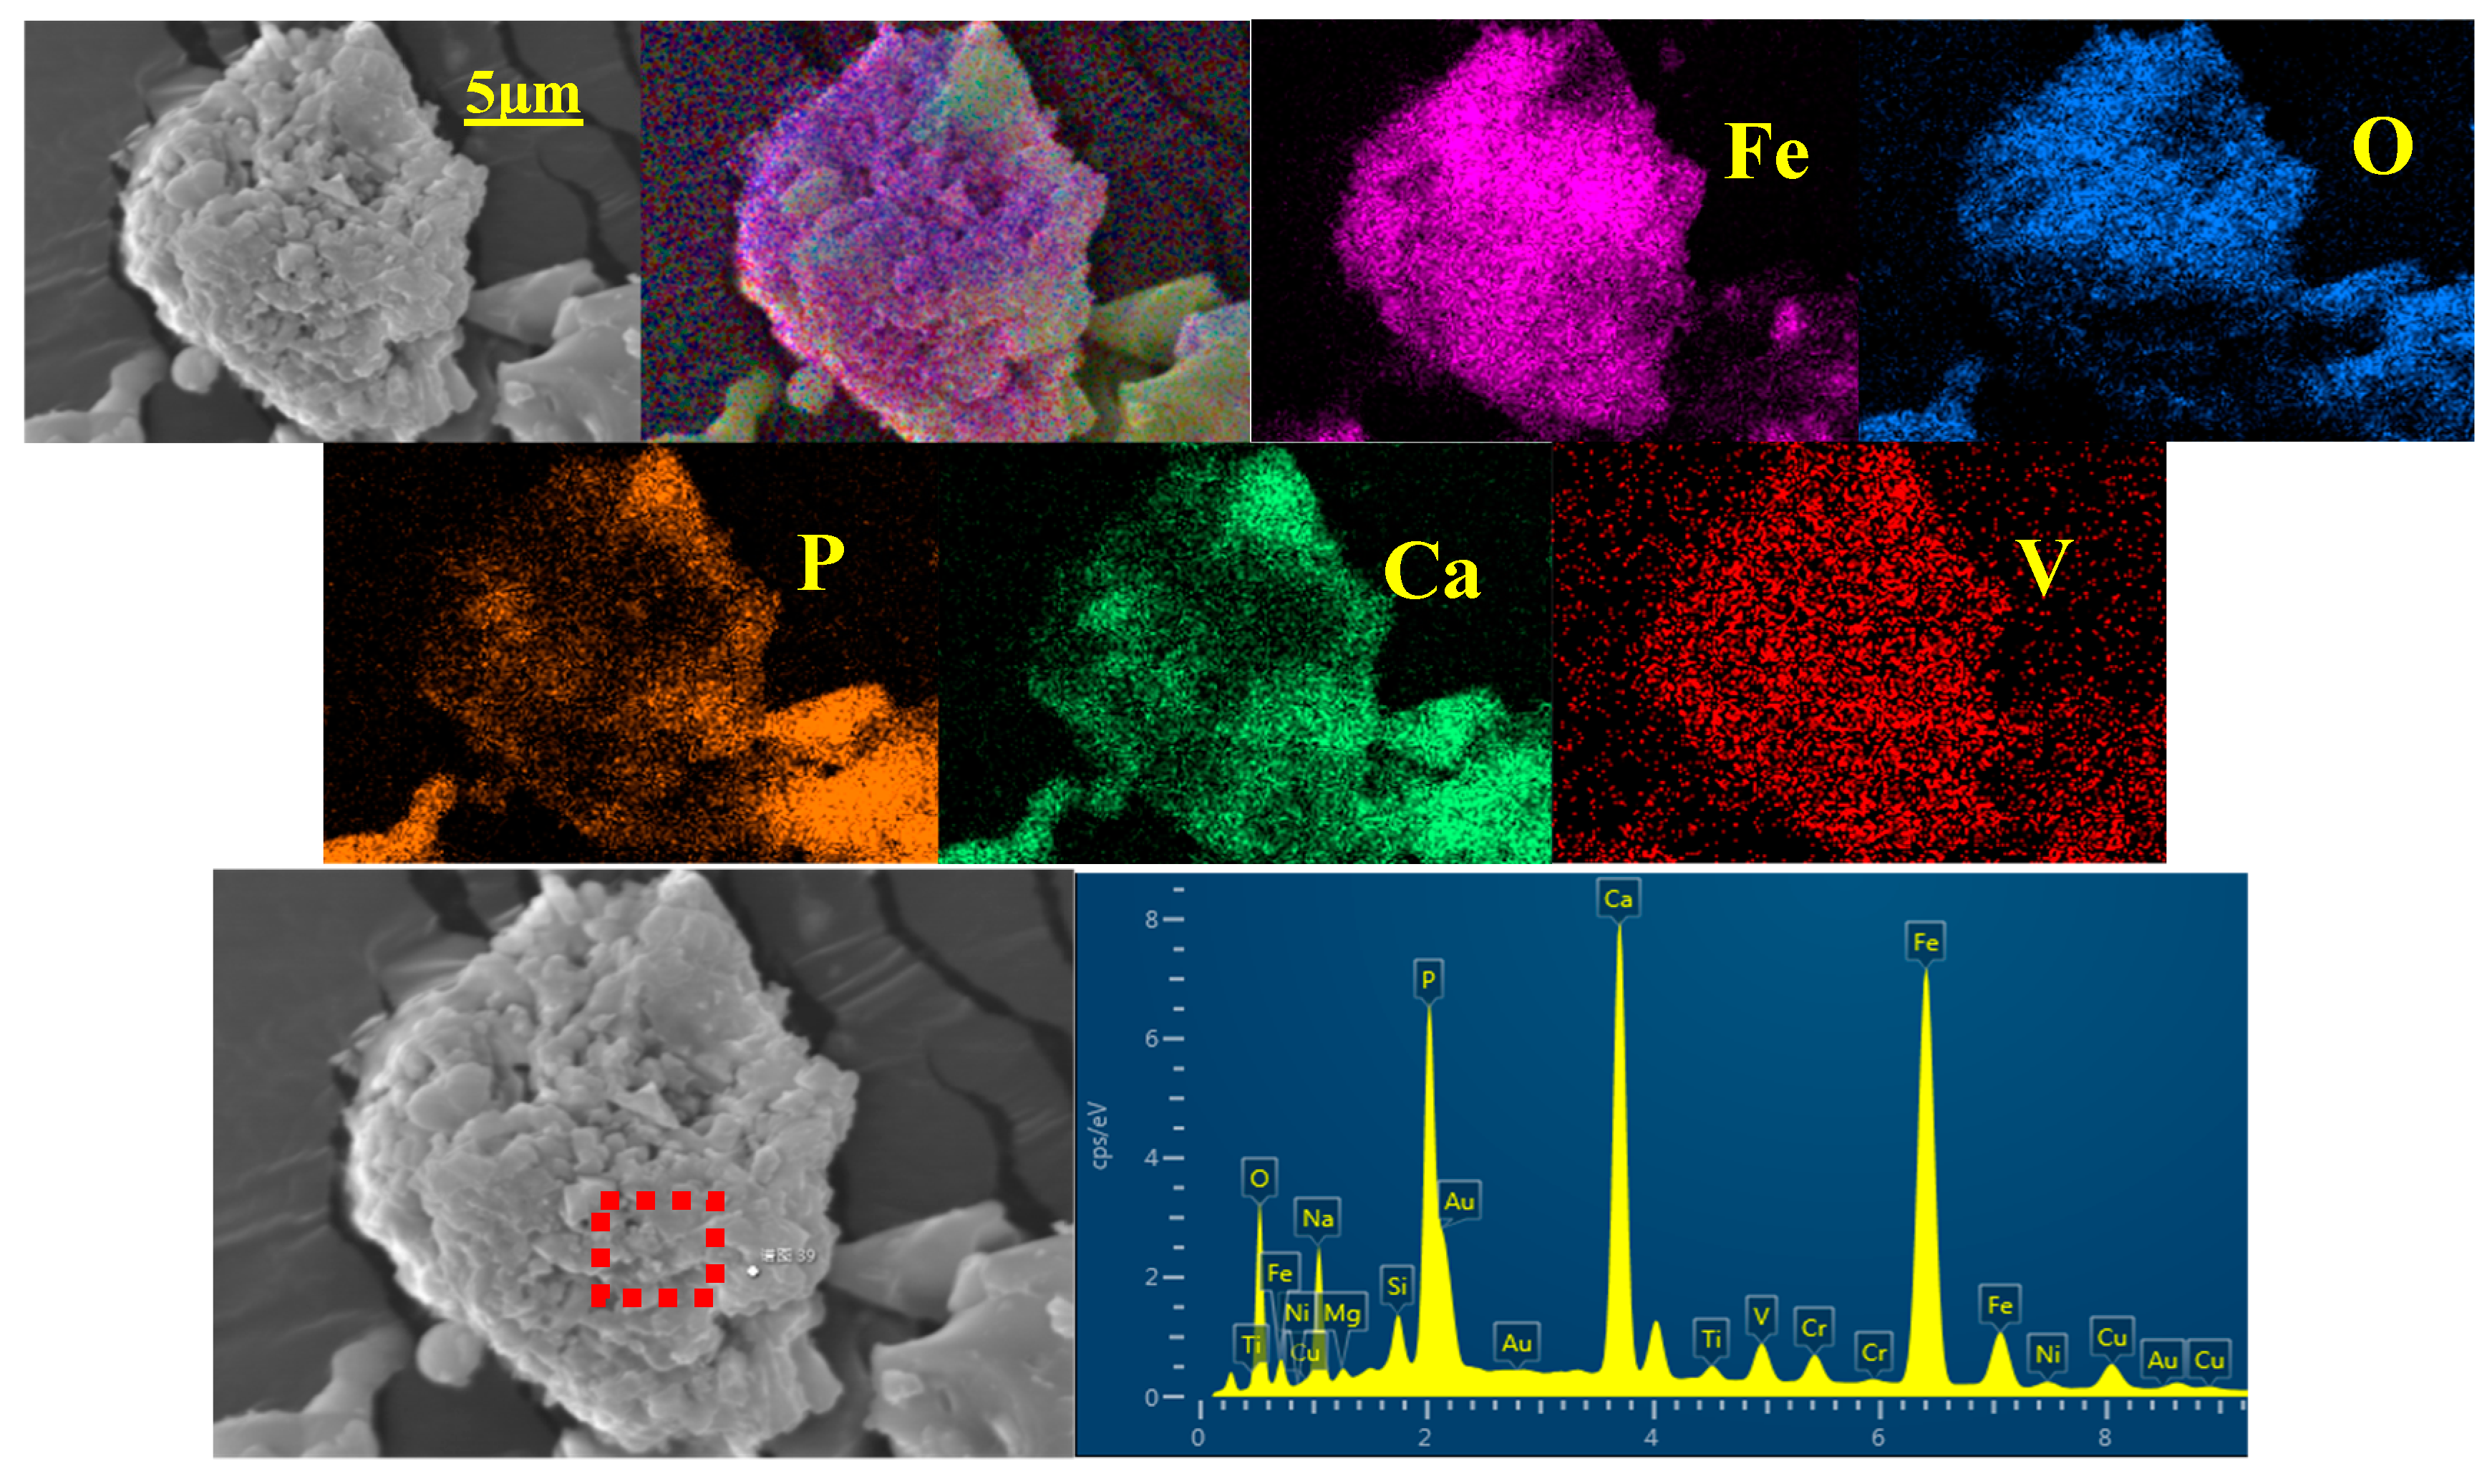
3.2. Na2CO3 Roasting Water-Leaching Experiments
It is evident that the V leaching efficiency is influenced by multiple factors, including roasting temperature, roasting time, Na
2CO
3 dosage, leaching time, and the liquid/solid ratio (L/S) during water-leaching (
Figure 4). As the roasting time elongates, and with the rise in both roasting temperature and Na
2CO
3 dosage, the V leaching efficiency initially surges before tapering off. Notably, there exists a strong interdependence among roasting temperature, time, and Na
2CO
3 dosage. Regarding leaching time, an initial steep increase in V leaching efficiency is observed, which plateaus after 60 min. Similarly, the V leaching efficiency initially escalates swiftly with increasing L/S ratio, but this trend saturates when the L/S ratio reaches 3.
During roasting, a reaction occurs as described in Equation (2), wherein V in Ca
9(Fe,V)(PO
4)
7 interacts with Na
2CO
3 to form NaVO
3, subsequently transforming Ca
9(Fe,V)(PO
4)
7 into Na
18Ca
13Mg
5(PO
4)
18 upon losing V. As seen in
Figure 5, V within HPVR is intermixed in compound phosphate, and NaVO
3 is generated through roasting. Post-roasting, water-leaching dissolves NaVO
3, leading to its absence in the filter slag’s spectrum. Additionally, Ca
9(Fe,V)(PO
4)
7 located in HPVR transforms into CaCO
3 upon roasting, evident from the emergence of calcium carbonate (CaCO
3) peaks in the roasted HPVR’s XRD pattern.
The TG analysis of HPVR’s reaction with Na
2CO
3, depicted in
Figure 6, mirrors that of CaCO
3, indicating CaCO
3 formation and decomposition during roasting. It is postulated that Equation (2) proceeds sequentially, with Na
2CO
3 binding to Ca in Ca
9Fe(PO
4)
7 to yield CaCO
3, while V dissociates to form soluble NaVO
3.
Due to the complex composition of HPVR and the complex reaction process, it is impossible to determine the process of calcium carbonate generation, but various decompositions of calcium carbonate have been observed, indirectly proving that calcium carbonate is generated during the roasting process and V is free.
3.3. Optimization of Roasting Experiment by Using RSM (BBD)
A pronounced correlation exists among three critical factors: roasting temperature, roasting time, and dosage of Na
2CO
3. Consequently, Response Surface Methodology (RSM) with Box-Behnken Design (BBD) was employed to ascertain optimal experimental conditions.
Table 3 showcases the BBD response surface test design for Na
2CO
3 roasting water-leaching of HPVR, utilizing Design-Expert 8.0 software, alongside corresponding test results (with a fixed leaching time of 60 min and liquid/solid ratio (L/S) of 3).
Table 4 evaluates the suitability of various models for approximating V leaching efficiency. Models are typically assessed based on the significance of their Prob > F (
p-value); a value significantly less than 0.05 indicates a good fit [
13,
14,
15]. Notably, the cubic model proved intricate and was thus discouraged by the system. Conversely, the quadratic model exhibited a
p-value less than 0.0001, establishing it as the preferred choice for modeling the relationship between V leaching efficiency and the influential factors [
7,
16,
17].
Based on the test data and fitting analysis of the results, Equation (3) represents a quadratic multinomial regression model that describes the relationship between V leaching efficiency and three main influencing factors: roasting time, roasting temperature, and sodium carbonate content:
3.4. Model Validation
Table 5 presents the outcomes of variance analysis for the model equations and associated factors. Notably, the Prob > F value of model Equation (3) falls below 0.0001, confirming its high statistical significance. Additionally, the
p-value of “Lack of Fit” equals 0.0508, indicating insignificance and suggesting a robust fit between the quadratic regression equation and the test results. The model’s regression determination coefficient R
2 of 0.9967 and adjusted determination coefficient R
2adj of 0.9924 further emphasize its high degree of fit. The marginal difference between these coefficients underscores the model’s accuracy in predicting actual values [
18].
Figure 7 showcases the diagnostic verification results, including plots of residual normal probability distribution, residuals versus predicted values, residuals versus predicted values order, and predicted versus actual values. The closer the normal probability distribution of residuals is to the straight line, the more the residuals conform to the normal distribution. The closer the combination of predicted and actual values indicates, the higher reliability and accuracy of the model prediction. When the predicted residuals are discrete and regularly distributed, the variance between residuals is better. The nearly straight line in
Figure 7a attests to the residuals’ conformity with a normal distribution. While
Figure 7c,d exhibit fluctuations, they signify good equal variance among residuals. In
Figure 7b, the close alignment of predicted and actual values supports the model’s reliability and precision in predictions [
19].
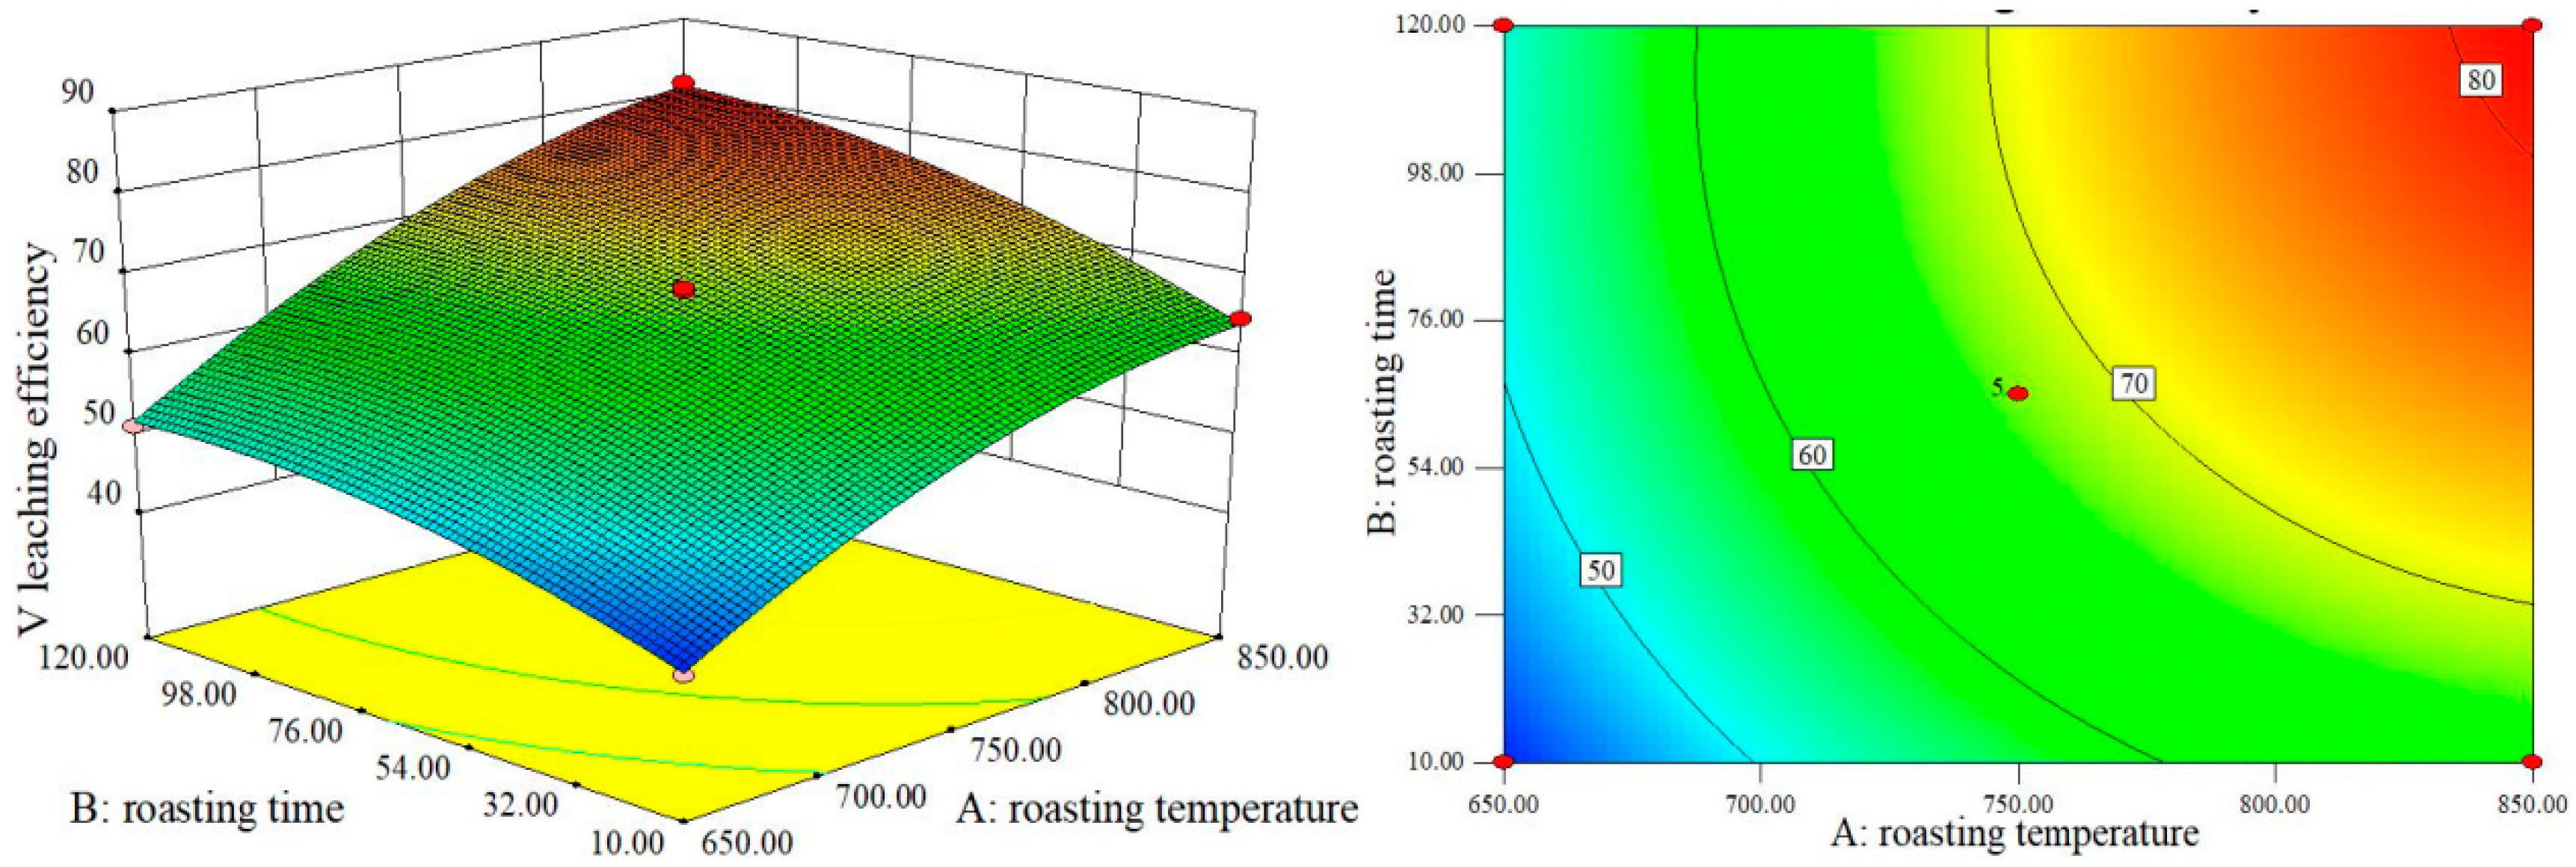
To evaluate the key factors affecting V leaching efficiency in Na
2CO
3 roasting water-leaching of HPVR and their interactions, 3D response surface maps and contour maps were generated (
Figure 8,
Figure 9 and
Figure 10). The interpretation of response surface analysis is straightforward: on contour maps, a steeper contour line, indicative of a broader numerical range, along a factor’s axis underscores its more profound impact on the index. Conversely, a flatter contour line implies minimal influence. Furthermore, the proximity of contours to an elliptical shape points to a robust interaction between two factors and their combined effect on the index [
16].
The contour map in
Figure 8 exhibits an almost elliptical contour, signifying a significant interplay between roasting temperature and time in influencing V leaching efficiency. The notably wider contour range for temperature compared to time underscores its greater influence. Similarly,
Figure 9 and
Figure 10 reveal that roasting time exerts a more pronounced effect on V leaching efficiency than the dosage of Na
2CO
3.
In summary, the order of significance for the individual factors in enhancing V leaching efficiency, as determined by response surface analysis, is as follows: roasting temperature, roasting time, and dosage of Na
2CO
3. Additionally, notable interactions were observed between roasting temperature and time, as well as between Na
2CO
3 dosage and both roasting temperature and time (
Table 6).
The maximum V leaching efficiency was optimized based on the previously established approximate model. Under the specified conditions—HPVR particle size less than 0.074 mm exceeding 80%, water-leaching time of 60 min, and L/S ratio of 3—the roasting temperature, roasting time, and dosage of Na2CO3 were adjusted to maximize efficiency. Ten feasible optimization schemes were identified, with the optimal range for roasting temperature and duration found to be between 848.92 °C and 850 °C and 115.68 to 120 min, respectively. The sodium carbonate dosage ranged from 7.12% to 8.18%, predicting a vanadium leaching efficiency of 83.52% to 83.82%.
The deviation between the predicted maximum V leaching efficiency and the actual outcome is minimal, at approximately 0.3%. Thus, in selecting the optimal prediction scheme, comprehensive consideration of energy consumption and production efficiency is crucial. Consequently, a revised scheme was chosen: roasting temperature of 850 °C, roasting time of 120 min, and Na2CO3 dosage of 8.01%, resulting in a predictive value of 83.82%, closely mirrored by the actual test result of 83.54%.


