Article

Carbonization of Invasive Plant Species—Novel Route for Removal of Active Pharmaceutical Ingredients via Adsorption

by
Jevrem Stojanović
1,
Maja Milojević-Rakić
2,
Danica Bajuk-Bogdanović
2,
Dragana Ranđelović
3,
Biljana Otašević
1,
Anđelija Malenović
1,
Aleksandra Janošević Ležaić
4,* and
Ana Protić
1
1
Department of Drug Analysis, Faculty of Pharmacy, University of Belgrade, Vojvode Stepe 450, 11000 Belgrade, Serbia
2
Faculty of Physical Chemistry, University of Belgrade, Studentski trg 12–16, 11158 Belgrade, Serbia
3
Sector for Metallurgical Technology and Environmental Protection, Institute for Technology of Nuclear and Other Mineral Raw Materials, Bulevar Franš d’Eperea 86, 11000 Belgrade, Serbia
4
Department of Physical Chemistry and Instrumental Methods, Faculty of Pharmacy, University of Belgrade, Vojvode Stepe 450, 11000 Belgrade, Serbia
*
Author to whom correspondence should be addressed.
Processes 2024, 12(10), 2149; https://doi.org/10.3390/pr12102149
Submission received: 10 September 2024 / Revised: 25 September 2024 / Accepted: 30 September 2024 / Published: 2 October 2024
(This article belongs to the Special Issue Thermochemical Conversion of Agricultural and Food Processing Waste)

Abstract

:
The development of efficient adsorbents for sustainable adsorption processes is required in environmental studies. Here, we propose using carbonized Ailanthus altissima leaves as a novel adsorbent, derived from invasive species that threaten biodiversity. Biochar was prepared by pyrolysis at 500 °C, activated with ZnCl2 and tested for the target adsorbates—active pharmaceutical ingredients (APIs). A range of characterization techniques were employed—FTIR, SEM, XPS and Raman spectroscopy—and the adsorption of representative APIs was analyzed. The adsorption kinetics revealed that the adsorbent reached equilibrium within a 3 h period. The adsorption capacities for the selected model substances ranged from 59 mg g−1 for atenolol to 112 mg g−1 for paracetamol, while the highest values were recorded for ketorolac and tetracycline at over 130 mg g−1. The excellent retention is ascribed to the developed surface area, the availability of oxygen surface functional groups and the aromatization of the biochar. The proposed biochar, which is obtained in a sustainable process, proves to be a highly efficient adsorbent for selected pharmaceuticals.

1. Introduction

In recent years, lignocellulosic biomass has been recognized as a cost-effective and widely available carbon-rich material and has been increasingly used to produce carbonaceous materials, so-called biochars (BCs), through various thermochemical conversion processes. BCs are currently being investigated for various applications such as energy storage, carbon sequestration, soil amendment and water remediation [1,2]. In adsorption studies, BCs have gained much attention as they may have several advantages over currently used adsorbents, especially in terms of sustainability. These include the wide availability of renewable feedstocks, low-cost and environmentally acceptable production, and the possibility of regeneration and reuse [3,4]. However, it is often observed that the adsorption capacity of biochar is not satisfactory for the target adsorbates [5]. Therefore, the activation of biochar can be used to modify its physico-chemical properties and achieve better efficiency. The material resulting from the activation process is referred to as activated biochar (AcBC) [6,7]. The properties of BCs important for application, such as specific surface area, porosity and surface functional group content, are highly dependent on the raw materials used and the operating conditions of the thermochemical conversion process. Therefore, many options have been tested to obtain BCs with the desirable properties for the intended adsorptive purpose. Applied thermochemical conversion processes mainly include pyrolysis, microwave-assisted pyrolysis and hydrothermal carbonization with different temperatures, heating rates and other parameters in the presence or absence of physical or chemical activating agents to generate BCs in adsorption studies [8]. The feedstocks that have been tested as precursors of BCs for adsorption purposes are in most cases biomass wastes, including lignocellulosic materials such as agricultural or forestry residues or non-lignocellulosic materials such as sewage sludge or animal manure [8]. More recently, invasive plant species have also attracted the attention of researchers as they are inexpensive, available in large quantities, and their removal results in a large amount of biomass and therefore represents a waste that needs to be managed in a cost-effective and environmentally friendly way.
Invasive plant species are characterized by their ability to spread in non-native habitats and achieve high local abundance [9]. After intentional or unintentional introduction into non-native regions, the alien plant must overcome certain environmental barriers to establish self-sustaining populations, gain a competitive advantage over native species, and conquer the habitat to be considered a “successful invader” [10]. It is therefore assumed that plant characteristics, such as their adaptability to different climatic and soil conditions, high seedling production, the ability of seeds to survive in the soil over several seasons, competition for resources, and the ability to alter biochemical processes in the soil and thus influence the amount of resources available to other plants, play an important role in the invasion process [10]. Moreover, invasive plants can exhibit allelopathy—i.e., they can produce secondary metabolites (allelochemicals) that have harmful effects on native plants. Due to their negative impact on native plants, invasive plants pose a serious threat to biodiversity. Furthermore, these species can limit food availability as they negatively impact food crops, affect animal safety and impose serious expenditures associated with agricultural losses and methods to control the spread of these plants [11]. Finally, invasive species are even reported to cause allergies, act as vectors of pathogens and alter water quality, which can seriously affect human health [11].
Ailanthus altissima (Mill.) Swingle, the so-called tree of heaven, is a typical representative of an invasive plant species. Originally from China, the tree of heaven has spread to other continents due to widespread cultivation and hemerochory and has become one of the most invasive plant species in Europe and North America [12,13]. Its resistance to pollution and rapid proliferation [14] as well as its resistance to relatively low temperatures, drought and adaptation to different soil types have led to the spread of A. altissima in natural sites, such as forests and riverbanks, but also in cities, transportation corridors and generally in areas with poor soil quality [13,15]. Due to the above-mentioned properties, its allelopathic effect [16], and its ability to alter soil quality and influence the entire nutrient cycle, A. altissima can displace native species and ultimately lead to a significant loss of biodiversity [17]. It is also important to note that the pollen of the tree of heaven can cause allergic reactions and dermatitis, while the roots can cause damage to infrastructure [14].
Given the above problems, the implementation of effective strategies to eradicate and manage the spreading of A. altissima is of utmost importance. Mechanical, chemical and biological control measures are used to control A. altissima, each of which has certain efficiency challenges [12,14]. The invasiveness of the species, combined with the high resprouting ability and increased biomass production of A. altissima, requires additional approaches for the deposition and utilization of biomass after eradication measures have been taken. Due to their wide distribution and renewability, invasive plants are generally recognized as suitable BC precursors [2]. The results of our preliminary investigations, based on the exploration of different carbonization routes and the testing of the drug adsorption capability of the resulting BCs, indicate the considerable potential of such a utilization pathway for A. altissima leaves [18].
Our previous study aimed at selecting the most suitable adsorbent for active pharmaceutical ingredients (APIs) from BCs prepared from the leaves of A. altissima was based on the comparison of their removal efficiency under a wide range of adsorption conditions. It was concluded that BC, prepared in a two-step process involving pyrolysis at 500 °C and activation with ZnCl2 at 800 °C, was the most efficient adsorbent for APIs and was therefore selected for further investigation.
This study involves the investigation of physico-chemical properties including the morphology and the chemical composition of the surface of the selected biochar as well as the study of the adsorption kinetics and equilibrium of the systems composed of AcBC-800 and the representative pharmaceuticals. Therefore, the aim of this study is to gain insights into the structural features of biochar that may be important for the retention of APIs as well as to understand the evolution of the adsorption process over time and to determine the adsorption capacities and propose a mechanism for the adsorption of the selected APIs. Ultimately, this study aims to draw clearer conclusions regarding the retention mechanisms and applicability of AcBC-800 in the adsorption of active pharmaceutical ingredients compared to a previous study that only aimed to select the most suitable adsorbent from A. altissima leaves. Thus, this study represents a step towards the implementation of sustainable adsorption processes based on biochar from invasive plants in practice. The activated biochar tested in this study shows quite high adsorption capacities and rapid adsorption of selected APIs, which confirms its applicability. To date, the activation method during the carbonization of invasive species has not been thoroughly examined in the literature, and the use of such biochars for the removal of specific pharmaceutical active compounds remains unexplored. This study presents a novel approach by investigating the properties of biochar derived from Ailanthus altissima for APIs removal from wastewater. Our findings bring significant environmental and economic benefits as they address both the management of invasive plants and the sustainability of adsorption.

2. Materials and Methods

2.1. Chemicals and Reagents

The zinc chloride (p.a.) used as a chemical activating agent during adsorbent preparation was obtained from Merck (Darmstadt, Germany). Paracetamol (>99.9%), atenolol (>99%), tetracycline hydrochloride (>99%) and ketorolac tromethamine (>98.5%), purchased from Sigma Aldrich Chemie GmbH (Taufkirchen, Germany), were used to prepare standard solutions. HPLC grade prepared by Adrona CB-1905 (Adrona SIA, Riga, Latvia) was used for the preparation of standard solutions and HPLC mobile phases. Solutions for pH adjustment were prepared from potassium hydroxide (p.a.) purchased from Merck KGaA (Darmstadt, Germany) and hydrochloric acid (37%, p.a.) from Sigma Aldrich Chemie GmbH (Taufkirchen, Germany). The 3 M potassium chloride solution used for ionic strength adjustment was prepared from potassium chloride (p.a.) obtained from Carl Roth GmbH + Co KG (Karlsruhe, Germany). Acetonitrile (HPLC gradient grade) from Sigma Aldrich Chemie GmbH (Taufkirchen, Germany) was used as an organic modifier of the mobile phase. Buffered mobile phases were prepared with ammonium formate (p.a., Honeywell International Inc., Muskegon, MI, USA) and formic acid (p.a., Sigma Aldrich Chemie GmbH, Taufkirchen, Germany). Perchloric acid 70% (p.a., Riedel-de Haën AG, Seelze, Germany) was used as an additive for the mobile phase.

2.2. Activated Biochar Preparation

After collection, the leaves of A. altissima were first washed with tap and distilled water and dried to a constant mass at room temperature. The leaves were then ground with a mill to obtain a particle size of less than 0.2 mm. The obtained material was stored at room temperature in a desiccator.
The thermochemical conversion of the processed A. altissima leaves into activated biochar was carried out by a two-stage pyrolysis process under an inert atmosphere (argon) in a muffle furnace. The heating rate and argon flow were maintained at 10 °C min−1 and 60 mL min−1 during all pyrolysis steps. The first step was carried out at 500 °C for 2 h to produce biochar (BC-500 sample). A part of BC-500 was mixed with zinc chloride (impregnation ratio 3:1) and subjected to the second pyrolysis step at 800 °C for 2 h to produce activated biochar (AcBC-800).

2.3. Activated Biochar Characterization

2.3.1. Fourier-Transform Infrared (FTIR) Spectroscopy

FTIR spectroscopy was used to test whether the chemical composition of the surface of AcBC-800 is reproducible from batch to batch. The FTIR spectra of the activated biochar sample (AcBC-800) and its precursor sample (BC-500) were recorded with a Nicolet iS20 FTIR Spectrometer (Thermo Scientific, Waltham, MA, USA). Wavenumber range 4000–400 cm−1 was investigated, with a resolution of 4 cm−1. The final FTIR spectra were obtained by averaging 32 scans per spectrum. The samples were prepared using the potassium bromide pellet technique.

2.3.2. Scanning Electron Microscopy (SEM)

A scanning electron microscope (SEM) PhenomProX SEM-EDX (Phenom, Rotterdam, The Netherlands) was used to investigate the morphology of the studied materials.

2.3.3. X-ray Photoelectron Spectroscopy (XPS)

The XPS analysis was performed to investigate the chemical composition of the surface of AcBC-800. The sample was subjected to XPS analysis using a SPECS System (SPECS GmbH, Berlin, Germany) equipped with a PHOIBOS 100/150 concentric hemispherical analyzer and a XP50M X-ray source with a FOCUS 500 monochromator. The sample was irradiated with monochromatic Al Kα X-rays with an excitation energy of 1486.7 eV. A step size of 0.5 eV, a dwell time of 0.2 s and a pass energy of 40 eV were used to record the survey spectrum. Narrow-range spectra were obtained for C 1s and O 1s, which represent the most intense peaks in the survey spectrum. When recording narrow-range spectra, a step size of 0.1 eV, a dwell time of 2 s and a pass energy of 20 eV were set. The electron energy analyzer was operated in FAT (Fixed Analyzer Transmission) mode. A pressure of 1 × 10⁻⁹ mbar was maintained during the analysis. Peak fitting was performed using CasaXPS software version 2.3.26. The C 1s peak at 284.8 eV was used as a binding energy reference. The Shirley function was used to model the inelastic background, while the Gaussian–Lorentzian product (GLP) and asymmetric Lorentzian (LA) functions were used to model the peak shapes.

2.3.4. Raman Spectroscopy

The Raman spectra of biochar samples (BC-500 and AcBC-800) in the wavenumber range 3600–50 cm−1 were recorded with a DXR Raman microscope (Thermo Scientific, Medison, WI, USA). The samples were irradiated with a 532 nm laser excitation line under an exposure time of 10 s, with 10 exposures per spectrum. The laser power was set to 2 mW to avoid degradation of the samples. OMNIC software (latest v. 9.16) was used to acquire the spectral data.
Peak fitting was performed in the region of interest, i.e., 1900–900 cm−1, which has a characteristic pattern for carbonaceous materials. In particular, the G and D bands occurring in this region were analyzed to gain insight into the structure of the samples. Peak fitting was performed in OriginPro 8.5 following the procedure described by Lopez-Diaz et al. where the spectra were fitted with five peaks (D*, D, D″, G and D′) [19].

2.4. Adsorption Tests

2.4.1. Preparation of Standard Solutions

Stock solutions were prepared by dissolving appropriate amounts of reference standard substances in water to obtain a concentration of 1 mg mL−1.
The ionic strength and pH values of the working solutions for the adsorption kinetics and equilibrium studies were adjusted to the values ensuring maximum removal efficiency according to the results of our previous study [18]. The pH values were set to 6.5 (atenolol), 7.5 (paracetamol), 6.0 (ketorolac) and 4.4 (tetracycline), while ionic strength was kept at 165 mM for all measurements. The concentration of the working solutions for the adsorption kinetics study was set at 50 µg mL−1, while the working solutions for the adsorption equilibrium study were prepared in a concentration range of 20 to 200 µg mL−1.
All working solutions for the adsorption test were prepared by transferring the appropriate volume of stock solution to the volumetric flask, adding an appropriate volume of 3 M KCl solution to adjust the ionic strength to the desired value and diluting with water to the specified concentration of the model substance. Negligibly small volumes of 10 M/1 M potassium hydroxide or concentrated (37%)/1 M HCl were then added to adjust the pH. The pH value was determined using a pH-Meterlab PHM210 (Radiometer analytical, Villeurbanne, France).

2.4.2. Adsorption Test Procedure

The adsorption tests were carried out in batch mode of operation. The required mass of adsorbent to achieve a solid-to-liquid ratio of 0.34 was added to each working solution. This solid-to-liquid ratio of 0.34 was chosen as it was found to be optimal in our previous study [18]. The adsorbent suspensions in the working solutions were placed on the laboratory vortex (Digital Vortex-Genie 2, Scientific Industries, Bohemia, NY, USA). The shaking speed and temperature were maintained at 500 rpm and 23 °C, respectively. After appropriate contact times between solution and adsorbent, depending on the test carried out (kinetics or equilibrium), small volumes of the suspension were removed, centrifuged with a DragonLab D2012 Plus (DLAB Scientific Co., Ltd., Beijing, China) centrifuge and analyzed by HPLC. The residual concentrations of the model substances determined by HPLC were used to calculate the adequate measure of adsorption extent. Details on the HPLC methods can be found in Appendix A.
Control samples were used to check for possible losses of model substances that could not be attributed to adsorption to the tested material. For each adsorption test, the control samples corresponded to the working solutions of the model substances, which were kept under the same conditions and for the same time as the working solutions prior to their analysis by HPLC.

2.4.3. Adsorption Kinetics

During the adsorption kinetics study, small aliquots of the samples (150 µL) were collected at appropriate time intervals from 2 min to the time required to reach equilibrium. The total sample collection time was set so that the largest number of points corresponded to non-equilibrium conditions [20].
The following expression was used to calculate the adsorbed amount in time t (qt):
q t = C i C t   V M
where Ci is the initial concentration of the adsorbate, Ct is the residual concentration of adsorbate in time t, V is the volume of adsorbate solution, and M is the mass of adsorbent.
The pseudo-first (PFO) and pseudo-second order (PSO) rate models have often been used to analyze adsorption kinetics. Intrinsic adsorption features are common for a wide range of adsorption systems, with quite versatile adsorbates and adsorbents, and are not limited to pharmaceuticals. However, the kinetic analysis is often misrepresented. PSO has been applied with preference to PFO due to non-strict, widely applied linear forms. Linear modeling of a nonlinear function, with the independent variable at both sides of the equation, leads to a rise in a correlation of over 0.5. When our adsorption kinetic data were examined, we tested both models using non-linear modeling of the PFO and PSO expressions:
q t = q e   1 e k 1 t
q t =   q e 2   k 2   t   1 + q e k 2 t
where qt (mg g−1) is an amount of adsorbed adsorbate at a given time t (min) reaching qe (mg g−1) at equilibrium, k1 (min−1) is the PFO rate constant, and k2 (g mg−1 min−1) is the PSO rate constant.

2.4.4. Adsorption Isotherms

In adsorption equilibrium studies, the solutions of the model substances were in contact with the adsorbent for the time required to reach equilibrium, which was determined by the adsorption kinetics study. The amount of substance adsorbed at equilibrium (qe) was calculated as follows:
q e = C i   C e   V M
where Ce stands for the equilibrium concentration of the model substance. Three isotherm models were used to describe the relationship between Ce and qe—Langmuir, Freundlich and Langmuir–Freundlich:
q e = q m K L   C e 1 + K L   C e  
q e = K F   C e 1 n
q e = q m   K L F   C e 1 n 1 + K L F   C e 1 n
where qe (mg g−1) is the amount of solute adsorbed at equilibrium, Ce (mg L−1) is the equilibrium concentration, qm (mg g−1) is the adsorption capacity estimated from the model, and KL (L mg−1), KF (mg1−1/n L1/n g−1) and KLF ((L mg−1)1/n) are the corresponding equilibrium constants for the Langmuir, Freundlich and Langmuir–Freundlich models, respectively. In the Freundlich and Langmuir–Freundlich models, the exponential term 1/n represents the heterogeneity factor, where n is the number of binding sites occupied by the individual adsorbate molecule. Kinetic curves and adsorption isotherms were modeled in Origin 2021.

2.5. Software

Chem3D 20.0 (PerkinElmer Informatics, Inc., Waltham, MA, USA) and PyMOL version 2.5.5 (Schrödinger, LLC, New York, NY, USA) [21] were used for the visualization of the three-dimensional structures presented in this paper.

3. Results and Discussion

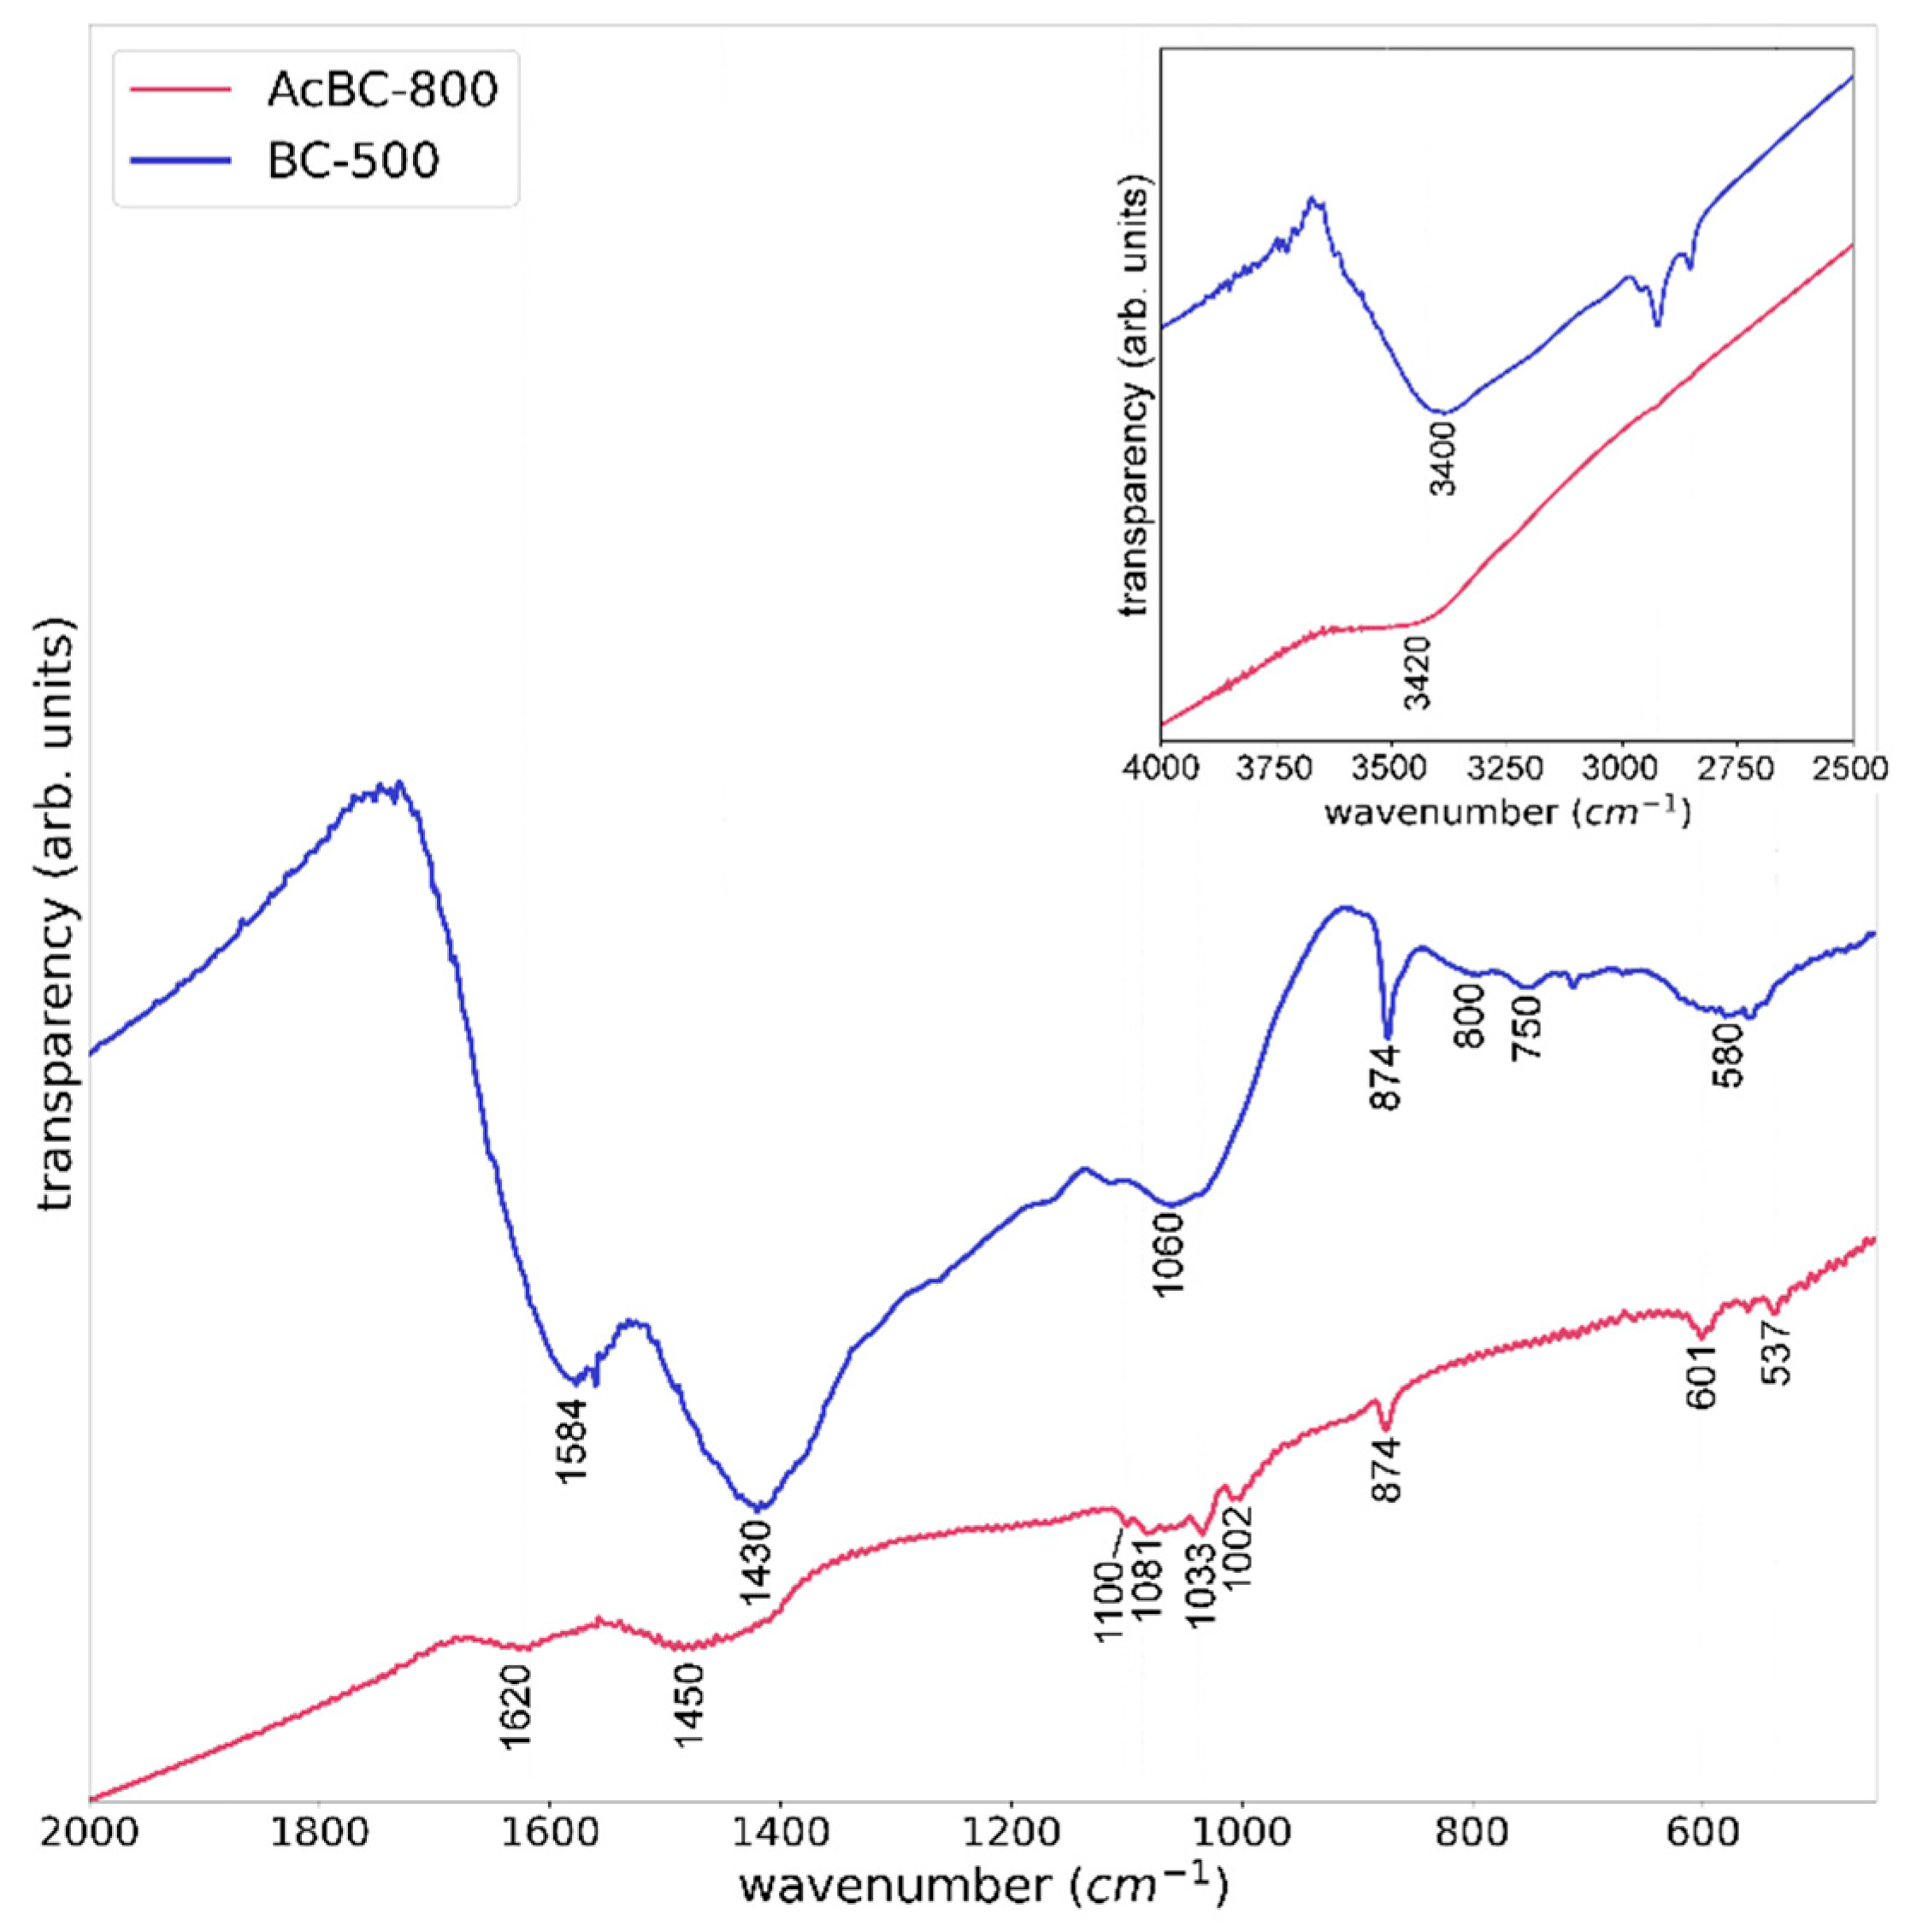
3.1. Evaluation of the Reproducibility of the Production of Activated Biochar by FTIR Spectroscopy

For this study, the FTIR spectra of an additional AcBC-800 sample and its precursor were recorded. The FTIR spectrum of AcBC-800 (Figure 1) matches the spectrum obtained in the previous study [18]. This confirms the robustness of the manufacturing process, as the chemical composition of AcBC-800 can be maintained from batch to batch during production. Most of the bands occurred in the 2000–400 cm−1 range (see Figure 1). The 4000–2500 cm−1 range is shown as an inset in Figure 1.
A detailed discussion of the FTIR spectra of biochar produced from A. altissima under different pyrolysis conditions was provided in our previous study [18]. The identified surface functional groups of AcBC-800 include alcohols/phenols (3420 cm−1, 1000–1100 cm−1 and 874 cm−1) [22,23,24], ethers (1000–1100 cm−1 and 874 cm−1) [22] and carboxylates (1620 and 1450 cm−1) [22,25]. The stretching vibration of C=C bonds in aromatic systems can also lead to the bands at 1620 and 1450 cm−1. No bands of carbonyl groups were observed at around 1700 cm−1. However, this region is associated with a sharp increase in transmittance, due to the conductivity of AcBC-800, which may have masked some low intensity bands. This limits the ability of FTIR to definitively confirm the absence of some surface functional groups (e.g., carbonyl groups) and necessitates the use of other characterization techniques such as XPS.

3.2. Activated Biochar Characterization
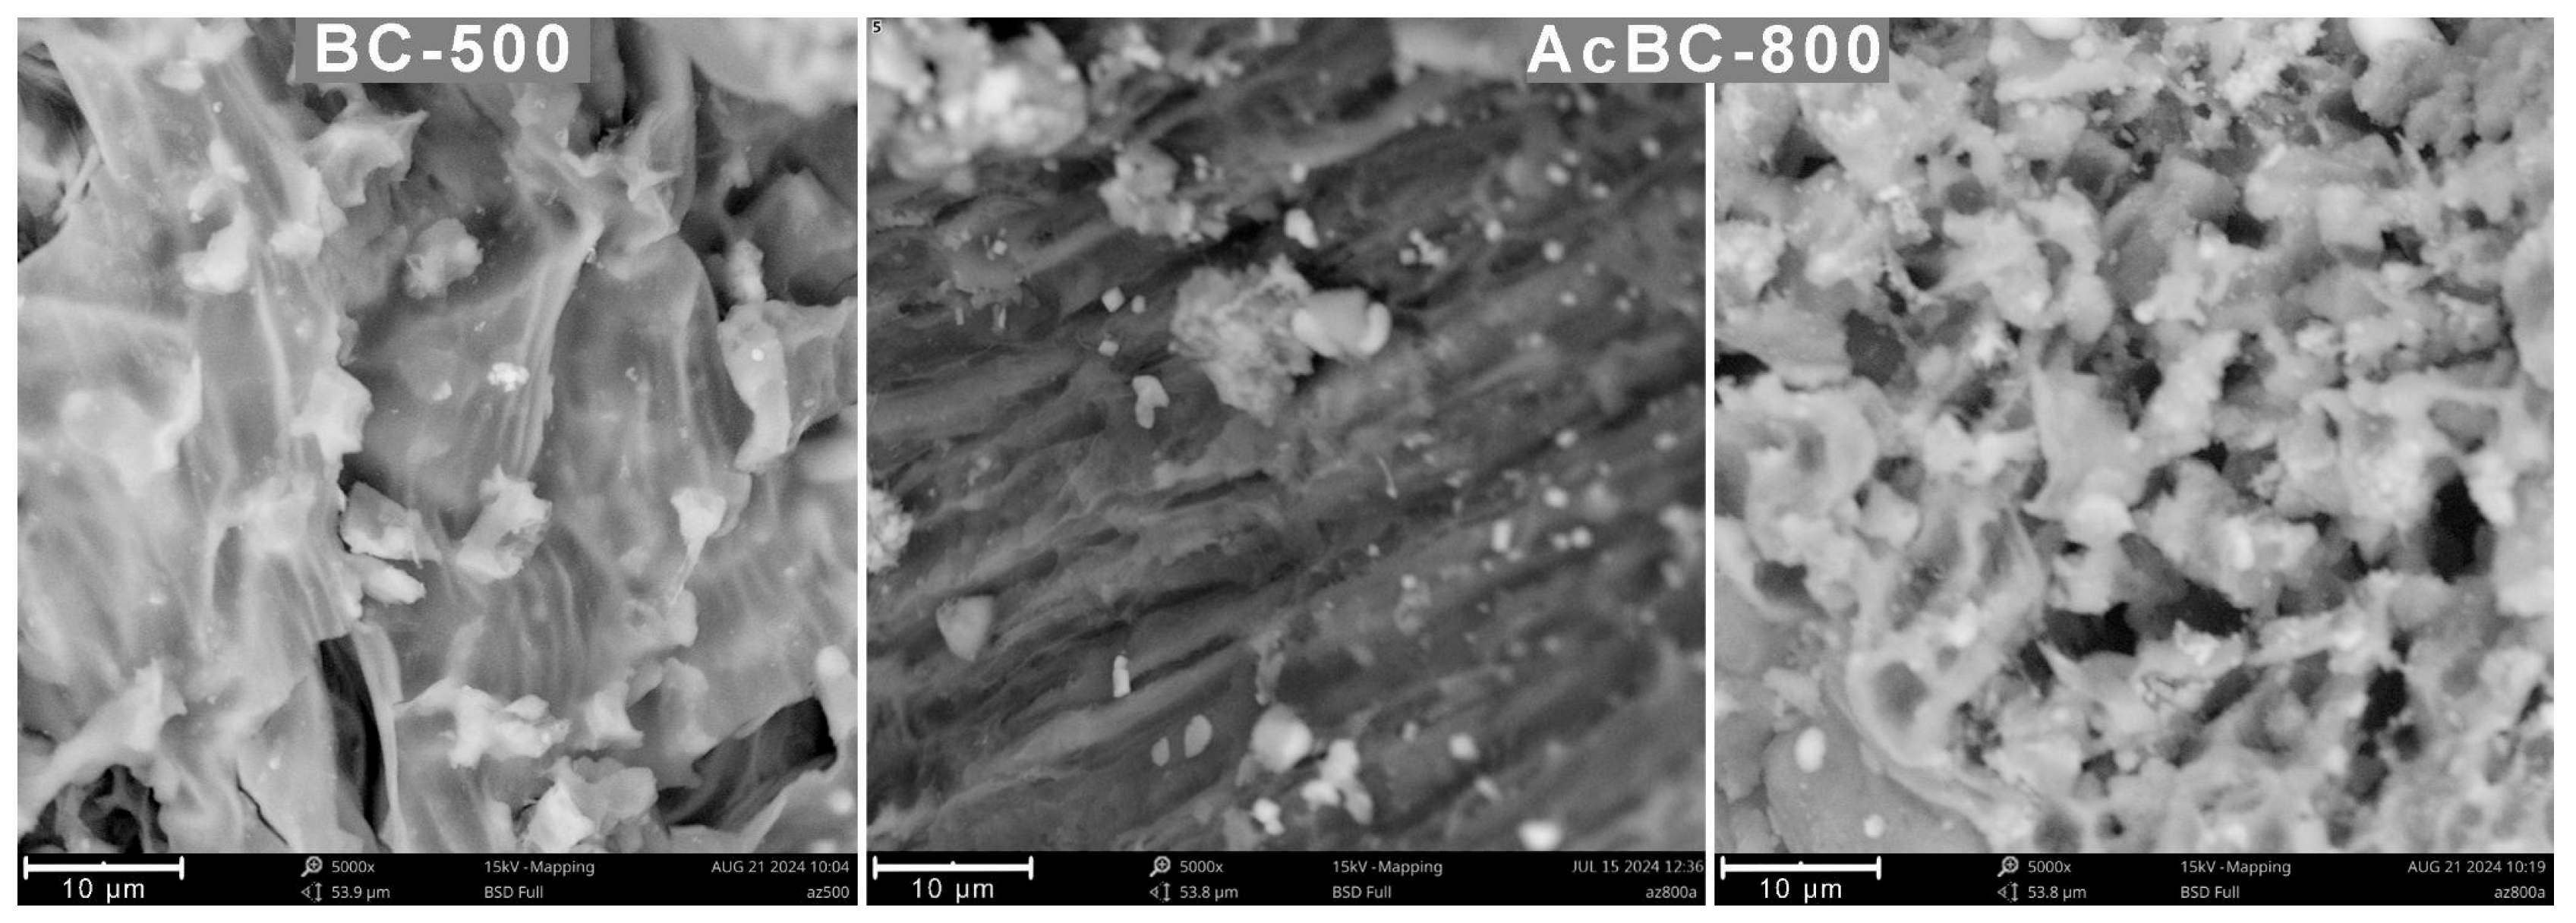
3.2.1. Morphology

It is known that zinc chloride as an activating agent can penetrate biomass and be uniformly distributed at low temperatures [26], enabling the formation of holes and cavities in the BC structure during high-temperature treatment. The surface morphology of BC-500 and AcBC-800 differed significantly as observed in SEM images (Figure 2) and confirmed the expected changes in surface morphology caused by the use of zinc chloride as an activator. It seems that activation caused more roughness, canal-like, and cavity formations in the structure compared to the significantly smoother BC-500 surface. Therefore, the formed channels and cavities lead to a substantial increase in specific surface area (347 m2 g−1 for AcBC-800 compared to 4 m2 g−1 for BC-500, as determined by the BET method [18]). In addition, the AcBC-800 sample is expected to be a more efficient adsorbent, since more developed pore structures act as solvent passage channels. Adsorption tests with APIs of different molecular sizes performed in our previous research indicate the importance of pores in the retention of the tested adsorbates [18].

3.2.2. X-ray Photoelectron Spectroscopy (XPS)

The XPS analysis was carried out to ascertain the surface chemistry of the activated biochar sample. The survey spectrum and the elemental composition determined from the peak areas in the survey spectrum are shown in Figures S1 and S2. Signals from C 1s and O 1s photoelectrons are dominant (Figure S1), which is expected for carbon-based (biochar) samples. Peak fitting was performed for the signals of C 1s and O 1s to obtain a better insight into oxygen functionalities. Peak-fitted C 1s and O 1s XPS spectra of AcBC-800 are shown in Figure 3.
In the C 1s spectrum (Figure 3a), the peaks at 284.65, 286.00, 286.81 and 288.05 eV are assigned to C-C/C-H [25,27,28], C-O-H (alcohol, phenol)/C-O-C (ether) [22,28,29], C=O (ketone, quinone)/epoxide [30,31,32] and O-C=O (carboxylic acid) groups [30,32], respectively. The O 1s spectrum was fitted with four peaks at 530.56, 532.69, 534.34, and 536.00 (Figure 3c), which are attributed to lattice oxygen (ZnO/CaO) [30], O-C=O (carboxylic acid)/C=O (ketone, quinone) [22,31], C-O-C (ethers)/C-O-H (alcohols, phenols) [25,31], and chemisorbed water [22,32]. The position of the carboxylic acid peak in O 1s is lower than usually observed, which could be due to its deprotonation, and consequently there is an increased electron density of oxygen singly bonded to carbon [33]. It is therefore likely that both oxygen atoms in the carboxylic group (from the C=O and C-O bond) have emitted electrons with the same binding energy. The calculated atomic percentages of the C and O atoms in the carboxyl groups confirm the appropriateness of peak assignment (Figure 3b,d). The obtained XPS spectra strongly suggest the presence of carbonyl groups. The band originating from the carbonyl groups in the FTIR spectra appears to be masked by the pronounced increase in transmittance due to the conductivity of the sample. Finally, looking at the FTIR and XPS results, it is likely that the main groups on the activated biochar surface are alcohols/phenols, ethers/epoxides, ketones/quinones and a small number of carboxylates.

3.2.3. Raman Spectroscopy

The Raman spectra of AcBC-800 and its precursor (BC-500) show two maxima in the 1900–900 cm−1 range corresponding to the D band (at ~1350 cm−1) and the G band (at ~1600 cm−1). Peak fitting was performed, and the resulting Raman spectra are shown in Figure 4. The best fit was achieved by using the Voigt function for the G band and the Gaussian function for the remaining bands. In carbon-based materials, the G (graphite) band can be attributed to the E2g mode—i.e., the in-plane stretching vibration of bonds between sp2 C atoms, regardless of whether they form rings or chains [34,35]. In contrast, the D (disorder) band arises from the A1g breathing mode, characteristic of condensed aromatic systems. It is important to note that the D band requires an appropriate size of aromatic graphene-like layers (at least 0.5 nm or six rings) and sufficient proximity of the rings to structural defects or layer edges [36]. The intensity ratios ID/IG were calculated from the areas of D and G peaks (Figure 4) and used with the peak positions and widths to estimate the ordering of the biochar structure. The positions of the D and G bands, the full width at half maximum (FWHM) and the intensity ratios for the biochar samples analyzed are shown in Table 1.
Table 1 shows that the FWHM values of both bands decrease slightly—the D band position redshifts, the G band position blueshifts and ID/IG increases due to activation. Slightly narrower bands indicate a narrower distribution of the size of the crystalline domains and a lower irregularity of the bond angles and lengths and thus an improved structural order of the sample [35,37]. With increasing temperature during biomass pyrolysis, the defects, including the amorphous sp3 carbon, are partially replaced by sp2 edge carbon atoms, similar to those in graphite, and the D band generally shifts to lower wavenumbers [36]. The replacement of the sp3 defects corresponds to the loss of the oxygen functional groups, which was clearly visible in the recorded FTIR spectra [18]. On the other hand, the increase in the G band position can be attributed to the growth and fusion of small graphene layers in the biochar precursor [36]. The space occupied by the resulting layers in activated biochar is limited by the defects, the amorphous phase and the ZnO crystals, which causes the compressive strain and the increase of the G band position [36].
A significant increase in ID/IG with activation is consistent with some results in the literature [38,39,40]. A lower ID/IG value of activated biochar compared to pristine biochar was found in a study on biochar from coffee bean waste [41], but this discrepancy could be due to the increase in oxygen content caused by activation. In contrast to graphitic carbon samples, where the increase in ID/IG indicates the distortion of existing graphitic layers, biochars are considered amorphous materials because extensive graphitization is limited by the structural features of lignin, as described in the literature [42,43]. Consequently, the G band probably does not originate from graphite but from the aromatic systems in general, and the increase in ID/IG indicating the increase in the proportion of sixfold aromatic rings in clusters should not be attributed to the cleavage of graphite. Instead, ID/IG shows a significant increase due to the formation of numerous graphene-like crystallites of small size by the transformation of amorphous carbon originally present in the biochar precursor [44]. Therefore, it is more reasonable to interpret the increase in ID/IG as the increased ordering of biochar. The increase in ID/IG may also indicate an increase in the size of aromatic clusters. As noted by Ferrari and Robertson [35], ID/IG in amorphous carbons is directly proportional to the square of the aromatic cluster size (at a size less than 2 nm).
The improved structural order of the activated biochar is therefore due to the expansion of the sp2-network and the reduction in the content of surface functional groups, as shown by the FTIR analysis. The observed change in Raman parameters is clear evidence that the applied carbonization conditions favor the aromatization of biochar. The proposed structure of the AcBC-800 layer based on the spectroscopic characterization results is shown in Figure 5.

3.3. Adsorption of the Selected APIs on AcBC-800

3.3.1. The Selection of Representative APIs

To address the problem of generalizability of the results of adsorption studies, which usually include a limited number of adsorbates, our previous study emphasized that the selection of adsorbates can be based on their physico-chemical properties [18]. APIs include substances with a wide variety of physico-chemical properties that can determine their adsorption behavior. This imposes a challenge to adequately cover such a large chemical space with only a few representative APIs. A principal component analysis (PCA) was performed to visualize the chemical space defined by the 10 selected physico-chemical properties of APIs. Figure 6a shows the properties of the APIs in a space with reduced dimensionality defined by the three principal components. The points corresponding to the adsorbates selected for this study (marked with the different colors compared to the other points) cover the space of interest excellently. This visual representation confirms that the choice of adsorbates made in our earlier study is therefore appropriate. Figure 6b shows the physico-chemical properties that were considered in the derivation of the principal components and their contributions to the principal components. Further details on the physico-chemical properties of selected pharmaceuticals can be found in Ref. [18]. Details on the principal component analysis can be found in Appendix B.

3.3.2. Adsorption Kinetics

Our previous research concluded that the study of kinetics and equilibrium on BC-500 may be difficult or even infeasible due to the limited ability of BC-500 to adsorb selected APIs and non-reproducible performances [18]. Therefore, only AcBC-800 was subjected to adsorption kinetics and equilibrium study. The resulting kinetic curves for the adsorption of APIs on AcBC-800 are shown in Figure 7. All tested adsorbates undergo fast retention, within the first hour, which is in accordance with similar systems [41]. Three hours were sufficient to achieve equilibrium for all the adsorbates tested. Based on the correlation coefficients R2, and adjusted R2 not being lower than 0.97, the results preferentially follow the PSO model, and the derived adsorption PSO constants and equilibrium values are given in Table 2. Results for the PFO model are presented in Table S1. The highest value for the rate constant is seen for atenolol, where modest adsorption capacities were foreseen given the lowest qe. Similar rate constants are determined for paracetamol and ketorolac, where the latter drug may be retained at a higher capacity by the AcBC-800 sample. Tetracycline has the lowest adsorption rate, while its adsorption capacity is amidst the values determined for other tested APIs. Looking at the PSO rate constants, the large discrepancy between atenolol and other substances tested is striking. Since atenolol is the only cationic adsorbate, it is likely that its diffusion to the binding site is accelerated by the electric field caused by the negatively charged surface of the adsorbent.
The adsorption capacities obtained from the PSO model fitting follow the same order for different model substances as the amounts of drugs adsorbed after the limited contact time obtained in our earlier study [18]. This confirms that the correlation of molecular properties with the adsorbed amount is due to the influence of the molecular properties on the interactions with the surface and not their influence on the adsorption rate. Estimated adsorption capacities are in line with the nature of selected drugs. Atenolol is a cation over a wide pH range, paracetamol is a neutral, tetracycline is a zwitterion, and ketorolac acquires an anionic nature. Since the AcBC-800 sample exhibits negative zeta potential, up to −10 mV in the 2–9 pH range [18], the extent of interaction in the sorption system is associated with more dipole-oriented or dipole-induced than ion–ion interactions. The extent of interaction in this system relies largely on dispersion forces, hydrophobic effect [18] and π–π interactions enabled by the aromatic structures of AcBC-800. Accordingly, the highest adsorption capacities were estimated for molecules with relatively low polarity and small diameters, which allow penetration into the micropores and mesopores and efficient utilization of the adsorbent surface for their retention, such as ketorolac and paracetamol. Ketorolac also has two aromatic rings, which can lead to stronger π–π interactions with the surface of the adsorbent compared to other substances. The proposed interactions of these two model substances with AcBC-800 are shown in Figure 8a,b. The only structural features of the adsorbent required for the above interactions is the presence of aromatic carbon layers of adsorbent, which means that an abundance of adsorption sites is available for paracetamol and ketorolac. On the other hand, atenolol and tetracycline are larger than paracetamol and ketorolac, which limits their entry into the micropores, and are also more polar, which limits the contribution of the hydrophobic effect to their retention. Compared to atenolol, in which the polar alkyl chains are attached to the benzene ring, tetracycline is a rigid molecule in which the benzene and two adjacent rings form a nearly planar structure. In addition, tetracycline is the most polarizable of the adsorbates tested. Thus, when π–π interactions are formed with the AcBC-800 surface, the remainder of the tetracycline skeleton is in close proximity to the surface, allowing for the involvement of dispersion interactions. In contrast, when atenolol forms π–π interactions with the adsorbent, the alkyl chains remain oriented towards the liquid phase, which limits the involvement of dispersion forces. Therefore, strong interactions in the adsorption of atenolol can only occur in close proximity to the surface functional groups, which allows for additional stabilization through ion–dipole, ion–ion and dipole–dipole interactions. Since the availability of functional groups on the surface is limited according to the FTIR and XPS analyses, only a limited portion of the AcBC-800 surface can be an efficient binding site for atenolol. The difference between the postulated binding mechanisms of atenolol and tetracycline is shown in Figure 8c,d.
Studies regarding the kinetics of pharmaceutical adsorption onto biochars often report PSO as the favorable model. However, this is inaccurately connected with chemisorption as a rate-limiting step [45]. The tested model substances do not form chemical bonds with the adsorbent, as such bonds would indicate an incorrect sorption setup, preventing the regeneration and reuse of the sorbent.

3.3.3. Adsorption Isotherms

The adsorption isotherms fitting comprised several often-used models, as shown in Table S2. Langmuir–Freundlich was selected as the most appropriate to reflect a somewhat heterogeneous surface of the carbon sorbent and incorporate the possibility of saturation. The highest estimated monolayer may be seen for tetracycline (210 mg g−1), followed by paracetamol and ketorolac (160 mg g−1), while atenolol coverage was set at 60 mg g−1. When we inspect adsorption isotherms, it is evident that atenolol reaches saturation, while coverage of paracetamol and ketorolac almost reached the calculated monolayer quantity. The highest adsorption constant is seen for ketorolac, favoring its interaction with adsorbent and previously established high rate constants. Table 3 contains the values determined for the model parameters. The values of the equilibrium constant (KLF) and the shapes of the isotherms show that the affinity of AcBC-800 to the APIs decreases in the following order: ketorolac > paracetamol > tetracycline > atenolol. The heterogeneity factor was generally less than one, indicating a favorable adsorption process [46] involving more than one binding site per adsorbate molecule. The only exception was observed in the case of atenolol, where a value above one indicated unfavorable adsorption. The excellent ability of the Langmuir–Freundlich model to represent the experimental data and the values of the heterogeneity factor deviating from one indicate that the surface of AcBC-800 is heterogeneous.
Interestingly, it can be seen from Figure 9 that at equilibrium concentrations of more than 100 mg L−1, the adsorbed amount of tetracycline is higher than those of paracetamol and ketorolac. This indicates additional adsorption sites with low binding energy involved in the retention of tetracycline at high equilibrium concentrations [47]. Since the adsorption process under investigation takes place in the water environment, it is possible that hydroxyl groups at the surface of AcBC-800 tend to form hydrogen bonds with water molecules, similar to what is observed for polar groups on the surface of polar-embedded stationary phases used in liquid chromatography [48]. Accordingly, a high concentration of tetracycline may be required to achieve successful competition with water molecules. The high number of proton acceptor sites of the tetracycline molecule supports this conclusion. The observed equilibrium adsorption behavior of APIs underscores the importance of including variations in adsorbate concentrations in studies of adsorption mechanisms.
The efficiency of the adsorbent is largely affected by precursor and preparation procedures, and several studies investigated pharmaceutical removal from water systems. For instance, diclofenac and levofloxacin retention by activated coffee beans was investigated with established adsorption capacities below 90 mg g−1, ascribed to the high surface area and pore volume of activated samples [41]. Since the Raman study confirmed an increase in ID/IG with activation in AcBC-800, its predominantly aromatic surface enables the adsorption of adsorbates with π electrons of the aromatic rings in activated biochar. Besides the aromaticity of biochar, its relatively large surface area and some oxygen functional groups are additional features that provide versatility and efficiency in the retention of APIs. Moreover, biochar samples expectedly exhibit favorable thermodynamics of adsorption, offering a spontaneous, exothermic process for the retention of active pharmaceutical ingredients [49,50,51].
Atenolol adsorption on granular activated carbon was described with PSO kinetics and a modest capacity of 4 mg g−1 [52]. A significantly higher rate constant (0.16) was reported for adsorption on graphene oxide, but its price hinders possible uses in remediation systems. An adsorption capacity of 184 mg g−1 was determined for the adsorption of atenolol on CO2-activated biochar from palm kernel shells [53]. Paracetamol retention by biowaste-derived carbons with a specific surface area even over 1000 m2 g−1 reached 123 mg g−1 [54]. Eucalyptus residues were also tested as precursors for biochars enabling the retention of cca. 120 mg g−1 [55]. As no data are available on the adsorption of ketorolac on carbonaceous materials, the reported adsorption capacities for similar compounds are given for comparison. The maximum ibuprofen adsorption capacity was 120 mg g−1 for ceramic-derived carbons [56]. Etodolac adsorption capacity of 20 mg g−1 was determined for activated biochar from the mixture of apricot and peach stones and almond shells [57]. In the study on the adsorption of tetracycline on activated biochar from Pinus taeda with a specific surface area of 960 m2 g−1, an adsorption capacity of 275 mg g−1 was determined according to the Langmuir model [58]. In another article, the adsorption capacity for tetracycline of 174 mg g−1 was achieved by using KOH-activated reed-based biochar with a surface area of 965 m2 g−1 [59]. Despite the relatively lower surface area (347 m2 g−1) of AcBC-800, its drug adsorption capacities are quite close to that of the above examples. This confirms that the proposed raw material and carbonization process result in a unique set of properties that ensure efficient drug adsorption and are therefore suitable for the production of drug adsorbents. An adsorbent regeneration route may be seen in different procedures. A comprehensive review of the chemical regeneration of biochar adsorbents highlights the application of the oxidative decomposition of organic pollutants [60]. Due to the thermal stability of materials produced at high temperatures, thermal regeneration is a simple and effective method for adsorbent regeneration often proposed in the literature [61].

4. Conclusions

In this study, the properties and advantages of activated biochar from the leaves of Ailanthus altissima as an adsorbent for active ingredients were demonstrated by physico-chemical characterization and adsorption tests with the selected model substances. A spectroscopic analysis revealed a significant amount of oxygen-based functional groups on the surface, including hydroxyl, ether, carbonyl and carboxyl. As the FTIR analysis shows, the chemical composition of the surface of the activated biochar appears to be reproducible from batch to batch, which speaks in favor of the proposed carbonization process. The increased aromaticity compared to the precursor biochar is clearly evident from the Raman spectra and the analyzed Raman parameters. According to the observed properties, the adsorption of pharmaceuticals can be achieved through dispersion forces, dipole-based interactions and π–π interactions. The relationship between the properties of the selected model substances and their adsorption capacities supports the proposed adsorption mechanisms. The adsorption capacities estimated from the kinetics study were 46.2, 75.3, 88.0 and 113.4 mg g−1 for atenolol, tetracycline, paracetamol and ketorolac, respectively, indicating a higher affinity of the adsorbent for less polar adsorbates. However, higher equilibrium concentrations of the model substances result in the adsorption capacity of tetracycline exceeding the capacity observed for other substances (210 mg g−1 compared to up to 160 mg g−1 for other substances), indicating the importance of the hydrogen bonding ability of the adsorbate. Relatively high adsorption capacities for the selected drugs and their relatively fast adsorption (within 180 min) on AcBC-800 favor further investigation of this material and its potential application in drug analysis and water remediation.
Future research should focus on optimizing the carbonization and activation processes of biochar derived from invasive species to enhance its adsorptive properties for a broader range of contaminants. The environmental implications of utilizing such biochar in real-world applications highlight its potential role in comprehensive remediation strategies.

Supplementary Materials

The following supporting information can be downloaded at www.mdpi.com/xxx/s1—Figure S1: XPS survey spectrum of AcBC-800; Figure S2: Elemental composition of AcBC-800 surface determined from XPS survey spectrum; Table S1: PFO adsorption kinetics derived parameters; Table S2: Derived Langmuir and Freundlich isotherm parameters for drug adsorption on AcBC-800 sample.

Author Contributions

Conceptualization, A.J.L., A.P., A.M. and D.R.; methodology, A.M. and B.O.; software, J.S.; validation, J.S. and A.J.L.; formal analysis, J.S., D.B.-B., M.M.-R. and A.J.L.; investigation, J.S. and D.B.-B.; resources, D.R.; writing—original draft preparation, J.S., A.J.L. and M.M.-R.; writing—review and editing, A.P., A.J.L., A.M., M.M.-R., D.B.-B., D.R. and B.O.; visualization, J.S., M.M.-R. and A.J.L.; supervision, A.J.L. and A.P.; project administration, A.P. and A.J.L. All authors have read and agreed to the published version of the manuscript.

Funding

This research was funded by Ministry of Science, Technological Development and Innovation, Republic of Serbia through Grant Agreements with University of Belgrade—Faculty of Pharmacy No: 451-03-66/2024-03/200161 and 451-03-65/2024-03/200161, Grant Agreement with Institute of Technology of Nuclear and Other Mineral Raw Materials—ITNMS, Belgrade No: 451-03-66/2024-03/200023, and Grant Agreement with University of Belgrade—Faculty of Physical Chemistry No: 451-03-65/2024-03/200146 and 451-03-66/2024-03/200146.

Data Availability Statement

Data is contained within the article or Supplementary Materials.

Conflicts of Interest

The authors declare no conflicts of interest. The funders had no role in the design of this study, in the collection, analyses, or interpretation of data, in the writing of the manuscript, or in the decision to publish the results.

Appendix A

HPLC was used to determine the concentration of the model substances remaining in the solutions after appropriate contact times with the adsorbent as well as their concentration in the control samples. The HPLC analysis was performed using a Finnigan Surveyor Thermo Scientific (Thermo Fisher Scientific, Waltham, MA, USA) with a UV-VIS Detector Plus, Autosampler Plus and LC Pump Plus. The same column was used for all analyses, namely the Agilent Technologies Zorbax Eclipse XDB-C18 column (4.6 × 150 mm, 5 µm). For all HPLC methods, the column temperature was kept at 30 °C, and the flow rate of the mobile phase at 1 mL min−1. Further specific details on the methods for different substances are listed in Table A1.
Table A1. HPLC methods for the quantification of four selected model substances.
AnalyteInjection Volume (µL)Detection Wavelength (nm)Run Time (min)Mobile Phase Composition
Organic ModifierAqueous PhaseModifier vol. %
atenolol102253.5acetonitrile30 mM HClO4 pH 2.515
paracetamol52423water15
ketorolac tromethamine53233.510 mM HCOOH/HCOONH4 buffer pH 2.850
tetracycline hydrochloride102704100 mM HClO4 pH 2.530

Appendix B

The data on the physico-chemical properties of the APIs were downloaded from the DrugBank database (version 5.1.12) [62]. The properties of interest, such as partition coefficient (logP), acidic and basic pKa values, charge, number of rings, polarizability, molecular weight, number of proton acceptor/donor sites and PSA, were extracted from the complete database using Python 3.11.5. The properties were scaled using the standard scaler and missing values were imputed using the multiple iterative imputer from the scikit-learn package version 1.3.0 [63]. The same package was used to perform PCA. Three principal components were selected to visualize the chemical space of the APIs as they explain about 83% of the variance in the data (Figure A1). Data visualization was performed with matplotlib version 3.8.0.
Figure A1. Variance explained by the principal components, with the bars showing the individual variance for each principal component and the lines showing the cumulative variance.
Processes 12 02149 g0a1

References

  1. Oliveira, F.R.; Patel, A.K.; Jaisi, D.P.; Adhikari, S.; Lu, H.; Khanal, S.K. Environmental Application of Biochar: Current Status and Perspectives. Bioresour. Technol. 2017, 246, 110–122. [Google Scholar] [CrossRef] [PubMed]
  2. Yang, L.; Deng, Y.; Shu, Z.; Chen, Q.; Yang, H.; Tan, X. Application of Invasive Plants as Biochar Precursors in the Field of Environment and Energy Storage. Front. Environ. Sci. 2022, 10, 902915. [Google Scholar] [CrossRef]
  3. Foo, K.Y.; Hameed, B.H. Insights into the Modeling of Adsorption Isotherm Systems. Chem. Eng. J. 2010, 156, 2–10. [Google Scholar] [CrossRef]
  4. Thompson, K.A.; Shimabuku, K.K.; Kearns, J.P.; Knappe, D.R.U.; Summers, R.S.; Cook, S.M. Environmental Comparison of Biochar and Activated Carbon for Tertiary Wastewater Treatment. Environ. Sci. Technol. 2016, 50, 11253–11262. [Google Scholar] [CrossRef]
  5. Cheng, N.; Wang, B.; Wu, P.; Lee, X.; Xing, Y.; Chen, M.; Gao, B. Adsorption of Emerging Contaminants from Water and Wastewater by Modified Biochar: A Review. Environ. Pollut. 2021, 273, 116448. [Google Scholar] [CrossRef]
  6. Panwar, N.L.; Pawar, A. Influence of Activation Conditions on the Physicochemical Properties of Activated Biochar: A Review. Biomass Convers. Biorefinery 2022, 12, 925–947. [Google Scholar] [CrossRef]
  7. Kalinke, C.; Oliveira, P.R.; Oliveira, G.A.; Mangrich, A.S.; Marcolino-Junior, L.H.; Bergamini, M.F. Activated Biochar: Preparation, Characterization and Electroanalytical Application in an Alternative Strategy of Nickel Determination. Anal. Chim. Acta 2017, 983, 103–111. [Google Scholar] [CrossRef]
  8. da Silva Medeiros, D.C.C.; Nzediegwu, C.; Benally, C.; Messele, S.A.; Kwak, J.-H.; Naeth, M.A.; Ok, Y.S.; Chang, S.X.; Gamal El-Din, M. Pristine and Engineered Biochar for the Removal of Contaminants Co-Existing in Several Types of Industrial Wastewaters: A Critical Review. Sci. Total Environ. 2022, 809, 151120. [Google Scholar] [CrossRef]
  9. van Kleunen, M.; Bossdorf, O.; Dawson, W. The Ecology and Evolution of Alien Plants. Annu. Rev. Ecol. Evol. Syst. 2018, 49, 25–47. [Google Scholar] [CrossRef]
  10. Gioria, M.; Hulme, P.E.; Richardson, D.M.; Pyšek, P. Why Are Invasive Plants Successful? Annu. Rev. Plant Biol. 2023, 74, 635–670. [Google Scholar] [CrossRef]
  11. Nguyen, D.T.C.; Tran, T.V.; Kumar, P.S.; Din, A.T.M.; Jalil, A.A.; Vo, D.-V.N. Invasive Plants as Biosorbents for Environmental Remediation: A Review. Environ. Chem. Lett. 2022, 20, 1421–1451. [Google Scholar] [CrossRef] [PubMed]
  12. Soler, J.; Izquierdo, J. The Invasive Ailanthus Altissima: A Biology, Ecology, and Control Review. Plants 2024, 13, 931. [Google Scholar] [CrossRef] [PubMed]
  13. Kowarik, I.; Säumel, I. Biological Flora of Central Europe: Ailanthus altissima (Mill.) Swingle. Perspect. Plant Ecol. Evol. Syst. 2007, 8, 207–237. [Google Scholar] [CrossRef]
  14. Sladonja, B.; Sušek, M.; Guillermic, J. Review on Invasive Tree of Heaven (Ailanthus altissima (Mill.) Swingle) Conflicting Values: Assessment of Its Ecosystem Services and Potential Biological Threat. Environ. Manag. 2015, 56, 1009–1034. [Google Scholar] [CrossRef]
  15. Enescu, C.; Durrant, T.; Caudullo, G. Ailanthus altissima in Europe: Distribution, Habitat, Usage and Threats. In European Atlas of Forest Tree Species; San-Miguel-Ayanz, J., de Rigo, D., Caudullo, G., Houston Durrant, T., Mauri, A., Eds.; Publications Office of the European Union: Luxembourg, 2016; ISBN 978-92-79-36740-3. [Google Scholar]
  16. Caramelo, D.; Pedro, S.I.; Marques, H.; Simão, A.Y.; Rosado, T.; Barroca, C.; Gominho, J.; Anjos, O.; Gallardo, E. Insights into the Bioactivities and Chemical Analysis of Ailanthus altissima (Mill.) Swingle. Appl. Sci. 2021, 11, 11331. [Google Scholar] [CrossRef]
  17. Constán-Nava, S.; Soliveres, S.; Torices, R.; Serra, L.; Bonet, A. Direct and Indirect Effects of Invasion by the Alien Tree Ailanthus altissima on Riparian Plant Communities and Ecosystem Multifunctionality. Biol. Invasions 2015, 17, 1095–1108. [Google Scholar] [CrossRef]
  18. Stojanović, J.; Milojević-Rakić, M.; Bajuk-Bogdanović, D.; Ranđelović, D.; Sokić, M.; Otašević, B.; Malenović, A.; Ležaić, A.J.; Protić, A. Chemometrically-Aided General Approach to Novel Adsorbents Studies: Case Study on the Adsorption of Pharmaceuticals by the Carbonized Ailanthus altissima Leaves. Heliyon 2024, 10, e34841. [Google Scholar] [CrossRef]
  19. López-Díaz, D.; López Holgado, M.; García-Fierro, J.L.; Velázquez, M.M. Evolution of the Raman Spectrum with the Chemical Composition of Graphene Oxide. J. Phys. Chem. C 2017, 121, 20489–20497. [Google Scholar] [CrossRef]
  20. Tran, H.N.; You, S.-J.; Hosseini-Bandegharaei, A.; Chao, H.-P. Mistakes and Inconsistencies Regarding Adsorption of Contaminants from Aqueous Solutions: A Critical Review. Water Res. 2017, 120, 88–116. [Google Scholar] [CrossRef]
  21. Schrödinger, LLC. The PyMOL Molecular Graphics System, Version 1.8 2015; Schrödinger, LLC.: New York, NY, USA, 2015. [Google Scholar]
  22. Axet, M.R.; Dechy-Cabaret, O.; Durand, J.; Gouygou, M.; Serp, P. Coordination Chemistry on Carbon Surfaces. Coord. Chem. Rev. 2016, 308, 236–345. [Google Scholar] [CrossRef]
  23. Pinheiro, R.F.; Grimm, A.; Oliveira, M.L.S.; Vieillard, J.; Silva, L.F.O.; De Brum, I.A.S.; Lima, É.C.; Naushad, M.; Sellaoui, L.; Dotto, G.L.; et al. Adsorptive Behavior of the Rare Earth Elements Ce and La on a Soybean Pod Derived Activated Carbon: Application in Synthetic Solutions, Real Leachate and Mechanistic Insights by Statistical Physics Modeling. Chem. Eng. J. 2023, 471, 144484. [Google Scholar] [CrossRef]
  24. Grimm, A.; dos Reis, G.S.; Dinh, V.M.; Larsson, S.H.; Mikkola, J.-P.; Lima, E.C.; Xiong, S. Hardwood Spent Mushroom Substrate–Based Activated Biochar as a Sustainable Bioresource for Removal of Emerging Pollutants from Wastewater. Biomass Convers. Biorefinery 2024, 14, 2293–2309. [Google Scholar] [CrossRef]
  25. Jovanovic, Z.; Bajuk-Bogdanović, D.; Jovanović, S.; Mravik, Ž.; Kovač, J.; Holclajtner-Antunović, I.; Vujković, M. The Role of Surface Chemistry in the Charge Storage Properties of Graphene Oxide. Electrochim. Acta 2017, 258, 1228–1243. [Google Scholar] [CrossRef]
  26. Anto, S.; Sudhakar, M.P.; Shan Ahamed, T.; Samuel, M.S.; Mathimani, T.; Brindhadevi, K.; Pugazhendhi, A. Activation Strategies for Biochar to Use as an Efficient Catalyst in Various Applications. Fuel 2021, 285, 119205. [Google Scholar] [CrossRef]
  27. Breitenbach, S.; Gavrilov, N.; Pašti, I.; Unterweger, C.; Duchoslav, J.; Stifter, D.; Hassel, A.W.; Fürst, C. Biomass-Derived Carbons as Versatile Materials for Energy-Related Applications: Capacitive Properties vs. Oxygen Reduction Reaction Catalysis. C 2021, 7, 55. [Google Scholar] [CrossRef]
  28. High Resolution XPS of Organic Polymers: The Scienta ESCA300 Database (Beamson, G.; Briggs, D.). J. Chem. Educ. 1993, 70, A25. [CrossRef]
  29. Rabchinskii, M.K.; Shnitov, V.V.; Brzhezinskaya, M.; Baidakova, M.V.; Stolyarova, D.Y.; Ryzhkov, S.A.; Saveliev, S.D.; Shvidchenko, A.V.; Nefedov, D.Y.; Antonenko, A.O.; et al. Manifesting Epoxide and Hydroxyl Groups in XPS Spectra and Valence Band of Graphene Derivatives. Nanomaterials 2023, 13, 23. [Google Scholar] [CrossRef]
  30. Duan, X.-L.; Yuan, C.-G.; Jing, T.-T.; Yuan, X.-D. Removal of Elemental Mercury Using Large Surface Area Micro-Porous Corn Cob Activated Carbon by Zinc Chloride Activation. Fuel 2019, 239, 830–840. [Google Scholar] [CrossRef]
  31. Kwan, Y.C.G.; Ng, G.M.; Huan, C.H.A. Identification of Functional Groups and Determination of Carboxyl Formation Temperature in Graphene Oxide Using the XPS O 1s Spectrum. Thin Solid Film. 2015, 590, 40–48. [Google Scholar] [CrossRef]
  32. Zhou, J.-H.; Sui, Z.-J.; Zhu, J.; Li, P.; Chen, D.; Dai, Y.-C.; Yuan, W.-K. Characterization of Surface Oxygen Complexes on Carbon Nanofibers by TPD, XPS and FT-IR. Carbon 2007, 45, 785–796. [Google Scholar] [CrossRef]
  33. Stevens, J.S.; Byard, S.J.; Zlotnikov, E.; Schroeder, S.L.M. Detection of Free Base Surface Enrichment of a Pharmaceutical Salt by X-Ray Photoelectron Spectroscopy (XPS). J. Pharm. Sci. 2011, 100, 942–948. [Google Scholar] [CrossRef] [PubMed]
  34. Rupar, J.; Bajuk-Bogdanović, D.; Milojević-Rakić, M.; Krstić, J.; Upadhyay, K.; Gavrilov, N.; Janošević Ležaić, A. Tailored Porosity Development in Carbons via Zn2+ Monodispersion: Fitting Supercapacitors. Microporous Mesoporous Mater. 2022, 335, 111790. [Google Scholar] [CrossRef]
  35. Ferrari, A.C.; Robertson, J. Interpretation of Raman Spectra of Disordered and Amorphous Carbon. Phys. Rev. B 2000, 61, 14095–14107. [Google Scholar] [CrossRef]
  36. McDonald-Wharry, J.; Manley-Harris, M.; Pickering, K. Carbonisation of Biomass-Derived Chars and the Thermal Reduction of a Graphene Oxide Sample Studied Using Raman Spectroscopy. Carbon 2013, 59, 383–405. [Google Scholar] [CrossRef]
  37. Tsaneva, V.N.; Kwapinski, W.; Teng, X.; Glowacki, B.A. Assessment of the Structural Evolution of Carbons from Microwave Plasma Natural Gas Reforming and Biomass Pyrolysis Using Raman Spectroscopy. Carbon 2014, 80, 617–628. [Google Scholar] [CrossRef]
  38. Shagali, A.A.; Hu, S.; Wang, Y.; Li, H.; Wang, Y.; Su, S.; Xiang, J. Comparative Study on One-Step Pyrolysis Activation of Walnut Shells to Biochar at Different Heating Rates. Energy Rep. 2021, 7, 388–396. [Google Scholar] [CrossRef]
  39. Abbaci, F.; Nait-Merzoug, A.; Guellati, O.; Harat, A.; El Haskouri, J.; Delhalle, J.; Mekhalif, Z.; Guerioune, M. Bio/KOH Ratio Effect on Activated Biochar and Their Dye Based Wastewater Depollution. J. Anal. Appl. Pyrolysis 2022, 162, 105452. [Google Scholar] [CrossRef]
  40. Varela, C.F.; Moreno-Aldana, L.C.; Agámez-Pertuz, Y.Y. Adsorption of Pharmaceutical Pollutants on ZnCl2-Activated Biochar from Corn Cob: Efficiency, Selectivity and Mechanism. J. Bioresour. Bioprod. 2024, 9, 58–73. [Google Scholar] [CrossRef]
  41. Maged, A.; Dissanayake, P.D.; Yang, X.; Pathirannahalage, C.; Bhatnagar, A.; Ok, Y.S. New Mechanistic Insight into Rapid Adsorption of Pharmaceuticals from Water Utilizing Activated Biochar. Environ. Res. 2021, 202, 111693. [Google Scholar] [CrossRef]
  42. Zhang, C.; Shao, Y.; Zhang, L.; Zhang, S.; Westerhof, R.J.M.; Liu, Q.; Jia, P.; Li, Q.; Wang, Y.; Hu, X. Impacts of Temperature on Evolution of Char Structure during Pyrolysis of Lignin. Sci. Total Environ. 2020, 699, 134381. [Google Scholar] [CrossRef]
  43. Sagues, W.J.; Jain, A.; Brown, D.; Aggarwal, S.; Suarez, A.; Kollman, M.; Park, S.; Argyropoulos, D.S. Are Lignin-Derived Carbon Fibers Graphitic Enough? Green Chem. 2019, 21, 4253–4265. [Google Scholar] [CrossRef]
  44. Shao, Y.; Guizani, C.; Grosseau, P.; Chaussy, D.; Beneventi, D. Biocarbons from Microfibrillated Cellulose/Lignosulfonate Precursors: A Study of Electrical Conductivity Development during Slow Pyrolysis. Carbon 2018, 129, 357–366. [Google Scholar] [CrossRef]
  45. Chauhan, S.; Shafi, T.; Dubey, B.K.; Chowdhury, S. Biochar-Mediated Removal of Pharmaceutical Compounds from Aqueous Matrices via Adsorption. Waste Dispos. Sustain. Energy 2023, 5, 37–62. [Google Scholar] [CrossRef] [PubMed]
  46. Milojević-Rakić, M.; Janošević, A.; Krstić, J.; Nedić Vasiljević, B.; Dondur, V.; Ćirić-Marjanović, G. Polyaniline and Its Composites with Zeolite ZSM-5 for Efficient Removal of Glyphosate from Aqueous Solution. Microporous Mesoporous Mater. 2013, 180, 141–155. [Google Scholar] [CrossRef]
  47. Kumar, K.V.; Gadipelli, S.; Wood, B.; Ramisetty, K.A.; Stewart, A.A.; Howard, C.A.; Brett, D.J.L.; Rodriguez-Reinoso, F. Characterization of the Adsorption Site Energies and Heterogeneous Surfaces of Porous Materials. J. Mater. Chem. A 2019, 7, 10104–10137. [Google Scholar] [CrossRef]
  48. Xiao, K. Analytical Chemistry and Separation Science at Molecular Level. In Analytical Scientists in Pharmaceutical Product Development; John Wiley & Sons, Inc.: Hoboken, NJ, USA, 2020; pp. 101–149. ISBN 978-1-119-54778-5. [Google Scholar]
  49. Tran, H.N.; Tomul, F.; Thi Hoang Ha, N.; Nguyen, D.T.; Lima, E.C.; Le, G.T.; Chang, C.-T.; Masindi, V.; Woo, S.H. Innovative Spherical Biochar for Pharmaceutical Removal from Water: Insight into Adsorption Mechanism. J. Hazard. Mater. 2020, 394, 122255. [Google Scholar] [CrossRef]
  50. Ahmad, A.A.; Din, A.T.M.; Yahaya, N.K.E.M.; Karim, J.; Ahmad, M.A. Atenolol Sequestration Using Activated Carbon Derived from Gasified Glyricidia Sepium. Arab. J. Chem. 2020, 13, 7544–7557. [Google Scholar] [CrossRef]
  51. Rizkallah, B.M.; Galal, M.M.; Matta, M.E. Characteristics of Tetracycline Adsorption on Commercial Biochar from Synthetic and Real Wastewater in Batch and Continuous Operations: Study of Removal Mechanisms, Isotherms, Kinetics, Thermodynamics, and Desorption. Sustainability 2023, 15, 8249. [Google Scholar] [CrossRef]
  52. Haro, N.K.; Del Vecchio, P.; Marcilio, N.R.; Féris, L.A. Removal of Atenolol by Adsorption—Study of Kinetics and Equilibrium. J. Clean. Prod. 2017, 154, 214–219. [Google Scholar] [CrossRef]
  53. To, M.-H.; Hadi, P.; Hui, C.-W.; Lin, C.S.K.; McKay, G. Mechanistic Study of Atenolol, Acebutolol and Carbamazepine Adsorption on Waste Biomass Derived Activated Carbon. J. Mol. Liq. 2017, 241, 386–398. [Google Scholar] [CrossRef]
  54. Ferreira, R.C.; de Araújo, T.P.; Dias, D.; Bernardo, M.; Lapa, N.; Fonseca, I.M.; de Barros, M.A.S.D. Removal of Paracetamol and Cu2+ from Water by Using Porous Carbons Derived from Agrowastes. Processes 2023, 11, 2146. [Google Scholar] [CrossRef]
  55. Bursztyn Fuentes, A.L.; Canevesi, R.L.S.; Gadonneix, P.; Mathieu, S.; Celzard, A.; Fierro, V. Paracetamol Removal by Kon-Tiki Kiln-Derived Biochar and Activated Carbons. Ind. Crops Prod. 2020, 155, 112740. [Google Scholar] [CrossRef]
  56. Bursztyn Fuentes, A.L.; Benito, D.E.; Montes, M.L.; Scian, A.N.; Lombardi, M.B. Paracetamol and Ibuprofen Removal from Aqueous Phase Using a Ceramic-Derived Activated Carbon. Arab. J. Sci. Eng. 2023, 48, 525–537. [Google Scholar] [CrossRef] [PubMed]
  57. Erdem, H.; Yildiz, B.; Şahin, M.; Erdem, M. Etodolac Adsorption onto Activated Carbon Prepared by Chemical Activation and Pyrolysis of Biomasses Mixture. Biomass Convers. Biorefinery 2020, 10, 1153–1165. [Google Scholar] [CrossRef]
  58. Jang, H.M.; Yoo, S.; Choi, Y.-K.; Park, S.; Kan, E. Adsorption Isotherm, Kinetic Modeling and Mechanism of Tetracycline on Pinus Taeda-Derived Activated Biochar. Bioresour. Technol. 2018, 259, 24–31. [Google Scholar] [CrossRef]
  59. Zhao, C.; Ma, J.; Li, Z.; Xia, H.; Liu, H.; Yang, Y. Highly Enhanced Adsorption Performance of Tetracycline Antibiotics on KOH-Activated Biochar Derived from Reed Plants. RSC Adv. 2020, 10, 5066–5076. [Google Scholar] [CrossRef]
  60. Alsawy, T.; Rashad, E.; El-Qelish, M.; Mohammed, R.H. A Comprehensive Review on the Chemical Regeneration of Biochar Adsorbent for Sustainable Wastewater Treatment. NPJ Clean Water 2022, 5, 29. [Google Scholar] [CrossRef]
  61. Greiner, B.G.; Shimabuku, K.K.; Summers, R.S. Influence of Biochar Thermal Regeneration on Sulfamethoxazole and Dissolved Organic Matter Adsorption. Environ. Sci. Water Res. Technol. 2018, 4, 169–174. [Google Scholar] [CrossRef]
  62. Wishart, D.S.; Feunang, Y.D.; Guo, A.C.; Lo, E.J.; Marcu, A.; Grant, J.R.; Sajed, T.; Johnson, D.; Li, C.; Sayeeda, Z.; et al. DrugBank 5.0: A Major Update to the DrugBank Database for 2018. Nucleic Acids Res. 2018, 46, D1074–D1082. [Google Scholar] [CrossRef]
  63. Pedregosa, F.; Varoquaux, G.; Gramfort, A.; Michel, V.; Thirion, B.; Grisel, O.; Blondel, M.; Prettenhofer, P.; Weiss, R.; Dubourg, V.; et al. Scikit-Learn: Machine Learning in Python. J. Mach. Learn. Res. 2011, 12, 2825–2830. [Google Scholar] [CrossRef]
Figure 1. FTIR spectra of AcBC-800 and its precursor (BC-500) in the 2000–500 cm−1 range, with the 4000–2500 cm−1 range shown in the inset of the plot.
Processes 12 02149 g001
Figure 2. SEM images of BC-500 and AcBC-800.
Processes 12 02149 g002
Figure 3. (a) C 1s spectrum of AcBC-800; (b) Elemental concentrations (at. %) determined from C 1s spectrum corresponding to identified functional groups; (c) O 1s spectrum of AcBC-800; (d) Elemental concentrations (at. %) determined from O 1s spectrum corresponding to identified functional groups.
Processes 12 02149 g003
Figure 4. Peak-fitted Raman spectra of: (a) BC-500; (b) AcBC-800.
Processes 12 02149 g004
Figure 5. The proposed structure of AcBC-800 layer (the colors of the atoms are assigned based on their partial charges).
Processes 12 02149 g005
Figure 6. (a) PCA score plot of APIs in a space defined by the three principal components (PC1, PC2, and PC3); (b) PCA loading plot showing the contributions of physico-chemical properties of APIs to each principal component (Pol—polarizability, MW—molecular weight, Hacc/Hdon—number of proton acceptors/donors, PSA—polar surface area).
Processes 12 02149 g006
Figure 7. Kinetic curves recorded for drug adsorption on the AcBC-800 sample.
Processes 12 02149 g007
Figure 8. The proposed mechanisms of adsorption of (a) paracetamol, (b) ketorolac, (c) tetracycline and (d) atenolol on AcBC-800.
Processes 12 02149 g008
Figure 9. Adsorption isotherms for drug adsorption on AcBC-800 sample fitted using the Langmuir–Freundlich model.
Processes 12 02149 g009
Table 1. Position and full width at half maximum (FWHM) values for D and G bands and their intensity ratio for three biochar samples.
SampleD BandG BandID/IG
Position (cm−1)FWHM (cm−1)AreaPosition (cm−1)FWHM (cm−1)AreaArea Ratio
BC-5001376181123159683851.4
AcBC-8001357180175160779772.3
Table 2. PSO adsorption kinetics-derived parameters.
Derived PSO ParametersAtenololTetracyclineParacetamolKetorolac
qe (mg g−1)46.2 ± 0.275.3 ± 0.588.0 ± 0.4113.4 ± 0.7
k2 (min−1)0.88 ± 0.050.113 ± 0.0070.16 ± 0.010.150 ± 0.009
Adj. R-Square0.980.980.970.97
Table 3. Derived adsorption isotherm parameters for drugs adsorption on AcBC-800 sample.
Derived LF ParametersTetracyclineParacetamolAtenololKetorolac
qm (mg g−1)210 ± 60160 ± 3060.1 ± 0.7160 ± 20
KLF (L mg−1)1/n0.10 ± 0.020.36 ± 0.050.03 ± 0.020.64 ± 0.09
1/n0.6 ± 0.20.39± 0.081.9 ± 0.30.40 ± 0.08
R-Square (COD)0.980.990.970.97
Adj. R-Square0.970.980.960.97
Disclaimer/Publisher’s Note: The statements, opinions and data contained in all publications are solely those of the individual author(s) and contributor(s) and not of MDPI and/or the editor(s). MDPI and/or the editor(s) disclaim responsibility for any injury to people or property resulting from any ideas, methods, instructions or products referred to in the content.

