Article

Kombucha Fermentation in Coffee: Application of Constant Air Flow Reactor

Faculty of Chemical Technology and Engineering, Bydgoszcz University of Science and Technology, Seminaryjna 3, 85-326 Bydgoszcz, Poland
*
Authors to whom correspondence should be addressed.
Processes 2024, 12(10), 2159; https://doi.org/10.3390/pr12102159
Submission received: 4 September 2024 / Revised: 27 September 2024 / Accepted: 30 September 2024 / Published: 3 October 2024
(This article belongs to the Special Issue Microbiotechnology in Cosmetics, Pharmaceuticals and Food)

Abstract

:
SCOBY (symbiotic culture of bacteria and yeasts) is an artificially created mixed culture containing selected strains of acetic acid and lactic acid bacteria and yeast which are present in the cellulose membrane. The growing popularity of kombucha consumption and high popularity of coffee creates the possibility of developing coffee-based kombucha production on an industrial scale, which currently does not differ in method from production on a laboratory scale and at home. Therefore, the aim of this work was to determine the possibility of using an alternative method of coffee fermentation using SCOBY, in which the fermentation was carried out in a bioreactor with a constant air flow (rate 2L/min). This study determined the effect of the fermentation method on the processing time, SCOBY mass gain, and selected properties of the fermented coffee beverage. The alternative fermentation method did not negatively affect the properties of the fermented coffee beverage, i.e., caffeine content, colour, polyphenol content, and antioxidant properties, in comparison with the traditional fermentation method. Additionally, it accelerated the fermentation process, shortening it from 8 to 4 days, and in some cases caused an increase in the total polyphenol content and antioxidant activity, almost 10% and over 40%, respectively. The results of this study show a possibility to use alternative methods for coffee fermentation, which can be easily adapted for industrial scale. Variants of fermented and aerated beverages with 4% coffee, and 4 and 5% sugar concentrations stood out among the others as having the best properties and might be introduced to the industry.

1. Introduction

Symbiotic culture of bacteria and yeasts (SCOBY) is an artificially created mixed culture containing selected strains of acetic acid (AAB) and lactic acid (LAB) bacteria and yeast which are present in the cellulose membrane [1]. SCOBY comes from East Asia, where it has been known since 220 B.C. and was brought to Europe from eastern Siberia [2,3,4]. The exact composition and proportions of the culture in SCOBY are not known, which results from, among others, the region of the world and the cultivation conditions, the initial composition of the culture and the composition of the culture medium. Additionally, as a result of changes in the activity of the microorganisms constituting the culture, and thus changes in the concentration of secondary metabolites produced by SCOBY, it is possible that other strains, for which the composition of the medium at a given time is more favourable, temporarily predominate [3,5].
Kombucha is the name of a beverage produced by fermentation of SCOBY, tea (infusion), most often black, green, oolong or their mixture, and sugar [2,6,7,8]. This healthy beverage contains organic acids, vitamins, polyphenols, amino acids, hydrolytic enzymes, sugars, lipids, antibiotic substances, carbon dioxide, microelements, and alcohol residues [2,9,10]. The composition of bioactive compounds and the resulting biological activities are dependent on the type of tea; however, it is not yet explained how the type of tea influences the time of fermentation by specific strains of SCOBY [5,11]. In the chemical composition of metabolites present in kombucha, researchers confirmed induction of synthesis of vitamin C, B vitamins, and folic acid during the fermentation process. The organic acids in the beverage, produced during fermentation, include acetic, glucuronic, gluconic, lactic, malic, citric, malonic, oxalic, and succinic acids. Mineral components present in fermented tea are mainly copper, manganese, nickel, zinc, and iron [12,13,14]. The chemical composition determines bioactive properties of kombucha. Kombucha’s health benefits have not been substantiated by direct scientific evidence, yet some research suggests potential effects on various health conditions, including high blood pressure and cancer. There is a large database of results proving the potential beneficial properties of kombucha, such as anti-diabetic effects, anti-carcinogenic effects, anti-inflammatory, antioxidant, and anti-bacterial activity, as well as improvements to liver function, the immune system, gastrointestinal function, and gastric ulcer treatment [15,16].
Although the main substrate for the production of kombucha is tea, in recent years, scientific research has proven the possibility of using other raw materials for the production of fermented beverages. They included, in particular, infusions from coffee, herbs, leaves (e.g., rooibos, guava, oak), fruits, vegetables, juices, and milk, as well as by-products and waste from the agri-food industry (e.g., extracts from fruit peels or soybean whey). Additionally, due to its high efficiency, SCOBY is a good material for cellulose production [1,17,18].
For the production of kombucha, both at home and on an industrial scale, a simple fermentation method is used, in which a 0.5–0.7% tea leaf extract is prepared (with the temperature and extraction time depending on the type of tea used). Next, the prepared extract is filtered and sweetened, usually with sugar, creating a 5–20% solution. After cooling to a temperature of 20 °C, the SCOBY (3–5%) and sour broth (fermented water–sugar mixture for storage of the SCOBY (0.2–2.5%)) are added. Fermentation is carried out in aerobic conditions for 6–14 days at a temperature of 18–30 °C [3,5,19]. During the fermentation, new layers of biofilm are grown on the added SCOBY, which results in increasing thickness and weight gain.
The growing popularity of kombucha and interest in other beverages fermented using SCOBY creates an opportunity to develop the fermentation method itself. Therefore, the aim of this work was to determine the possibility of using an alternative method of coffee fermentation using SCOBY, in which the fermentation was carried out in a bioreactor with a constant air flow. This study determined the effect of the fermentation method on the processing time, SCOBY mass gain, and selected properties of the fermented coffee beverage.

2. Materials and Methods

2.1. Materials

The following ingredients were used to prepare the beverage: drinking water provided by a local water plant (source: Czyżkówko, Bydgoszcz, Poland), coffee beans, SCOBY, and sugar. The coffee beans used to prepare the coffee were 100% medium-roasted Arabica (Tchibo, Hamburg, Germany). Coffee beans were purchased from a local store in Bydgoszcz, Poland. Beet sugar (sucrose) was also purchased from a local store in Bydgoszcz, Poland. SCOBY was obtained from a local producer of kombucha (Białe Błota, near Bydgoszcz, Poland). SCOBY was grown in sour broth and stored at room temperature.

2.2. Methods

2.2.1. Fermented Coffee Preparation

To obtain fermented coffee beverages the coffee was brewed in a drip coffee maker equipped with a knife grinder (Chester Grind & Brew 22000-56, Russell Hobbs, Failsworth, UK). After brewing, the coffee was chilled to room temperature and then the SCOBY (5% m/v) and sour broth (2.5% v/v) were added to the fresh coffee infusions. Sour broth was added to lower the pH and accelerate the fermentation process. Two different concentrations of coffee were used as a fermentation medium (4 and 6%) with three different sugar concentrations each (5, 6, and 7%). Additionally, two different methods of fermentation were used. One, traditional, in which inoculated coffee was fermented in beakers [6]. Two, a novel alternative where coffee drinks were fermented in a bioreactor with a constant flow of air (Figure 1). In both methods, the temperature of fermentation was set to 30 °C. Preliminary studies (data not included) have shown that the appropriate time to obtain fermented coffee with desired properties (fermentation completed—pH below 4.3 and SCOBY mass gain <10%) for traditional fermentation is 8 days, while for fermentation carried out in a bioreactor with aeration is 4 days. All experiments were conducted on the last day of fermentation with the exception of pH and refractometric analysis, which were conducted every day of fermentation. For the proper conduct of the study, the fermentation was conducted three times.

2.2.2. Change in SCOBY Mass

Before and after the fermentation, the SCOBY was weighed using a balance (Adventurer Pro, OHAUS, Parsippany, NJ, USA). Based on the weights, the SCOBY mass increase during fermentation was calculated.

2.2.3. Particle Size Determination

After grinding and brewing, spent coffee was dried in a laboratory dryer (SLW 115, POL-EKO, Wodzisław Śląski, Poland) for 5 h at 105 °C. Then, dried spent coffee was subjected to particle size analysis using a vibratory sieve shaker (Analysette 3 PRO, Fritsch, Idar-Oberstein, Germany) to determine the repeatability of the degree of grinding obtained in the drip coffee maker. Woven sieves with mesh sizes of 2500, 1250, 800, 400, 125, 71, 36, and <36 μm were used for the analysis. Shaking was carried out for 3 min at an amplitude of 2 mm. Based on the results, D50 was calculated. The D50 of samples ranged from 0.22 to 0.24 mm, which confirmed grinding repeatability. No statistically significant differences in grinding led to the conclusion that preparing the coffee has not impacted the beverages’ properties, since ground coffee beans were the same size.

2.2.4. pH Determination

The pH of the coffee during fermentation was analysed daily using a pH meter (SevenCompact S210, Mettler Toledo, Greifensee, Switzerland).

2.2.5. TSS Analysis

The total soluble solids (TSS) of the coffee during fermentation was analysed daily using an automatic refractometer (J257, Rudolf, NJ, USA). The TSS content of beverage variants was determined by the index of refraction. The TSS was presented as °BRIX, knowing the relationship between refractive indices at 20 °C and the percentage by mass of total soluble solids of a pure aqueous sucrose solution.

2.2.6. Determination of Bioactive Compounds

Determination of Concentration of Total Phenolic Compounds in Fermented Coffee Beverage

To determine the total phenolic content in beverages, the Folin–Ciocalteu method was used [20], modified by Szulc et al. [21] and adjusted for liquid samples. Samples were centrifuged in a laboratory centrifuge at 3000 rpm for 2 min to remove suspended solids, mainly SCOBY residues and coffee bean particles (Rotina 380 Hettich, Kirchlengern, Germany). A total of 1 mL of supernatant was transferred to a test tube and the other reactants were added as described by Szulc et al. [21]. The content of total phenolic compounds was expressed as mg of gallic acid equivalent (mg GAE) per 100 mL of sample, based on the standard curve.

Determination of Antioxidant Activity in Fermented Coffee Beverage

To determine the antioxidant activity of beverages, a modified method described by Brand-Williams et al. [22] using a synthetic DPPH radical—2,2-diphenyl-1-picrylhydrazyl—was used. Samples were centrifuged in a laboratory centrifuge at 3000 rpm for 2 min to remove suspended solids (Rotina 380 Hettich, Kirchlengern, Germany). A total of 1 mL of supernatant was transferred to a test tube and the other reactants were added as described by Hejna et al. [23].

Determination of Caffeine Concentration in Fermented Coffee Beverage

To determine the caffeine concentration in beverages, a modified spectrophotometric analysis with chloroform extraction was used [24]. First, samples were centrifuged in a laboratory centrifuge at 3000 rpm for 2 min to remove suspended solids (Rotina 380 Hettich, Kirchlengern, Germany). A total of 5 mL of supernatant was transferred to a test tube, to which 5 mL of chloroform and 1 mL of 20% Na2CO3 solution were added. Next, the sample was vortexed for two minutes (LLG-uniTEXER 1 LLG-Labware, Meckenheim, Germany). Then, 0.1 mL of the precipitated chloroform layer was transferred to the test tube containing 5 mL of chloroform and mixed. Finally, the absorbance of the sample was measured at 247 nm using a quartz cuvette (HP/Agilent 8453 UV/Vis Spectrophotometer, Santa Clara, CA, USA). The total content of caffeine was expressed in PPM, based on the standard curve.

2.2.7. Colorimetric Measurements

The colour of the fermented coffee beverage was assessed according to the guidelines of the Commission Internationale de l’Eclairage (CIE) by measuring the L* a* b* colour coordinates. A beverage sample of volume approximately 100 mL was transferred to a measurement dish. L* (brightness), a* (red–green), and b* (yellow–blue) were recorded using a colorimetric spectrophotometer (Chroma Meter CR-410, Tokyo, Japan) where an illuminant and a reference angle were D65 and 2°, respectively. The total colour difference (ΔE) was calculated as follows [25]:
E = L * 2 + a * 2   + b * 2 1 2
The determined colour parameters in the CIELAB system were converted to the RGB colour model as described by Hejna et al. [23]. Converting to the RGB colour model allowed to present colours of analysed samples.

2.2.8. Microbial Analysis

To determine the total number of aerobic mesophilic bacteria according to PN-EN ISO 4833-1:2013-12 [26], 1 mL of the beverage was collected and poured into 9 mL of peptone water after which a decimal dilution series was performed. Duplicate plates with nutrient broth (BIOCORP, Warsaw, Poland) were counted after incubation at 37 ± 1 °C for 24–48 h.

2.2.9. Statistical Analysis

The presented results of chemical and physical properties are the average of three repetitions for three fermentations. Averages are presented as values with standard deviation (average ± SD). A one-way variance analysis ANOVA was used to evaluate significant statistical differences in parameters. The comparison of averages was performed using the Student’s t-test. Statistical calculations were performed in Statistica 13. Significance was defined as p < 0.05.

3. Results and Discussion

3.1. Change in SCOBY Mass

In each of the analysed variants (abbreviations listed in Table 1), the SCOBY mass increased as a result of fermentation (Table 2). The key factors for the mass increase were both the sugar and coffee concentration and the fermentation method. The greatest mass increase was observed for samples with a lower coffee concentration (Table 3). Due to its chemical composition, coffee has antimicrobial properties [27]. Increasing the concentration of the coffee up to 6% increased the concentration of compounds that have an antagonistic effect on microorganisms, thereby limiting the development of SCOBY microflora. For coffee fermented using the traditional method (with 4% coffee concentration), the increase in SCOBY mass was greater with the higher concentration of sugar used. On the other hand, during the fermentation using the traditional method (with 6% coffee concentration) and fermentation using the bioreactor (with both coffee concentrations), the largest increase was observed for the variant with a 6% sugar addition. Sugar is the main nutrient for the cultures creating SCOBY; therefore, increasing its concentration is one of the basic factors enabling the fermentation process. Therefore, with increasing sugar concentration, an increase in SCOBY mass, cellulose content, and other secondary metabolites resulting from the development of SCOBY microflora can be expected [28,29].
In the case of coffee fermented in the bioreactor, the SCOBY mass increase for coffee containing the lowest sugar concentration (5%) was comparable to the mass increase for coffee fermented using the traditional method but containing 6% added sugar. Taking into account the shortened fermentation time of 4 days, the mass increase occurred much faster, but in none of the variants was it as significant as for coffee T3.4.

3.2. pH Determination
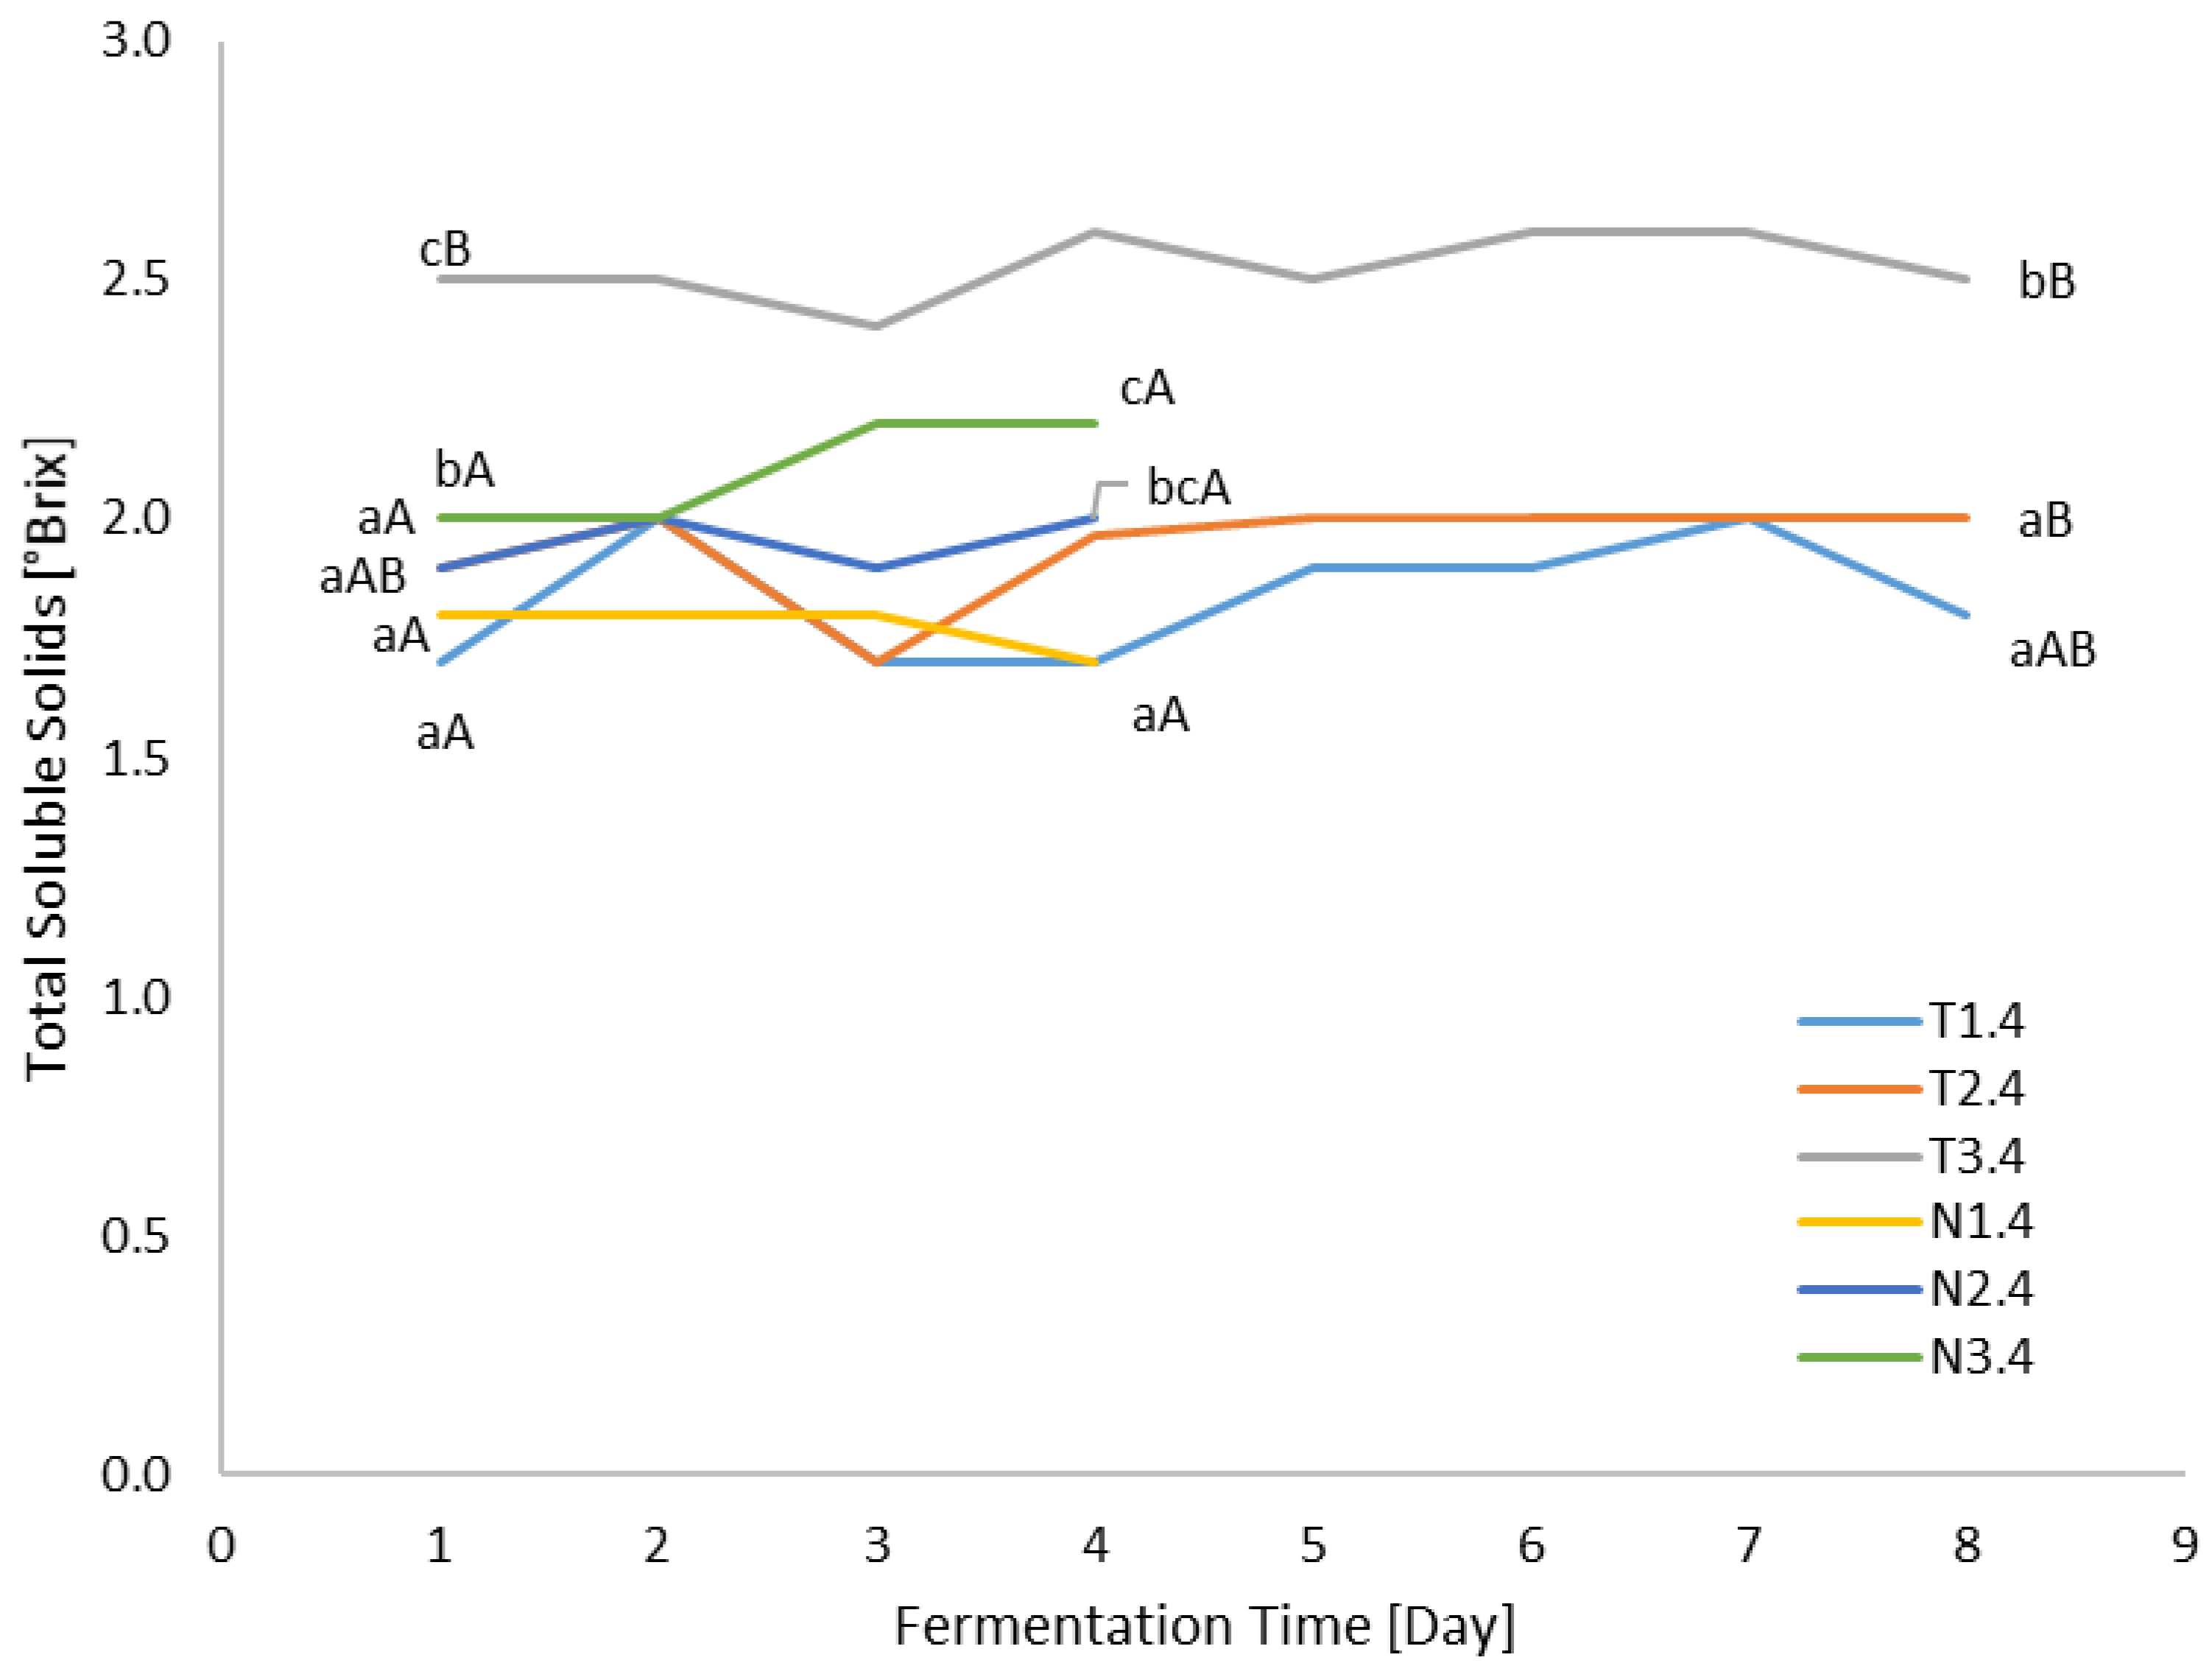
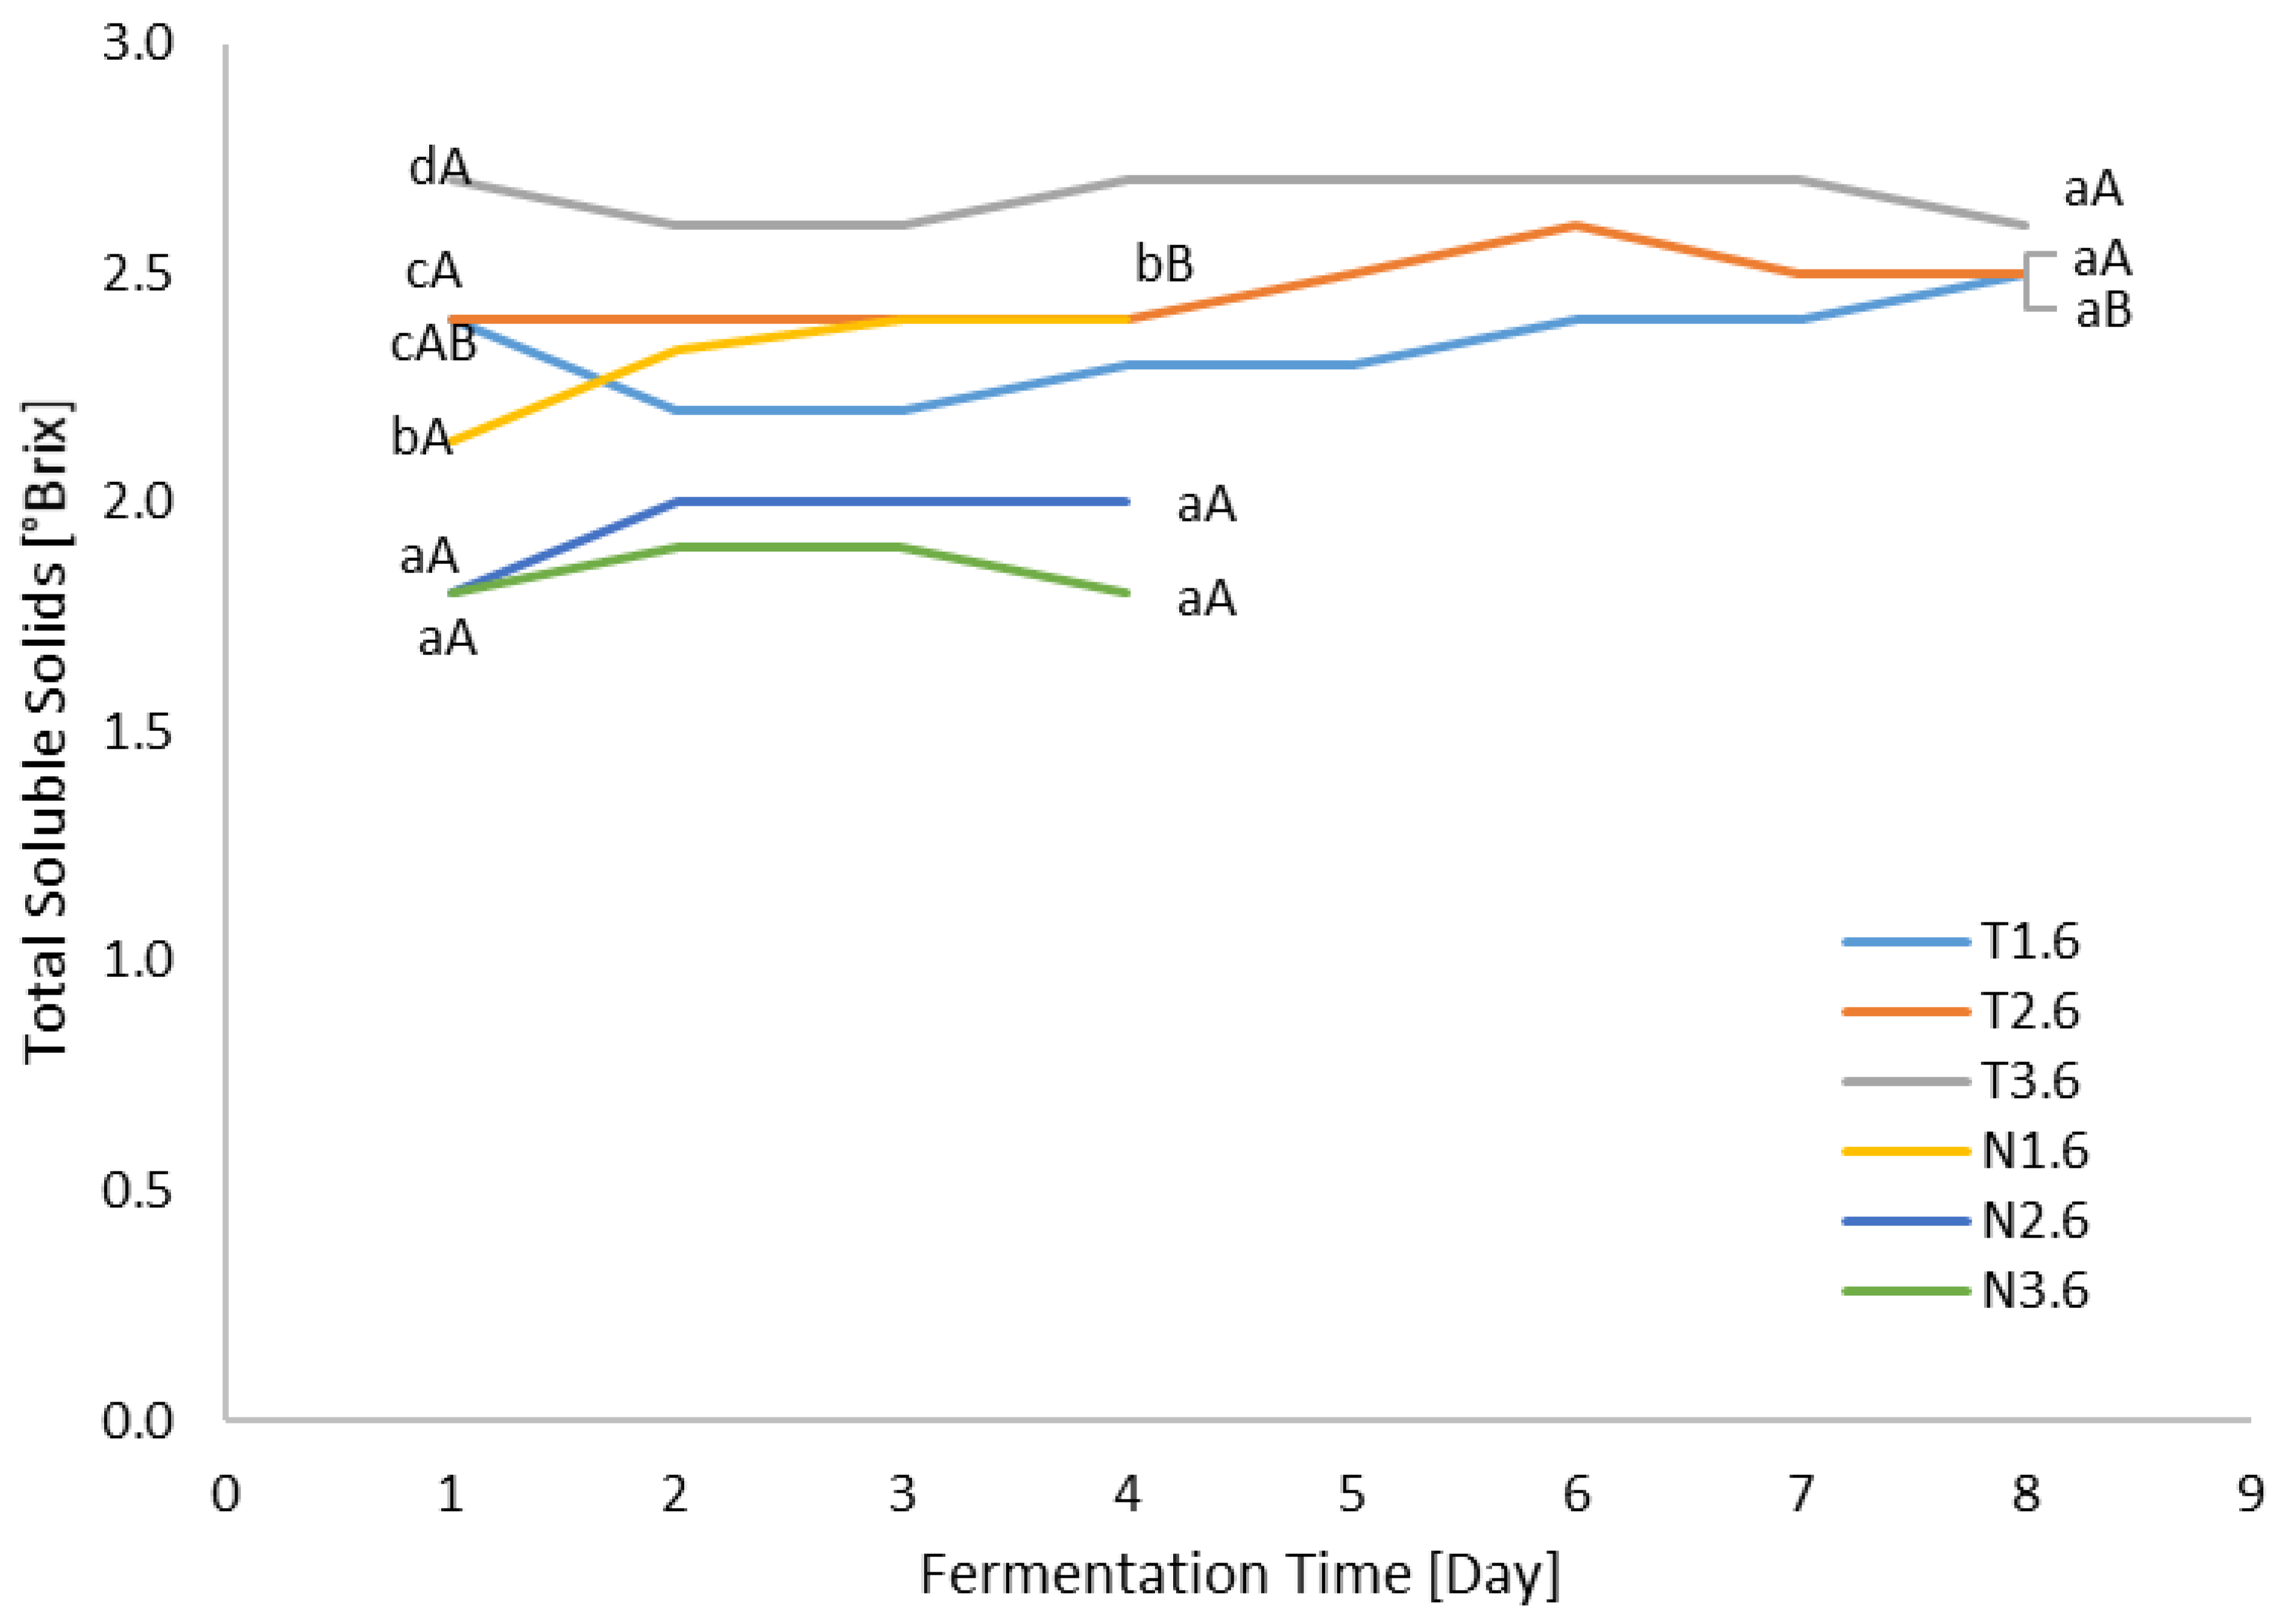
In both fermented coffee variants (4 and 6% of coffee), final pH values (analysed at the last day of fermentation) were lower than the initial pH (Figure 2 and Figure 3, Table S1). The most rapid pH decrease was observed for samples fermented in the bioreactor, when coffee was aerated. In their case, the lowest pH was reached on the second day of fermentation. For T3.4, T2.6, and T3.6 samples, the lowest pH was obtained on the fourth day of fermentation and then slightly increased. For the remaining samples, the pH increased periodically, and their lowest value was reached on the last day of fermentation. The final pH reached values between approximately 3.9 and 4.2. This property depends on many factors and has different values, which are influenced by the type of raw material, sugar concentration, or microbiological composition of SCOBY. Depending on added juices and spices, kombucha was characterised with a pH ranging from 3.2 to 3.9 [30]. Similar pH values of fermented coffee were obtained by de Miranda et al. [31], but those demonstrated by Watawana et al. [32], who used different types of coffee for coffee kombucha, were lower. At the same time, the pH value did not decrease below 3, reaching the desired and acceptable range due to the pH of the digestive system [14]. The change in the pH of beverages is a typical phenomenon observed during fermentation where a range of organic acids are produced. The content of organic acids is the main factor affecting the flavour and aroma profile of kombucha. Their composition is largely dependent on the type of SCOBY microflora. The most frequently detected acids in kombucha are acetic, gluconic, and lactic acid. However, due to its characteristic, harsh taste, an excess of acetic acid negatively affects the sensory quality of the product [33].

3.3. TSS Analysis

In all samples tested, the change in TSS was slight, periodically increasing and decreasing (Figure 4 and Figure 5, Table S2). TSS mainly corresponds to the content of sugars and organic acids. During fermentation, yeast contained in the SCOBY decomposes sucrose into glucose and fructose, metabolising them to ethyl alcohol. Acetic acid bacteria use ethyl alcohol to produce acetic acid, while glucose is used to produce glucuronic acid and bacterial cellulose [31]. Due to the continuous decrease in the sugar content serving as a nutrient for the SCOBY microflora and the increase in the concentration of yeast and bacterial metabolites, the change in TSS in the case of fermented coffee beverages is not a clear indicator of the change in sugar content. The coffee and sugar concentration and fermentation method impact TSS. As expected, higher content of sucrose and coffee increased the amount of the total soluble solids. TSS is a property that differs depending on the raw material. Adding flavour influences TSS. Wang et al. [30] reported that depending on the country of origin and flavour, kombucha beverages were characterised with TSS values in the range from 1.87 to 7.00 Brix.

3.4. Determination of Bioactive Compounds

In the case of fermented coffee beverages prepared from 4% coffee infusions, the aeration during the fermentation process caused a statistically significant increase in polyphenol concentration in comparison to the traditional process of obtaining kombucha (Table 4). During 4 days of fermentation, the greatest increase was achieved by samples fermented in the bioreactor. Beverages N1.4 and N2.4 were characterised by a 50% increase in polyphenol concentration in comparison to raw coffee. Fermenting coffee using the traditional method for up to 8 days resulted in a further increase in polyphenol content, which was not always statistically significant. On the other hand, increasing the coffee concentration to 6% resulted in a decrease in the polyphenol concentration in all samples fermented for 4 days and a slight increase for samples T2.6 and T3.6, fermented for 8 days (Table 4). The increase in polyphenol concentration during fermentation using SCOBY resulted from their production by microflora as secondary metabolites. This is a natural phenomenon, beneficial from a nutritional point of view [32,34,35]. Antioxidant compounds, which include polyphenols, constitute an important group of chemicals with potentially health-promoting properties by reducing free radical activity. At the same time, their biosynthesis depends on many factors, including the composition of kombucha, fermentation conditions (time and temperature), and the microbial concentration in the SCOBY. Therefore, the increase in coffee concentration probably impacted microbial metabolic pathways resulting in decreasing the rate of polyphenol biosynthesis, which can also be connected to a lower number of bacteria (data presented in paragraph 3.6). This is partly consistent with the observed change in SCOBY mass upon fermentation. Calculation of the correlation coefficient for SCOBY mass gain versus coffee concentration and sugar concentration showed a strong negative correlation of −0.91 when mass gain and coffee concentration were compared, and a weak correlation of <0.2 when it comes to sugar concentration and its effect on SCOBY mass.
In the case of the 4% fermented coffee, each of the analysed fermentation variants resulted in more than a two-fold increase in the DPPH* scavenging capacity (Table 5). In the case of measurement after 4 days of fermentation, the highest value was achieved by sample N1.4 (over 37%). Extending the fermentation of coffees T1.4–T3.4 resulted in a statistically significant increase in the degree of inhibition, with the highest for coffee T3.4 being more than four times greater than for the control sample. Increasing the coffee concentration to 6% resulted in a significant increase in the DPPH * scavenging capacity for the control sample. On the 4th day of measurement, a significant increase was observed for samples T1.6 and N1.6–N3.6. For sample N2.6, it was over 1.5 times higher than for the control sample. In the case of samples T2.6 and T3.6, a decrease in antioxidant activity was observed. Extending the fermentation time to 8 days resulted in an increase in the parameter only for sample T3.6 with the higher sugar concentration, while the values for the remaining samples decreased. An increase in antioxidant activity was observed in the fermentation of both coffee and tea infusions [36,37,38,39]. Fermentation and the accompanying growth of microorganisms, and thus the activation of metabolic pathways responsible for the biosynthesis of secondary metabolites, often of antioxidant nature, is a factor that causes an increase in the antioxidant activity of fermented products compared to their non-fermented analogues. In addition to food preservation resulting from the increase in the concentration of organic acids, this is a factor thanks to which fermentation is a frequently used and very beneficial process for food processing.
In the case of the 6% coffee, the increase in DPPH * scavenging capacity for coffee fermented in the bioreactor is particularly interesting. In the case of these fermented coffee beverages, the total polyphenol content decreased. This means that the use of the bioreactor and the increase in coffee concentration probably resulted in the activation of metabolic pathways leading to the biosynthesis of antioxidant compounds other than those from the phenol group.
The coffee fermentation process using SCOBY did not statistically significantly affect the caffeine concentration (Table 6). Coffee is one of the most consumed beverages in the world. The main reason for consuming coffee is the presence of caffeine, which stimulates the central nervous system, increases blood pressure, wakefulness, and metabolic rate [40]. In the USA, Australia, New Zealand, and Asian and European countries, coffee is the main daily source of caffeine [41]. In accordance with the state of maximum caffeine intake adopted by the EFSA (European Food Safety Authority), for adults it is up to 400 mg per day and 3 mg/kg bw per day for children and adolescents [42]. For pregnant women, maximum daily intake levels of caffeine were set at 200 mg per day. Considering the advantage of coffee over other beverages as sources of caffeine and the frequency of its consumption, introducing a product with a caffeine content similar to coffee and additionally enriched with health-promoting compounds, such as fermented coffee, may be very beneficial for the world’s population.

3.5. Colourimetric Measurements

For all analysed samples, the use of fermentation with SCOBY resulted in an increase in colour coordinates in the CIELab system (Table 7). The increase in the L* coordinate is typical for tea kombucha and results from the microbial transformation of polyphenols [32]. However, due to the progressive polymerization of phenolic compounds to form brown-coloured macromolecular products, it is possible to darken the beverage and thus reduce the L* value, which was observed by Watawana et al. [32] and de Miranda et al. [31]. Nevertheless, the colour difference (ΔE) between each of the analysed samples indicated similar colour properties to unfermented coffee, due to a ΔE below 2.5 (Table 8), where values of ΔE < 1.0 indicates differences impossible to be seen, 1 < ΔE < 2 indicates differences seen only by an experienced observer, 2 < ΔE < 3.5 indicates differences seen by an observer without experience, 3.5 < ΔE < 5 indicates distinct differences in sample colours, and values of ΔE above 5 mean two different colours [43]. It can be expected that such changes in colour samples (unseen or slightly different) will not confuse consumers, who expect fermented coffee beverages with a colour characteristic of regular coffee.

3.6. Microbial Analysis

The total number of microorganisms in fermented coffee differs depending on coffee and sugar concentrations and the fermentation method. The higher the sugar concentration, the higher the number of bacteria. The samples of traditionally fermented coffee presented populations of bacteria ranging from 106 to 109 CFU/mL, while the novel aerated method of fermentation caused a decrease in the number of psychrophilic bacteria compared to the traditional method and the total number of bacteria ranged from 103 to 105 CFU/mL (Table 9). Many studies showed that the fermentation of tea with SCOBY increases the total concentration of bacteria and yeast to 106 –1010 CFU/mL [9,30,44]. It was expected that the novel method of fermentation will not change or increase the total microbial concentration due to scientific reports that demonstrated intensification of growth rate of bacteria and yeast when the medium was aerated [45]. Even though the number of bacteria in the aerated fermented coffee decreased compared to the traditionally obtained beverages, the SCOBY mass increase was higher during fermentation when air was supplied (Table 4.) The mass gain is connected with cellulose synthesis by bacteria, and strains that are responsible for cellulose production are strict aerobes. Therefore, the presence of oxygen dissolved in coffee, with a higher concentration when aerated, has an impact on the biosynthesis of this polymer [46].

4. Conclusions

The use of a bioreactor with constant air flow for coffee fermentation with SCOBY did not negatively affect the particular properties of the final product, maintaining both pH and TSS at a level similar to the traditional fermentation method. The aeration caused a decrease in the total number of microorganisms in comparison to traditional fermentation variants. Still, some variants obtained in the bioreactor presented microorganism concentrations in the range characteristic for classic kombucha beverages. Using the bioreactor accelerated the fermentation process, shortening its time from 8 to 4 days, and in some cases caused an increase in the total polyphenol content and antioxidant activity. The colour difference (ΔE) between the samples indicated similar colour properties to unfermented coffee, so consumers will not recognize differences in the appearance of the beverages. Preliminary sensory tests (data not included) showed similar sensory quality (in terms of taste, smell, and overall acceptance) between traditionally fermented coffee and the one obtained using the novel method. Variants of fermented beverages with 4% coffee, and 4 and 5% sugar concentrations, which were aerated during the process, stood out among the others as having the best properties and might be introduced to the industry. The present study showed that SCOBY-fermented coffee can become a great alternative with health-beneficial properties to very popular regular coffee. Also, the results show a possibility to use a novel alternative method for coffee fermentation which can be easily adapted to an industrial scale to provide fermentation of other beverages as well.

Supplementary Materials

The following supporting information can be downloaded at https://www.mdpi.com/article/10.3390/pr12102159/s1: Table S1: pH change during the coffee fermentation; Table S2: TSS change during the coffee fermentation.

Author Contributions

Conceptualization, B.B, P.D., P.S., J.S. and G.G.; methodology, B.B., P.D., P.S., G.G. and J.S., validation, M.C., P.D. and P.S.; formal analysis, G.G. and M.C.; investigation, B.B., P.D., P.S., B.M., D.B., K.F., K.W., M.Ś., J.Z., M.B. and J.S.; resources, B.B. and J.S.; data curation, B.B.; writing—original draft preparation, B.B., J.S., K.W. and J.Z.; writing—review and editing, M.C., G.G., J.S. and B.B.; visualization, J.S. and B.B.; supervision, G.G.; project administration, B.B.; funding acquisition, B.B. and J.S. All authors have read and agreed to the published version of the manuscript.

Funding

This research was funded by the Ministry of Education and Science. Subvention BN-WTiICh-6/2022. This paper was prepared using the apparatus purchased within the framework of the “Imple-mentation of the second stage of the Regional Innovation Center” project, co-financed using funds from the European Regional Development Fund for Operational Program of the Kuyavi-an-Pomeranian Voivodeship for the years 2007–2013.

Data Availability Statement

The authors declare that all data supporting the findings of this study are available within the article.

Conflicts of Interest

The authors declare no conflicts of interest.

References

  1. Aung, T.; Kim, M.J. A Comprehensive Review on Kombucha Biofilms: A Promising Candidate for Sustainable Food Product Development. Trends Food Sci. Technol. 2024, 144, 104325. [Google Scholar] [CrossRef]
  2. Jakubczyk, K.J.P.; Piotrowska, G.; Janda, K. Characteristics and Biochemical Composition of Kombucha—Fermented Tea. Med. Og. Nauk. Zdr. 2020, 26, 94–96. [Google Scholar] [CrossRef]
  3. Soares, M.G.; de Lima, M.; Reolon Schmidt, V.C. Technological Aspects of Kombucha, Its Applications and the Symbiotic Culture (SCOBY), and Extraction of Compounds of Interest: A Literature Review. Trends Food Sci. Technol. 2021, 110, 539–550. [Google Scholar] [CrossRef]
  4. Kapp, J.M.; Sumner, W. Kombucha: A Systematic Review of the Empirical Evidence of Human Health Benefit. Ann. Epidemiol. 2019, 30, 66–70. [Google Scholar] [CrossRef]
  5. Antolak, H.; Piechota, D.; Kucharska, A. Kombucha Tea—A Double Power of Bioactive Compounds from Tea and Symbiotic Culture of Bacteria and Yeasts (SCOBY). Antioxidants 2021, 10, 1541. [Google Scholar] [CrossRef] [PubMed]
  6. Jakubczyk, K.; Kałduńska, J.; Kochman, J.; Janda, K. Chemical Profile and Antioxidant Activity of the Kombucha Beverage Derived from White, Green, Black and Red Tea. Antioxidants 2020, 9, 447. [Google Scholar] [CrossRef]
  7. Su, X.; Duan, J.; Jiang, Y.; Duan, X.; Chen, F. Polyphenolic Profile and Antioxidant Activities of Oolong Tea Infusion under Various Steeping Conditions. Int. J. Mol. Sci. 2007, 8, 1196–1205. [Google Scholar] [CrossRef]
  8. Gaggìa, F.; Baffoni, L.; Galiano, M.; Nielsen, D.S.; Jakobsen, R.R.; Castro-Mejía, J.L.; Bosi, S.; Truzzi, F.; Musumeci, F.; Dinelli, G.; et al. Kombucha Beverage from Green, Black and Rooibos Teas: A Comparative Study Looking at Microbiology, Chemistry and Antioxidant Activity. Nutrients 2019, 11, 1. [Google Scholar] [CrossRef]
  9. Neffe-Skocińska, K.; Sionek, B.; Ścibisz, I.; Kołożyn-Krajewska, D. Acid Contents and the Effect of Fermentation Condition of Kombucha Tea Beverages on Physicochemical, Microbiological and Sensory Properties. CyTA J. Food 2017, 15, 601–607. [Google Scholar] [CrossRef]
  10. Içen, H.; Corbo, M.R.; Sinigaglia, M.; Korkmaz, B.I.O.; Bevilacqua, A. Microbiology and Antimicrobial Effects of Kombucha, a Short Overview. Food Biosci. 2023, 56, 103270. [Google Scholar] [CrossRef]
  11. Bishop, P.; Pitts, E.R.; Budner, D.; Thompson-Witrick, K.A. Chemical Composition of Kombucha. Beverages 2022, 8, 45. [Google Scholar] [CrossRef]
  12. Jayabalan, R.; Malbaša, R.V.; Sathishkumar, M. Kombucha Tea: Metabolites. In Fungal Metabolites; Mérillon, J.-M., Ramawat, K.G., Eds.; Springer International Publishing: Cham, Switzerland, 2017; pp. 965–978. ISBN 978-3-319-25001-4. [Google Scholar]
  13. Coelho, R.M.D.; de Almeida, A.L.; do Amaral, R.Q.G.; da Mota, R.N.; de Sousa, P.H.M. Kombucha: Review. Int. J. Gastron. Food Sci. 2020, 22, 100272. [Google Scholar] [CrossRef]
  14. Villarreal-Soto, S.A.; Beaufort, S.; Bouajila, J.; Souchard, J.-P.; Taillandier, P. Understanding Kombucha Tea Fermentation: A Review. J. Food Sci. 2018, 83, 580–588. [Google Scholar] [CrossRef] [PubMed]
  15. Batista, P.; Penas, M.R.; Pintado, M.; Oliveira-Silva, P. Kombucha: Perceptions and Future Prospects. Foods 2022, 11, 1977. [Google Scholar] [CrossRef] [PubMed]
  16. Dufresne, C.; Farnworth, E. Tea, Kombucha, and Health: A Review. Food Res. Int. 2000, 33, 409–421. [Google Scholar] [CrossRef]
  17. Emiljanowicz, K.E.; Malinowska-Pańczyk, E. Kombucha from Alternative Raw Materials—The Review. Crit. Rev. Food Sci. Nutr. 2020, 60, 3185–3194. [Google Scholar] [CrossRef]
  18. Morales, D.; Gutiérrez-Pensado, R.; Bravo, F.I.; Muguerza, B. Novel Kombucha Beverages with Antioxidant Activity Based on Fruits as Alternative Substrates. LWT 2023, 189, 115482. [Google Scholar] [CrossRef]
  19. Laavanya, D.; Shirkole, S.; Balasubramanian, P. Current Challenges, Applications and Future Perspectives of SCOBY Cellulose of Kombucha Fermentation. J. Clean. Prod. 2021, 295, 126454. [Google Scholar] [CrossRef]
  20. Singleton, V.L.; Rossi, J.A. Colorimetry of Total Phenolics with Phosphomolybdic-Phosphotungstic Acid Reagents. Am. J. Enol. Vitic. 1965, 16, 144–158. [Google Scholar] [CrossRef]
  21. Szulc, J.; Czaczyk, K.; Dobrowolska, A.; Gozdecka, G.; Błaszak, B. Elicitation as a Process of Enhancing Bioactive Compounds Concentration in Sprouts. Processes 2024, 12, 174. [Google Scholar] [CrossRef]
  22. Brand-Williams, W.; Cuvelier, M.E.; Berset, C. Use of a Free Radical Method to Evaluate Antioxidant Activity. LWT Food Sci. Technol. 1995, 28, 25–30. [Google Scholar] [CrossRef]
  23. Hejna, A.; Barczewski, M.; Skórczewska, K.; Szulc, J.; Chmielnicki, B.; Korol, J.; Formela, K. Sustainable Upcycling of Brewers’ Spent Grain by Thermo-Mechanical Treatment in Twin-Screw Extruder. J. Clean. Prod. 2021, 285, 124839. [Google Scholar] [CrossRef]
  24. Vuletic, N.; Bardic, L.; Odzak, R. Spectrophotometric Determining of Caffeine Content in the Selection of Teas, Soft and Energy Drinks Available on the Croatian Market. Food Res. 2021, 5, 325–330. [Google Scholar] [CrossRef]
  25. Cytarska, J.; Szulc, J.; Kołodziej-Sobczak, D.; Nunes, J.A.; da Silva-Júnior, E.F.; Łączkowski, K.Z. CyreneTM as a Tyrosinase Inhibitor and Anti-Browning Agent. Food Chem. 2024, 442, 138430. [Google Scholar] [CrossRef] [PubMed]
  26. PN-EN ISO 4833-1:2013-12; Microbiology of the Food Chain Horizontal Method for the Enumeration of Microorganisms Part 1: Colony Count at 30 °C by the Pour Plate Technique. ISO: Geneva, Switzerland, 2013.
  27. Martínez-Tomé, M.; Jiménez-Monreal, A.M.; García-Jiménez, L.; Almela, L.; García-Diz, L.; Mariscal-Arcas, M.; Murcia, M.A. Assessment of Antimicrobial Activity of Coffee Brewed in Three Different Ways from Different Origins. Eur. Food Res. Technol. 2011, 233, 497–505. [Google Scholar] [CrossRef]
  28. Malbaša, R.; Lončar, E.; Djurić, M.; Došenović, I. Effect of Sucrose Concentration on the Products of Kombucha Fermentation on Molasses. Food Chem. 2008, 108, 926–932. [Google Scholar] [CrossRef]
  29. Sinamo, K.N.; Ginting, S.; Pratama, S. Effect of Sugar Concentration and Fermentation Time on Secang Kombucha Drink. IOP Conf. Ser. Earth Environ. Sci. 2022, 977, 012080. [Google Scholar] [CrossRef]
  30. Wang, B.; Rutherfurd-Markwick, K.; Zhang, X.-X.; Mutukumira, A.N. Isolation and Characterisation of Dominant Acetic Acid Bacteria and Yeast Isolated from Kombucha Samples at Point of Sale in New Zealand. Curr. Res. Food Sci. 2022, 5, 835–844. [Google Scholar] [CrossRef] [PubMed]
  31. de Miranda, F.J.; Belo, M.P.G.; de Lima, S.L.; Silva, A.K.; Uekane, M.T.; Gonzalez, G.M.A.; Branco, N.C.V.; Pitangui, S.N.; Fernandes, F.F.; Lima, R.A. Arabic Coffee Infusion Based Kombucha: Characterization and Biological Activity during Fermentation, and in Vivo Toxicity. Food Chem. 2023, 412, 135556. [Google Scholar] [CrossRef]
  32. Watawana, M.I.; Jayawardena, N.; Waisundara, V.Y. Enhancement of the Functional Properties of Coffee Through Fermentation by “Tea Fungus” (Kombucha). J. Food Process. Preserv. 2015, 39, 2596–2603. [Google Scholar] [CrossRef]
  33. Laureys, D.; Britton, S.J.; De Clippeleer, J. Kombucha Tea Fermentation: A Review. J. Am. Soc. Brew. Chem. 2020, 78, 165–174. [Google Scholar] [CrossRef]
  34. Ivanišová, E.; Meňhartová, K.; Terentjeva, M.; Harangozo, Ľ.; Kántor, A.; Kačániová, M. The Evaluation of Chemical, Antioxidant, Antimicrobial and Sensory Properties of Kombucha Tea Beverage. J. Food Sci. Technol. 2020, 57, 1840–1846. [Google Scholar] [CrossRef] [PubMed]
  35. Nizioł-Łukaszewska, Z.; Ziemlewska, A.; Bujak, T.; Zagórska-Dziok, M.; Zarębska, M.; Hordyjewicz-Baran, Z.; Wasilewski, T. Effect of Fermentation Time on Antioxidant and Anti-Ageing Properties of Green Coffee Kombucha Ferments. Molecules 2020, 25, 5394. [Google Scholar] [CrossRef]
  36. Ahmed, R.F.; Hikal, M.S.; Abou-Taleb, K.A. Biological, Chemical and Antioxidant Activities of Different Types Kombucha. Ann. Agric. Sci. 2020, 65, 35–41. [Google Scholar] [CrossRef]
  37. Villarreal-Soto, S.A.; Beaufort, S.; Bouajila, J.; Souchard, J.-P.; Renard, T.; Rollan, S.; Taillandier, P. Impact of Fermentation Conditions on the Production of Bioactive Compounds with Anticancer, Anti-Inflammatory and Antioxidant Properties in Kombucha Tea Extracts. Process Biochem. 2019, 83, 44–54. [Google Scholar] [CrossRef]
  38. Oalđe Pavlović, M.; Stajić, M.; Gašić, U.; Duletić-Laušević, S.; Ćilerdžić, J. The Chemical Profiling and Assessment of Antioxidative, Antidiabetic and Antineurodegenerative Potential of Kombucha Fermented Camellia sinensis, Coffea arabica and Ganoderma lucidum Extracts. Food Funct. 2023, 14, 262–276. [Google Scholar] [CrossRef]
  39. La Torre, C.; Fazio, A.; Caputo, P.; Plastina, P.; Caroleo, M.C.; Cannataro, R.; Cione, E. Effects of Long-Term Storage on Radical Scavenging Properties and Phenolic Content of Kombucha from Black Tea. Molecules 2021, 26, 5474. [Google Scholar] [CrossRef]
  40. Gökcen, B.B.; Şanlier, N. Coffee Consumption and Disease Correlations. Crit. Rev. Food Sci. Nutr. 2019, 59, 336–348. [Google Scholar] [CrossRef] [PubMed]
  41. Verster, J.C.; Koenig, J. Caffeine Intake and Its Sources: A Review of National Representative Studies. Crit. Rev. Food Sci. Nutr. 2018, 58, 1250–1259. [Google Scholar] [CrossRef]
  42. EFSA Panel on Dietetic Products, Nutrition and Allergies (NDA). Scientific Opinion on the Safety of Caffeine. EFSA J. 2015, 13, 4102. [Google Scholar] [CrossRef]
  43. Chudy, S.; Gierałtowska, U.; Krzywdzińska-Bartkowiak, M.; Piątek, M. Pomiar Barwy Produktów Mleczarskich. In Współczesne Trendy w Kształtowaniu Jakości Zywności; Wydział Nauk o Żywności i Żywieniu Uniwersytet Przyrodniczy w Poznaniu: Poznań, Poland, 2016; pp. 85–95. ISBN 978-83-7160-834-6. [Google Scholar]
  44. Jarrell, J.; Cal, T.; Bennett, J.W. The Kombucha Consortia of Yeasts and Bacteria. Mycologist 2000, 14, 166–170. [Google Scholar] [CrossRef]
  45. Sobieszuk, P.; Strzyżewska, A.; Ulatowski, K. Investigation of the Possibility of Culturing Aerobic Yeast with Oxygen Nanobubble Addition and Evaluation of the Results of Batch and Semi-Batch Cultures of Saccharomyces cerevisiae. Chem. Eng. Process. Process Intensif. 2021, 159, 108247. [Google Scholar] [CrossRef]
  46. Shavyrkina, N.A.; Skiba, E.A.; Kazantseva, A.E.; Gladysheva, E.K.; Budaeva, V.V.; Bychin, N.V.; Gismatulina, Y.A.; Kashcheyeva, E.I.; Mironova, G.F.; Korchagina, A.A.; et al. Static Culture Combined with Aeration in Biosynthesis of Bacterial Cellulose. Polymers 2021, 13, 4241. [Google Scholar] [CrossRef] [PubMed]
Figure 1. The bioreactor scheme used for coffee fermentation (1—SCOBY, 2—glass bioreactor, 3—air bubbles, 4—air inlet, 5—valve, 6—air pump with an air flow rate 2L/min).
Processes 12 02159 g001
Figure 2. Change in pH during 4% coffee fermentation (a, b, c…—samples with the same letter in do not differ significantly in the same beverage during fermentation; A, B, C…—samples with the same letter in do not differ significantly between different beverage variants); abbreviations in Table 1.
Processes 12 02159 g002
Figure 3. Change in pH during 6% coffee fermentation (a, b, c…—samples with the same letter in do not differ significantly in the same beverage during fermentation; A, B, C…—samples with the same letter in do not differ significantly between different beverage variants); abbreviations in Table 1.
Processes 12 02159 g003
Figure 4. Change in TSS during 4% coffee fermentation (a, b, c…—samples with the same letter in do not differ significantly in the same beverage during fermentation; A, B, C…—samples with the same letter in do not differ significantly between different beverage variants); abbreviations in Table 1.
Processes 12 02159 g004
Figure 5. Change in TTS during 6% coffee fermentation (a, b, c…—samples with the same letter in do not differ significantly in the same beverage during fermentation; A, B, C…—samples with the same letter in do not differ significantly between different beverage variants); abbreviations in Table 1.
Processes 12 02159 g005
Table 1. Explanation of sample abbreviations used in this manuscript.
Sample AbbreviationSample Abbreviation Explanation
T1.4Traditional method of fermentation/5% sugar/4% coffee
T2.4Traditional method of fermentation/6% sugar/4% coffee
T3.4Traditional method of fermentation/7% sugar/4% coffee
T1.6Traditional method of fermentation/5% sugar/6% coffee
T2.6Traditional method of fermentation/6% sugar/6% coffee
T3.6Traditional method of fermentation/7% sugar/6% coffee
N1.4Fermentation in the bioreactor/5% sugar/4% coffee
N2.4Fermentation in the bioreactor/6% sugar/4% coffee
N3.4Fermentation in the bioreactor/7% sugar/4% coffee
N1.6Fermentation in the bioreactor/5% sugar/6% coffee
N2.6Fermentation in the bioreactor/6% sugar/6% coffee
N3.6Fermentation in the bioreactor/7% sugar/6% coffee
Table 2. Change in SCOBY mass during the fermentation process.
Time of MeasurementSCOBY Mass Change [g]
T1.4T2.4T3.4N1.4N2.4N3.4
Before fermentation25.5 bA
±0.1
25.4 abcA
±0.3
25.3 aA
±0.1
25.2 aA
±0.1
25.3 aA
±0.1
25.7 cA
±0.1
After fermentation33.9 aB
±0.3
36.8 bB
±0.3
42.7 eB
±1.2
36.7 bB
±0.6
39.7 cB
±0.1
38.6 dB
±0.6
T1.6T2.6T3.6N1.6N2.6N3.6
Before fermentation26.3 cA
±1.0
25.4 abcA
±0.2
24.8 abA
±0.7
24.3 aA
±1.0
25.6 bcA
±0.3
25.4 abcA
±0.3
After fermentation28.1 aA
±2.6
29.1 aA
±3.6
28.4 aB
±0.9
29.0 aB
±2.2
30.1 aA
±4.4
26.9 aA
±2.1
a, b, c…—samples with the same letter in the line do not differ significantly in variants with the same coffee concentration in the beverage; A, B—samples with the same letter in the column do not differ significantly in variants with the same coffee concentration in the beverage; abbreviations in Table 1.
Table 3. SCOBY mass increase (Δm) during the fermentation process.
Coffee ConcentrationSCOBY Mass Increase (Δm) [g]
T1T2T3N1N2N3
4%8.36 aB
±0.46
11.32 bB
±0.03
17.39 eB
±1.28
11.45 bB
±0.44
14.42 dB
±0.12
12.82 cB
±0.70
6%3.15 aA
±0.03
6.38 cA
±0.46
4.91 bA
±0.13
6.98 cA
±0.69
7.03 cA
±1.66
3.10 aA
±0.21
a, b, c…—samples with the same letter in the line do not differ significantly; A, B—samples with the same letter in the column do not differ significantly; abbreviations in Table 1.
Table 4. Concentration of total polyphenols in fermented coffee.
Day of MeasurementTotal Polyphenol Concentration [mg GAE/100 mL]
Control 4% *T1.4T2.4T3.4N1.4N2.4N3.4
4124.87 a
±1.58
170.54 bcA
±9.81
183.03 bcdA
±18.73
179.16 cdA
±8.68
186.11 cd
±12.41
187.22 d
±7.20
162.93 b
±1.32
8NA193.14 aB
±8.02
209.99 aA
±23.93
189.01 aA
±7.96
NANANA
Control 6% *T1.6T2.6T3.6N1.6N2.6N3.6
4257.26 b
±4.21
227.44 aA
±8.00
225.98 aA
±2.36
234.14 abA
±20.83
234.62 a
±12.53
231.08 a
±7.10
212.48 a
±23.68
8NA233.28 aA
±12.66
265.74 bB
±0.01
277.80 bB
±31.80
NANANA
a, b, c…—samples with the same letter in the line do not differ significantly in variants with the same coffee concentration in the beverage A, B —samples with the same letter in the column do not differ significantly in variants with the same coffee concentration in the beverage; NA—non-analysed; * analysed right after brewing; abbreviations in Table 1.
Table 5. Radical DPPH* scavenging capacity results for fermented coffee.
Day of MeasurementDPPH * Scavenging Capacity [%]
Control 4% *T1.4T2.4T3.4N1.4N2.4N3.4
415.03 a
±0.69
32.89 cA
±3.76
34.69 cA
±0.97
33.84 cA
±3.19
37.48 c
±5.19
32.12 b
±2.35
31.97 b
±0.18
8NA43.55 aB
±0.09
59.44 bB
±0.19
65.72 bB
±0.13
NANANA
Control 6% *T1.6T2.6T3.6N1.6N2.6N3.6
444.36 c
±0.43
58.10 dB
±0.48
41.06 bB
±0.47
39.32 aA
±0.33
52.94 cd
±10.56
72.44 f
±0.53
71.64 e
±0.20
8NA51.10 cA
±0.24
36.77 aA
±0.19
46.71 bB
±4.14
NANANA
a, b, c…—samples with the same letter in the line do not differ significantly in variants with the same coffee concentration in the beverage; A, B—samples with the same letter in the column do not differ significantly in variants with the same coffee concentration in the beverage; NA—non analysed; * analysed right after brewing; abbreviations in Table 1.
Table 6. Concentration of caffeine in fermented coffee.
Day of MeasurementCaffeine Concentration [ppm]
Control 4%*T1.4T2.4T3.4N1.4N2.4N3.4
43.77 a
±0.01
4.55 aA
±1.38
4.78 aA
±1.62
4.50 aA
±1.73
4.58 a
±1.89
4.75 a
±1.81
4.77 a
±2.23
8NA3.10 aA
±0.54
2.92 aA
±0.68
2.45 aA
±0.18
NANANA
Control 6%*T1.6T2.6T3.6N1.6N2.6N3.6
43.34 abc
±0.01
3.62 abcA
±0.24
3.00 aA
±0.57
3.62 abcA
±0.63
5.19 bc
±1.58
4.90 bc
±1.40
3.79 abc
±0.76
8NA3.27 aA
±0.73
2.75 aA
±0.64
3.36 aA
±0.83
NANANA
a, b, c—samples with the same letter in the line do not differ significantly in variants with the same coffee concentration in the beverage; A—samples with the same letter in the column do not differ significantly in variants with the same coffee concentration in the beverage; NA—non analysed; * analysed right after brewing; abbreviations in Table 1.
Table 7. Change in colour coordinates during coffee fermentation.
Colour CoordinateCoffee ConcentrationControlT1T2T3N1N2N3
L*4%29.15 aA
±0.01
30.61 gA
±0.01
30.35 dA
±0.01
30.46 eA
±0.01
30.26 cB
±0.01
29.96 bA
±0.01
30.50 fB
±0.01
6%29.14 aA
±0.01
30.56 deA
±0.16
30.55 eB
±0.01
30.53 dB
±0.01
30.12 cA
±0.01
29.96 bA
±0.01
30.12 cA
±0.01
a*4%1.01 aB
±0.03
1.31 bA
±0.03
1.49 dB
±0.03
1.39 cB
±0.01
1.99 eB
±0.01
2.48 fB
±0.01
2.01 eB
±0.02
6%0.74 aA
±0.01
1.34 cA
±0.02
1.31 bA
±0.02
1.30 bA
±0.02
1.69 eA
±0.03
1.42 dA
±0.01
1.63 eA
±0.04
b*4%−0.98 aB
±0.02
0.32 dA
±0.01
0.17 bA
±0.01
0.20 cA
±0.01
0.61 fB
±0.01
0.40 eB
±0.02
0.81 gB
±0.01
6%−0.92 aA
±0.01
0.50 dB
±0.01
0.30 cB
±0.02
0.30 cB
±0.02
0.29 cA
±0.01
0.06 bA
±0.01
0.29 cA
±0.01
a, b, c…—samples with the same letter in the line do not differ significantly in variants with the same coffee concentration in the beverage; A, B—samples with the same letter in the column do not differ significantly in variants with the same coffee concentration in the beverage; NA—non analysed; abbreviations in Table 1.
Table 8. The total colour differences (ΔE) and sample colours calculated from RGB (abbreviations in Table 1).
Control 4%Control 6%T1.4T1.6T2.4T2.6T3.4T3.6N1.4N2.6N2.4N2.6N3.4N3.6
Control 4%0
Control 6%0.40
T1.42.01.90
T1.62.12.00.20
T2.41.71.70.30.40
T2.61.91.80.10.20.30
T3.41.81.70.20.30.20.20
T3.61.91.80.10.20.30.00.20
N1.42.22.10.80.70.70.80.80.80
N1.61.71.70.60.60.30.60.50.60.50
N2.42.22.21.31.31.11.31.21.30.60.80
N2.61.41.30.70.70.40.60.50.60.80.41.10
N3.42.52.40.90.70.80.90.90.90.30.70.81.10
N3.61.71.70.60.60.30.50.40.50.50.10.90.40.70
Colour
Table 9. Total number of microorganisms in fermented coffee.
Coffee ConcentrationTotal Number of Microorganisms [CFU/mL]
ControlT1T2T3N1N2N3
4%ND1.3 × 1061.2 × 1078.9 × 1082.0 × 1048.9 × 1051.8 × 105
6%ND8.1 × 1081.3 × 1095.4 × 1091.0 × 1036.1 × 1038.9 × 103
ND—not detected; abbreviations in Table 1.
Disclaimer/Publisher’s Note: The statements, opinions and data contained in all publications are solely those of the individual author(s) and contributor(s) and not of MDPI and/or the editor(s). MDPI and/or the editor(s) disclaim responsibility for any injury to people or property resulting from any ideas, methods, instructions or products referred to in the content.

