Abstract
A new approach was applied for the development of a precise, simple, and economic analytical process for the accurate analysis of tolterodine tartrate (TOT) in its bulk and tablet using HSPiP- and quality by design (QbD)-assisted methods. The HSPiP program predicted several solvents and their right ratios for the mobile phase, followed by simulating the experimental solubility data in various predicted solvents. QbD was used to identify the impact of the composition and the mobile phase flow rate on the peak area and retention time. TOT was estimated using an Agilent TC C18 column employing an optimized mobile phase. The HSPiP shortened the solvent selection time with high reliability, whereas QbD identified critical factors. The optimized composition and process variables were used to develop an analytical method for TOT estimation. Various analytical validation parameters were estimated with constructed linearity of 5–30 μg/mL and a percent recovery yield value of 100.36%. To ensure the reliability of the optimized method, we estimated validation parameters (linearity, specificity, precision, accuracy, robustness, and ruggedness) to comply with the ICH guidelines. Considering the high recovery yield, good regression coefficient, low detection limit, and low noise ratio, the optimized method was accurate and precise with a high degree of specificity, rapid process, and reproducibility for the quantitative estimation of tolterodine from both oral analytes (I and II). The validated method was implemented for pharmacokinetic study in rats for quantitative estimation of the analytes with high accuracy, sensitivity, and reproducibility.
1. Introduction
Tolterodine tartrate (TOT) and its active metabolite (5-hydroxymethyl derivative) are the potential competitive anti-muscarinic agent to treat urinary incontinence (a condition marked by uncontrolled contraction of the detrusor muscles, leading to an overwhelming and involuntary urge to urinate) and related overactive urinary bladder [1]. Chemically, the drug is a tertiary amine with better tolerability and side effects compared with others. It has a molecular formula of C26H37NO7, a molecular weight of 473.58 g/mol, limited water solubility, low in vivo dissolution, varied oral bioavailability (10–74%), and reported intestinal disturbance as a side effect [2,3,4]. The solubility of the drug in ethanol, dimethyl sulfoxide, N,N-dimethylformamide, and phosphate buffer (pH 7.2) is reported as 0.1, 20, 30, and 1 mg/mL, respectively [5]. Notably, TOT is related to 5 H-bond donor counts, 8 H-bond acceptor counts, and a slightly lipophilic tertiary amine in salt form (tartrate). The drug exhibits variable pharmacokinetic parameters depending upon a poor or extensive metabolizer. The drug in the IR (immediate release) tablet exhibits a clearance rate of 44 L/h with a half-life of 2–3 h in the extensive metabolizer, whereas this clearance is slow (9 L/h) with a longer half-life (10 h) in the poor metabolizer. Moreover, the half-life is further extended for the ER tablet (extended release) in the poor and extensive metabolizers (6 h and 11 h for extensive and poor metabolizers, respectively). Notably, a low dose (2 mg/day) is recommended for hepatic-impaired patients [3].
Various methods have been employed to assess its stability, pharmaceutical properties, and enantiomeric ratios (even enantiomer impurities), using chiral HPLC (high-performance liquid chromatography), and simultaneous estimation using different column types and mobile phases (including variations in pH levels) [6,7]. Apart from HPLC, alternative ultra-performance LC (UPLC), high-performance thin-layer chromatography (HPTLC), and spectrophotometric methods (evaluating coupling reactions) have also been developed for the estimation of TOT [8,9]. Furthermore, a mass spectrophotometric technique has been reported to measure TOT in the human plasma in combination with tamsulosin [6].
Few advanced and sophisticated instrumentations, such as capillary solid-phase extraction–tandem mass spectroscopy, capillary liquid–tandem mass spectroscopy, and gas chromatography–mass spectroscopy have been reported to determine the drug and its metabolites from the plasma samples [10,11]. However, these methodologies are associated with various limitations and expensive analysis burdens. Therefore, a new simple, rapid, and reproducible method is required to fill the gaps in the analytical research for the drug estimation. Thus, a significant gap existed in the availability of precise HPLC methodologies designed for the precise estimation of TOT in various dosage forms. This can be resolved by implementing HSPiP-based solvent selection followed by the identification of critical factors having a prime impact on retention time and flow rate using QbD. HSPiP is a predictive program that is fundamentally based on Hansen solubility parameters (HSPs). These parameters are related to the innate cohesive energies of a material or solvent. Mathematically, total cohesive energy is considered as the square sum of each parameter such as dispersion energy (δd), polarity energy (functional groups in a molecule) arising from the dielectric constant value (δp), and H-bonding energy (δh) [12]. The program categorizes solvents as “good” or “bad” depending upon “relative energy difference” (RED). An RED value < 1 indicates a good solvent and vice versa [12,13]. The program renders several predictive parameters (Hansen distance, RED, and Hansen space parameter) to opt a solvent or mixture of solvents in a particular ratio for the investigated drug or solute. The theoretical solubility can be further justified with the experimental solubility at a particular temperature.
In the HPLC method development, the quality control (QC) parameters are critically important to guarantee the method’s accuracy, precision, robustness, reliability, and reproducibility. These QC parameters assist with validating the method for routine analysis at academic institutions and is common in industrial research and development (R&D) units. Thus, these QC parameters ensure consistent results and analytical findings. By implementing strict quality control parameters in HPLC method development and validation, one can improve the overall effectiveness of the analytical methodology for high simplicity, cost effectiveness, rapid analysis, sensitivity, and reproducibility. In the literature, several studies reported analytical methods of tolterodine tartrate estimation, but some research gaps and areas for improvement still remained, such as the lack of limited in vivo QC data in the biological samples (plasma and urine), ultra-sensitive detection techniques, matrix interference, green analytical method, degradation analysis, bioanalytical method in certain populations, chiral HPLC method, real-time assessment of the drug in patients for in vitro simulation, high-throughput analysis, and impurity profiling [8,9,10,11]. These are still open domains to explore.
To the best of our knowledge, Hansen solubility parameters-based solvent prediction and subsequent simulation with the experimental solubility data for TOT have been explored by us first, to investigate various biocompatible solvents followed by predicting in vivo performance in humans using GastroPlus (version 9.8, simulation and prediction software) [12,13]. This may result in a promising approach to developing a simple, specific, rapid, cost-effective, reproducible, accurate, and sensitive method. To address this, the method development and validation of a sensitive, accurate, efficient, and RP-HPLC (reverse phase-high-performance liquid chromatography) procedure were deemed essential. This procedure was intended for the quantification of TOT in both bulk substance and pharmaceutical dosage forms. The primary objective of this initiative was to fulfill the analytical requirements for routine evaluations within the quality-control division of a pharmaceutical company [14]. We aimed to develop an uncomplicated, rapid, and reliable process for precise results in tablet dosage, bulk substance analysis, and in vivo pharmacokinetic profile. Furthermore, the validation of the developed analytical method by applying ICH (the International Council for Harmonization) guidelines ensures its credibility and applicability [15].
2. Materials
J.B. Chemicals and Pharmaceuticals Pvt. Ltd., Thane, MH, India provided tolterodine tartrate (analytical grade with ≥ 98.8% purity) (TOT) as a gift sample for research and development. Solvents (acetonitrile, methanol, dimethylacetamide, trimethylamine, and dimethyl sulfoxide) were purchased from Sigma-Aldrich (Mumbai, MH, India). CDH Fine Chemical, Mumbai, MH, India provided propylene glycol (PG) and ethylene glycol (EG). Ethyl acetate, N-methyl-2-pyrrolidone (NMP), and ethanol were purchased from Fisher Scientific Chemicals (Mumbai, MH, India). To estimate the drug content, high-performance liquid chromatography (HPLC) as an analytical tool was employed (1220 infinity LC Agilent Technologies, Singapore) coupled with Agilent TC C18 (250 mm × 4.6 mm) column with packing particle size of 5 μm (rapid resolution with 1.8 micron and 600 Bar). Distilled water was used as an aqueous solution and buffer preparation.
3. Methods
3.1. HSPiP-Based Predicted Solvents and Combination Ratio
HSPiP (version 5.4.087, Dr. techn.Charles M. Hansen Jens Bornøsvej 16, 2970 Hørsholm Denmark) is a predictive and simulation program based on the total cohesive energies of any material. These materials may be any drug, surfactants, solvents, and cosolvents. The program pools various solvents and categorizes them as good and bad solvents for a particular solute in a specific solvent at fixed temperature. The program requires various input parameters obtained from the literature, experiments, and default settings. Fundamentally, it works on prime interactive forces responsible for the solubilization/miscibility of two different solvents or a solute into a solvent [16]. These energies are considered as dispersion energy (expressed as δd) due to the hydrophobic carbon portion of a molecule, polarity energy arising from the dielectric constant of the solvent or polar functional group of a solid solute (expressed as δp), and hydrogen-bonding energy (δh) as the most efficient interactive force. These are termed Hansen solubility parameters (HSPs). Theoretically, the HSP values are the extension of the Hildebrand solubility parameter by assuming the total cohesive energy as the square sum of all contributing interactions (δd, δp, and δh) [17]. The total energy (δ) is distributed over δd, δp, and δh as shown in equation (1). HSPiP classifies the solvents as “good” or “bad” depending upon the “relative energy difference”, expressed as RED [12,13,16,17]. A solvent with RED ˂ 1 is considered “good”, and vice versa [16]. Mathematically, it is the relative value of the 3-dimensional sphere radius (Ro) to the space parameter (Ra). Thus, RED is Ro/Ra, as expressed in Equation (2).
[δ]2 = [δd]2 + [δp]2 + [δh]2
RED = Ro/Ra
We estimated the HSP values for the drug and various solvents. A solute is expected to be soluble if the HSP difference (Δδ) between the solute and the solvent is zero (ideal) or minimal (close to zero). The pair-wise difference between the HSP of the solute and solvent indicates the extent of their solubility/miscibility. This difference can be described as Equation (3) [16].
[Ra]2 = 4[δd of solvent − δd of TOT]2 + [δp of solvent − δp of TOT]2 + [δh of solvent − δh of TOT]2
Similarly, the HSP of a binary solvent mixture can be estimated by the approximation using Equation (4),
[δx] = ϕ1 [δx1] + ϕ2 [δx2]
Ribar et al. used the suitability of HSPs as descriptors to model the drug retention in HPLC. A novel theoretical model was developed as the basis for a complete mathematical deviation of the model. Hansen distance is a numerical number to quantify the thermodynamic similarity between a solute and solvent on the basis of the constituent’s interaction type [18]. The authors investigated various training errors by developing a new model using the HSP values considering linearity and nonlinearity in outcomes. Notably, a good correlation was found between the changes in the mobile composition and the column temperature on retention time using the developed model [18].
3.2. Measurement of Maximum Wavelength (λmax)
The drug was dissolved in the selected mobile phase. To confirm its maximum absorption, the sample was scanned using a UV–Vis spectrophotometer (U-1800, Shimadzu, Tokyo, Japan). The UV detector was selected due to its dependable nature and its simplicity to find the precise λmax required for the drug absorption (quantitative identification) with high accuracy and reproducibility. The drug solution was scanned over a range of 200–400 nm as per the reported method [19]. Moreover, scanning was conducted to identify any interaction with the solvent systems used for the study. Based on the maxima, a wavelength was selected for the drug estimation in the HPLC system.
3.3. Experimental Solubility of TOT in the Predicted Solvents
It was compulsory to investigate the experimental solubility of the drug in the predicted solvents. The HSPiP-predicted solvents were methanol, ethanol, propylene glycol (PG), ethylene glycol (EG), DMSO (dimethyl sulfoxide), acetonitrile, ethyl acetate, water, DMA (N,N-dimethylacetate), and NMP (N-methyl-2-pyrrolidone). A precise amount of TOT was transferred into a glass vial containing solvent (2 mL) and various sets of binary solvents (set I–set V). The glass vial containing the mixture was placed into a Remi water bath shaker, stirring at a constant rate and temperature (40 ± 1 °C). The addition was continued until the saturation state was achieved. After attaining equilibrium, the mixture was centrifuged to obtain a clear supernatant for the replicated estimation (n = 3) of the drug using UV–Vis spectrophotometry (U-1800, Shimadzu, Japan) at 220 nm [20,21,22].
3.4. Screening of Chromatographic Factors (Taguchi Model)
A screening (pre-optimization) study was carried out, which comprised selected factors (seven factors) using Design Expert software (version 9.8, Stat-Ease Inc., 1300 Godward St NE #6400, Minneapolis, MN, USA) to develop a robust analytical method (HPLC) for TOT estimation. These selected factors (A: acetonitrile concentration; B: flow rate; C: column temperature; D: trimethylamine concentration; E: injection volume; F: ethyl acetate concentration; and G: sample temperature) were screened at two different levels, that is, high level (+1) and low level (−1), aiming to select the most significant factors that affect peak area (maximum) and retention time (minimum). The Taguchi design comprised eight experimental runs and helped to identify the significant critical attributes (factors) [22].
The van Deemter equation provided a combined impact of various factors (various flow and kinetic parameters) on the HETP (height equivalent to a theoretical plate), as shown in Equation (5) [23]. HETP is a measure of the resolving power of a column, causing peak broadening, as per the equation
where A, B, and u are the eddy diffusion parameter, the eddy coefficient, and the speed of the mobile phase, respectively. Moreover, C is the resistance to the mass-transfer coefficient of the drug between the studied mobile phase (Cm) and the column stationary phase (Cs).
3.5. Selection of Chromatographic Parameters
Initially, solvents and their proper ratios were decided based on the experimental solubility and RED values. Moreover, the choice of using RP-HPLC for separation was primarily driven by its convenience and robustness compared with other liquid chromatography methods. This selection was made with the expectation that RP-HPLC would offer a higher likelihood of achieving a successful and satisfactory final separation of the components. An RP-HPLC approach (isocratic mode) was employed to evaluate the drug’s characteristics, utilizing parameters such as retention time, theoretical plate, and tailing factor.
3.6. Preparation of Standard Stock Solution
The standard stock solution of TOT was prepared by dissolving 100 mg of TOT in 100 mL of acetonitrile (ACN) and ethyl acetate (1:1), resulting in a concentration of 1.0 mg/mL. Subsequently, various dilutions were made using the prepared stock solution.
3.7. Optimized Mobile Phase Composition
Based on the HSP distance of the individual solvent and the RED value of the binary system, set V was selected for the mobile phase composition. Moreover, the experimental solubility data were used to corroborate the predicted solvents and their binary combination. To achieve the targeted RED value and the basic nature of the mobile phase, trimethylamine (5 mL/L) was added into the mobile phase. Thus, the mobile phase comprised ACN/ethyl acetate/trimethylamine (50:45:5). The mobile phase selection involved various steps in the HSPiP-based screening followed by experimental solubility at the same temperature. Initially, the column was run for 60 min with the mobile phase to equilibrate the system at a low flow rate. Several trials were conducted to achieve a well-resolved symmetrical peak with high sensitivity. Various flow rates, ranging from 0.5 to 1.5 mL/min, were run to obtain the most optimized flow rate of 1.2 mL/min with a satisfactory retention time at 3.7 min using C18 column (250 × 4.6 mm, 5 µm as particle size). Consequently, the entire analysis was completed within 8 min.
3.8. The Combined Impact of the Selected Factors on Responses by Central Composite Design (CCD)
CCD was applied to identify the critical factors responsible for a remarkable impact on chromatographic parameters such as peak area and retention time. HSPiP and experimental solubility data provided the right combination of solvents. Taguchi’s model renders factors with a significant impact on chromatographic outcomes. Therefore, CCD was used to apply a robust, reliable, and reproducible method with controlled variables. The critical factors (obtained from the Taguchi design) were taken for further optimization using response surface design (RSD). The RSD comprised a central composite design (CCD) using two significant factors. The major advantage of the CCD optimization model is that it requires only two factors at two levels, and there is no requirement for a second-order mathematical model [24]. These two significant factors are X1 (ACN concentration) and X2 (ethyl acetate concentration). These factors were important and directly influenced the outcome (responses). Thirteen experimental runs (HPLC injections) were performed at varied levels. The applied model showed a quadratic model interaction between the factors, and it follows Equation (6), written as
Y: dependent variable; ß1 and ß2: coefficients of X1 and X2; ß0: intercept; ß3: coefficient of interaction between factors X1 and X2; ß4 and ß5: coefficients of quadratic terms X1 and X2.
Y = ß0 + ß1X1 + ß2X2 + ß3X1X2 + ß4X12 + ß5X22
3.9. Method Validation to Estimate TOT from a Mixture and a Tablet
Based on various trials of the experiment, the final chromatographic conditions were summarized and reported. The resultant chromatogram of standard TOT was compiled [25,26].
3.10. Application of the Proposed Method to Bulk Sample
A precise amount of TOT (10 mg) was carefully weighed and placed into a volumetric flask (10 mL) containing the mobile phase. To achieve 15 µg/mL strength, the stock solution was further diluted. The prepared solution was utilized in the suggested technique to estimate the quantity of TOT. This process was replicated, and the outcomes were presented.
3.11. Application of the Proposed Method to Tablet Formulation
To estimate TOT content from a tablet (2.0 mg/tablet), 20 tablets were weighed individually and combined as per pharmacopoeia guidelines. Tablets were finely powdered, and a fixed content of the powder was transferred into a volumetric flask (10 mg/100 mL). Then, 100 mL of methanol was used to dissolve the powder, followed by sonication (20 min) to extract the drug. The suspension was filtered using a membrane filter (0.45 µm) (Millifilter, Milford, MA, USA). The filtrate contained the dissolved drug. The filtrate was further diluted to obtain a final concentration of 15 µg/mL. This prepared solution underwent the proposed method for analysis, allowing the quantification of TOT content [26]. This process was performed six times independently, and the estimated result was summarized.
3.12. Validation of the Proposed Method and Various Validation Parameters
The method validation was conducted by following the ICH guidelines. The standard and test solutions were prepared using the previously established experimental procedure. The method was validated by performing various validation parameters such as linearity, accuracy, repeatability, precision (including intermediate precision), specificity, detection and quantitation limits, linearity, and range, as per the ICH analytical method validation Q2R1 guidelines. The validated method was implemented for in vivo drug estimation using rat models.
Using the stock solution as a source, portions of 0.5, 1, 1.5, 2, 2.5, and 3 mL were extracted and placed into 10 mL volumetric flasks for linearity. These portions were diluted up to the mark using the mobile phase, which resulted in a final concentration range of 5–30 µg/mL. Each sample (20 µL) was introduced using a Hamilton syringe. For every concentration, measurements were replicated six times. A calibration curve was constructed by plotting the drug concentration against the peak area.
The current study involved the accuracy parameter for the validation of the developed procedure. The study involved conducting a recovery analysis employing the standard addition technique across the three concentration levels (80%, 100%, and 120%). A predetermined quantity of the standard TOT was introduced to the previously analyzed sample (with an initial concentration of 10 µg/mL of TOT), which was then processed using the suggested HPLC procedure.
The performance assessment of the HPLC instrument under chromatographic conditions involved the utilization of several injections of a consistent 15 µg/mL TOT sample.
The precision within a single day was established by evaluating three distinct concentrations of TOT (10, 15, and 20 µg/mL) on three separate occasions. To gauge the variability across days, the same concentrations were tested on three different days.
The proposed approach’s sensitivity was evaluated using the limit of detection (LOD) and the limit of quantitation (LOQ). Equations (7) and (8) were employed to determine LOD and LOQ, respectively.
where S.D. is the standard deviation of the curve and α is the slope of the curve.
LOD = (S.D./α) × 3.3
LOQ = (S.D./α) × 10
The LOD and LOQ of the developed method were highly specific compared with the method developed by Urvi et al. [27]. This will help to apply the current method to the detection of biological samples because it can detect minute levels of the drug in the biological fluid [27].
Specificity involves a quantitative detection of the analyte even when other components that could potentially be present in the sample matrix are present too. On the other hand, selectivity is the process of qualitatively detecting the analyte when components that might be commonly found in the sample matrix are also present.
Various sample solutions with a concentration of 15 µg/mL were derived from the stock solution and subjected to analysis by two distinct analysts employing comparable operational and environmental parameters. The measurement of peak areas was conducted thrice for the solutions with identical concentrations.
To assess its resilience (robustness), several parameters were intentionally adjusted, including flow rate alteration, modifying the solution’s pH, adjusting the composition of the mobile phase, and employing a solution of TOT at a concentration of 15 µg/mL.
3.13. Pharmacokinetic Study in Rats
The validated method was implemented for in vivo study in a rat model using pure TOT (as suspension using 0.05% sodium salt of carboxymethyl cellulose) and commercial tablets. All animals were received after approval from the Institutional Ethical Review Board. Animals were housed in an air-conditioned room with controlled temperature (20 ± 1 °C) and humidity (55 ± 15%). Each animal was allowed to access healthy food and water ad libitum. Rats (weighing around 250–300 g) were randomly selected and grouped as A and B (n = 6). A and B received pure TOT suspension and tablet (as suspension), respectively. Each group was properly labeled and kept on fast for 12 h (overnight) before the formulation administration. Group A received oral TOT suspension (analyte I) at a dosing strength of 10 mg/kg, whereas group B received the tablet suspension (analyte II) at the same dose using a catheter [25]. Blood was collected (0.22 mL) in a blood-collecting tube at different time points (0, 1, 2, 4, 8, and 12 h) through the retro-orbital area of the eye. The collected blood was immediately centrifuged, and the collected plasma was transferred to the freezer (−80 °C) before analysis. Plasma was harvested from the control (untreated) group and stored in the freezer for further use after collecting the blood in heparinized tubes. The calibration curve was prepared by spiking the drug solution (prepared in mobile phase) in the plasma. The study was repeated to obtain the mean and standard deviation.
3.14. Statistical Analysis
The explored experimental data were generated through replication of work to obtain mean and standard deviation (n = 3, ± standard deviation). Statistical analysis was carried out employing GraphPad-Prism (Trial version, San Diego CA, the United States of America). A value was relatively considered significant at p ≤ 0.05. ANOVA (one-way analysis of variance), followed by Tukey’s multiple comparison, was applied wherever required for calculation of the data. The mean values of the means, standard deviation, % relative standard deviation, limit of detection, and limit of quantification, and linear regression analysis (least square), were calculated employing Microsoft® Excel 2016 (Microsoft Corporation, Redmond, WA, USA).
4. Results and Discussion
4.1. HSPiP-Based Predicted Solvents and Ratio
The program predicted various HSP values for TOT and the expected solvents with maximum solubility (Table 1). The HSP values of TOT indicated that dispersion energy is high compared with polarity and hydrogen bonding, which can be correlated with its structural property, as shown in Figure 1A,B. The drug does not bear a polar functional group or a functional group with high electronegative atoms forming H-bonds with the solvents. Thus, the δd, δp, and δh of TOT were estimated as 17.6, 2.4, and 4.6, respectively. Comparing these values to select a suitable solvent for maximum solubility, acetonitrile and ethyl acetate (EA) are close to the HSP of TOT for the analytical mobile phase. NMP and DMSO are relatively closer than the aforementioned solvents. However, these are not recommended practically for the HPLC analytical mobile phase. EA was found to be the only predicted solvent with the lowest value of HSP distance, suggesting maximum overall interactions (London force, π–π interaction, and dispersion energy) [16,23]. Trimethylamine was considered as an auxiliary component for further reduction in overall mobile phase composition. Moreover, the program predicted a binary system with possible values of RED. The lowest RED value (0.9) was associated with set V. The addition of a small volume of the amine may result in a significant reduction in the overall RED value of the system (data not generated). The predicted outcome was in good agreement with the published HPLC mobile phase, wherein trimethylamine profoundly reduced the retention time with high resolution due to trimethylamine’s addition into the mobile phase [10,11].

Table 1.
HSPiP software-based predicted excipients based on HSP values for TOT.
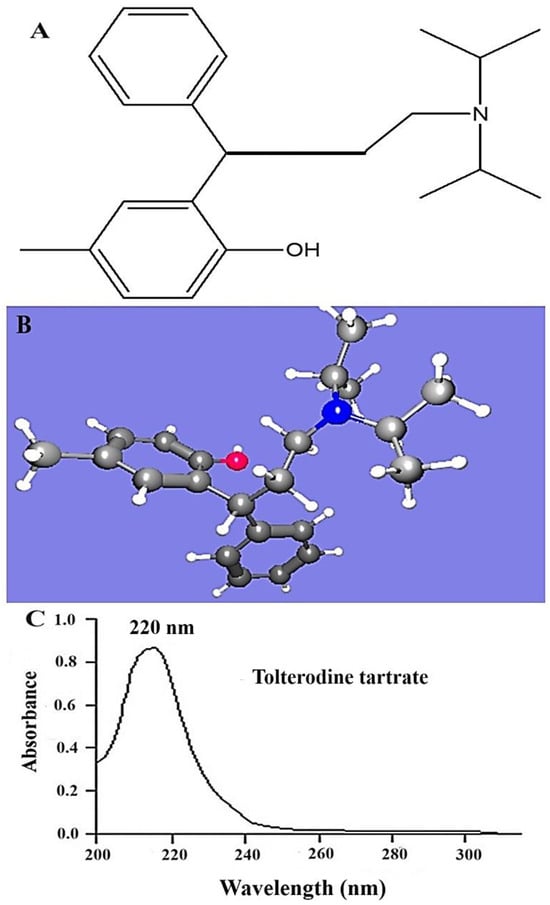
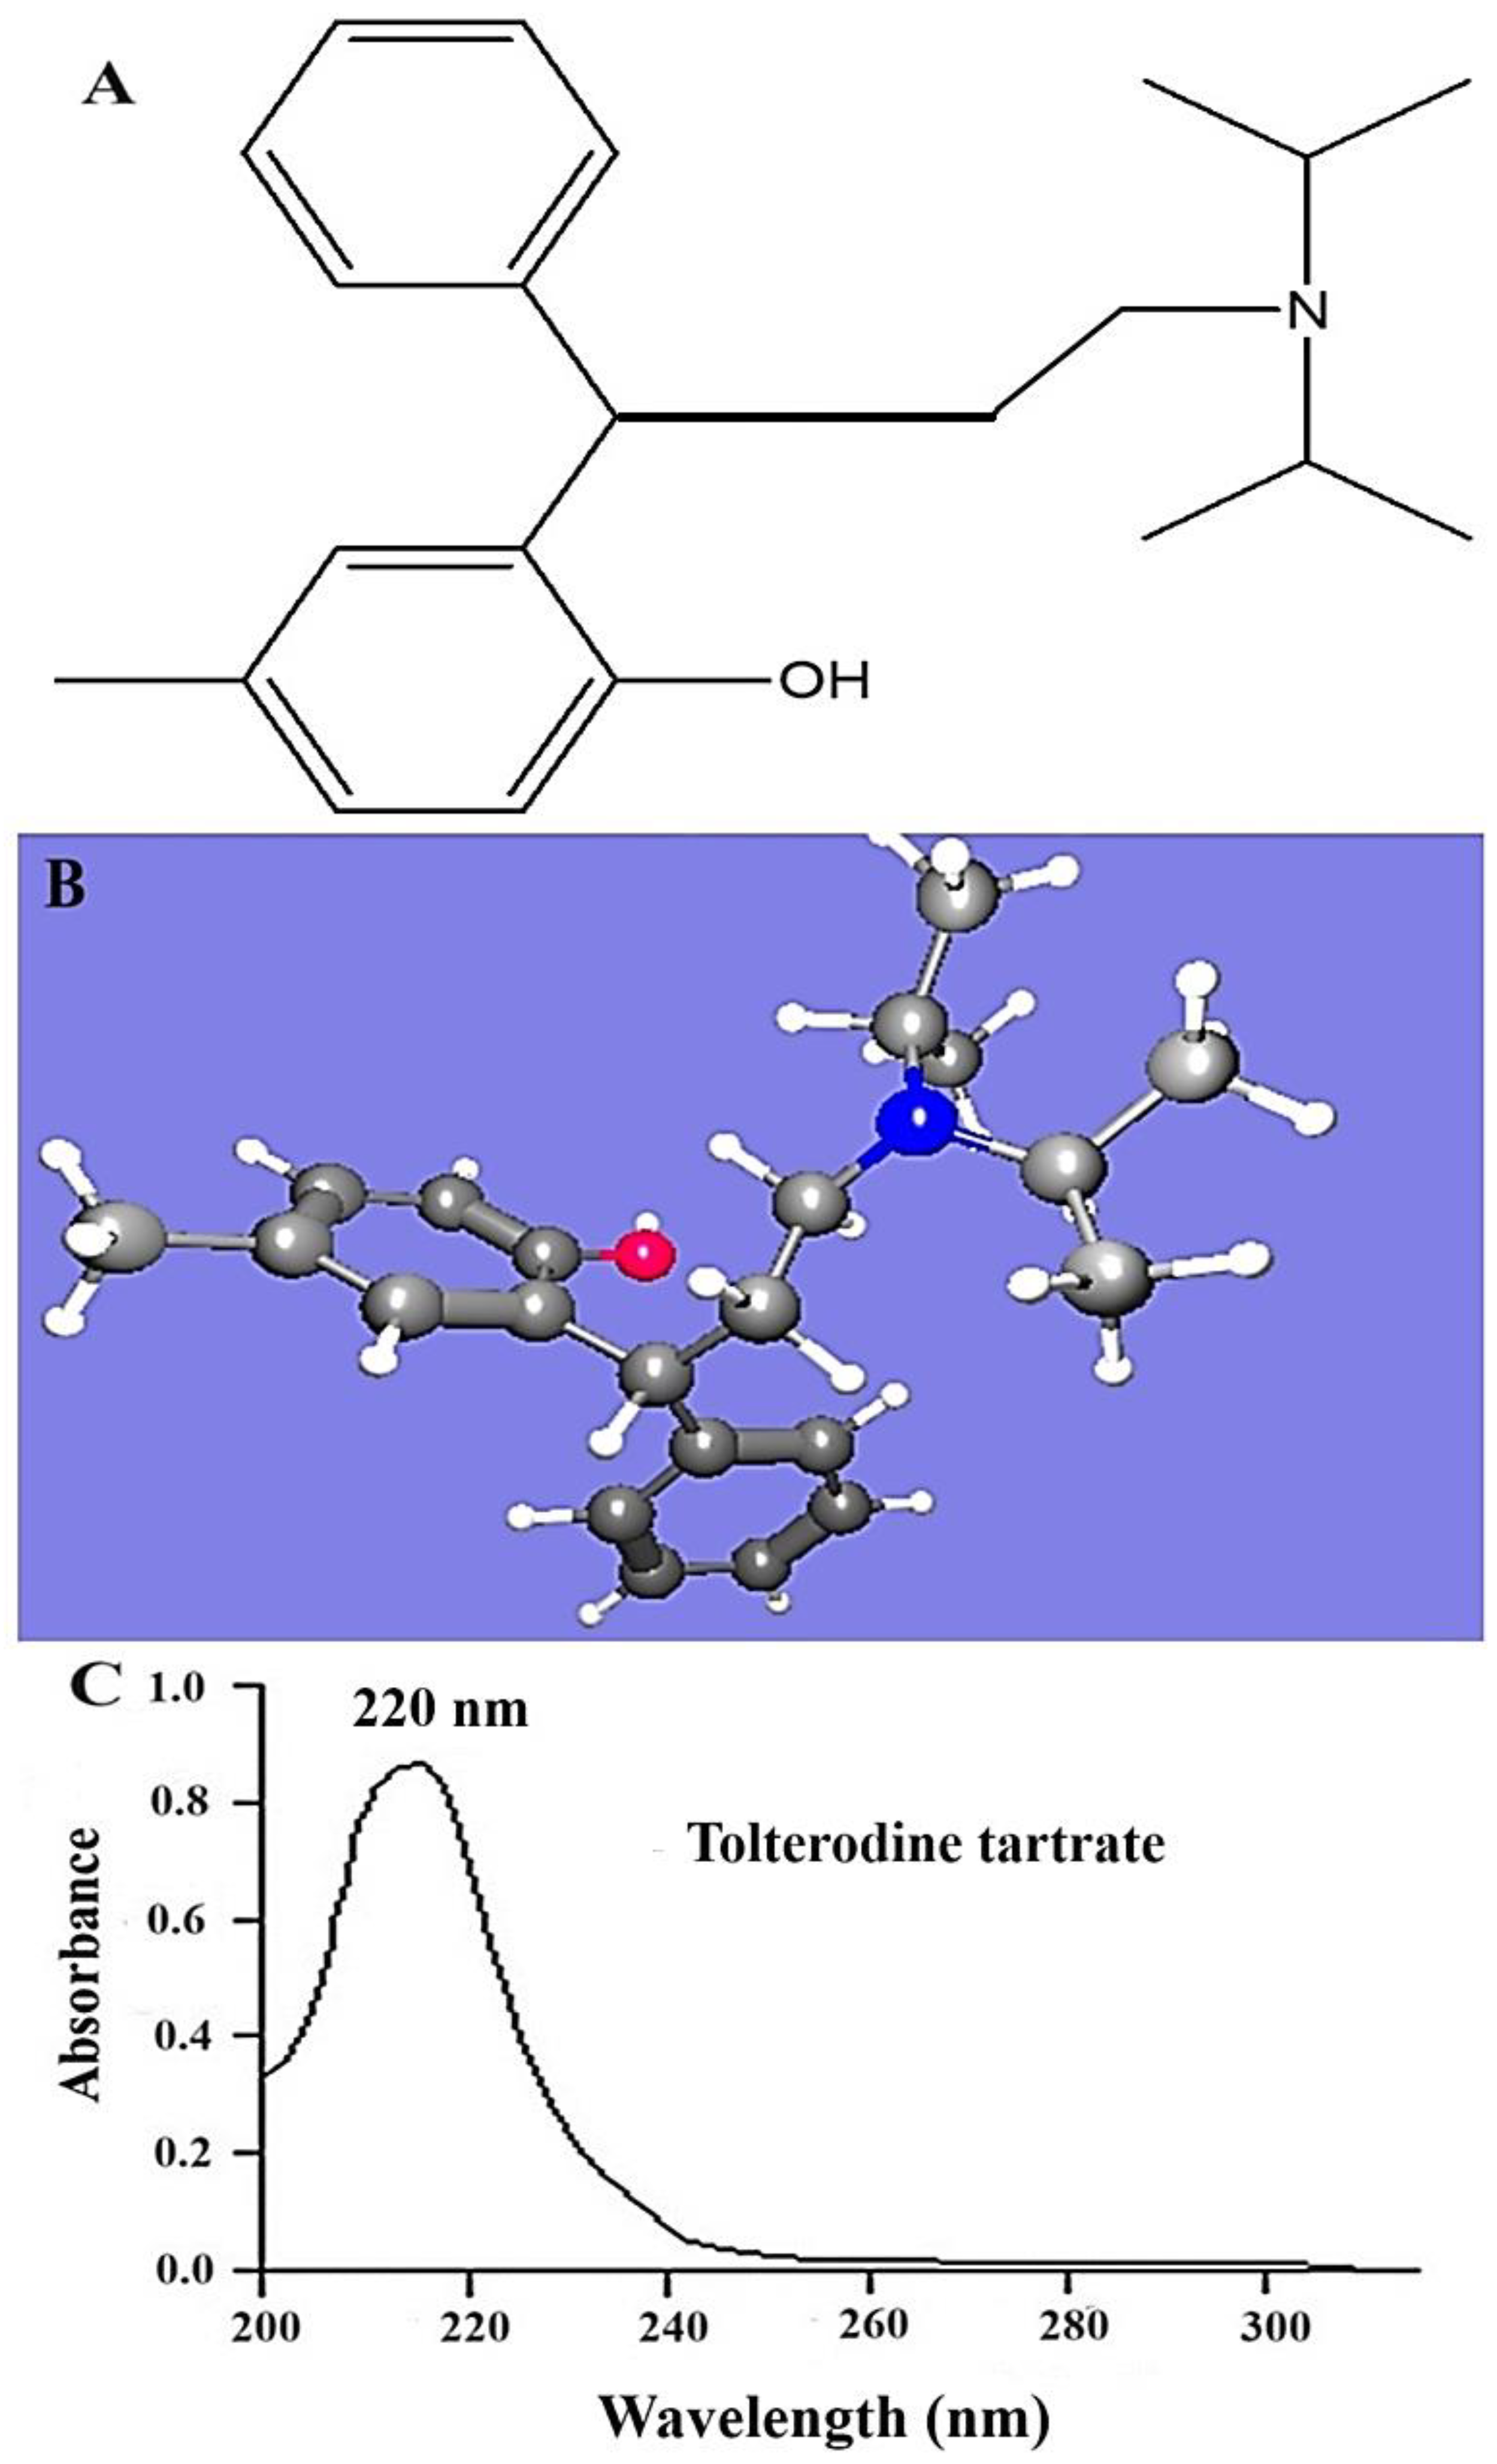
Figure 1.
(A) Bond structure of tolterodine (free drug) using Chemdraw software (free trial version), (B) HSPiP-generated 3-dimensional ball–stick structure of the drug (pink color and blue color balls indicated O and N atoms respectively), and (C) scanned spectra of TOT in methanol using UV–Vis spectrophotometer in spectrum mode (U-1800, Shimadzu, Tokyo, Japan).
4.2. Measurement of λmax
TOT was completely dissolved in the combination set V. The obtained λmax value was found to be 220 nm, as shown in Figure 1C. A similar pattern of UV scanning report was obtained in methanol. This suggested the purity of the compound and contamination-free active pharmaceutical ingredient (API). The established λmax was used for HPLC-based drug estimation in further study.
4.3. Experimental Solubility of TOT in the Predicted Solvents
To confirm the predicted solubility of the drug in the predicted solvents, it was a prerequisite to obtain the experimental saturated solubility, explored at 45 °C. Figure 2 illustrates the experimental solubility of TOT in the predicted solvents (bar graph) and the HSP distance value of the respective solvents. The predicted HSP distance followed a similar pattern to the experimental solubility (blue line in Figure 2). The aqueous solubility of the drug has been reported in the literature as 13.2 mg/mL at 37 °C in an acidic medium (pH = 3.5) [26]. The obtained solubility values in water and methanol are in good agreement with the published report [26]. The drug exhibits pH-dependent aqueous solubility, suggesting a considerable factor for mobile phase development in analytical methodology with high robustness, reproducibility, and accuracy [26].
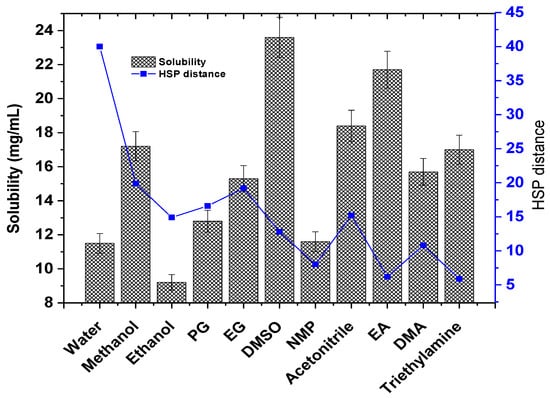
Figure 2.
An illustrative representation of the correlation between the experimental solubility of TOT in various predicted solvents and the HSP distance generated in HSPiP. Experimental solubility data are presented as the mean and standard deviation (SD) (n = 3, ± SD). The graph was constructed using Origin Pro 14 (trial version).
4.4. Selection of Critical Factors for Chromatography (Taguchi Model)
In the Taguchi model, seven factors (A–G) at two different levels (maximum and minimum) were assessed, as shown in Table 2 and Figure 3A–D. The set goals were peak area and retention time, with constraints of maximum and minimum, respectively, following the reported method [22]. The design assisted in identifying the significant attributes (factors) under the set constraints [23]. Table 2 summarizes the factors, their levels, and responses. These are significant factors recommended to consider while developing new methods for the quantification of the drug with high reproducibility and low variability using the HPLC method. Based on the result, it was recommended to use a high content of ACN and EA followed by the addition of trimethylamine, as low content, to obtain the set goals (maximum peak area and low retention time) in optimization. Thus, a ratio was predicted as 50:45:05 for ACN:EA:TEA. An attempt was made to vary the flow rate from 1.0 to 1.5 mL/min by keeping the temperature constant and was expected to improve separation efficiency based on the theoretical understanding of the van Deemter equation [24]. In practice, the separation was not significantly changed in the predicted solvents, which may be due to the narrow range of flow rates used in the study. The peak was found to be broadened beyond 2 mL/min of flow rate. Therefore, the study was continued at the optimal flow rate (1.2 mL/min) with an injection volume of 20 µL. Furthermore, the column temperature was varied from 20 to 25 °C, keeping the flow rate constant. The eluted result was not convincing. Therefore, other factors were considered that affected the separation.
Table 2.
Various critical parameters affecting TOT bioanalytical method development (Taguchi design).
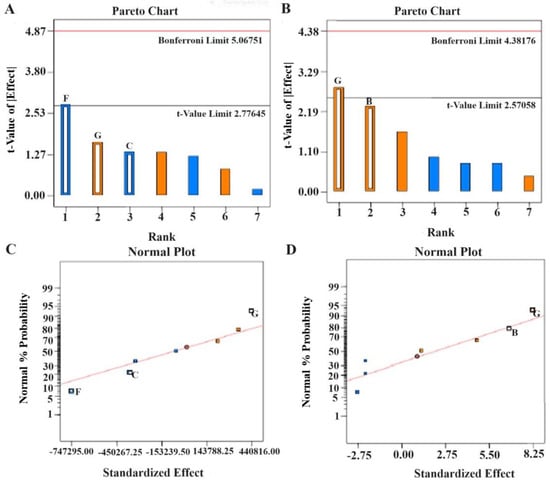
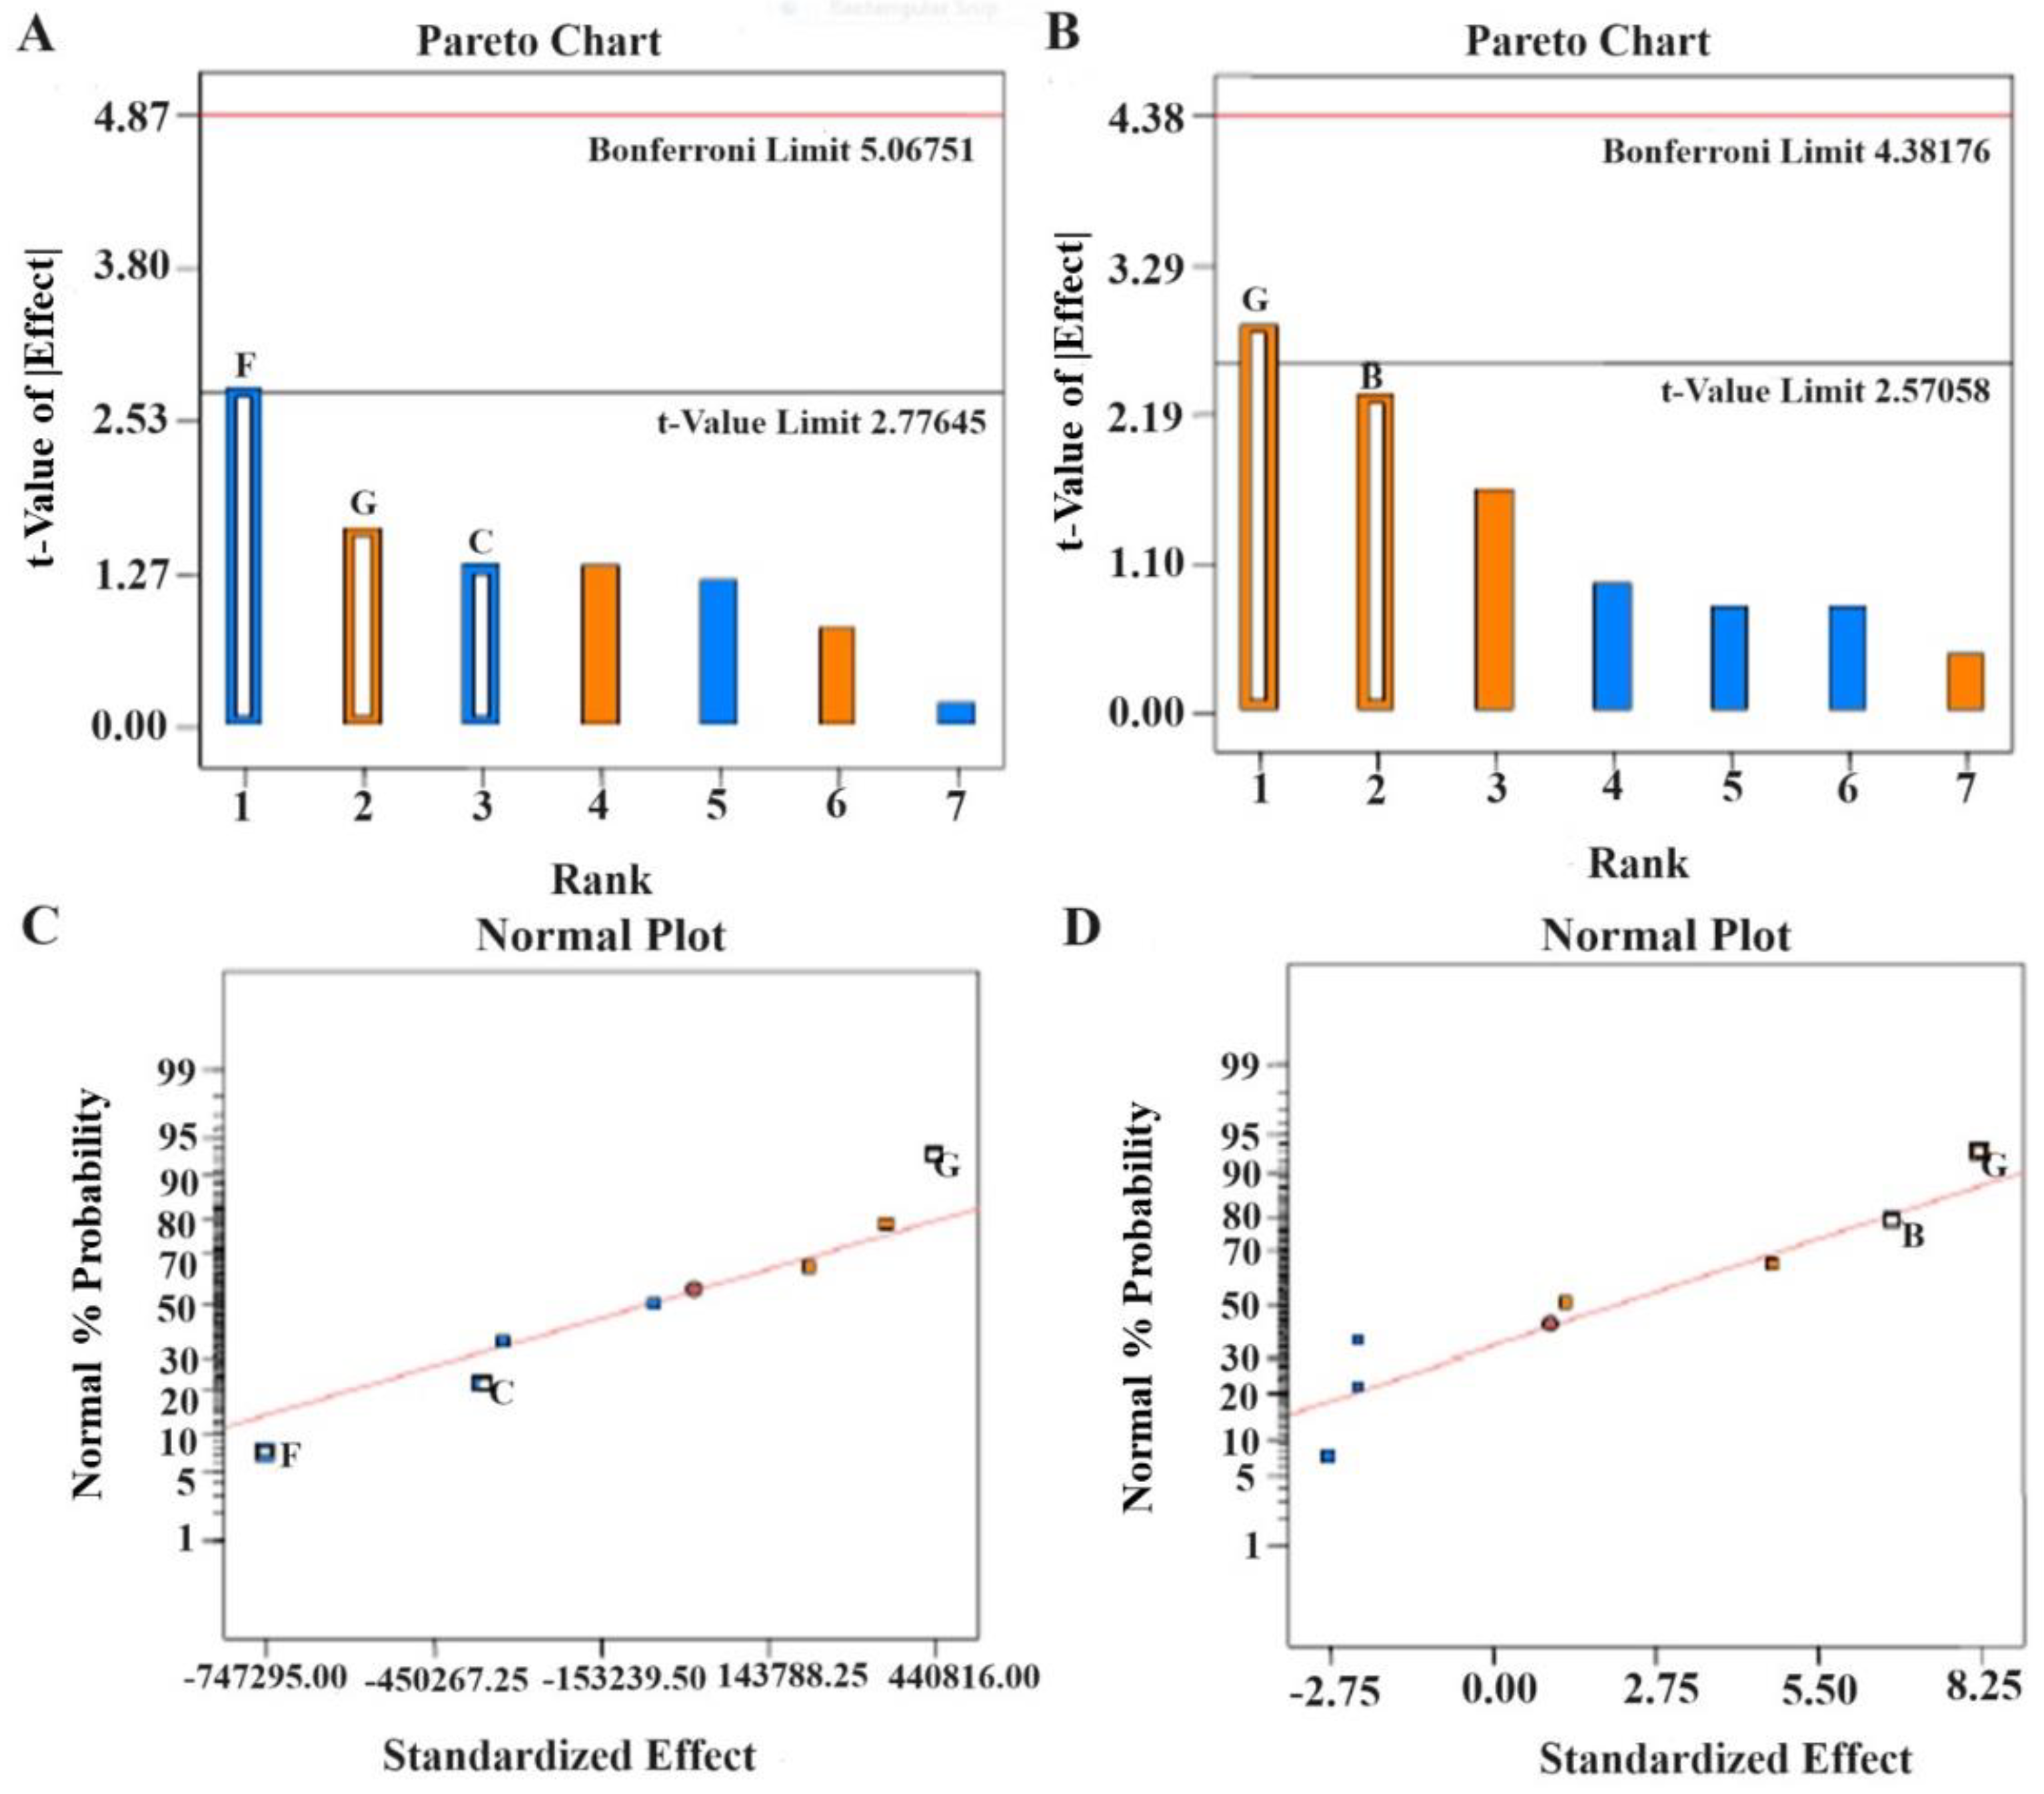
Figure 3.
Pareto charts and half-normal plots depicting the critical factors for HPLC method development of tolterodine tartrate (A,C) peak area and (B,D) retention time (RT). Design Expert software generated bar graphs and correlation curves.
4.5. Impact of Factors on Peak Area and Retention Time: Optimization
From the Taguchi model, the solvents and their ratios were predicted. However, it was further optimized to identify the combined impact of these factors on the set responses under the constraints, followed by validation of the fit model using validation parameters of statistical analysis [18]. Results are summarized in Table 3 and Table 4. Figure 4 and Figure 5 illustrate the response surface plot and overall desirability numerical parameters, respectively.
Table 3.
The central composite design employed two factors at three levels.
Table 4.
Statistical analysis of two significant factors.

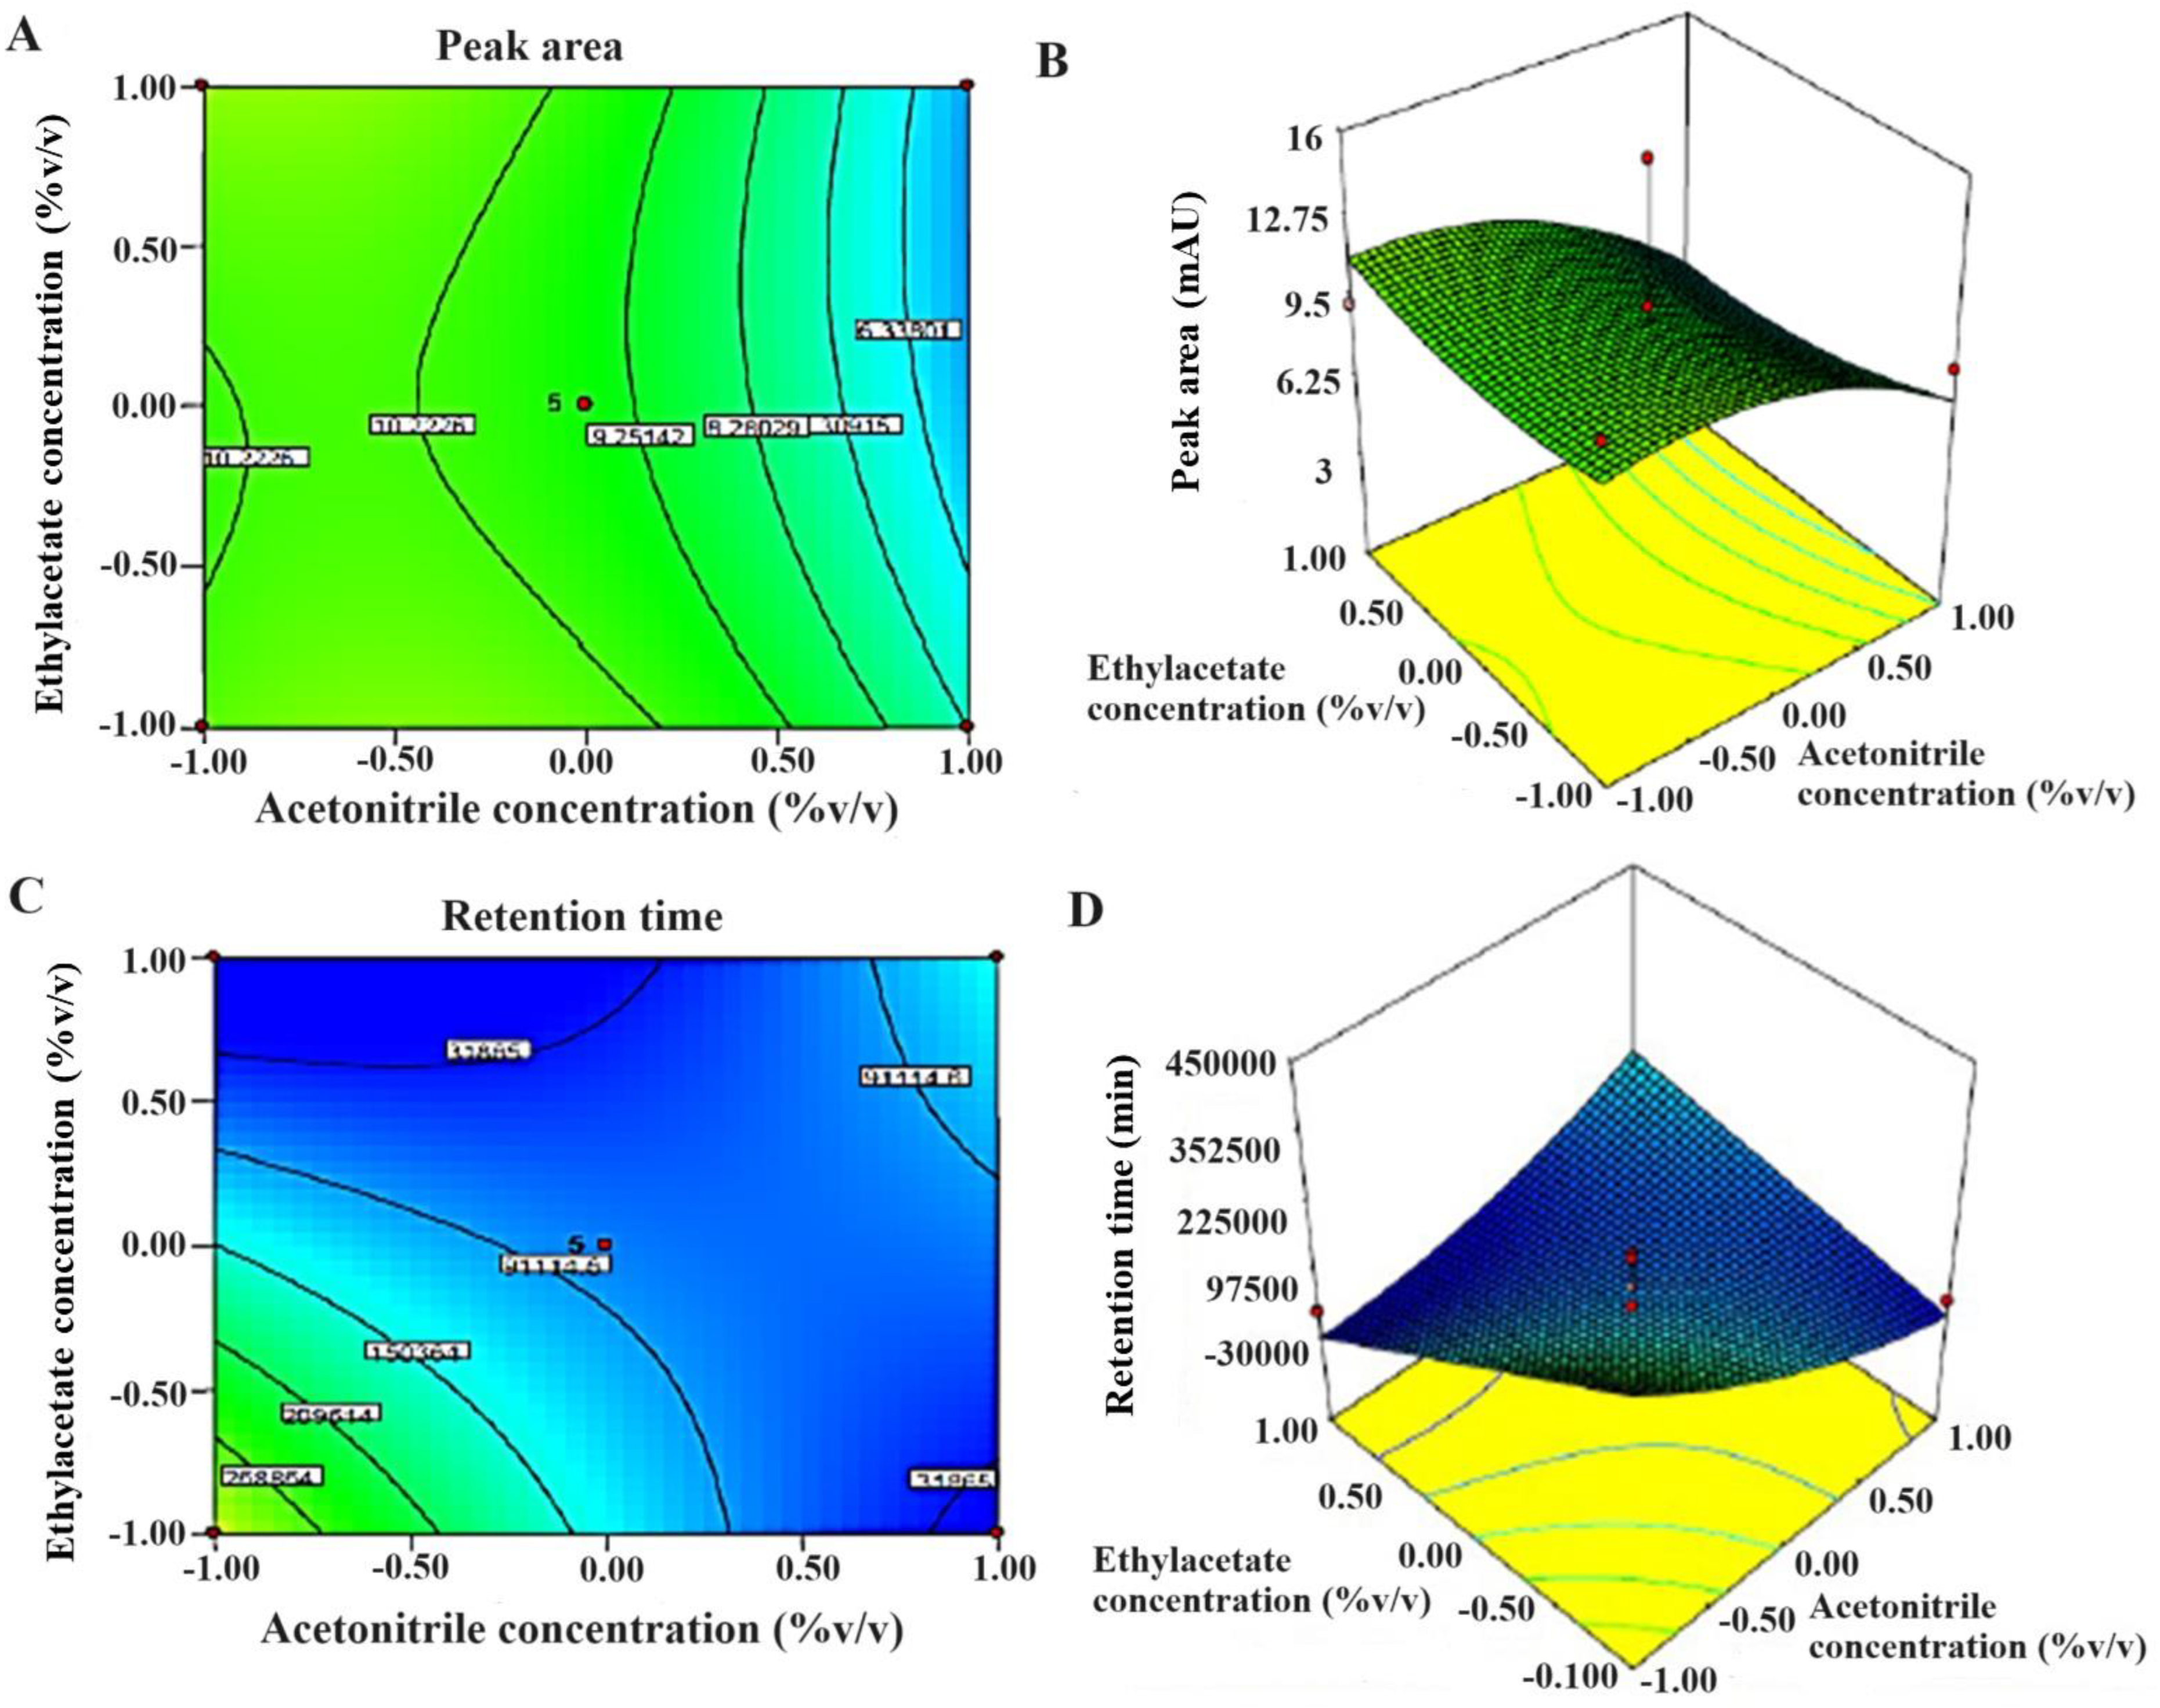
Figure 4.
The 2D and 3D response surface graphs reveal the effect of significant factors on responses (A,B), peak area, and (C,D) retention time. Design Expert software generated 3D response surface graphs and 2D contour plots.

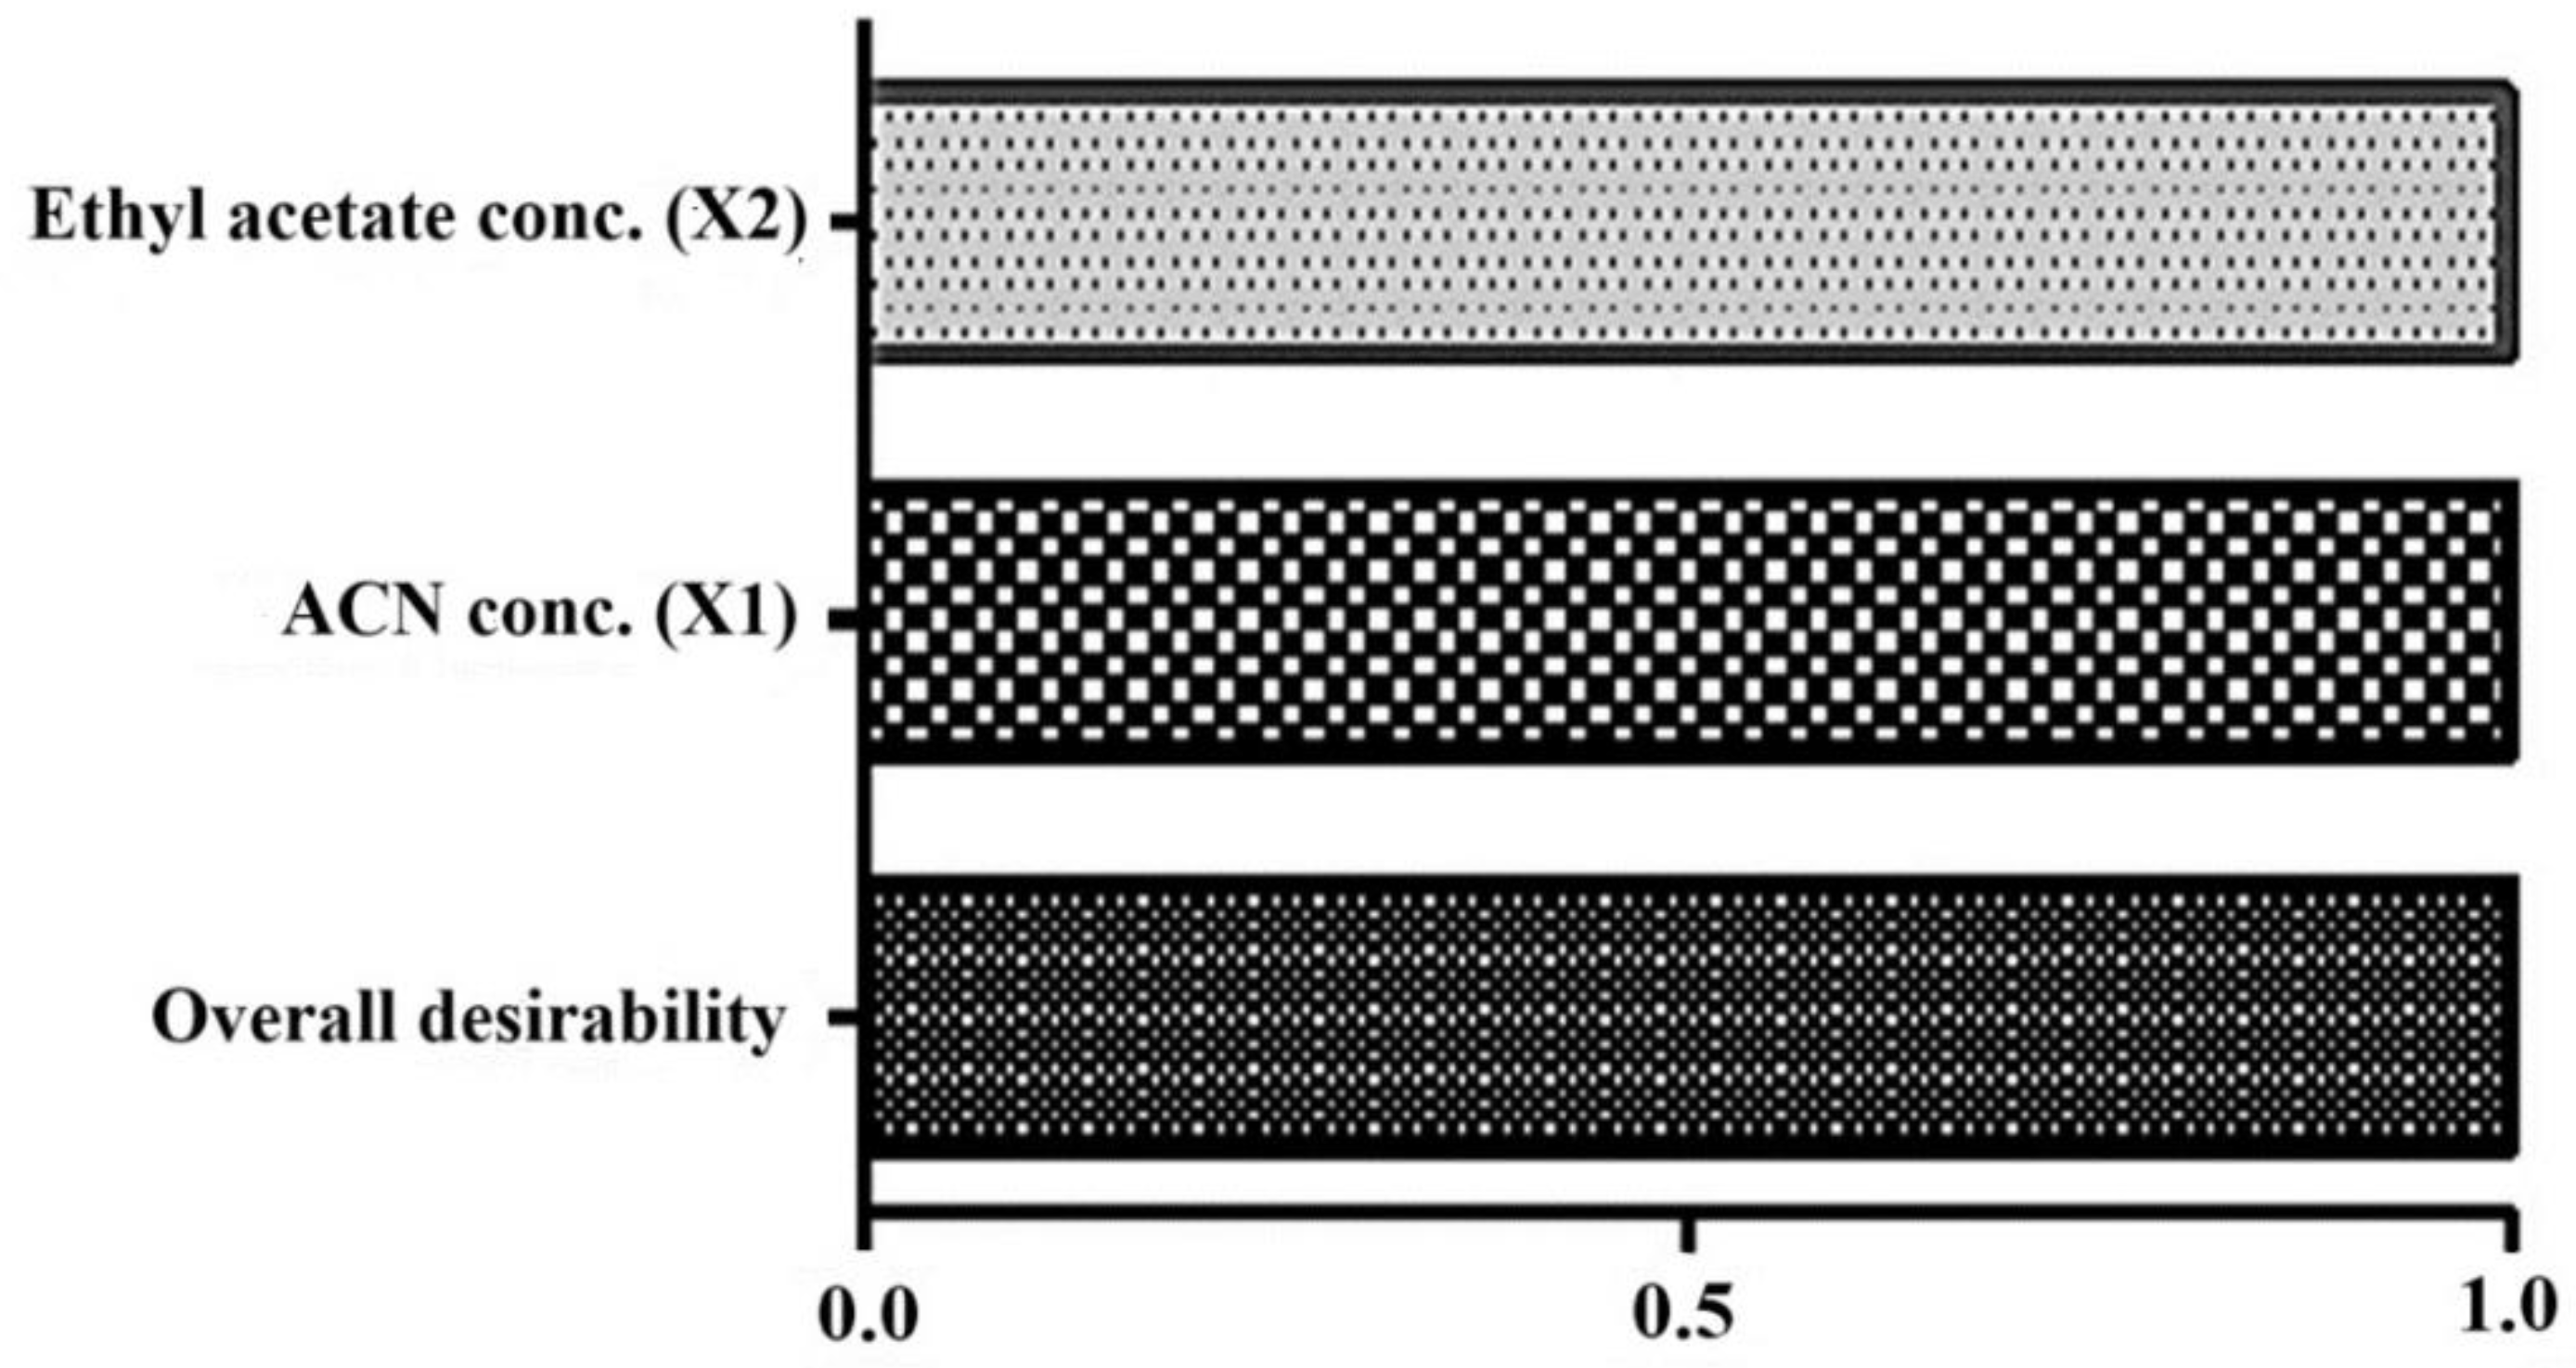
Figure 5.
Desirability as a numerical functional parameter in the bar graph. Bar graph was generated in Design Expert after optimization. The combined desirability value is closely related to unity (0.99), indicating the best fit of the model in optimization. The high value of individual factors (X and X2) indicate significant impact on the investigated responses (Y1 as peak area and Y2 as retention time).
The CCD model was applied for the optimization of various factors and showed interactions in the established HPLC process of analysis to estimate TOT in various samples. Taguchi design provided half-normal plots and Pareto charts (Figure 3). The seven factors were applied at varied levels, and two significant factors were identified, acetonitrile (A) and ethyl acetate concentrations (F), in the studied responses and set goals [21]. CCD rendered 13 runs. The values of the experimental data for the two significant factors are given in Table 4. The results obtained from the statistical analysis of data obtained from the CCD design revealed that an increase in ACN concentration (X1) and EA concentration (X2) leads to a corresponding increment in the peak area to a certain level. The maximum chromatogram peak was obtained at the middle level and low level of ACN concentration (50% v/v) and EA concentration (50% v/v), respectively. More concentration of ACN and EA in the mobile phase led to a decrease in peak height and area (Figure 4A,B). Therefore, it was required to use about 50% of these to obtain a well-resolved peak without tailing or peak broadening [18].
In the case of retention time (RT), the optimized concentration of ACN was also at the middle level (50 % v/v) in the mobile phase. Beyond 50%, there was no significant (p < 0.05) decrease in RT as predicted in the CCD model. Moreover, EA concentration was also optimized for low retention time. Low RT was obtained when EA concentration was at its lowest level (50 % v/v) (Figure 4C,D).
One-way analysis of variance (ANOVA) was applied as a statistical tool to check the variability in the experiments. The values of various statistical parameters are given in Table 3. The low p values of X1 and X2 were estimated as 0.0045 and 0.0062, respectively, suggesting the best fit of the model (quadratic polynomial) [12,13]. Furthermore, the desirability value was close to 1 (0.9988), suggesting that all considered factors were within the model while optimizing (Figure 5).
4.6. Method Validation Parameters to Estimate TOT from Bulk and Tablets
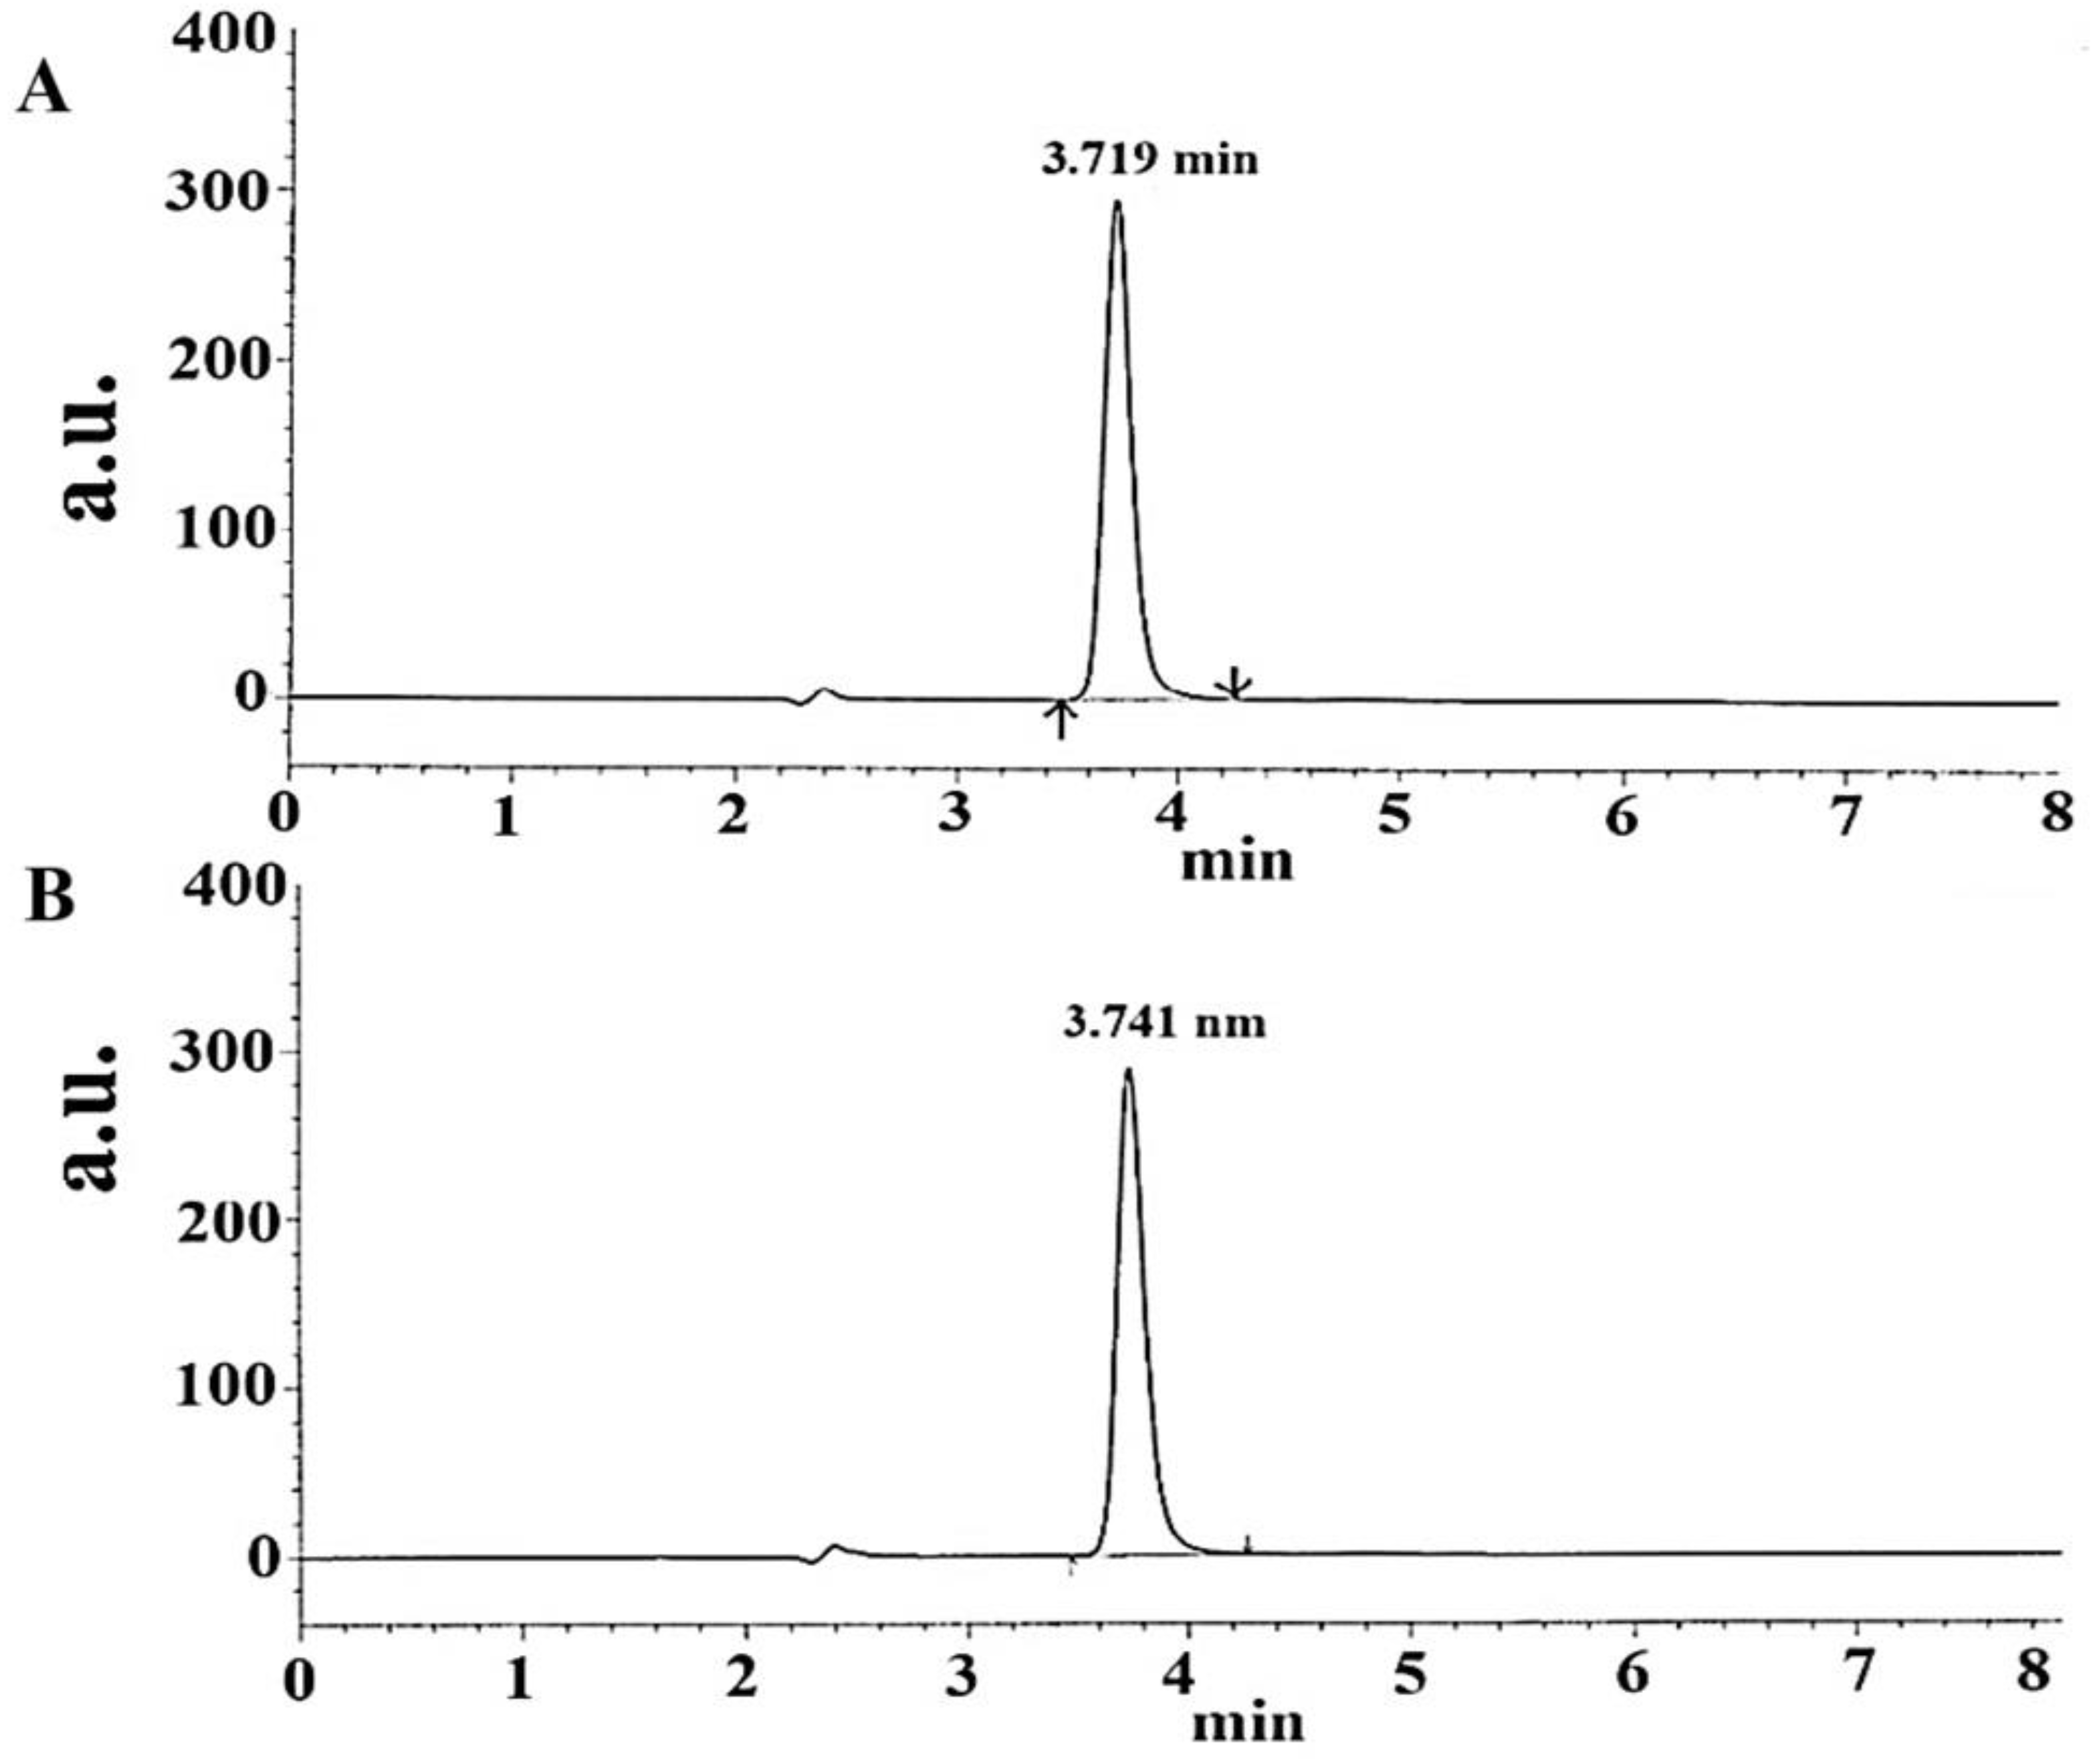
Based on the HSPiP-predicted outcomes, the Taguchi-based model identified critical factors, and the CCD-based model optimized the impact of the factors on the peak area and retention time; the finalized optimized chromatographic conditions are provided in Table 5. The resultant chromatogram of standard TOT is shown in Figure 6. The resulting chromatogram was associated with tailing of 1.3, skew of 0.121, and capacity factor (k’) of 1.32.
Table 5.
Optimized chromatographic conditions.

Figure 6.
Representative chromatogram of TOT standard in the mobile phase as a reference at a retention time of 3.719 min and a concentration of 15 μg/mL (A) and TOT chromatogram obtained for the studied tablet at a retention time of 3.741 min (15 μg/mL) in the same mobile phase (B). HPLC software-generated chromatograms.
4.7. Application of the Proposed Method to Bulk Samples and Tablets
The validated method was applied for its sensitivity, reproducibility, and accuracy by implementing on two separate products, the bulk sample (analyte I) and the commercial tablet (analyte II). This process was replicated six times, and the outcomes are summarized in Table 6.
Table 6.
Analysis of laboratory mixture of TOT.
The determined quantity was estimated as 99.81%, accompanied by a relative standard deviation (% R.S.D) of under 2%. This led to the conclusion that this approach effectively targets the identification of TOT within pharmaceutical formulations [14].
4.8. Method Validation of the Analytes
4.8.1. Linearity Study
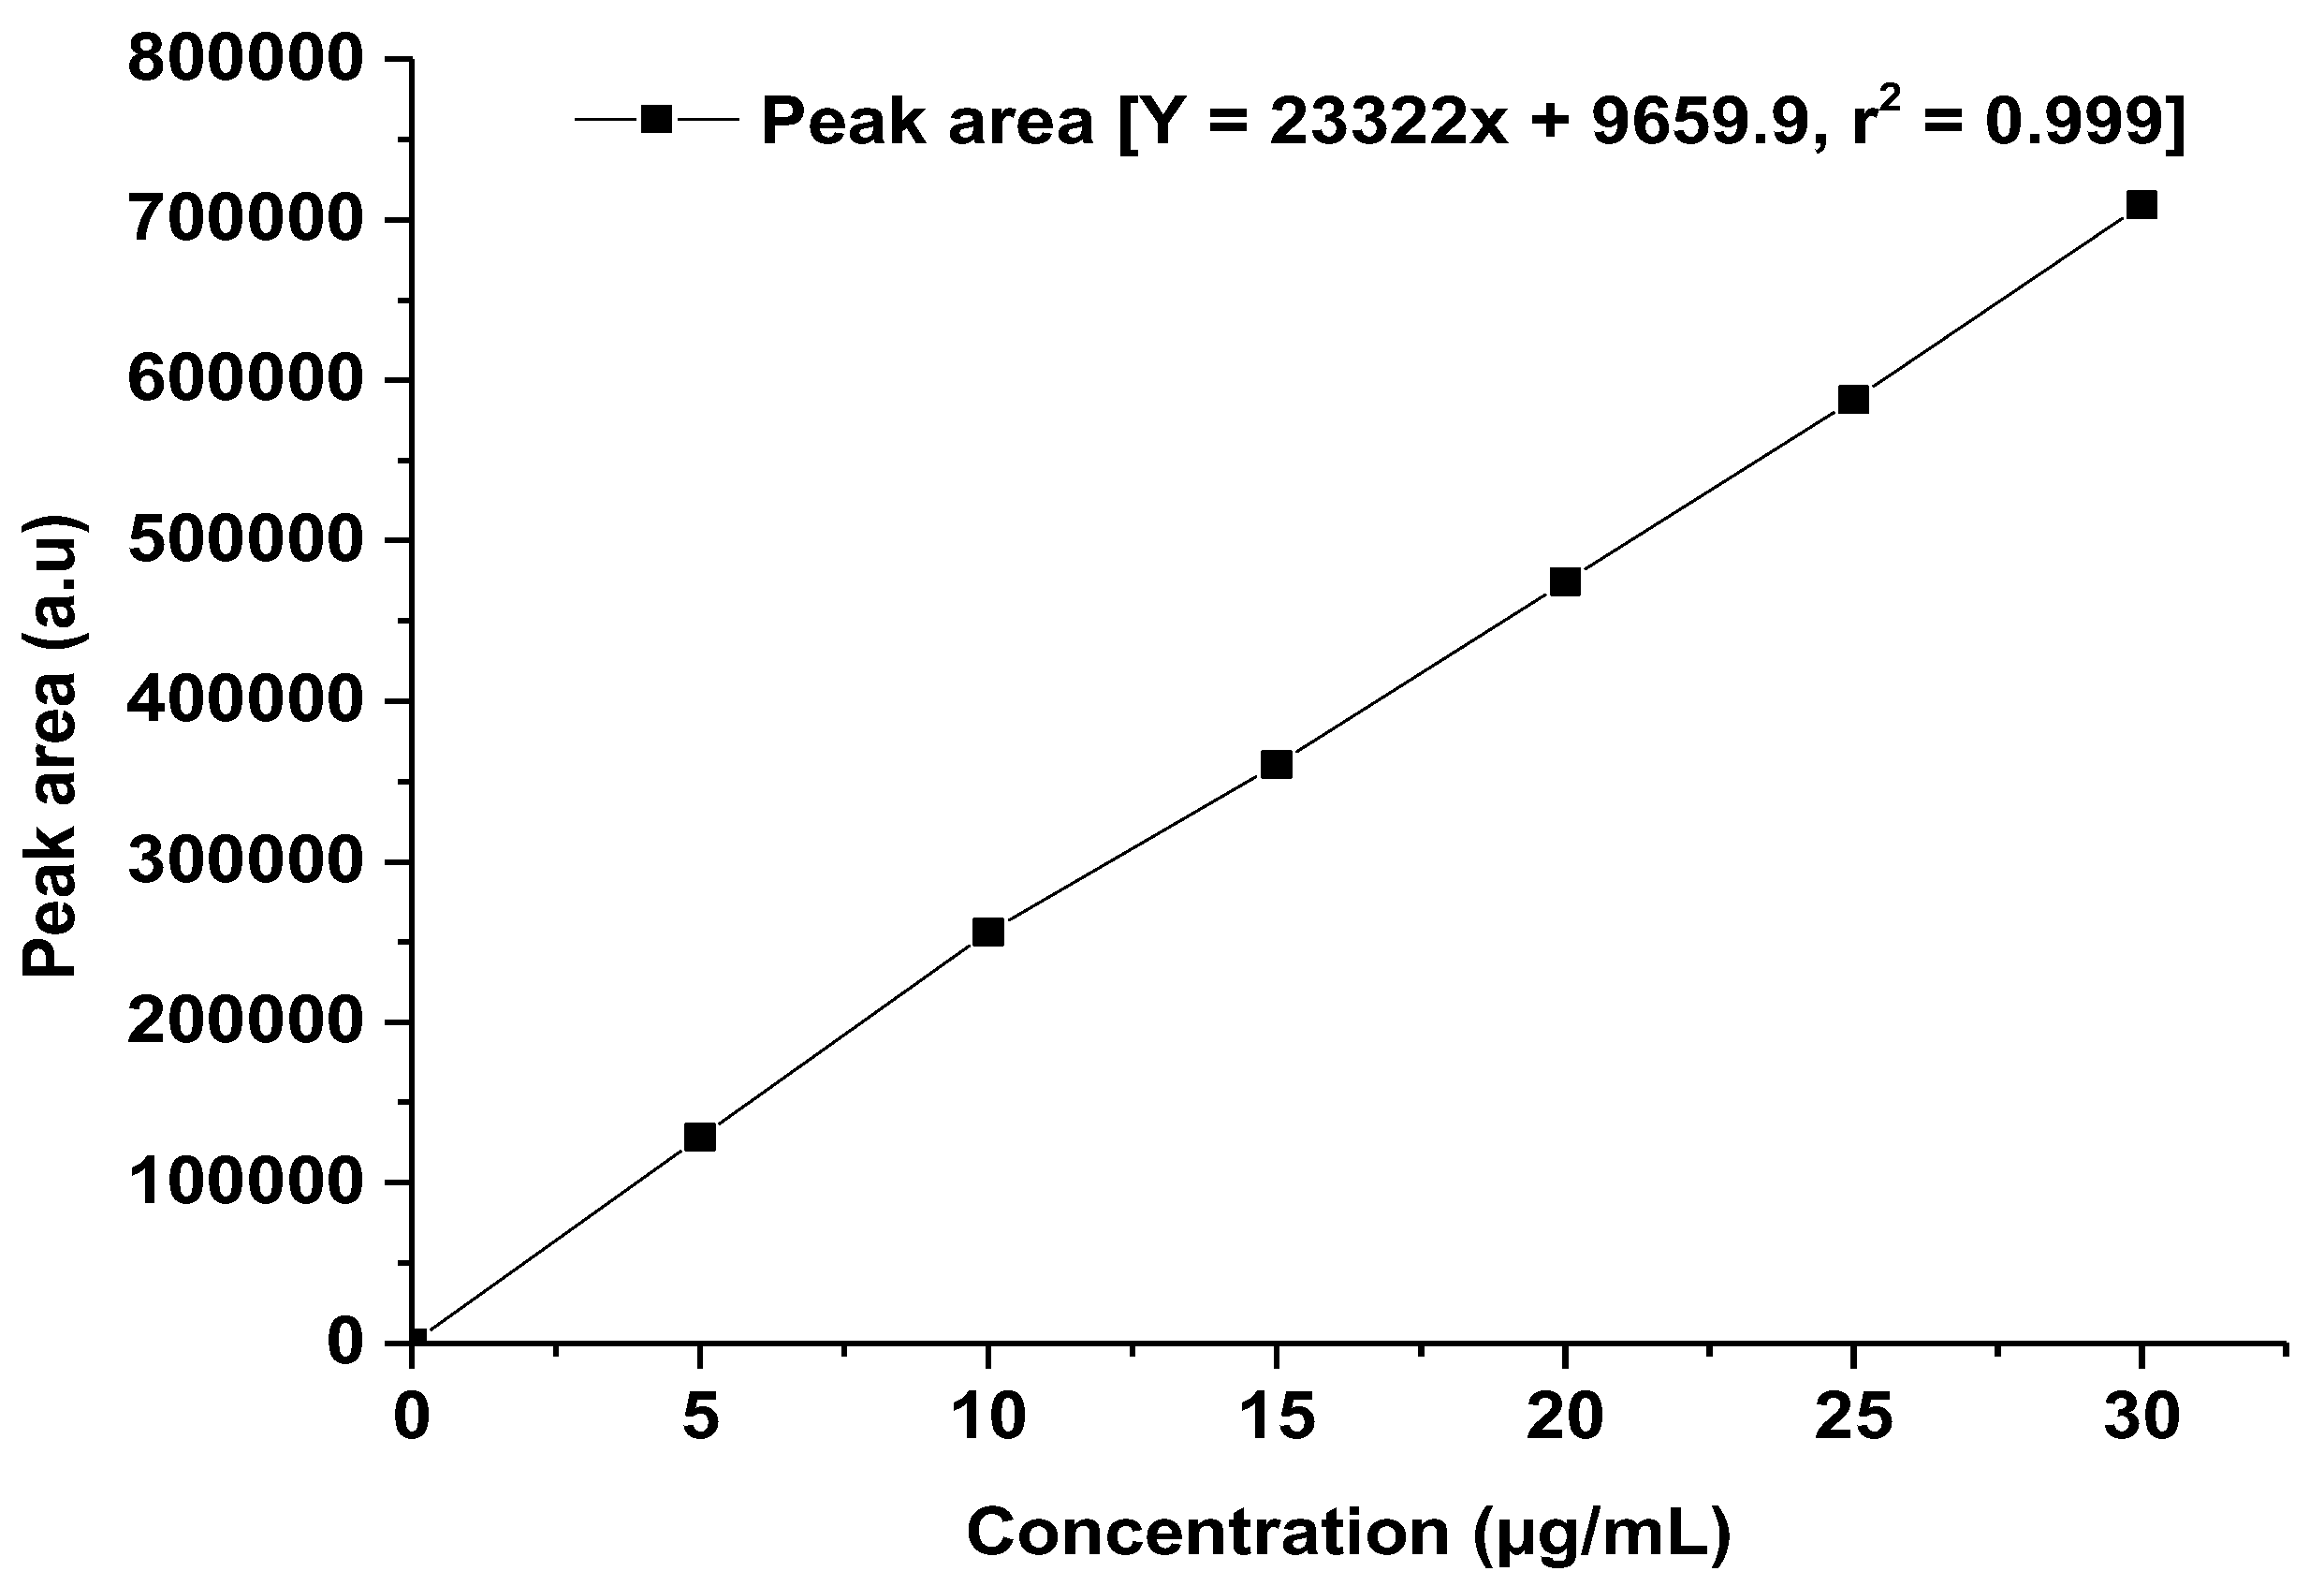
For the HPLC method development, linearity is considered a crucial criterion that evaluates the capacity of the method to yield findings, and it is exactly proportional to the analyte concentration within a certain range [14]. A robust linearity study indicated that the developed method can accurately calculate the analyte at different concentrations, which is important for consistent and reproducible methods of drug analysis. Therefore, for validation of the developed method, we consider the linearity parameter over the studied concentration range. The data and calibration curve can be found in Table 7 and Figure 7. The concentration range of standard solutions is precise compared with the method developed to detect low concentration solutions of the drug [21]. Furthermore, the LOD and LOQ values are refined over the mentioned method [21].
Table 7.
Validation parameters to estimate TOT from analyte I and analyte II.
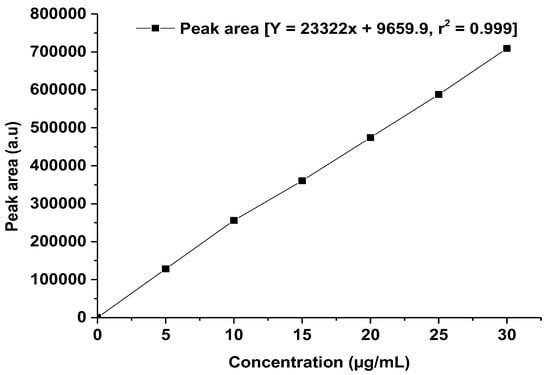
Figure 7.
Linearity curve of TOT. The graph was generated using the mean value of the peak area at each concentration using Origin Pro 14 (trial version).
4.8.2. Accuracy
In the method development using any analytical technique, accuracy is a crucial parameter for determining how close the measured values are to the true value of the analyte [23,24,25,26,27,28]. The reliability and validity of the actual drug content in samples can be quantified by this parameter. Accurate methods indicate that the obtained results or drug concentrations are the correct representation of the actual drug content present in the formulations, which is crucial for drug quality control, dosage accuracy, and regulatory compliance [28]. The outcomes of this analysis are presented in Table 7. The proposed method demonstrates accuracy in determining TOT within pharmaceutical formulations, as evidenced by its high recovery rates (ranging from 99.76% to 100.36%) and a low relative standard deviation (% R.S.D) of less than 2%.
4.8.3. Precision and Repeatability
Precision refers to the extent to which data values closely align with one another in multiple measurements conducted within consistent analytical conditions [23]. The outcomes of this evaluation are presented in Table 7.
4.8.4. Intra-Day and Inter-Day Precision
Intra-day and inter-day precision values are crucial parameters in the development of HPLC methods. Intra-day precision means evaluation of the consistency of results of multiple uses of methods within a single day, ensuring reliable performance during routine analysis. On the other hand, the reproducibility of methods over several days is known as inter-day precision assessment, indicating its stability and robustness. These parameters are crucial for confirming whether the method produces consistent and dependable results under various conditions, which is needed for regulatory approval and quality control for the integrity of findings in scientific research [23,24,25,26,27,28]. The precision within a single day was established by evaluating three distinct concentrations of TOT (10, 15, and 20 µg/mL) on three separate occasions. To gauge the variability across days, the same concentrations were tested on three different days, as discussed before. These findings demonstrate the consistency of the assay, as evidenced by the % R.S.D. values presented in Table 7, all of which are less than 2. The presence of low standard deviation underscores the method’s accuracy in quantifying TOT. The results of the precision study are summarized in Table 7.
4.8.5. Sensitivity
The sensitivity of the method is crucial in an HPLC to detect and quantify low levels of an analyte [23]. A sensitive method ensures that it can quantify low levels of analyte accurately while detecting trace impurities, monitoring low-dose drugs, and ensuring safety and efficacy [28]. The high sensitivity of the method enables its use in diverse analytical processes. Here, the sensitivity of the developed method was assessed. For TOT, the determined LOD and LOQ were 0.13 µg/mL and 0.40 µg/mL, respectively.
4.8.6. Specificity and Selectivity
The analyte must not experience any interference from additional components and should be clearly distinguished from them. The method exhibited strong selectivity, as evidenced by the absence of any interfering peaks near the retention time of TOT. Additionally, the baseline remained free from significant noise.
4.8.7. Ruggedness
The robustness under different conditions in HPLC method development, such as different instruments, operators, and environmental factors, is known as ruggedness. It indicates that the method is reproducible and reliable under these varied conditions. Assessment of the ruggedness of the HPLC method is an important step for ensuring its application in different laboratory settings, improving its reliability, and supporting consistent quality control. Considering this fact, we considered the ruggedness parameter for validation of the developed method. The outcomes are documented in Table 7.
4.8.8. System Suitability Test
System suitability testing is crucial to ensuring the quality performance of the chromatographic system. Pre-prepared solutions were subjected to testing under chromatographic conditions for this purpose. The outcomes of these tests are displayed in Table 8. The absolute peak was obtained at low retention time (3.7 min) with minimum tailing considering high “N”, as shown in Table 8.
Table 8.
A summary report of the system suitability test.
As evidenced by Table 8, the presence of multiple high theoretical plates, well-defined peak symmetry, and accurate retention time collectively demonstrate the appropriateness of the proposed approach for quantifying TOT.
4.8.9. Robustness
The ability of the method to remain unaffected by any small changes or variations in experimental conditions is known as robustness. It means that the method should be reliable and reproducible even after minor changes occur in parameters like temperature, pressure, pH, flow rate, or other environmental factors. Hence, robustness testing is important for the stability and reliability of methods in quality control processes [27,28]. Assessing the robustness is crucial for regulatory compliance and increases the overall credibility and reproducibility of the method in scientific research. Therefore, in this study, we considered this parameter for validation of the developed method. The overall summary of method validation is summarized in Table 9.
Table 9.
Results of robustness studies and validation parameters.
4.9. In Vivo Pharmacokinetic Study Using the Validated Method
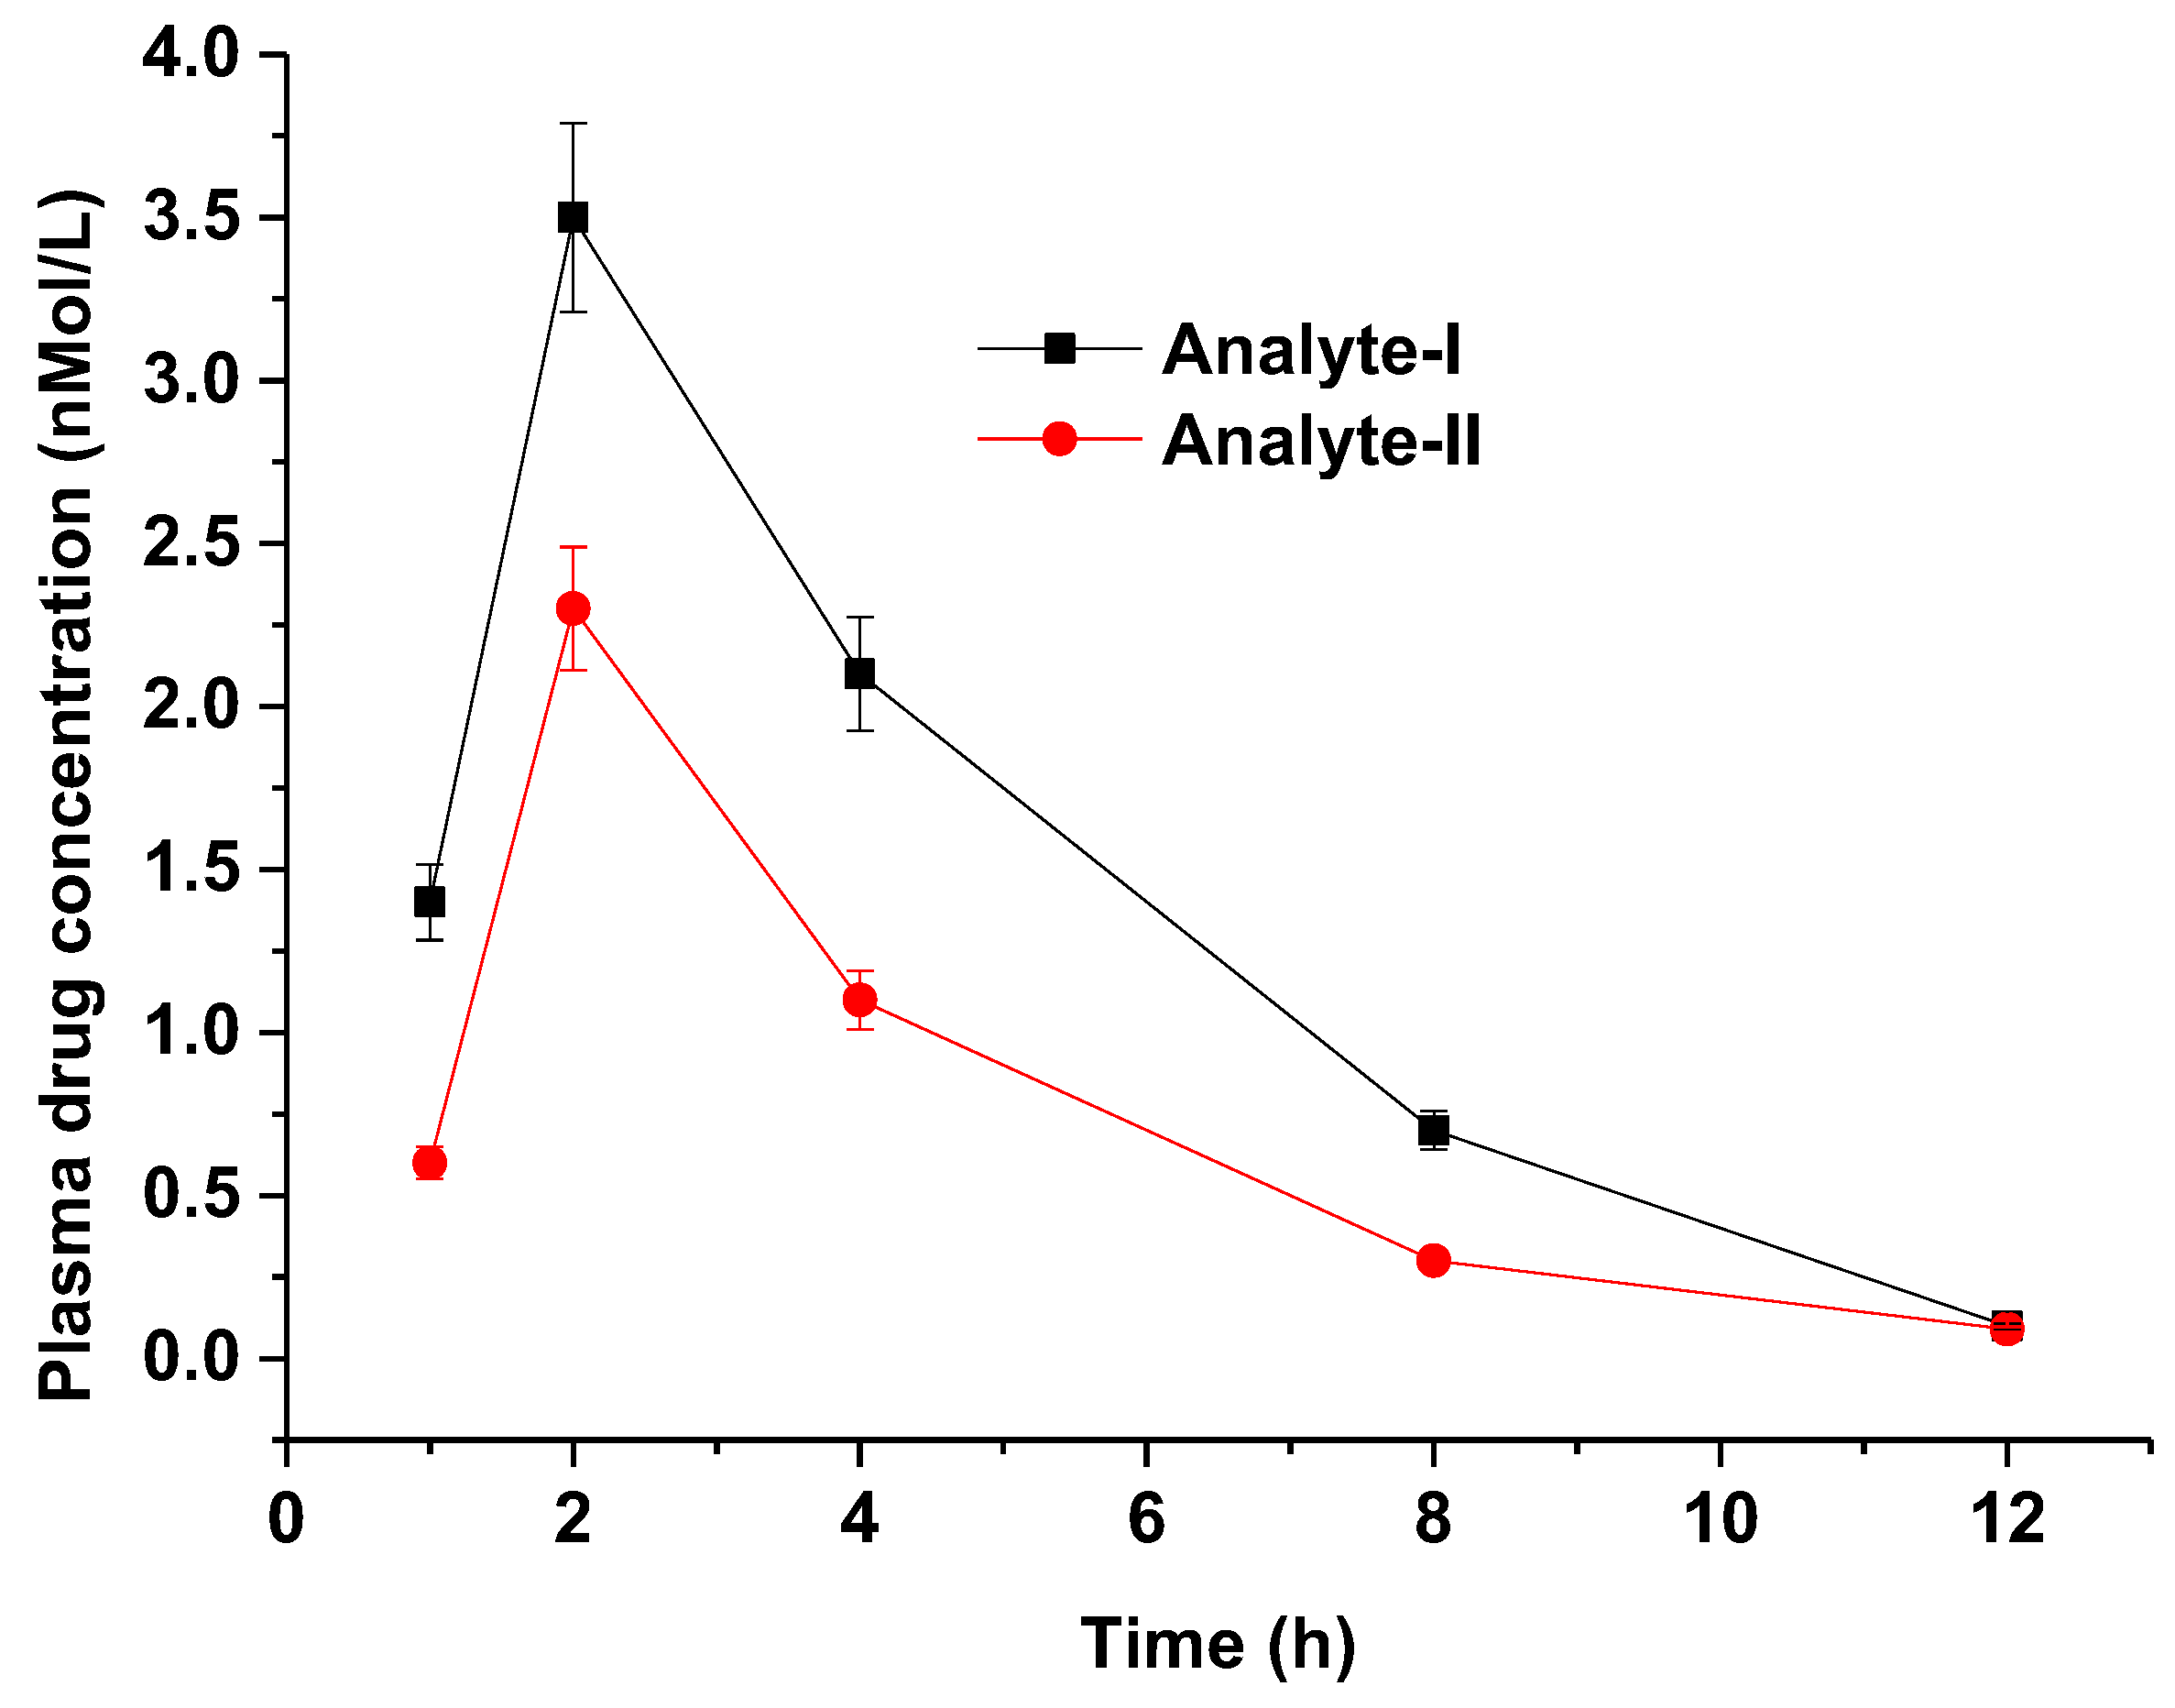
The validated method was implemented to investigate PK parameter assessment with high reproducibility, simplicity, robustness, and precision [27,28]. HSPiP- and QbD-oriented validated methods reduced the time of method validation with high accuracy and reducibility in scale-up. Representative chromatograms for analyte I and analyte II are provided in the Supplementary Materials. The plasma has a greater impact on the resolution of the drug peak. Therefore, there is a slight variation in retention time for analyte I and analyte II. The method could be a promising alternative to conventional methods for preclinical PK assessment of the explored drug in animal models such as rats [26,27,28,29]. The results are summarized in Table 10, wherein details of AUC, Cmax, Tmax, MRT, Vd, and T1/2 are tabulated for analyte I (pure active pharmaceutical ingredient as API) and analyte II (powdered form of tablet) at the same dosing strength (oral). Figure 8 portrays the relative plasma drug concentration time profile for both analytes in rats. The values of AUC and Cmax were relatively high in analyte I, which may be attributed to the solution nature of the formulation (API) compared with the suspension (tablet transformed into suspension). It is apparent from Table 10 that analyte I exhibited a rapid drug elimination rate (1.8 h) compared with analyte II (2.1), which is in good agreement with the reported findings [26,27]. Validation parameters suggested that the analytical method was quite precise, accurate, reproducible, and reliable compared with expensive methods [30,31]. The adopted method was simple, rapid, and sensitive by implementing HSPiP and QbD techniques as alternative tools of process optimization (critical process attributes) [21].
Table 10.
Summary of PK parameters after in vivo study in rat model for analyte I and analyte II.
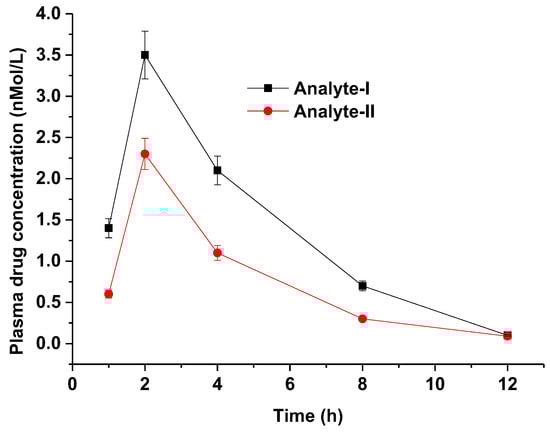
Figure 8.
Plasma drug concentration time profile of analyte I and analyte II in rats after oral administration (n = 3, mean ± standard deviation). The graph was generated using Origin Pro 9.0 software (trial version, One Roundhouse Plaza, Northampton, MA, USA).
5. Challenges and Future Prospects: Limitations and Advantages
Several reports have been published for methodologies to estimate tolterodine tartrate from biological (plasma) and non-biological samples [29,32,33,34,35,36,37], including HPLC, UPLC, LC-MS/MS, and others [32,33,34,35,36,37]. Most of these reported retention time below 10 min. These methods are advantageous over spectrophotometers due to high sensitivity, high detection, efficient techniques, and accuracy [32,33]. However, there are certain limitations in the techniques, such as the lack of limited data available for reproducibility using biological samples or matrices (urine and plasma). Few methods have been reported for green techniques to avoid ecofriendly constraints. Chiral HPLC methods still need to be explored for the drug, coupled with advanced techniques [35]. No data are available for ultra technique-based methods of estimation. Most of the methods are expensive (mass spectroscopy) and challenging to the ecosystem (involving methanol and acetonitrile). It is quite critical and complex to develop solid-phase extraction methods for biological samples. The conventional HPLC method is associated with large consumption of organic solvent, large waste production, maximum matrix interference, intensive time for optimization, and high variability. Supplementary Table S1 provides details of the various methods and their advantages and limitations [32,33,34,35,36,37].
6. Conclusions
Based on the results obtained from HSPiP, QbD, and validation parameters, it is quite convincing to conclude that the developed method can be promising to analyze drug samples with in vitro and in vivo assessments with high accuracy, specificity, robustness, and reproducibility. The conventional analytical method of TOT estimation from biological samples is associated with a few limitations, such as lack of accuracy, reproducibility, and cost-effectiveness; tediousness; and low sensitivity. Therefore, there has been increasing demand for an alternative quantitative methodology to overcome the aforementioned issues. Currently, HSPiP and QbQ have been well explored for the drug with high robustness in analytical methods and alternatives to conventional approaches. HSPiP reduced the preliminary screening stage of the solvent for analytical purposes, whereas QbD identified the optimal level of the critical material attributes for the mobile phase preparation. High desirability suggested the best fit of the model adopted for optimization. An RP-HPLC technique was developed and validated to quantify TOT levels in both bulk substances (analyte I) and tablet forms (analyte II). The method exhibits higher precision, accuracy, robustness, and system suitability. Its application is consistent with the systematic assessment of TOT within pharmaceutical compounds and in vivo pharmacokinetic parameter assessment. Furthermore, the method demonstrated high sensitivity, selectivity, and reproducibility. Moreover, the developed approach remains suitable for the routine evaluation of TOT content within its designated pharmaceutical compositions as well as in in vivo drug estimation in preclinical studies.
Supplementary Materials
The following supporting information can be downloaded at: https://www.mdpi.com/article/10.3390/pr12102164/s1, Figure S1: (A) A representative image of chromatogram of analyte I in the rat plasma and (B) chromatogram of analyte II in the rat plasma; Table S1: Advantages and limitations of HPLC in the estimation of tolterodine tartrate published so far.
Author Contributions
Conceptualization, T.P.; methodology, M.U.M.S. and M.S. (Madhav Shelke); validation, M.R.; investigation, M.U.M.S. and M.S. (Mudassar Shahid); resources, M.R.; data curation, M.P.; writing—original draft preparation, M.R.; writing—review and editing, M.S. (Mudassar Shahid). All authors have read and agreed to the published version of the manuscript.
Funding
Authors are thankful to the Researchers Supporting Project number (RSPD2024R1005), King Saud University, Riyadh, Saudi Arabia, for supporting this work.
Institutional Review Board Statement
The study was conducted according to the guidelines of the Declaration of Helsinki and approved by the Institutional Review Board (or Ethics Committee) of the Department of Institutional Ethical Committee SVKM-IOP/IAEC/2023/Octo/15 and by the Institute Animal Ethics Committee of SVKM’s Institute of Pharmacy, Dhule, Maharashtra, India and approved for the study as per ARRIVE guidelines. The protocol was followed as per ARRIVE guidelines.
Data Availability Statement
Data will be provided on relevant request.
Acknowledgments
The authors extend their appreciations to the Researchers Supporting Project number (RSPD2024R1005), King Saud University, Riyadh, Saudi Arabia, for supporting this work.
Conflicts of Interest
The authors report no conflicts of interest.
References
- Shaik, R.P.; Puttagunta, S.B.; Kothapalli, C.B.; Awen, B.Z.S.; Challa, B.R. A validated LC–MS/MS method for the determination of tolterodine and its metabolite in rat plasma and application to pharmacokinetic study. J. Pharm. Anal. 2013, 3, 489–499. [Google Scholar] [CrossRef] [PubMed]
- Jones, L.H.; Randall, A.; Napier, C.; Trevethick, M.; Sreckovic, S.; Watson, J. Design and synthesis of a fluorescent muscarinic antagonist. Bioorg. Med. Chem. Lett. 2008, 18, 825–827. [Google Scholar] [CrossRef] [PubMed]
- Leone Roberti Maggiore, U.; Salvatore, S.; Alessandri, F.; Remorgida, V.; Origoni, M.; Candiani, M.; Venturini, P.L.; Ferrero, S. Pharmacokinetics and toxicity of antimuscarinic drugs for overactive bladder treatment in females. Expert Opin. Drug Metab. Toxicol. 2012, 8, 1387–1408. [Google Scholar] [CrossRef] [PubMed]
- Brynne, N.; Stahl, M.M.; Hallén, B.; Edlund, P.O.; Palmér, L.; Höglund, P.; Gabrielsson, J. Pharmacokinetics and pharmacodynamics of tolterodine in man: A new drug for the treatment of urinary bladder overactivity. Int. J. Clin. Pharmacol. Ther. 1997, 35, 287–295. [Google Scholar]
- Available online: https://www.caymanchem.com/product/15027 (accessed on 10 November 2023).
- Xia, Z.L.; Chen, Z.Y.; Yao, T.W. An enantio-specific HPLC method for the determination of (S)-enantiomer impurities in (R)-tolterodine tartarate. Die Pharm.-Int. J. Pharm. Sci. 2007, 62, 170–173. [Google Scholar]
- Prakash, L.; Himaja, M.; Subbaiah, B.V.; Vasudev, R.; Srinivasulu, C.; Haribabu, R. Isolation, identification, and characterization of degradant impurities in Tolterodine tartrate formulation. J. Pharm. Biomed. Anal. 2014, 90, 215–221. [Google Scholar] [CrossRef]
- Rao, T.N.; Hussain, I.; Prashanthi, Y.; Patrudu, T.B. Forced degradation study for tolterodine by HPLC with PDA detection. Asian J. Pharm. Anal. 2019, 9, 77–81. [Google Scholar] [CrossRef]
- Patil, V.K.; Belsare, D. Development and evaluation of novel drug delivery system of tolterodine tartrate. Int. J. Appl. Pharm. 2017, 9, 29–32. [Google Scholar] [CrossRef]
- Swart, R.; Koivisto, P.; Markides, K.E. Capillary solid-phase extraction-tandem mass spectrometry for fast quantification of free concentrations of tolterodine and two metabolites in ultrafiltered plasma samples. J. Chromatogr. B Biomed. Sci. Appl. 1999, 736, 247–253. [Google Scholar] [CrossRef]
- Swart, R.; Koivisto, P.; Markides, K.E. Column switching in capillary liquid chromatography-tandem mass spectrometry for the quantitation of pg/ml concentrations of the free basic drug tolterodine and its active 5-hydroxymethyl metabolite in microliter volumes of plasma. J. Chromatogr. A 1998, 828, 209–218. [Google Scholar] [CrossRef]
- Malik, A.; Khan, T.; Siddique, M.U.M.; Faruk, A.; Sood, A.K.; Bhat, Z.R. HSPiP, Computational, and Thermodynamic Model–Based Optimized Solvents for Subcutaneous Delivery of Tolterodine Tartrate and GastroPlus-Based In Vivo Prediction in Humans: Part I. AAPS PharmSciTech 2024, 25, 93. [Google Scholar] [CrossRef] [PubMed]
- Khan, T.; Hussain, A.; Siddique, M.U.M.; Altamimi, M.A.; Malik, A.; Bhat, Z.R. HSPiP, Computational, and Thermodynamic Model–Based Optimized Solvents for Subcutaneous Delivery of Tolterodine Tartrate and GastroPlus-Based In Vivo Prediction in Humans: Part II. AAPS PharmSciTech 2024, 25, 160. [Google Scholar] [CrossRef] [PubMed]
- Joshi, H.V.; Shah, U.A.; Patel, J.K.; Patel, T.R. Development and validation of stability indicating method for the simultaneous estimation of tamsulosin HCl and tolterodine tartrate in the pharmaceutical dosage form. Asian J. Pharm. Anal. 2019, 9, 205–209. [Google Scholar] [CrossRef]
- Available online: https://www.ich.org/page/quality-guidelines (accessed on 12 February 2024).
- Hansen, C.M. Hansen Solubility Parameters: A User’s Handbook, 2nd ed.; CRC Press: Boca Raton, FL, USA; Taylor Francis Group: Boca Raton, FL, USA, 2007; p. 544. [Google Scholar]
- Mihalovits, M. Determination of the Hansen solubility parameters from solubility data using an improved evaluation approach, the concentric spheroids method. J. Mol. Liq. 2022, 364, 119911. [Google Scholar] [CrossRef]
- Ribar, D.; Rijavec, T.; Cigić, K.I. An exploration into the use of Hansen solubility parameters for modelling reversed-phase chromatographic separations. J. Anal. Sci. Technol. 2022, 13, 1–9. [Google Scholar] [CrossRef]
- Alshehri, S.; Imam, S.S.; Hussain, A.; Altamimi, M.A. Formulation of Piperine Ternary Inclusion Complex Using β CD and HPMC: Physicochemical Characterization, Molecular Docking, and Antimicrobial Testing. Processes 2020, 8, 1450. [Google Scholar] [CrossRef]
- Alshehri, S.; Alanazi, A.; Elzayat, E.M.; Altamimi, M.A.; Imam, S.S.; Hussain, A.; Alqahtani, F.; Shakeel, F. Formulation, In Vitro and In Vivo Evaluation of Gefitinib Solid Dispersions Prepared Using Different Techniques. Processes 2021, 9, 1210. [Google Scholar] [CrossRef]
- Kumar, C.B.; Narayanan, B.L.; Chandrasekar, M.; Malairajan, P.; Kumar, E.P. Development and Validation of RP-HPLC Method for the Quantitative Estimation of Tolterodine Tartrate in Capsule Formulation. RGUHS J. Pharm. Sci. 2013, 3, 58–64. [Google Scholar]
- Abdullahu, F.; Zhujani, F.; Todorov, G.; Kamberov, K. An Experimental Analysis of Taguchi-Based Gray Relational Analysis, Weighted Gray Relational Analysis, and Data Envelopment Analysis Ranking Method Multi-Criteria Decision-Making Approaches to Multiple-Quality Characteristic Optimization in the CNC Drilling Process. Processes 2024, 12, 1212. [Google Scholar] [CrossRef]
- Yanamandra, R.; Vadla, C.S.; Puppala, U.; Patro, B.; Murthy, Y.L.N.; Ramaiah, P.A. A New Rapid and Sensitive Stability-Indicating UPLC Assay Method for Tolterodine Tartrate: Application in Pharmaceuticals, Human Plasma and Urine Samples. Sci. Pharm. 2012, 80, 101–114. [Google Scholar] [CrossRef]
- van Deemter, J.J.; Zuiderweg, F.J.; Klinkenberg, A. Longitudinal diffusion and resistance to mass transfer as causes of non ideality in chromatography. Chem. Eng. Sci. 1956, 5, 271–289. [Google Scholar] [CrossRef]
- Ji, Y.S.; Kim, I.S.; Kon, T.; Hyun, Y.H. Plasma concentration profile of tolterodine and 5-hydroxymethyl tolterodine following transdermal administration of tolterodine in rats. Pharmazie 2018, 73, 375–378. [Google Scholar]
- Ananchenko, G.; Novakovic, J. Tolterodine Tartrate. In Profiles of Drug Substances, Excipients and Related Methodology; Academic Press: Cambridge, MA, USA, 2017; Volume 42, pp. 339–403. [Google Scholar]
- Urvi, S.; Nilesh, P.; Ashok, P.; Amit, V.; Ajay, P. Stability Indicating RP-HPLC Method Development and Validation of Tolterodine Tartrate and its Degradant in its Capsule Dosage Form. J. Pharm. Sci. Res. 2017, 9, 1549–1554. [Google Scholar]
- Påhlman, I.; Kankaanranta, S.; Palmér, L. Pharmacokinetics of Tolterodine, a Muscarinic Receptor Antagonist, in Mouse, Rat and Dog. Arzneimittelforschung 2011, 51, 134–144. [Google Scholar] [CrossRef]
- Sun, F.; Sui, C.; Zhou, Y.; Liu, X.; Shi, Y.; Wu, Y.; Li, Y. Preparation, characterization and pharmacological evaluation of tolterodine hydrogels for the treatment of overactive bladder. Int. J. Pharm. 2013, 454, 532–538. [Google Scholar] [CrossRef]
- Komarov, T.N.; Karnakova, P.K.; Archakova, O.A.; Shchelgacheva, D.S.; Bagaeva, N.S.; Shohin, I.E.; Zaslavskaya, K.Y.; Bely, P.A. Simultaneous determination of nirmatrelvir and ritonavir in human plasma by HPLC-MS/MS. Drug Dev. Regist. 2023, 12, 135–145. [Google Scholar] [CrossRef]
- Filonova, U.D.; Karnakova, P.K.; Karnakova, K.K.; Popova, M.O.; Popova, A.A.; Archakova, O.A.; Komarov, T.N.; Shohin, I.E. Development and validation of an HPLC-MS/MS method for quantification of apixaban in human plasma. Drug Dev. Regist. 2024, 13, 224–240. [Google Scholar] [CrossRef]
- Palmér, L.; Andersson, L.; Andersson, T.; Stenberg, U. Determination of tolterodine and the 5-hydroxymethyl metabolite in plasma, serum and urine using gas chromatography-mass spectrometry. J. Pharm. Biomed. Anal. 1997, 16, 155–165. [Google Scholar] [CrossRef]
- Madhavi, A.; Reddy, G.S.; Suryanarayana, M.V.; Naidu, A. Development and Validation of a New Analytical Method for the Determination of Related Components in Tolterodine Tartarate Using LC. Chromatographia 2008, 68, 399–407. [Google Scholar] [CrossRef]
- Saxena, V.; Zaheer, Z.; Farooqui, M. Stability-indicating HPLC determination of tolterodine tartrate in pharmaceutical dosage forms. Indian J. Chem. Technol. 2006, 13, 242–246. [Google Scholar]
- Kumar, Y.R.; Ramulu, G.; Vevakanand, V.V.; Vaidyanathan, G.; Srinivas, K.; Kumar, M.K.; Mukkanti, K.; Reddy, M.S.; Venkatraman, S.; Suryanarayana, M.V. A validated chiral HPLC method for the enantiomeric separation of tolterodine tartarate. J. Pharm. Biomed. Anal. 2004, 35, 1279–1285. [Google Scholar] [CrossRef] [PubMed]
- Prakash, L.; Himaja, M.; Vasudev, R. Isolation, Identification, and Characterisation of Degradation Products and the Development and Validation of a Stability-Indicating Method for the Estimation of Impurities in the Tolterodine Tartrate Formulation. Sci. Pharm. 2015, 83, 65–83. [Google Scholar] [CrossRef] [PubMed]
- Zhang, B.; Zhang, Z.; Tian, Y.; Xu, F. High performance liquid chromatography-electrospray ionization mass spectrometric determination of tolterodine tartrate in human plasma. J. Chromatogr. B 2005, 824, 92–98. [Google Scholar] [CrossRef] [PubMed]

Disclaimer/Publisher’s Note: The statements, opinions and data contained in all publications are solely those of the individual author(s) and contributor(s) and not of MDPI and/or the editor(s). MDPI and/or the editor(s) disclaim responsibility for any injury to people or property resulting from any ideas, methods, instructions or products referred to in the content. |
© 2024 by the authors. Licensee MDPI, Basel, Switzerland. This article is an open access article distributed under the terms and conditions of the Creative Commons Attribution (CC BY) license (https://creativecommons.org/licenses/by/4.0/).