Article

Effect of Sewage Sludge Addition on the Co-Combustion Characteristics of Municipal Solid Waste Incineration

1
Shenzhen Energy Environment, Co., Ltd., Shenzhen 518055, China
2
Real Estate Branch of Shenzhen Energy Group Co., Ltd., Shenzhen 518055, China
3
School of Architecture and Traffic, Guilin University of Electronic Technology, Guilin 541004, China
4
National Engineering Laboratory for High-Efficiency Recovery of Refractory Nonferrous Metals, School of Metallurgy and Environment, Central South University, Changsha 410083, China
*
Authors to whom correspondence should be addressed.
Processes 2024, 12(10), 2172; https://doi.org/10.3390/pr12102172 (registering DOI)
Submission received: 16 August 2024 / Revised: 29 September 2024 / Accepted: 3 October 2024 / Published: 6 October 2024
(This article belongs to the Section Environmental and Green Processes)

Abstract

:
This study employs a numerical computation model based on a municipal solid waste (MSW) incinerator in Nanning to investigate the impact of different sewage sludge (SS) co-combustion ratios and MSW incinerator temperatures on combustion efficiency. Using the FLUENT simulation method, this study systematically analyzes the distribution characteristics of the temperature field, velocity field, and pollutant concentration field within the furnace under various SS mixing ratios (5%, 7%, 10%, and 15%) and MSW incinerator temperatures (800 K, 1000 K, and 1200 K). The simulation results indicate that the combustion efficiency was optimal at an MSW incinerator temperature of 800 K, where the co-combustion of SS with MSW mixed effectively, leading to a stable and efficient combustion process. Furthermore, an SS co-combustion ratio of 7% was identified as the most effective in maintaining high combustion efficiency. These findings contribute to the optimization of co-combustion strategies for MSW and SS, enhancing both operational efficiency and environmental compliance.

1. Introduction

With the continuous growth of the global population and the rapid acceleration of urbanization, municipal solid waste (MSW) and sewage sludge (SS) have increasingly emerged as significant challenges for urban management and environmental protection. Various methods exist for managing MSW. Among these methods, incineration has been widely adopted globally as an effective technique for waste reduction, harmless disposal, and recycling waste [1]. This technology can not only effectively treat environmentally harmful waste and reduce environmental pressure but also recover heat energy from the incineration process and realize energy reuse [2]. However, the incineration process still faces many challenges, including improving combustion efficiency, controlling waste gas emissions, and handling and utilizing ash [3]. Therefore, in-depth research and the continuous improvement of incineration technology are crucial, which will not only help optimize the existing waste treatment process and improve resource recovery efficiency, but also play a far-reaching role in reducing environmental pollution and promoting the waste management industry to develop in a more sustainable direction.
Similarly, the treatment and disposal of SS, a by-product rich in organic matter and nutrients, must be addressed [4]. In recent years, the co-combustion of SS has gradually attracted attention to optimize waste incineration technology [5]. Sewage sludge, particularly that from municipal sewage treatment plants, contains substantial organic matter and numerous combustible components. These organic components can release heat during combustion, provide additional energy support, and have significant potential value in incineration [6]. At the same time, MSW usually contains organic materials such as paper, plastic, and food residues, which have a high calorific value and can maintain high temperatures during incineration. By mixing the incineration of SS and garbage or MSW, the organic components of the two materials can promote each other and improve the overall combustion efficiency, optimizing energy utilization while reducing the resources and costs required to treat SS separately [4]. In 1997, scholars such as Werther J. and Ogada T. [7] proposed that SS combustion is a crucial technical method for treating SS. They systematically summarized the formation mechanisms, treatment processes, disposal strategies, pyrolysis processes, and emission characteristics of the co-combustion of SS and MSW and advocated for the adoption of this co-combustion scheme. Subsequently, the technology for SS and MSW co-combustion was developed [8]. This technology aims to achieve the synergistic treatment of SS and MSW through their co-combustion, thereby enhancing energy utilization efficiency and reducing environmental pollution [9]. Specifically, the organic matter in SS is converted into heat energy at high temperatures, which not only improves the thermal efficiency of the incinerator but also reduces dependence on fossil fuels and facilitates energy recycling. Additionally, heavy metals in SS can be stabilized at high temperatures, thereby reducing their environment mobility.
Numerical simulation is a widely adopted and effective research method in the field of co-combustion. This methodology can idealize the physical processes and chemical reactions in engineering design, significantly reducing the workload and experimental costs in engineering operations. Numerous studies have utilized numerical simulation to analyze the temperature field, velocity field, and pollutant concentration field during incineration. In terms of sludge mixing, Wang et al. [10] found that there is a synergistic effect in the mixing of biomass and sludge, and mixing is beneficial to improving combustion and emission characteristics. Lin et al. [11] employed ANSYS-FLUENT to simulate the mixed combustion process of MSW and SS in an MSW incinerator and investigated the effect of the SS mixing ratio on the velocity field, temperature field and pollutant concentration field, including CO and NOx, during incineration. Lin et al. [12] found that 10% wet sludge or 20% semi-dry sludge co-incineration with municipal solid waste was acceptable.
This study employs computational fluid dynamics (CFD) technology to simulate the combustion and heat transfer processes with municipal solid waste in an incinerator [13]. By developing a model of the research object, the eddy dissipation model (EDM) is employed to simulate turbulent combustion. Integrating the operating simulation results, this study examines the impact of SS co-combustion on the stable operation of the MSW incinerator by adjusting various operational parameters and the SS co-combustion ratio. This study analyzes the optimal blending mode to achieve the most effective synergistic incineration results.

2. Materials and Methods

2.1. Numerical Simulation Method

In this study, we focused on the co-combustion of SS and MSW, which involved both gas-phase and solid-phase combustion. To accurately simulate this process, we employed ANSYS software to develop a detailed model of the MSW incinerator [14]. We employed FLIC software to simulate the thermal and mass exchange processes occurring on the grate, including moisture evaporation, devolatilization, volatile combustion, and char combustion [15]. Subsequently, the solid-phase combustion results obtained from FLIC were applied as boundary conditions in FLUENT software for the simulation of gas-phase combustion. The simulation was coupled iteratively until the residuals indicated no significant changes with additional iterations, demonstrating that the results had converged and met the desired accuracy.
This study employs a solution to mass and momentum conservation equations, as well as heat conduction and compressible fluid equations. Additionally, based on specific requirements, radiation transfer equations, multiphase flow equations, and chemical reaction equations are incorporated into the model. To simulate the turbulent motion within the MSW incinerator, the standard k-ε turbulence model is utilized [16]. Moreover, the P-1 radiation model is employed to simulate the radiation heat transfer process in the fluid flow. Concurrently, the eddy dissipation model is selected to model the turbulent chemical reaction process [17].
Based on the actual structural dimensions of the grate furnace of the waste incinerator, this study employed ANSYS software to construct a detailed three-dimensional model and mesh it. During the meshing process, key areas such as the bed gas-phase inlet and secondary air nozzle were locally densified. The final grid count for the entire furnace was approximately 32,889. Following rigorous grid quality inspections and relevance testing, it was confirmed that the grid model was of high quality and capable of accurately simulating the combustion process within the furnace. Furthermore, the stability of the simulation results was also verified, and it was observed that the results remained stable, even with further mesh refinement.
In the simulation of the gas-phase combustion of MSW and sewage sludge, the model is simplified into a coal–hv–volatiles–air model to facilitate the integration of specific data into our calculation model. To accurately simulate the combustion environment, the model was configured as follows:
(1)
The inlet of the model is set as a closed adiabatic wall to isolate the influence of the external environment on the combustion process.
(2)
Gravity acceleration is set to 9.81 m/s2 to simulate the influence of the Earth’s gravity field on the combustion process.
(3)
The primary air inlet of the incinerator is assumed to be a fluid feed inlet for introducing a mixture of fuel and air. The wall temperature of the incinerator was set to 800 K, representing the furnace combustion temperature, and simulated the initial thermal state within the furnace.
(4)
The secondary air inlet of the incinerator is set as the inlet vent to provide additional air required for combustion and ensure the completion of the combustion process.
(5)
The furnace height is based on the actual incinerator design to ensure the accuracy of the simulation results.
(6)
The flue outlet of the MSW incinerator is set as the outflow boundary to simulate the exhaust process of the flue gas generated by combustion. The return flue gas temperature is set to 800 K to simulate the circulation and heat exchange of the flue gas in the furnace.
(7)
The slag discharge port is also set as a closed adiabatic wall to prevent heat loss and the ingress of impurities.
(8)
The incineration products of MSW and SS are simplified to CO2, O2, H2, and N2, while gaseous pollutants produced by small amounts of elements such as sulfur and nitrogen are ignored.

2.2. Models and Computational Conditions

This study analyzes a 750 t/d waste incineration power generation grate furnace independently developed by China, with a furnace depth of 14.6 m and an incinerator height of 40.2 m. The structural diagram of the MSW incinerator is shown in Figure 1. The rated steam pressure is 5.0 MPa, and the rated steam temperature is 673 K. The length of the MSW incinerator is 27.56 m, the grate length is 13.46 m, the grate inclination is about 15°, and the grate’s moving speed is 7.2 m per hour, which remains constant to fulfill industrial requirements. Given the complexity of the MSW incinerator’s actual structure, which includes numerous components and details, it is simplified during the simulation process to better capture its essential characteristics.
The air required for fuel combustion comprises primary air and secondary air. By optimizing air distribution, emissions can be significantly reduced. The research of [18] shows that optimizing the ratio of primary air and second air can improve combustion efficiency. Specifically, multiple studies have confirmed that a 7:3 ratio between primary air and second air significantly improves the completeness of combustion. The primary air is introduced through the four-stage grate, while the secondary air is supplied via ports located on the left and right sides of the furnace’s midsection, with an air volume distribution ratio of 7:3. Once heated by the air preheater, the primary air reaches a temperature of 433.15 K, with the total air volume designed to be 105,050 m3/h to ensure an adequate oxygen supply within the furnace. The total volume of secondary air is set to be 1365 m3/h, with a temperature of 293.14 K, providing supplementary oxygen to improve combustion efficiency.

2.3. Materials

In this study, the compositional analyses of municipal solid waste (MSW) and sewage sludge (SS) referred to the findings of [19]. The density of SS is much higher than that of MSW. The ultimate analysis reveals the concentration of key elements in the fuel, including C, H, O, S, and N (Table 1). The relative proportions of these elements significantly influence the composition and emission characteristics of the combustion products. For instance, high sulfur content in the fuel results in increased SO2 emissions, while high nitrogen content can lead to higher NOx formation [20]. Fuels with higher volatile content tend to release more volatile substances during the initial combustion phase, potentially causing excessive emissions of organic pollutants and particulate matter [21]. Fuels with higher fixed carbon content typically burn more efficiently but may also result in higher soot emissions [22]. Fuels with high ash content lead to increased slag production, subsequently impacting furnace operating efficiency [23]. Fuels with high moisture content may reduce combustion efficiency and affect the formation and emission of gaseous pollutants as water evaporation decreases the local oxygen concentration, thereby affecting the combustion reaction [24]. In practical engineering applications, the SS co-combustion ratio largely depends on the characteristics and LHV of both the SS and the MSW. An excessively high SS co-combustion ratio can result in decreased combustion stability, and the SS co-combustion may not meet the disposal requirements for SS in engineering applications.
When exploring the co-combustion of MSW and SS, it is essential to understand the fundamental thermal characteristics of these two fuels. The MSW has a lower LHV of approximately 7574 J/g, while the SS has an even lower LHV, about 4748 J/g. This significant difference implies that their heat release and combustion characteristics will differ when combusted together. The lower heating value means that the sludge releases less energy during combustion, which may result in more MSW being required to maintain the combustion temperature during co-combustion. An increased proportion of SS can result in a reduction in the overall heating value of the fuel within the furnace, potentially diminishing combustion performance. This reduction in combustion efficiency can adversely impact not only the combustion performance but also the temperature distribution within the furnace and the quality of emissions. However, an excessively low co-combustion ratio may not satisfy the required disposal volume for SS. Therefore, it is crucial to achieve a balance between the SS co-combustion ratio and the required disposal volume.

3. Results and Discussion

3.1. Co-Combustion of SS and MSW at Different Ratios

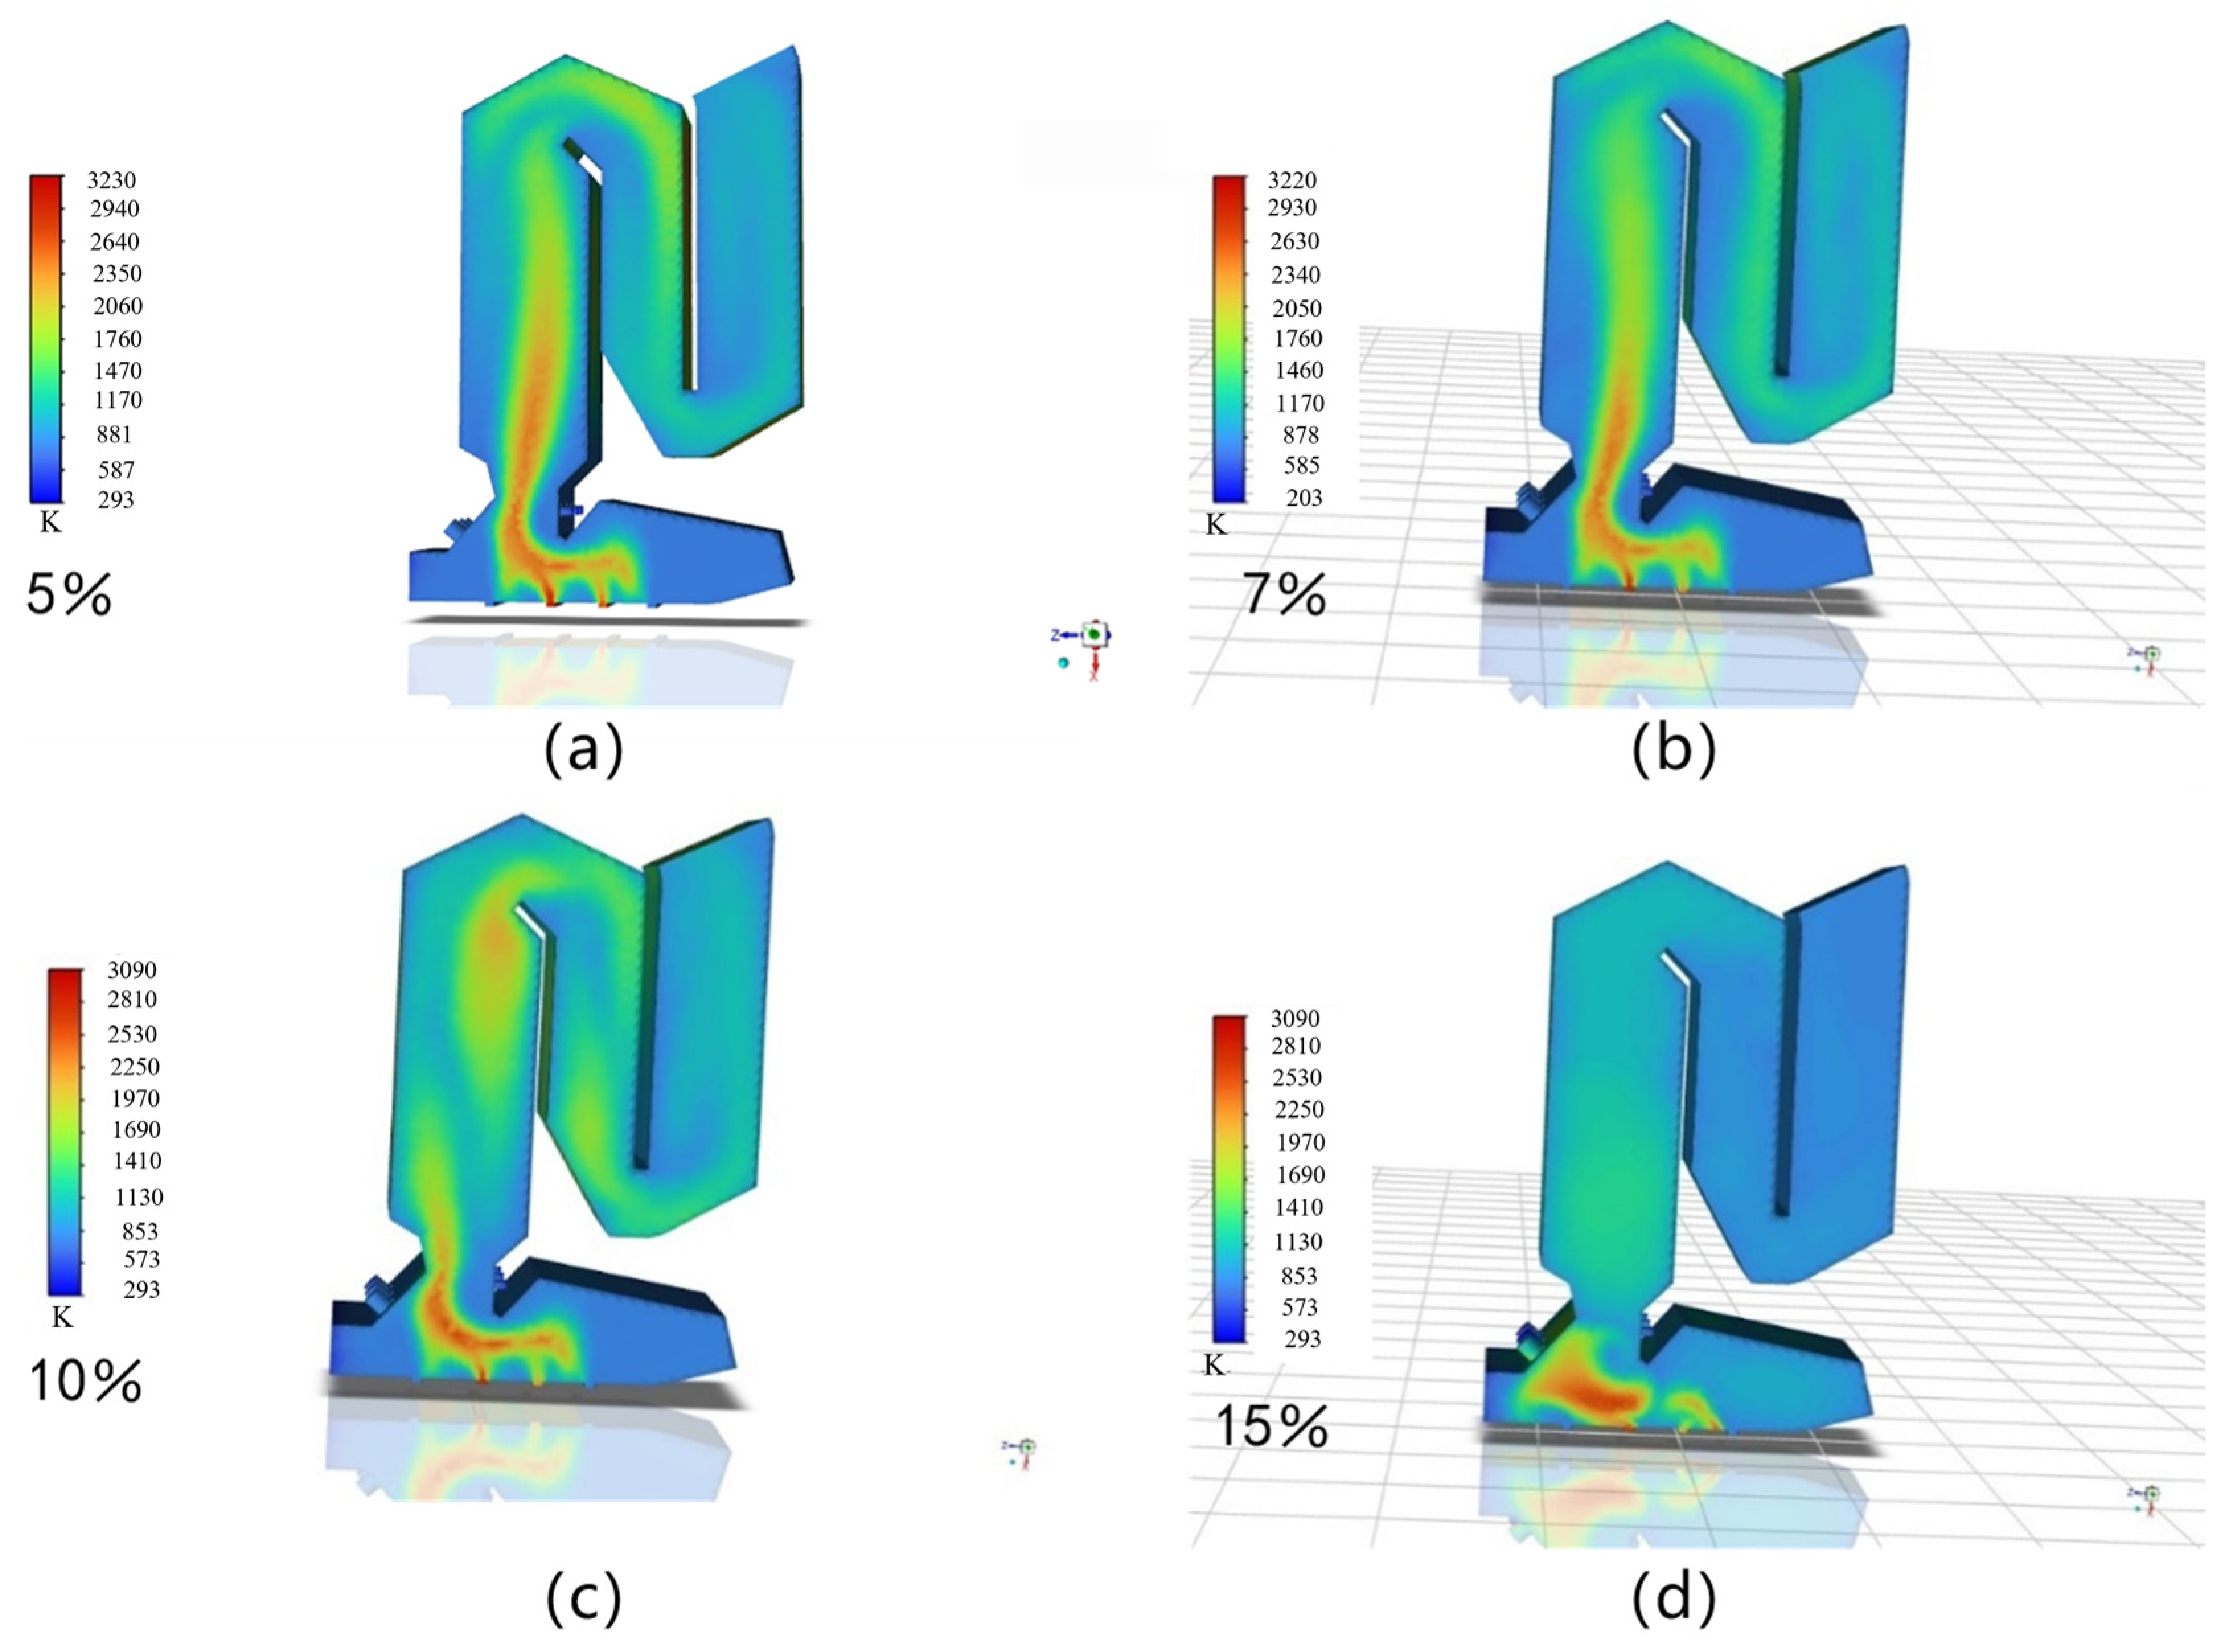
3.1.1. Temperature Characteristics at Different Ratios

Figure 2 shows the numerical simulation results of the temperature field within the MSW incinerator under various SS co-combustion ratios. At a 5% SS co-combustion ratio (Figure 2a), the high-temperature regions are primarily located in the lower section of the MSW incinerator (the red area), with the peak temperature reaching 3320 K. Conversely, the upper part of the MSW incinerator shows a lower temperature (the blue area). Combustion is relatively focused and uniform, and a low SS ratio has a minimal effect on the overall combustion efficiency, indicating that this ratio exerts a moderate influence on MSW. As the SS ratio increases to 7% (Figure 2b), the high-temperature regions slightly expand, with a significant increase in central temperatures. The maximum temperature within the high-temperature zone remains at 3320 K. Combustion reactions become more intense but remain relatively focused. The increase in the SS ratio likely introduces additional combustible material into the reaction, thereby improving the combustion efficiency.
When the co-combustion SS ratio is 10% (Figure 2c), the high-temperature regions in the central and upper zones expand significantly, while temperatures in the bottom and peripheral areas remain low. An increased SS ratio evidently enhances the combustion intensity; however, the low-temperature zone at the bottom also expands, indicating incomplete local combustion or an insufficient air supply, necessitating the further optimization of airflow. When the co-combustion SS ratio reaches 15% (Figure 2d), the high-temperature regions are significantly reduced. Although overall high temperatures persist, the distribution of high-temperature regions becomes less concentrated, indicating that the combustion condition becomes uneven. Excessive proportions of sewage sludge (SS) may exceed the capacity of a municipal solid waste (MSW) incinerator, which can affect combustion efficiency, resulting in lower temperatures and increased unburned material in localized areas [25].

3.1.2. Speed Characteristics at Different Ratios

Figure 3 shows the numerical simulation results of the velocity field in the MSW incinerator under different SS ratios. As the ratio of SS co-combustion increases, the fluid flow in the MSW incinerator becomes increasingly turbulent. This turbulent flow can lead to uneven fuel mixing and negatively impact the stability and efficiency of combustion. When the SS co-combustion ratio is low (such as 5–10%), the fluid flow in the MSW incinerator is relatively regular, facilitating effective fuel mixing and combustion. However, when the SS co-combustion ratio reaches 15%, the fluid flow pattern becomes significantly complex and chaotic, potentially impeding the control of the combustion process. An analysis of the flow velocity distribution across various areas of the MSW incinerator indicates that high-flow-velocity areas are generally associated with improved fuel mixing and heat transfer efficiency. In the first combustion chamber, high-flow-velocity areas facilitate the thorough mixing of fuel and air, thereby enhancing combustion efficiency. However, when the SS co-combustion ratio reaches 15%, while high-flow-velocity areas exist in the first combustion chamber, these regions become mixed and unstable, potentially affecting combustion efficiency and fuel utilization.
In addition, studies have shown that swirl and reflux phenomena play an important role in the combustion process [26]. When the SS co-combustion ratio is between 5 and 10%, the first combustion chamber and the flue gas outlet show significant and regular swirl and reflux phenomena, which help to prolong the residence time of the fuel in the MSW incinerator and promote the mixing of the fuel and air, thereby improving combustion efficiency. This phenomenon is widely utilized in industrial applications, for example in combustion systems where the stability and efficiency of combustion can be enhanced by increasing the residence time of the reacting gases [27]. However, when the SS co-combustion ratio was increased to 15%, the swirls phenomenon became significantly irregular and chaotic, while the reflux phenomenon weakened. This unstable swirl and weakened reflux may lead to insufficient residence time of the fuel in the MSW incinerator, resulting in incomplete combustion and adversely affecting the overall combustion process.
Numerical simulation results of the velocity field in the MSW incinerator, with varying ratios of SS co-combustion, indicate that the fluid flow pattern becomes increasingly turbulent as the co-combustion ratio increase. Regions of high flow velocity are characterized by increased mixing and instability, with significant effect on swirling and reflux phenomena. These changes may result in decreased combustion efficiency and fuel utilization. Therefore, in practice applications, the structure and operating parameters of the MSW incinerator should be adjusted base on the characteristics of the SS and the SS co-combustion ratio to optimize the combustion process and minimize pollutant emissions.

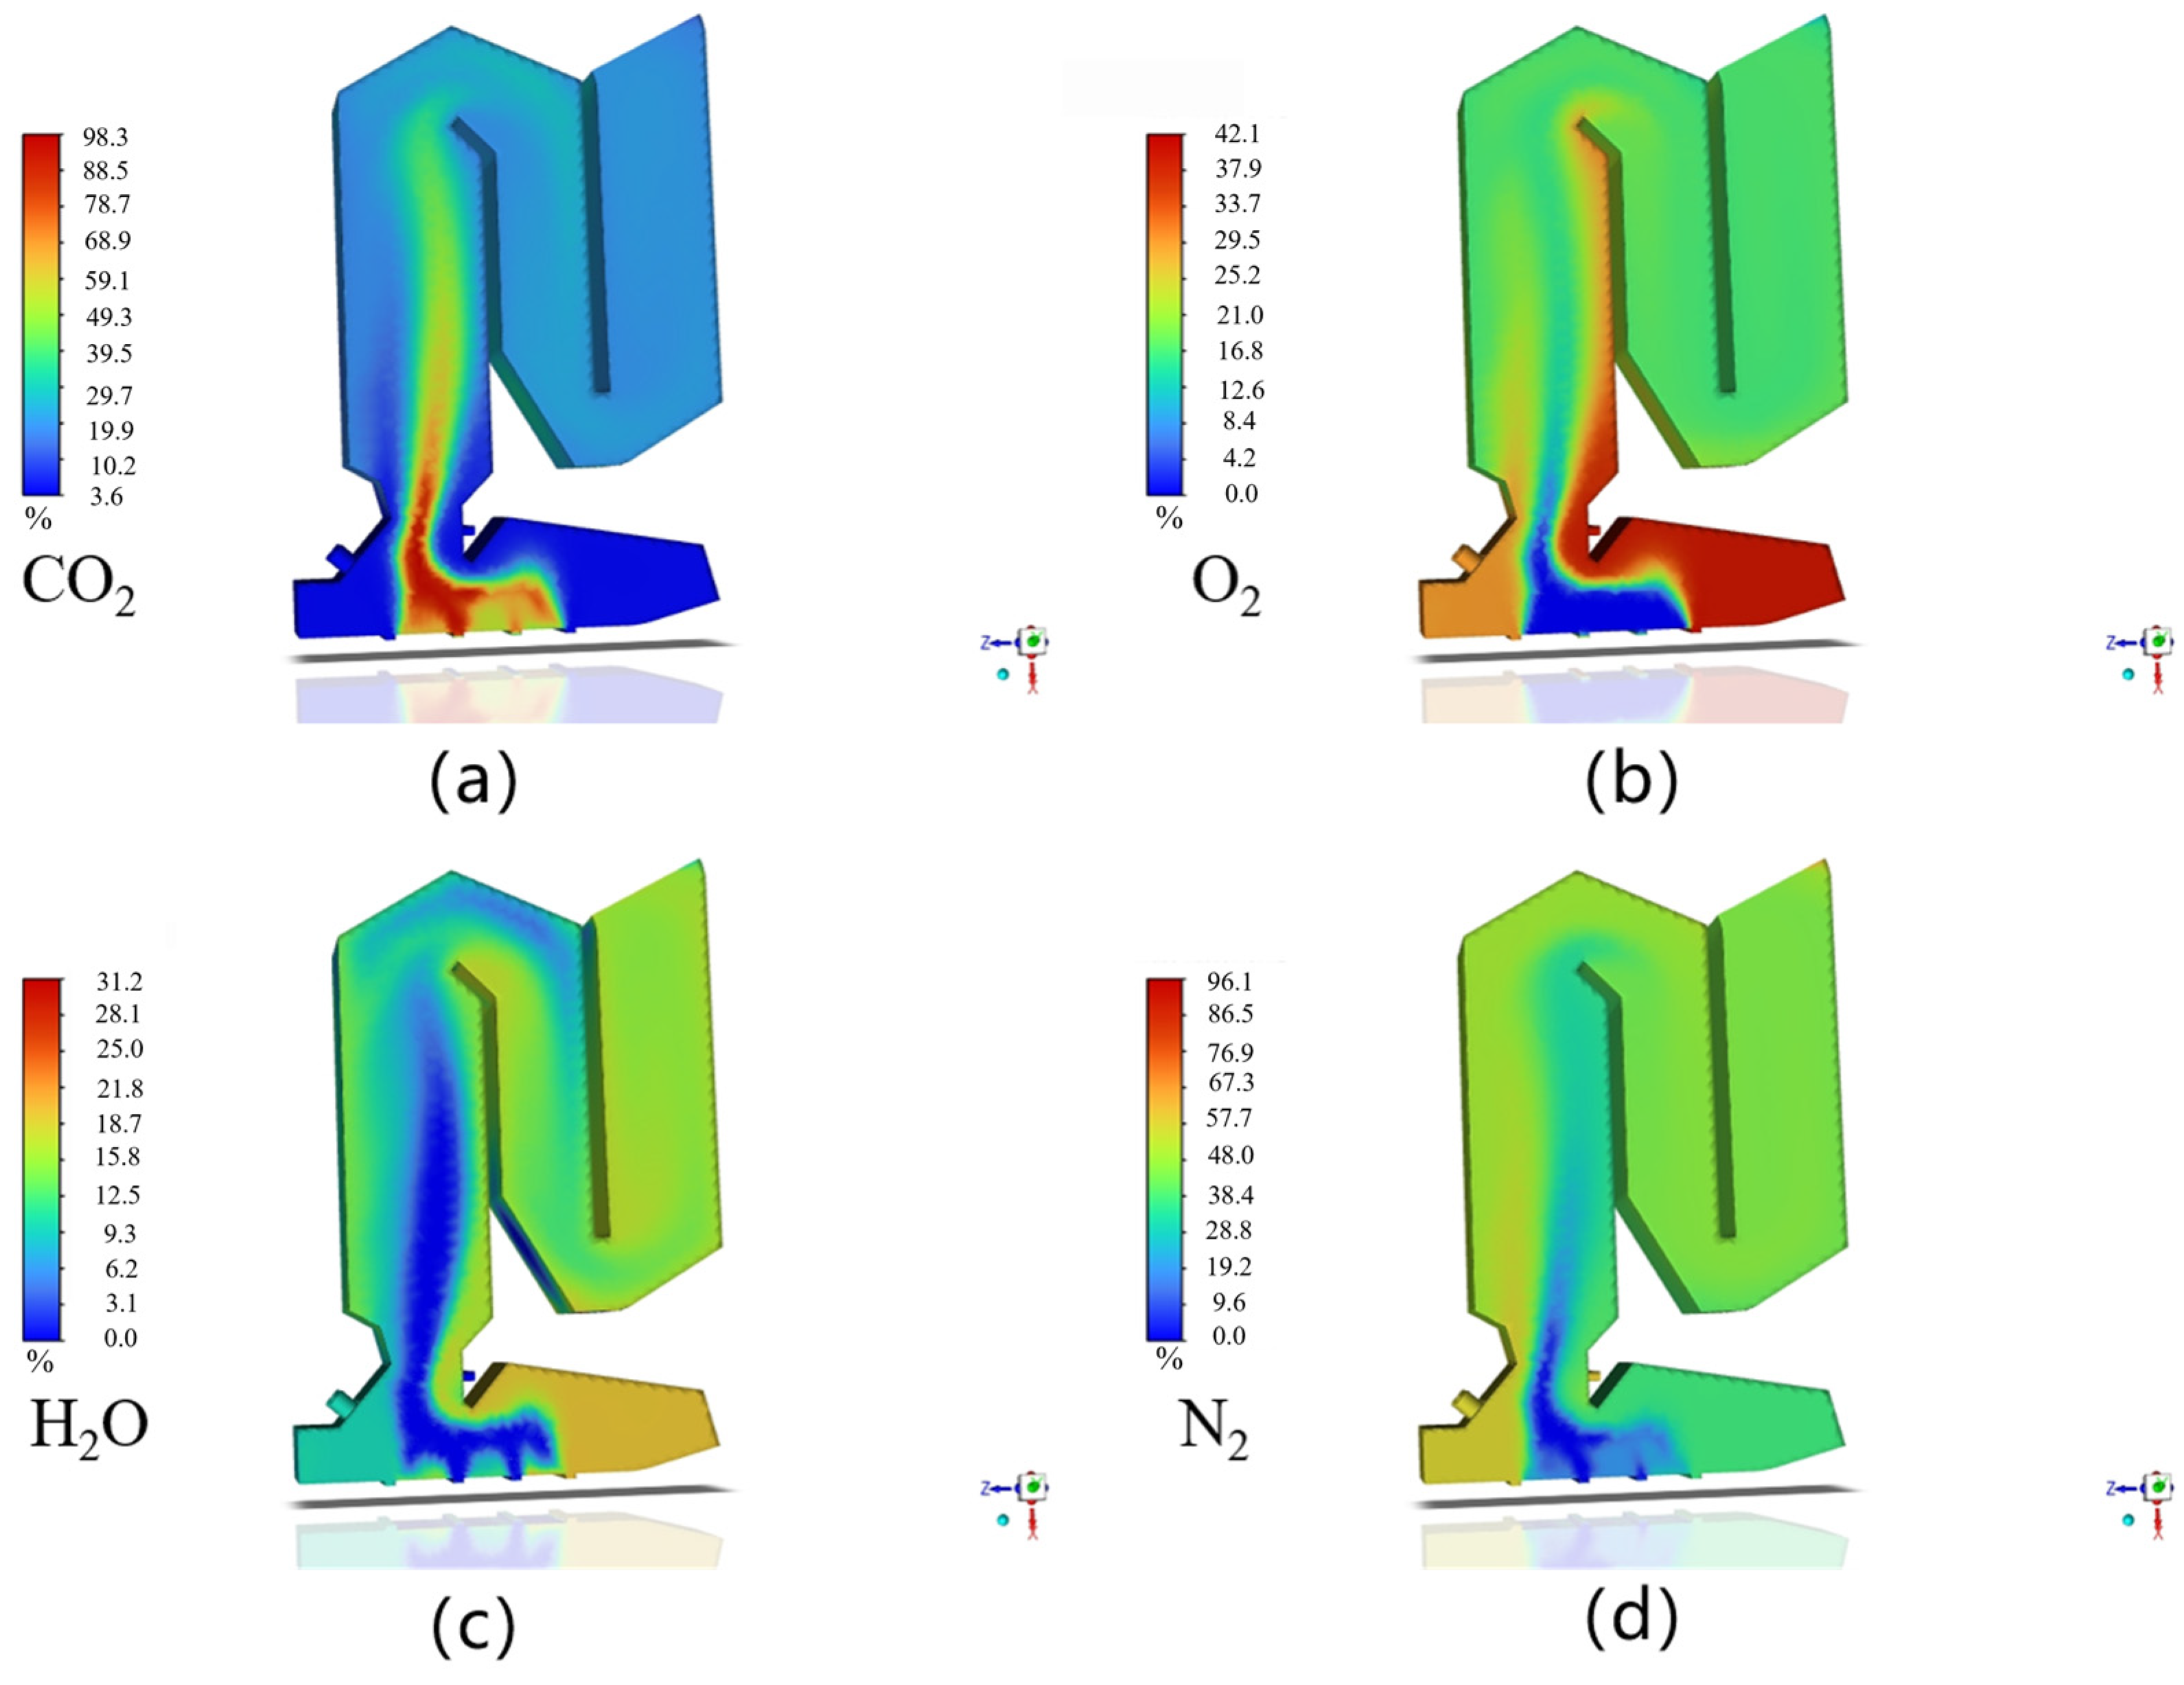
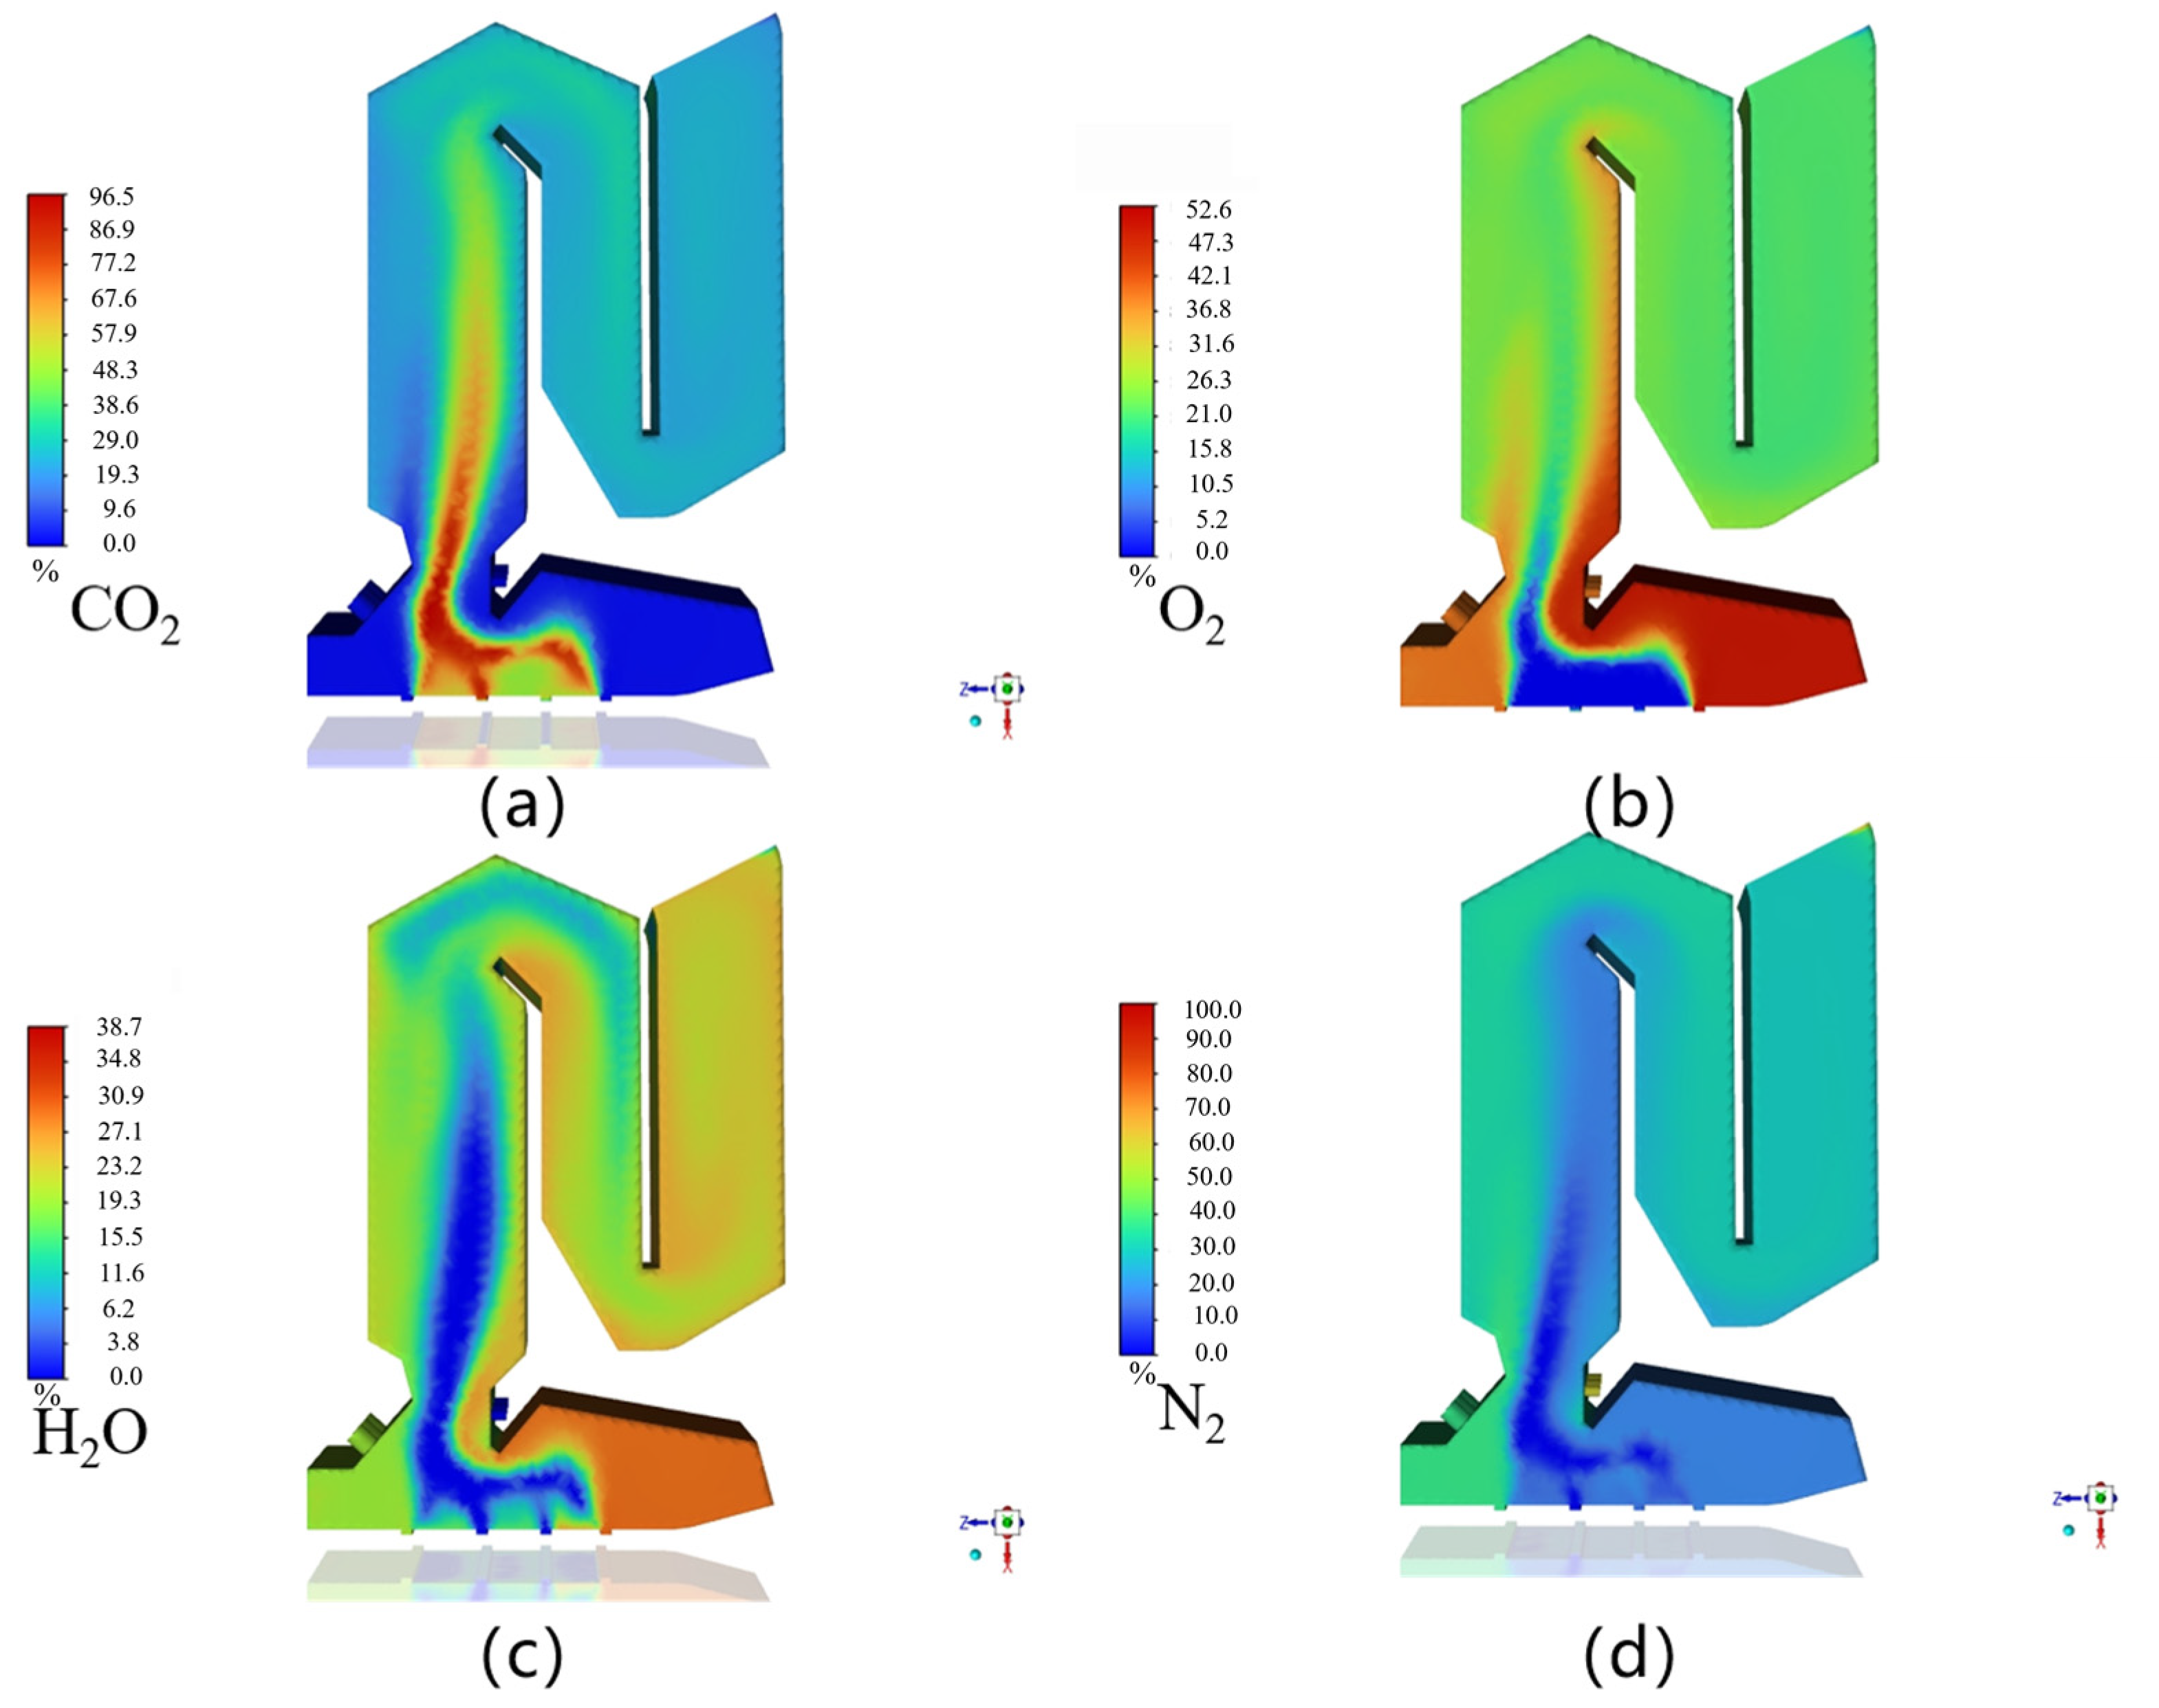
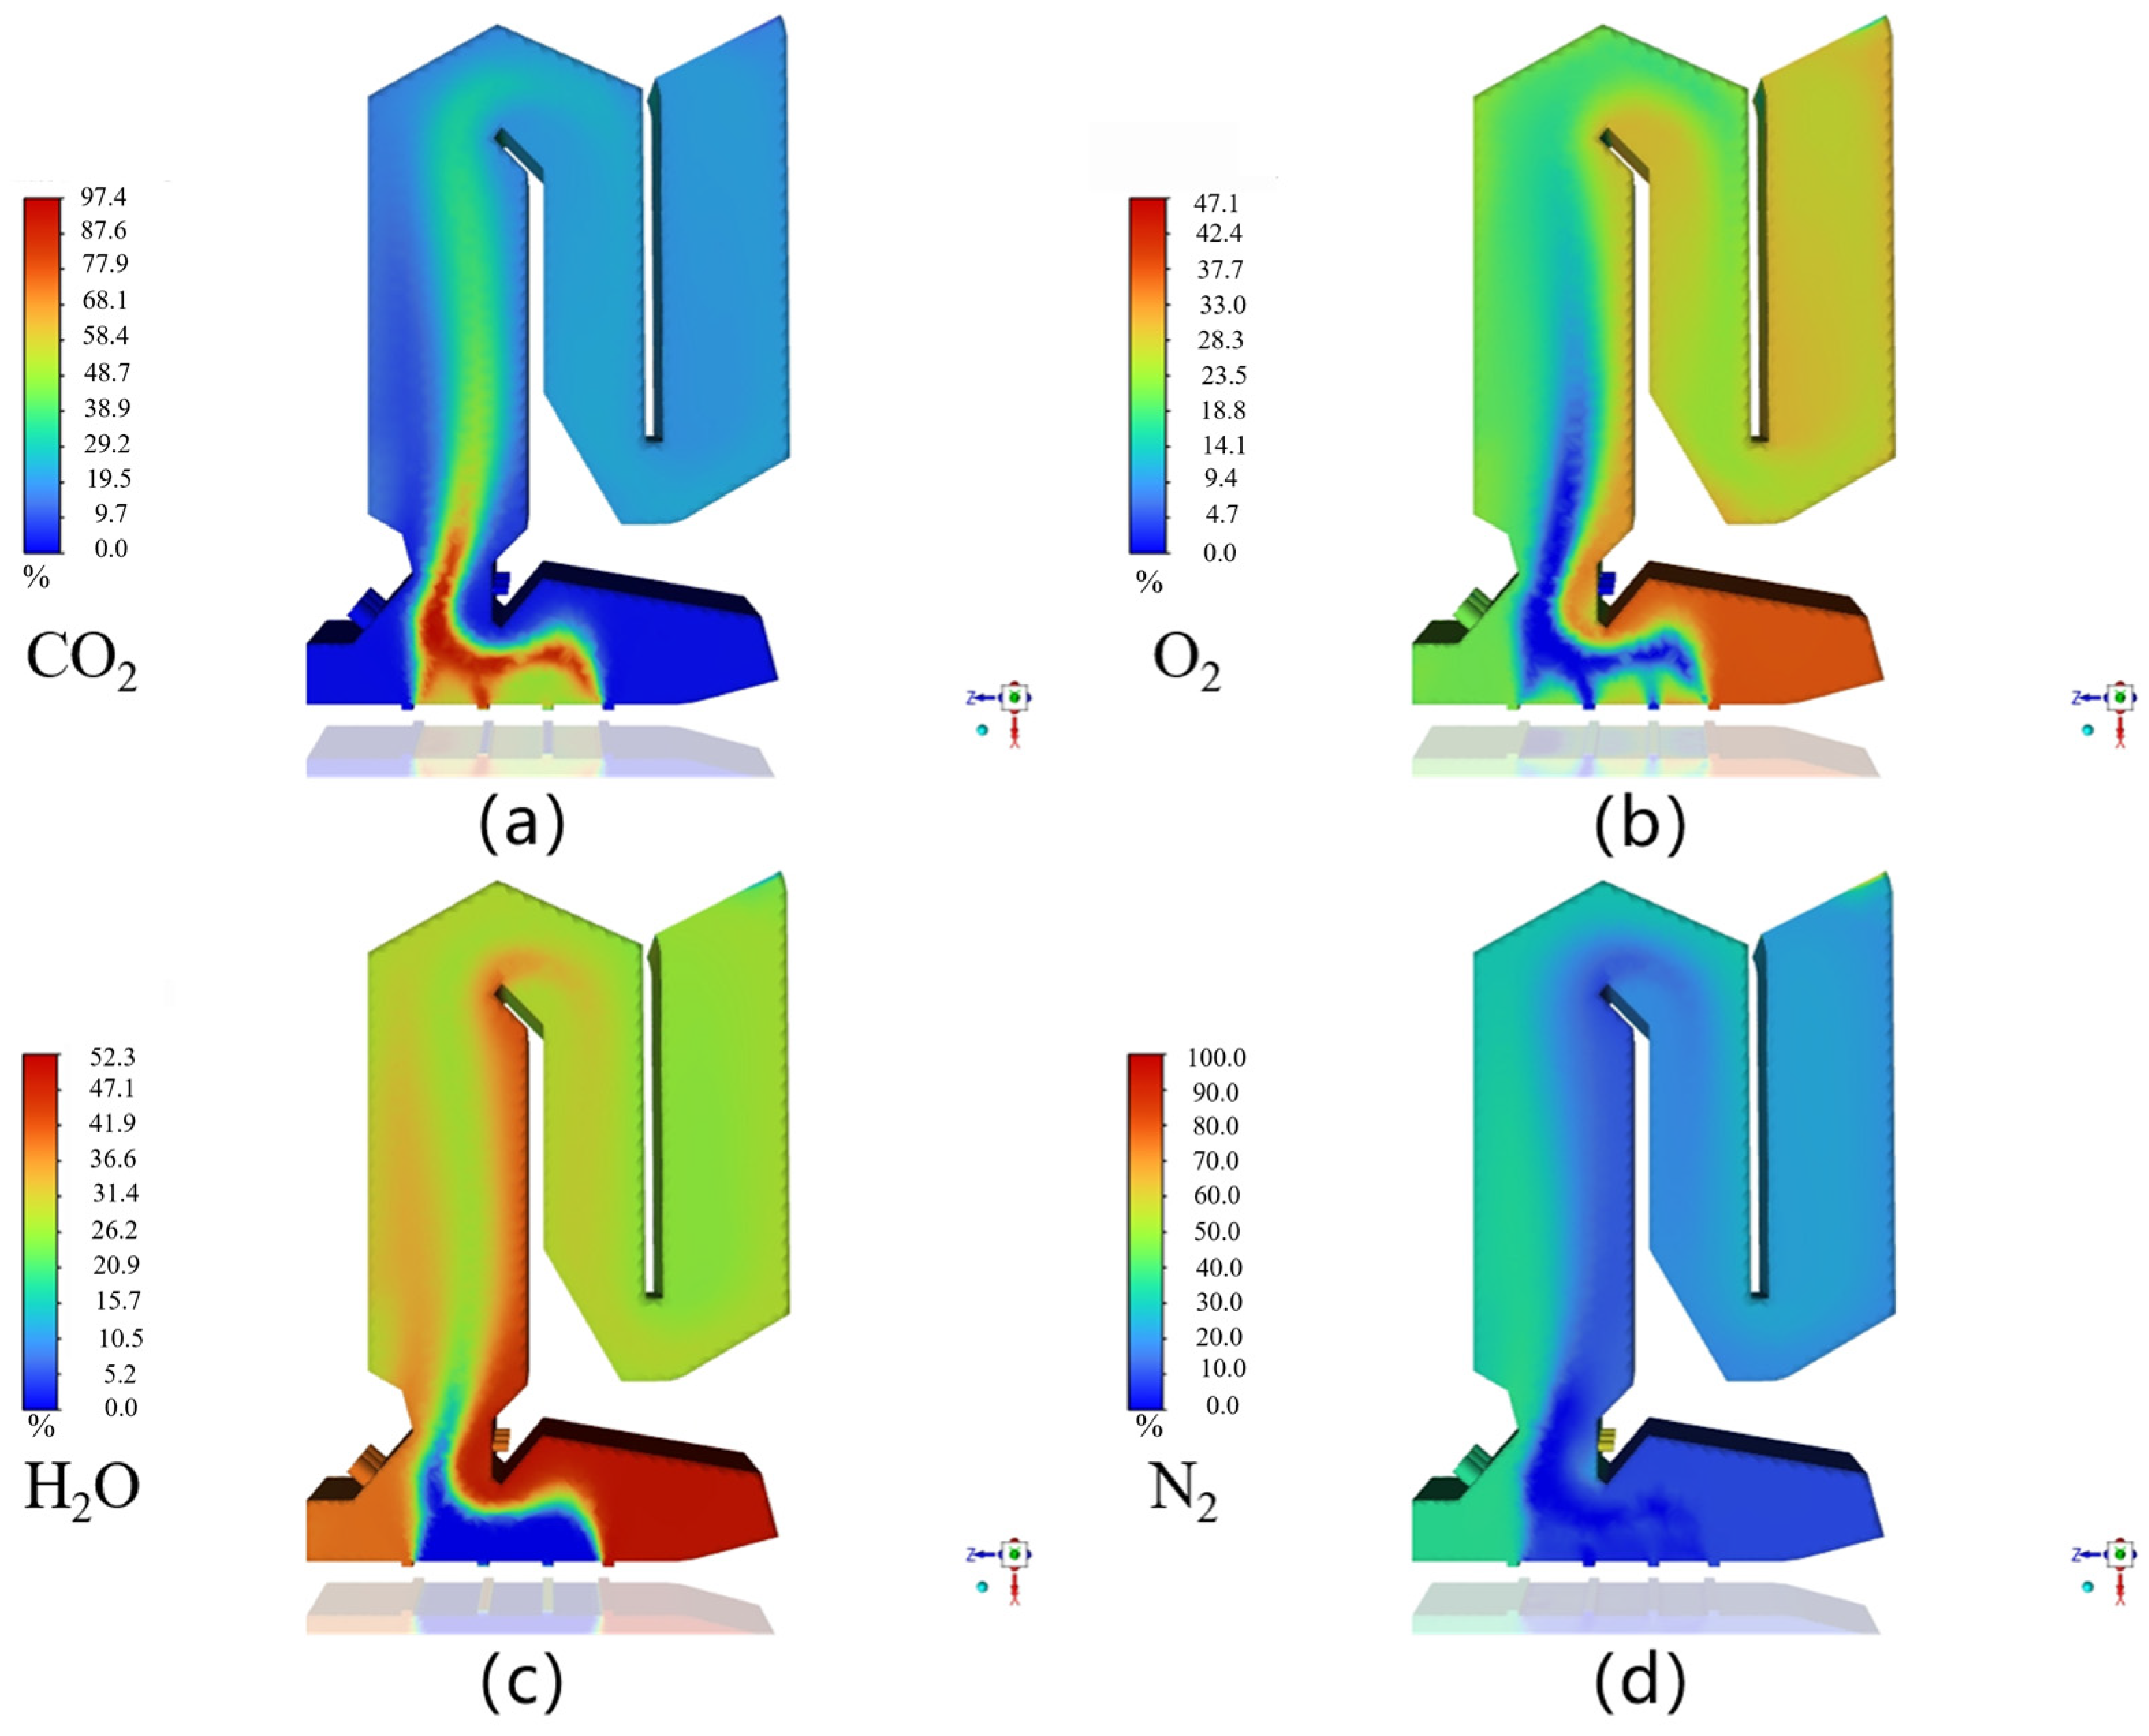
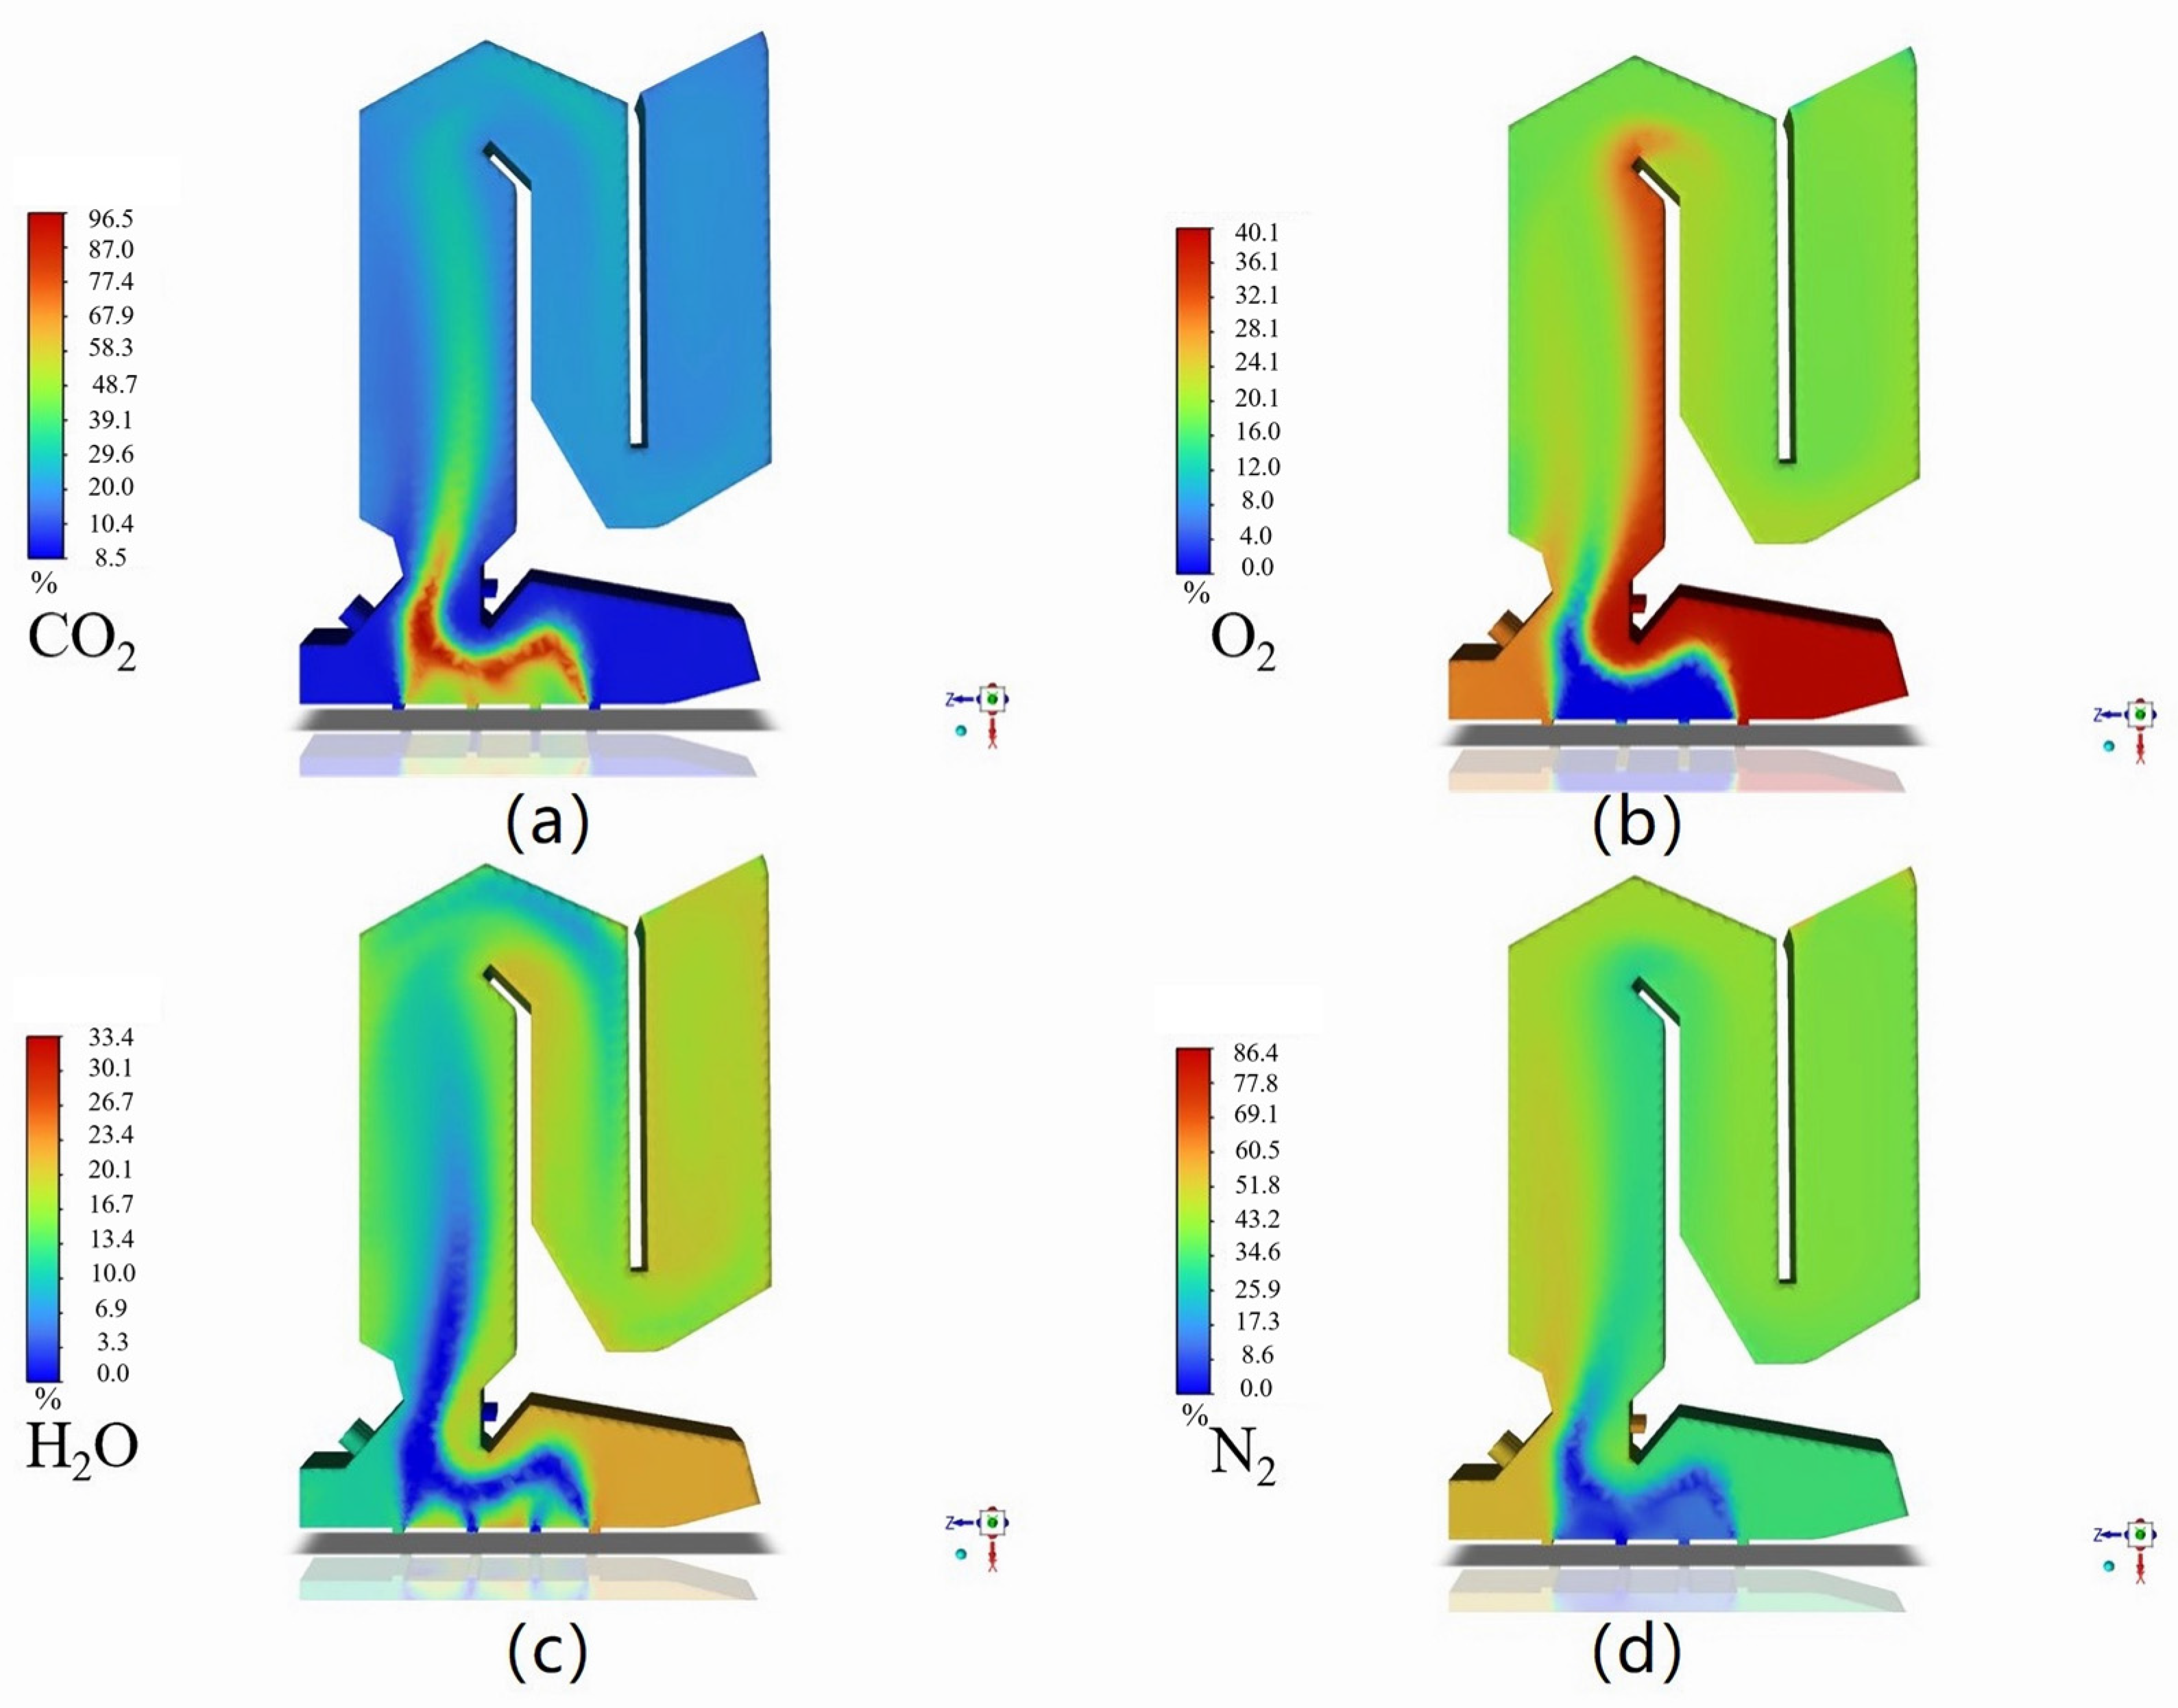
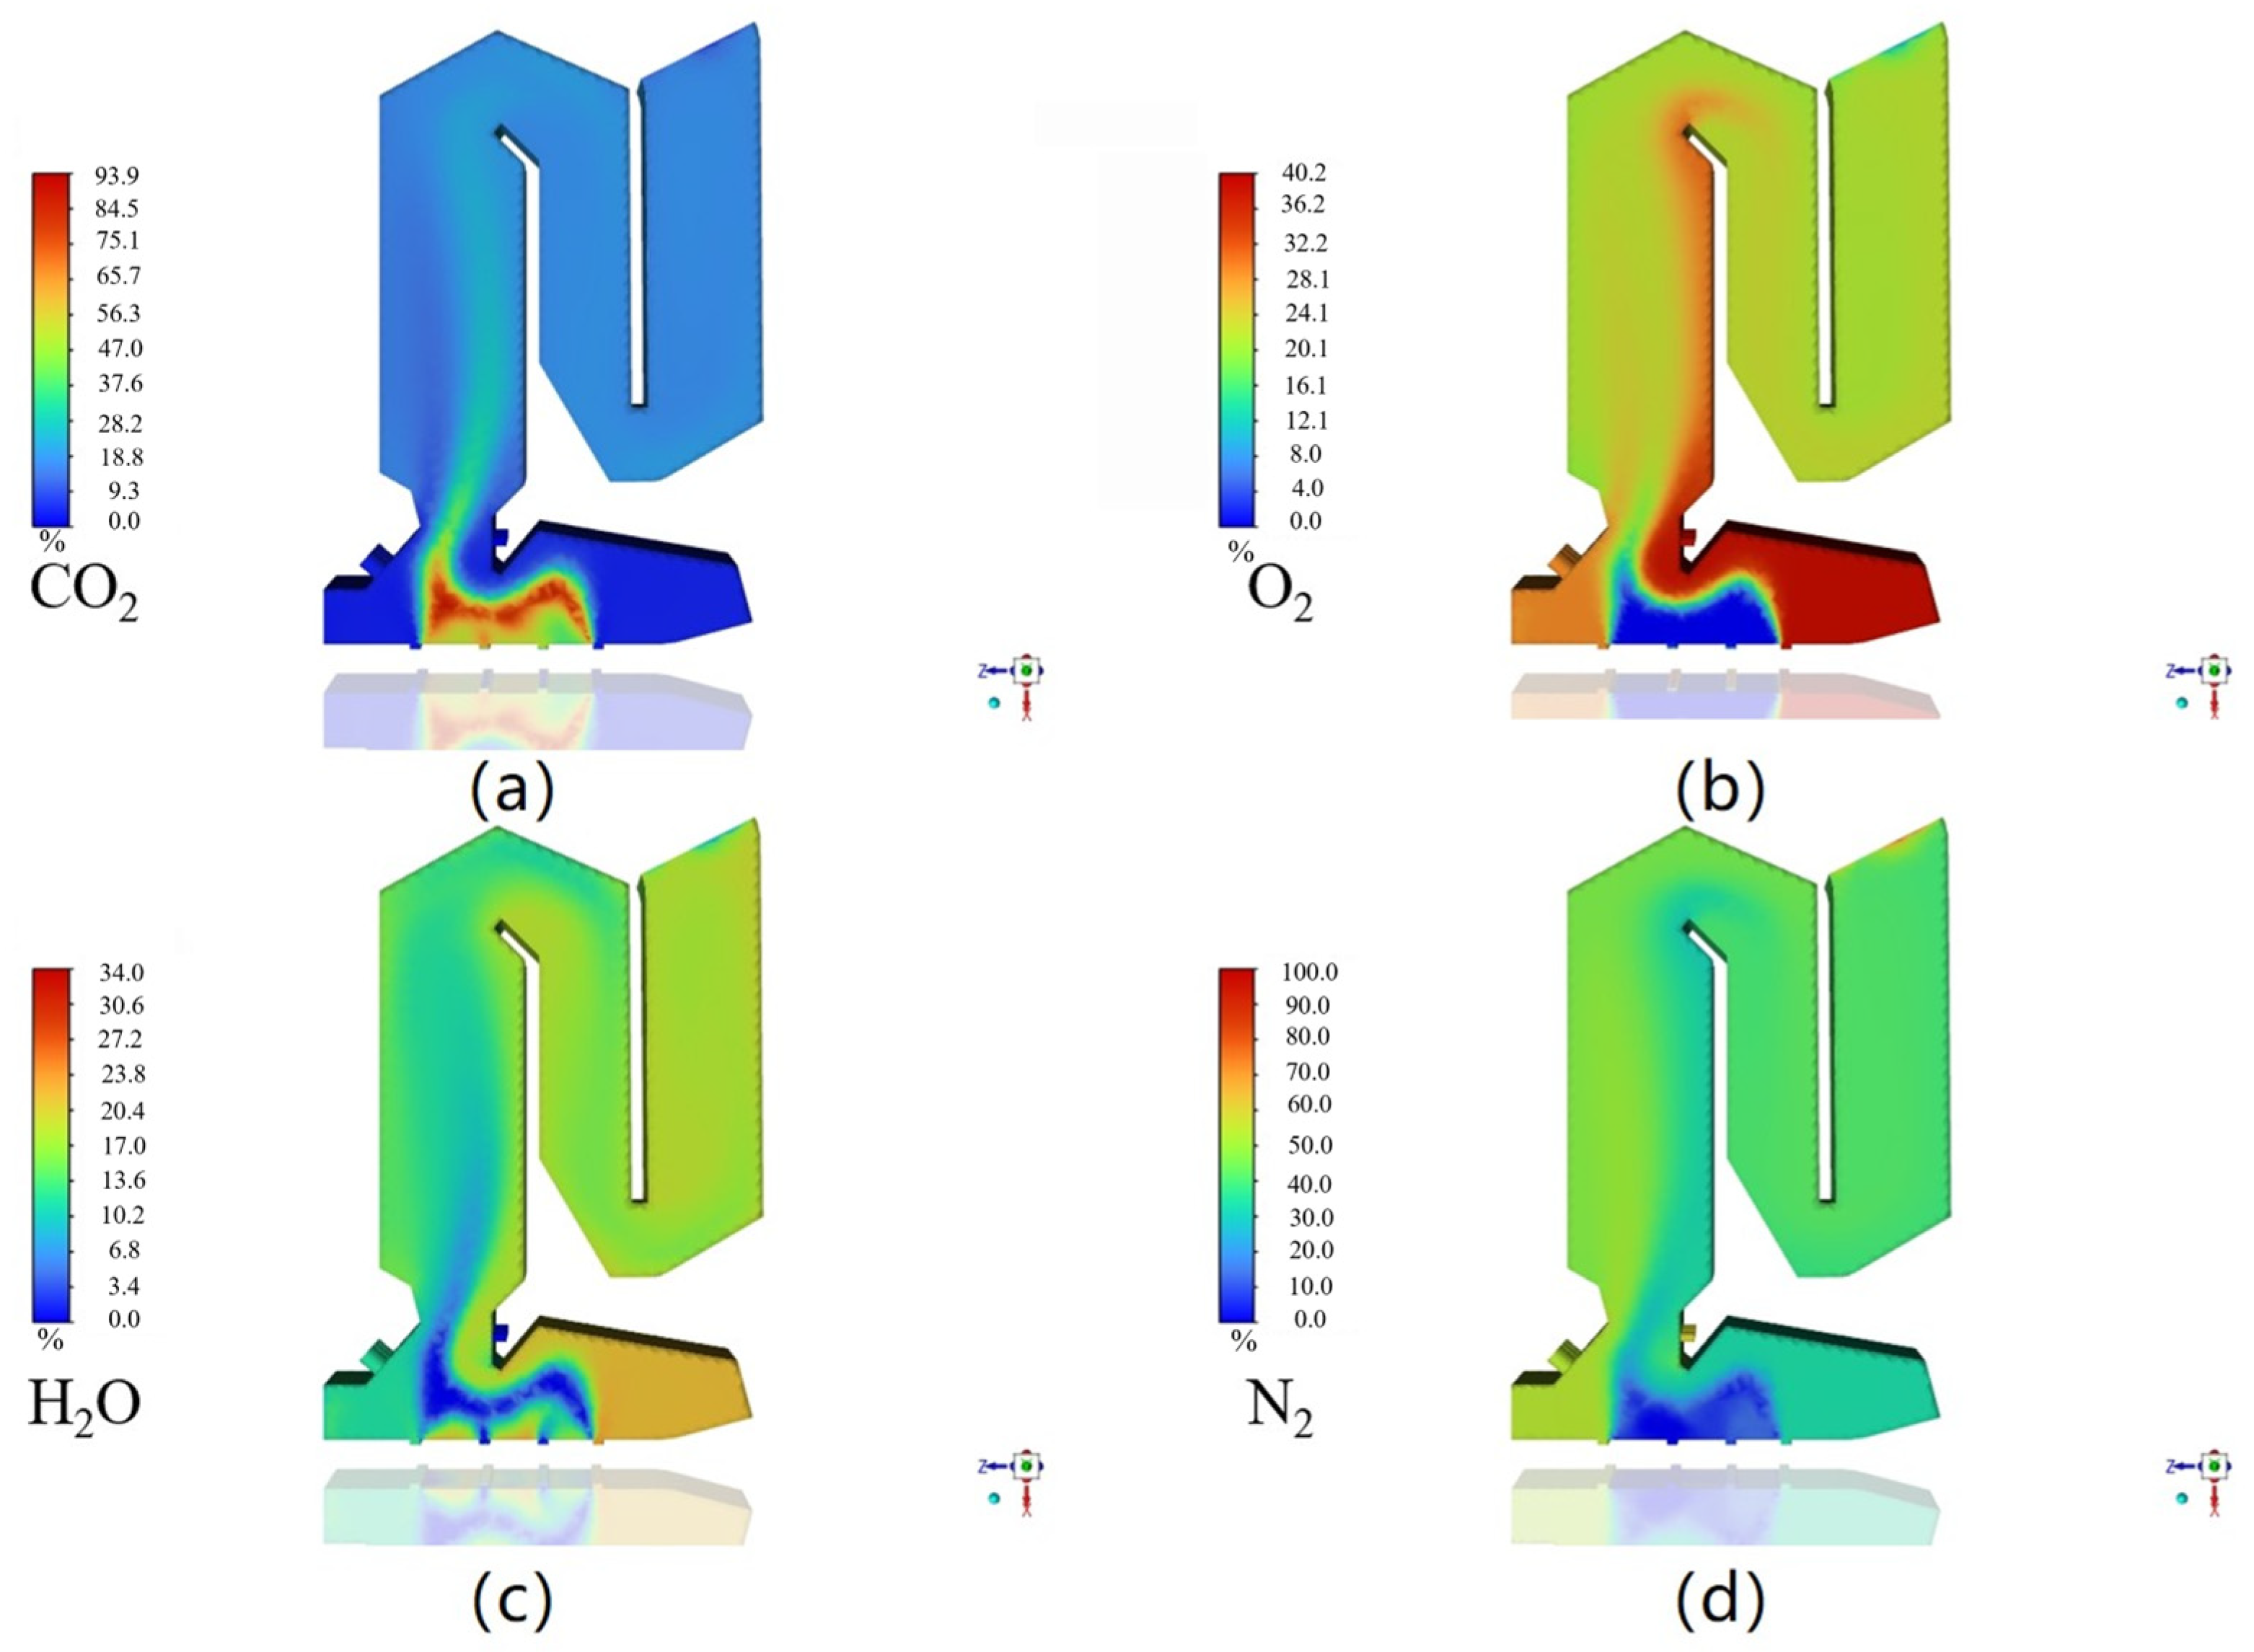
3.1.3. Component Characteristics at Different Ratios

From Figure 4a, it is evident that the CO2 concentration is elevated in the lower and central regions of the incinerator chamber, peaking at 98.3%, whereas the concentration at the chamber’s top remains relatively low at 49.3%. This phenomenon indicates that the lower and central regions constitute the primary combustion zones where the oxidation of fuels (MSW and SS) occurs more completely [28]. According to Figure 4b, the O2 concentration is reduced in the lower and central sections (ranging from 4.21 to 21.0%) and increased in the bottom and peripheral areas (reaching up to 42.1%). This indicates that the lower O2 concentration in the most active combustion region (where the CO2 concentration is high) could be attributed to the primary concentration of air supply in the bottom and peripheral regions. From Figure 4c, it can be observed that the concentration of H2O is higher in the slag discharge section of the solid-phase combustion zone and in the exit bend of the second combustion chamber, approximately 18.7–21.8%, whereas it is lower in the entry zone and the main region of the gas-phase combustion at only 3.12–9.36%. This observation indicates that the water vapor produced during the co-combustion of MSW and SS exhibits a higher concentration in these regions. As can be seen in Figure 4d, the concentration of N2 was more uniform and maintained a range of 48.3–67.3%. However, it was slightly lower in the bottom and intense combustion zones, ranging from 9.61 to 28.8%. The uniform distribution of N2 as an inert gas during combustion was achieved by convection and diffusion, while the low concentration areas were attributed to the dilution effect of the combustion reaction.
Regarding the CO2 cloud map distributions in Figure 5a, Figure 6a and Figure 7a, when the SS co-combustion ratio is low, the cloud diagram shows that the high concentration area is mainly concentrated in the combustion center of the incinerator. As the SS co-combustion ratio increases, the CO2 concentration increases, the distribution range of the cloud map gradually expands, and the CO2 concentration gradient becomes more uniform. However, at very high SS co-combustion ratios, the elevated moisture content and relatively low combustion values of the SS may lead to incomplete combustion, resulting in localized low-concentration areas in the cloud diagram.
Regarding the O2 cloud map distributions shown in Figure 5b, Figure 6b and Figure 7b, the O2 concentration gradually decreases within the incinerator as the combustion reaction on advances. When the SS co-combustion ratio is low, the O2 cloud map shows a gradient distribution that gradually decreases from the incinerator inlet to the outlet. However, with an increased SS co-combustion ratio, the combustion reaction becomes more intense, leading to a rapid O2 consumption rate and a steeper decline in the cloud diagram distribution.
Regarding the H2O cloud map distributions in Figure 5c, Figure 6c and Figure 7c, the high moisture content in SS has a significant effect on the incineration process. At low SS co-combustion ratios, the moisture maps were mainly clustered at the initial stage when the SS entered the incinerator. However, as the SS co-combustion ratio increased, the distribution of moisture maps widened and may have been accompanied by high-temperature water vapor generation, which further affected the temperature and airflow distribution in the incinerator.
Regarding the N2 cloud map distributions in Figure 5d, Figure 6d and Figure 7d, N2 is the main component of air, and consequently, its concentration undergoes minimal changes during the incineration process. Therefore, the distribution of the N2 cloud map remains relatively stable across different SS co-combustion ratios, primarily influenced by the combined effects of airflow distribution and combustion reaction within the incinerator.
The average concentration values of the main combustion products at the junction of the first flue and the second flue are shown in Table 2. With an increase in the 7% SS co-combustion ratio, the concentrations of CO2 and H2O increased, which may be due to the increase in the production of carbon dioxide and water vapor caused by the combustion of organic matter in the sludge. The O2 concentration increases at the sludge co-combustion ratio of 7% and 15%, which may be because a higher SS co-combustion ratio requires more oxygen to support the combustion process. The N2 concentration decreased with the increase in the 7% SS co-combustion ratio, which may have been due to the increase in the flue gas volume, resulting in a decrease in the percentage of N2 in the flue gas. According to the simulation results of the temperature field, the distribution of the high-temperature region becomes uneven when the proportion of the SS co-combustion ratio increases to 10%. This uneven distribution may lead to combustion process instability and negatively impact the overall combustion effect. The velocity field simulation results indicate that at a 7% SS co-combustion ratio, the velocity field within the waste incinerator is relatively uniform. Additionally, obvious vortex and reflux phenomena are observed in the first flue and flue gas outlet. These flow characteristics help to prolong the residence time of the fuel in the incinerator and promote the adequate mixing of fuel and air, thus significantly improving the combustion efficiency.
Considering the simulation results of temperature field, velocity field and component distribution, it can be concluded that the 7% SS co-combustion ratio performs the best in terms of improving combustion efficiency, optimizing temperature distribution and improving flow characteristics. Therefore, the 7% SS co-combustion ratio was identified as the optimal addition ratio for the incineration process.

3.2. MSW Incinerator Temperature

3.2.1. Temperature Characteristics at Different Incinerator Temperature

The temperature of the MSW incinerator is a crucial parameter influencing combustion performance as it directly affects the reaction rate, fuel utilization, and pollutant emission during the combustion process. In the co-incineration process of SS and MSW, the precise control of incinerator temperature is particularly critical. At a 7% SS co-combustion ratio, the effect of the incinerator temperature on the combustion performance can be effectively assessed by varying the wall surface temperature of the incinerator.
As can be seen from Figure 8a, when the MSW incinerator temperature is 800 K, the temperature distribution map indicates that most areas exhibit lower temperatures (585–878 K), while only the bottom of the combustion zone and the red region of the second combustion chamber display higher temperatures (1460–2930 K). This temperature distribution pattern facilitates the efficient operation of the MSW incinerator and mitigates the safety risks associated with an excessive heat concentration. At an MSW incinerator temperature of 1000 K (Figure 8b), the temperature map shows a range between 1210 and 3340 K, with an expansion of the red area at the bottom, although the overall distribution becomes more complex. The combustion reaction intensifies at higher temperatures, and the vortex pattern becomes turbulent. When the MSW incinerator temperature increases to 1200 K (Figure 8c), the temperature map appears more reddish compared to that at 800 K, indicating a substantial increase in the internal temperature of the incinerator. The red area at the bottom of the chamber also enlarges, showing a higher temperature gradient, and the temperature range is extended from 1220 K to 3370 K. This indicates that the temperature distribution within the incinerator becomes more complex and varied as the MSW incinerator temperature increases.
Through the numerical simulation of different incinerator temperatures, we found that as the temperature in the furnace increases, the high-temperature area at the bottom of the furnace gradually expands. At furnace temperatures of 1000 K and 1200 K, the temperature field exhibits increasingly complex distribution characteristics, with a more pronounced temperature gradient and more uneven regional temperature variations. Conversely, at a temperature of 800 K, the temperature field distribution is relatively uniform, with a notable increase in temperature only at the furnace base and the second combustion chamber. This relatively uniform temperature distribution enhances the operating efficiency of the waste incinerator and ensures the complete combustion of the waste in the primary combustion section, thereby optimizing heat energy utilization. Additionally, this temperature distribution pattern mitigates potential safety hazards associated with an excessive heat concentration and reduces operational risks, thereby enhancing the safety and stability of the overall system [29].

3.2.2. Speed Characteristics at Different Incinerator Temperature

Through simulation analysis, a significant impact of the MSW incinerator temperature on the distribution of the velocity field within the incinerator is observed. Figure 9 shows the relationship between the variation in the MSW incinerator temperature and the fluid dynamic behavior within the incinerator.
Figure 9a illustrates that at lower MSW incinerator temperatures, the flow velocity within the incinerator is reduced, resulting in sluggish fluid movement. This phenomenon is attributed to the restriction of thermal motion among fuel molecules at lower temperatures, which reduces collision frequency, decreases the rate of chemical reactions, and limits gas expansion. Consequently, this results in an uneven temperature distribution and decreased combustion rates. As can be seen from Figure 9b, with a gradual increase in the MSW incinerator temperature, there is a marked rise in the flow velocity within the incinerator, and fluid movement becomes more vigorous. This effect is due to the higher MSW incinerator temperature providing additional thermal energy to the fuel molecules, which enhances thermal motion and collision frequency, facilitates a better mixing of fuel and air, accelerates combustion reactions, and results in increased gas volume expansion and flow velocity. When the MSW incinerator temperature reaches 1200 K (Figure 9c), the flow velocity further increases, creating high-velocity flow regions. In these regions, fluid circulates and exchanges rapidly, which promotes the thorough mixing of fuel and air and ensures a uniform heat distribution. Additionally, the rapid removal of combustion-generated heat helps prevent localized overheating, thereby improving combustion stability and safety.
In the analysis of the velocity field, it was observed that as the temperature inside the furnace increased to 1000 K and 1200 K, the velocity field progressively exhibited pronounced turbulent characteristics. This turbulence phenomenon is beneficial to the combustion process. However, if the turbulence intensity becomes too large, it can cause an unstable flow within the combustion system, leading to excessive gas flow or vortex formation. This can result in an uneven temperature distribution within the combustion chamber, thereby affecting combustion efficiency. Moreover, excessive turbulence can lead to an uneven mixing of fuel and oxygen, resulting in local over-enrichment or over-leanness, thereby reducing the overall combustion efficiency. At a temperature of 800 K, the velocity field demonstrated considerable regularity, particularly in the first combustion chamber and the flue gas outlet, where distinct and orderly vortices and reflows were observed. These vortices and reflows extend the residence time of the fuel within the furnace and facilitate the complete mixing of fuel and air, thus enhancing combustion efficiency. Consequently, based on these observations, a temperature of 800 K is deemed the optimal temperature for achieving peak combustion efficiency.

3.2.3. Component Characteristics at Different Incinerator Temperature

Figure 10 illustrates the distribution characteristics of various gases within the furnace at a temperature of 1000 K. As shown in Figure 10a, high concentrations of CO2 (ranging from 39.1% to 96.6%) are predominantly observed in the lower and central regions of the furnace, indicating intense combustion activity in these regions. The upward diffusion and dispersion of CO2 provides clear evidence of gas flow and mixing processes. This observation is essential for optimizing combustion processes and minimizing pollutant emissions. Examining the O2 distribution contour in Figure 10b reveals that, due to the consumption of a significant amount of O2 by combustion reactions, the concentration of O2 is relatively low in the bottom and central regions of the furnace, ranging from 4.01% to 16%. Conversely, the upper section of the furnace exhibits a higher concentration of O2, reaching up to 28.1%. Notably, near the slag discharge outlet of the grate, the concentration of O2 is exceptionally high, reaching a peak of 40.1%. This elevated concentration is attributed to the high pressure in this region, caused by solid-phase combustion and the boundary conditions being closed and thermally insulated. Consequently, this region exhibits the highest O2 concentration within the entire incinerator model. The observed distribution pattern not only influences the progression of combustion reactions but also affects combustion efficiency and pollutant generation. Therefore, by optimizing the burner design and MSW incinerator temperature, it becomes feasible to achieve more effective control over O2 consumption and replenishment, ultimately leading to efficient and environmentally friendly combustion. Figure 10c illustrates that the high concentration regions of H2O are primarily located in the bottom and central sections of the furnace, ranging from 13.40% to 23.40%. This observation is primarily due to the generation and release of water vapor during the combustion process. However, as the combustion reactions progress and gases flow and diffuse within the furnace, the concentration of H2O gradually decreases. In Figure 10d, the N2 distribution contour reveals that N2, acting as an inert gas during the combustion process, exhibits a relatively uniform distribution of concentration throughout the furnace. However, due to the influence of heat generated by combustion reactions and gas flow, the concentration of N2 is slightly lower in the bottom and central regions, ranging between 8.64% and 11.2%.
Figure 10 and Figure 11 illustrate that lower temperatures in the MSW incinerator result in less vigorous combustion, leading to slower combustion rates and reduced combustion efficiency. Under these conditions, the formation of CO2 (Figure 10a and Figure 11a) is relatively limited because of incomplete combustion, which results in the accumulation of unburned hydrocarbons and other intermediate products. Similarly, the rate of O2 consumption (Figure 10b and Figure 11b) decreases as the overall combustion reactions is constrained. Regarding H2O formation (Figure 10c and Figure 11c), while water vapor is generated during combustion, its quantity may be limited by incomplete combustion. The concentration of N2 (Figure 10d and Figure 11d) remains relatively uniform at lower MSW incinerator temperatures as the impact of these lower temperatures on gas flow and mixing is minimal.
At higher MSW incinerator temperatures (Figure 12), combustion reactions intensify, resulting in an accelerated combustion rate and enhanced combustion efficiency. Under these conditions, the production of CO2 (Figure 12a) significantly increases as the combustion becomes more complete, resulting in the oxidation of a higher quantity of hydrocarbons to CO2. Concurrently, the consumption rate of O2 rises due to the heightened demand for O2 by the combustion reactions (Figure 12b). In terms of H2O generation (Figure 12c), the formation of water vapor increases alongside the intensification of combustion reactions. However, excessively high temperatures in the MSW incinerator may also lead to adverse effects, including high-temperature slagging, corrosion, and an increased burden on the furnace body.
Furthermore, variations in the MSW incinerator temperature can significantly impact the mixing and diffusion of gases within the incinerator. At lower MSW incinerator temperatures, the gas flow rate is reduced, resulting in less effective mixing and diffusion. This condition can lead to uneven combustion and localized high temperatures. In contrast, higher MSW incinerator temperatures increase the gas flow rate, which enhances mixing and diffusion and promotes more uniform and efficient combustion [30].
To summarize, when the operating temperature in the incinerator is set to 800 K, the concentration distribution of gas components is relatively ideal. However, as the temperature increases further, the dynamic equilibrium of gas components in the furnace changes significantly. Specifically, under high-temperature conditions, the concentrations of carbon dioxide and water vapor increase significantly. This phenomenon leads to a relative reduction in oxygen supply during the incineration process, adversely affecting the progress of the combustion reaction. An increase in carbon dioxide and water vapor not only dilutes the concentrations of oxygen and nitrogen but may also reduce incineration efficiency and slow down the reaction rate. Therefore, during incinerator operation, the temperature must be carefully controlled to ensure both the efficiency and stability of the combustion process.

4. Conclusions

In conclusion, this study on the co-combustion of municipal solid waste (MSW) with sewage sludge (SS) has identified the optimal conditions for efficient and environmentally compliant incineration. The most effective combustion is achieved at an MSW incinerator temperature of 800 K, with a 7% SS co-combustion ratio, ensuring stable and efficient fuel mixing. As the SS ratio increases beyond 7%, the temperature distribution becomes uneven, and the fluid flow in the incinerator exhibits heightened turbulence, potentially leading to incomplete combustion and reduced combustion efficiency. When the MSW incinerator temperature is maintained at 800 K, it is conducive to the complete combustion of combustible components within MSW and SS. The analysis of the pollutant concentration field revealed that the lower and central regions of the incinerator are the main combustion zones, with the complete oxidation of fuels. This study also demonstrated that higher incinerator temperatures result in more complex temperature distributions and intensified combustion reactions, although excessively high temperatures can lead to operational challenges. Ultimately, the research suggests that an MSW incinerator temperature of 800 K, coupled with a 7% SS co-combustion ratio, provides a balance between combustion efficiency and environmental performance, facilitating complete fuel combustion and optimal energy recovery. These findings are crucial for the optimization of MSW and SS co-combustion strategies in incineration processes.

Author Contributions

Conceptualization, H.W. and J.C.; methodology, H.W. and J.C.; software, L.Z. and H.L.; writing—original draft preparation, L.Z. and H.L.; writing—review and editing, L.Z.; funding acquisition, H.W. and J.C. All authors have read and agreed to the published version of the manuscript.

Funding

This research was funded by the Guilin Science and Technology Bureau (20210218-3), the China Postdoctoral Science Foundation (2023M741516) and the National Natural Science Foundation of China (52266011).

Data Availability Statement

Data are contained within the article.

Conflicts of Interest

Author H.W. was employed by Shenzhen Energy Environment, Co., Ltd., and the Real Estate Branch of Shenzhen Energy Group Co., Ltd. The remaining authors declare that the research was conducted in the absence of any commercial or financial relationships that could be construed as a potential conflict of interest.

References

  1. Ding, Y.; Zhao, J.; Liu, J.-W.; Zhou, J.; Cheng, L.; Zhao, J.; Shao, Z.; Iris, Ç.; Pan, B.; Li, X. A review of China’s municipal solid waste (MSW) and comparison with international regions: Management and technologies in treatment and resource utilization. J. Clean. Prod. 2021, 293, 126144. [Google Scholar] [CrossRef]
  2. Kumar, A.; Singh, E.; Mishra, R.; Lo, S.L.; Kumar, S. Global trends in municipal solid waste treatment technologies through the lens of sustainable energy development opportunity. Energy 2023, 275, 127471. [Google Scholar] [CrossRef]
  3. Jiang, X.; Zhao, Y.; Yan, J. Disposal technology and new progress for dioxins and heavy metals in fly ash from municipal solid waste incineration: A critical review. Environ. Pollut. 2022, 311, 119878. [Google Scholar]
  4. Xu, J.; Liao, Y.; Yu, Z.; Cai, Z.; Ma, X.; Dai, M.; Fang, S. Co-combustion of paper sludge in a 750 t/d waste incinerator and effect of sludge moisture content: A simulation study. Fuel 2018, 217, 617–625. [Google Scholar] [CrossRef]
  5. Liang, Y.; Xu, D.; Feng, P.; Hao, B.; Guo, Y.; Wang, S. Municipal sewage sludge incineration and its air pollution control. J. Clean. Prod. 2021, 295, 126456. [Google Scholar] [CrossRef]
  6. Chen, G.; Wang, X.; Li, J.; Yan, B.; Wang, Y.; Wu, X.; Velichkova, R.; Cheng, Z.; Ma, W. Environmental; energy, and economic analysis of integrated treatment of municipal solid waste and sewage sludge: A case study in China. Sci. Total Environ. 2019, 647, 1433–1443. [Google Scholar] [CrossRef] [PubMed]
  7. Werther, J.; Ogada, T. Sewage sludge combustion. Prog. Energy Combust. Sci. 1999, 25, 55–116. [Google Scholar] [CrossRef]
  8. Assi, A.; Bilo, F.; Federici, S.; Zacco, A.; Depero, L.E.; Bontempi, E. Bottom ash derived from municipal solid waste and sewage sludge co-incineration: First results about characterization and reuse. Waste Manag. 2020, 116, 147–156. [Google Scholar] [CrossRef]
  9. Marganingrum, D.; Hidawati; Djaja, S.D.S. A preliminary study of fuel mixtures of industrial sludge, bottom ash, and municipal solid waste for co-firing in coal boilers. Energy Ecol. Environ. 2022, 7, 186–198. [Google Scholar] [CrossRef]
  10. Wang, Y.; Liu, Y.; Yang, W.; Zhao, Q.; Dai, Y. Evaluation of combustion properties and pollutant emission characteristics of blends of sewage sludge and biomass. Sci. Total Environ. 2020, 720, 137365. [Google Scholar] [CrossRef] [PubMed]
  11. Lin, T.; Liao, Y.; Dai, T.; Ma, X. Investigation on co-disposal technology of sludge and municipal solid waste based on numerical simulation. Fuel 2023, 343, 127882. [Google Scholar] [CrossRef]
  12. Lin, H.; Ma, X. Simulation of co-incineration of sewage sludge with municipal solid waste in a grate furnace incinerator. Waste Manag. 2012, 32, 561–567. [Google Scholar] [CrossRef] [PubMed]
  13. Stopford, P.J. Recent applications of CFD modelling in the power generation and combustion industries. Appl. Math. Model. 2002, 26, 351–374. [Google Scholar] [CrossRef]
  14. Costa, M.; Massarotti, N.; Mauro, A.; Arpino, F.; Rocco, V. CFD modelling of a RDF incineration plant. Appl. Therm. Eng. 2016, 101, 710–719. [Google Scholar] [CrossRef]
  15. Yang, Y.; Ryu, C.; Goodfellow, J.; Sharifi, V.N.; Swithenbank, J. Modelling waste combustion in grate furnaces. Process Saf. Environ. Prot. 2004, 82, 208–222. [Google Scholar] [CrossRef]
  16. Shaheed, R.; Mohammadian, A.; Gildeh, H.K. A comparison of standard k–ε and realizable k–ε turbulence models in curved and confluent channels. Environ. Fluid Mech. 2019, 19, 543–568. [Google Scholar] [CrossRef]
  17. Sazhin, S.; Sazhina, E.; Faltsi-Saravelou, O.; Wild, P. The P-1 model for thermal radiation transfer: Advantages and limitations. Fuel 1996, 75, 289–294. [Google Scholar] [CrossRef]
  18. Qian, X.; Lee, S.; Chandrasekaran, R.; Yang, Y.; Caballes, M.; Alamu, O.; Chen, G. Electricity evaluation and emission characteristics of poultry litter co-combustion process. Appl. Sci. 2019, 9, 4116. [Google Scholar] [CrossRef]
  19. Linlin, F.; Zifu, S.; Yonggang, Z.; Xiaolong, P.; Mengmei, M.; Sheng, Z.; Fei, W. Study on Numerical Simulation of Large-scale Waste Incineration Grate Furnace Co-incineration with Sludge. Environ. Sanit. Eng. 2020, 28, 32–37. (In Chinese) [Google Scholar]
  20. Varol, M.; Atimtay, A.T.; Olgun, H.; Atakül, H. Emission characteristics of co-combustion of a low calorie and high sulfur–lignite coal and woodchips in a circulating fluidized bed combustor: Part 1. Effect of excess air ratio. Fuel 2014, 117, 792–800. [Google Scholar] [CrossRef]
  21. Batistella, L.; Silva, V.; Suzin, R.C.; Virmond, E.; Althoff, C.A.; Moreira, R.F.; José, H.J. Gaseous emissions from sewage sludge combustion in a moving bed combustor. Waste Manag. 2015, 46, 430–439. [Google Scholar] [CrossRef]
  22. Chen, L.; Liao, Y.; Xia, Y.; Ma, X. Combustion characteristics of co-combusted municipal solid wastes and sewage sludge. Energy Sources Part A Recovery Util. Environ. Eff. 2020, 46, 5730–5742. [Google Scholar] [CrossRef]
  23. Qian, X.; Xue, J.; Yang, Y.; Lee, S.W. Thermal properties and combustion-related problems prediction of agricultural crop residues. Energies 2021, 14, 4619. [Google Scholar] [CrossRef]
  24. He, S.; Chen, K.; Zhang, Y.; Cheng, Y.; Liu, S.; Yu, B.; Wang, L.; Wang, X. The coincineration of sewage sludge and municipal solid waste in an industrial scale incineration power plant. Int. J. Environ. Sci. Technol. 2023, 20, 2919–2928. [Google Scholar] [CrossRef]
  25. Zhou, X.; Zhou, P.; Zhao, X.; Song, Z.; Wang, W.; Sun, J.; Mao, Y. Applicability of municipal solid waste incineration (MSWI) system integrated with pre-drying or torrefaction for flue gas waste heat recovery. Energy 2021, 224, 120157. [Google Scholar] [CrossRef]
  26. Huang, Z.; Zhu, J.; Wu, X.; Qiu, R.; Xu, Z.; Ruan, J. Eddy current separation can be used in separation of non-ferrous particles from crushed waste printed circuit boards. J. Clean. Prod. 2021, 312, 127755. [Google Scholar] [CrossRef]
  27. Li, Z.; Fan, T.W.; Lun, M.S.; Li, Q. Optimization of municipal solid waste incineration for low-NOx emissions through numerical simulation. Sci. Rep. 2024, 14, 19309. [Google Scholar] [CrossRef] [PubMed]
  28. Lee, H.; Yi, S.-M.; Holsen, T.M.; Seo, Y.-S.; Choi, E. Estimation of CO2 emissions from waste incinerators: Comparison of three methods. Waste Manag. 2018, 73, 247–255. [Google Scholar] [CrossRef]
  29. Tao, J.; Li, Z.; Chen, C.; Liang, R.; Wu, S.; Lin, F.; Cheng, Z.; Yan, B.; Chen, G. Intelligent technologies powering clean incineration of municipal solid waste: A system review. Sci. Total Environ. 2024, 173082. [Google Scholar] [CrossRef]
  30. Zhuang, J.; Tang, J.; Aljerf, L. Comprehensive review on mechanism analysis and numerical simulation of municipal solid waste incineration process based on mechanical grate. Fuel 2022, 320, 123826. [Google Scholar] [CrossRef]
Figure 1. Schematic diagram of the structure of MSW incinerator. (a) Side view; (b) Top view; (c) Front view.
Processes 12 02172 g001
Figure 2. Temperature distribution cloud diagram under different SS co-combustion ratios: (a) 5%, (b) 7%, (c) 10%, (d) 15%.
Processes 12 02172 g002
Figure 3. Velocity trajectory diagrams at different SS co-combustion ratios: (a) 5%, (b) 7%, (c) 10%, (d) 15%.
Processes 12 02172 g003
Figure 4. Distribution of components in the MSW incinerator chamber at a combustion temperature of 800 K and an SS co-combustion ratio of 5%: (a) CO2, (b) O2, (c) H2O, (d) N2.
Processes 12 02172 g004
Figure 5. The distribution of components in the MSW incinerator chamber at a combustion temperature of 800 K and an SS co-combustion ratio of 7%: (a) CO2, (b) O2, (c) H2O, and (d) N2.
Processes 12 02172 g005
Figure 6. The distribution of components in the MSW incinerator chamber at a combustion temperature of 800 K and a sewage sludge co-combustion ratio of 10%: (a) CO2, (b) O2, (c) H2O, and (d) N2.
Processes 12 02172 g006
Figure 7. The distribution of components in the MSW incinerator chamber at a combustion temperature of 800 K and an SS co-combustion ratio of 15%: (a) CO2, (b) O2, (c) H2O, and (d) N2.
Processes 12 02172 g007
Figure 8. Temperature field in the MSW incinerator at different temperatures: (a) 800 K, (b) 1000 K, (c) 1200 K.
Processes 12 02172 g008
Figure 9. Velocity field in the MSW incinerator at different temperatures: (a) 800 K, (b) 1000 K, (c) 1200 K.
Processes 12 02172 g009
Figure 10. Distribution cloud of MSW incinerator chamber components at 1000 K MSW incinerator temperature: (a) CO2, (b) O2, (c) H2O, (d) N2.
Processes 12 02172 g010
Figure 11. Distribution cloud of MSW incinerator chamber components at 800 K MSW incinerator temperature: (a) CO2, (b) O2, (c) H2O, (d) N2.
Processes 12 02172 g011
Figure 12. Distribution cloud of MSW incinerator chamber components at 1200 K MSW incinerator temperature: (a) CO2, (b) O2, (c) H2O, (d) N2.
Processes 12 02172 g012
Table 1. The ultimate analysis and proximate analysis of the MSW and SS [19].
SamplesUltimate Analysis (wt%)Proximate Analysis (wt%)
CHONSVolatileFixed CarbonAshMoisture
MSW21.133.0110.00.490.162782243
SS16.742.348.762.70.624.366.7828.8640
Table 2. Flue gas component concentration at the junction of the first flue and the second flue under different SS co-combustion ratio (%).
Conditions (%)CO2O2H2ON2
5%19.916.89.448.0
7%20.020.99.7443.5
10%38.621.015.530.0
15%38.923.531.420.0
Disclaimer/Publisher’s Note: The statements, opinions and data contained in all publications are solely those of the individual author(s) and contributor(s) and not of MDPI and/or the editor(s). MDPI and/or the editor(s) disclaim responsibility for any injury to people or property resulting from any ideas, methods, instructions or products referred to in the content.

