Abstract
Induced pluripotent stem cells (iPSCs) are a promising cell source because of their pluripotency and self-renewal abilities. However, there is a risk of pluripotency loss during cell expansion. Particularly, cell passaging is associated with a higher risk of decreasing cell quality. There are two iPSC passaging methods: single-cell and clump passaging. Single-cell passaging is a rapid and simple method for cell manipulation, whereas clump passaging is superior for maintaining iPSC pluripotency. Therefore, clump passaging is a robust method for expanding iPSCs while maintaining their pluripotency. However, clump size control during clump passaging is difficult because colony fragmentation is performed manually by pipetting the colonies detached from the cell culture substrates. In this study, the effect of pipetting on iPSC colony fragmentation was evaluated and the relationship between iPSC clump size and pluripotency was clarified. An automated pipetting device was developed to standardize the clump passage process. The effect of clump size on the pluripotency and proliferative capacity of mouse iPSCs was investigated. Clump size was controlled by varying the number of pipetting cycles, and pluripotency and proliferation were assessed via alkaline phosphatase staining and flow cytometry. Our results revealed that a decrease in clump size corresponded to an increase in cell proliferation, while pluripotency maintenance was optimized under specific clump sizes. These results underscore the significance of clump size for stem cell quality, emphasizing the need for a balanced approach to maintain pluripotency while fostering proliferation in the cell expansion culture for iPSCs.
1. Introduction
Pluripotent stem cells (PSCs) are characterized by their ability to self-replicate and differentiate into various cell types [1]. PSCs, which can differentiate into cells of all three germ layers, are expected to have significant applications in regenerative medicine, in contrast to somatic stem cells, which differentiate into specific tissues. Embryonic stem (ES) cells and induced pluripotent stem cells (iPSCs) are PSC examples derived from embryos and somatic cells, respectively. iPSCs have the potential for use in disease research and therapeutic development.
Adhesive cells are typically cultured in plastic culture dishes under mono-layered growth conditions. When the surface of a dish is covered with cells, they are enzymatically detached and transferred to new vessels for further proliferation in a process known as cell passaging, which is performed repeatedly to obtain the required cell count for therapy or research. There are two primary methods for passaging PSCs: single-cell [2,3] and clump passaging [4]. Single-cell passaging disperses the cells into a single-cell suspension before seeding them into new culture vessels. Although a coating matrix for culture vessels has been developed to maintain pluripotency under the single-passaging procedure, there are iPSC pluripotency degeneration risks. Clump passaging involves seeding small cell clusters fragmented from harvested cell colonies. This method retains cell–cell interactions during passaging operations to maintain pluripotency in the subsequent culture in new culture vessels.
To expand stem cell culture, it is vital to proliferate a large quantity of cells while maintaining their pluripotency and proliferative capacity. Although automated cell culture systems have been developed to increase cell culture efficiency [5,6,7,8,9,10], the intricate manual techniques required for clump passaging have not yet been fully automated. It is imperative to understand how clump size affects cell pluripotency and proliferation during clump passaging. Yeon et al. [11] optimized the clump size of adult human multi-potent neural cells to increase the efficiency of their isolation and in vitro expansion culture. However, the relationship between PSC clump size and pluripotency has not been studied in detail. In addition, a precise clump size control method has not been developed to date. Therefore, this study aimed to automate the pipetting step in passaging operations and clarify the effect of clump size on the pluripotency and proliferation of PSCs during clump passaging to determine the optimal condition of clump passaging. An automated device that performs pipetting during cell passaging was developed to control the size of cell clumps. Cell clumps of various sizes were generated by controlling the number of pipetting cycles, and the effects of clump size on pluripotency and the proliferative capacity were evaluated in mouse iPSCs (miPSCs).
2. Materials and Methods
2.1. Automated Pipetting Device
Clump passaging of PSCs, in which the cells are seeded in fragmented clusters, is considered more suitable for retaining cell pluripotency than single-cell passaging, in which the cells are completely dissociated. However, there are variations in clump size owing to the inconsistency in the number of pipetting actions and aspiration and dispensing rates by different operators. Therefore, a pipetting device was developed to control the pipetting process mechanically and ensure experimental reproducibility.
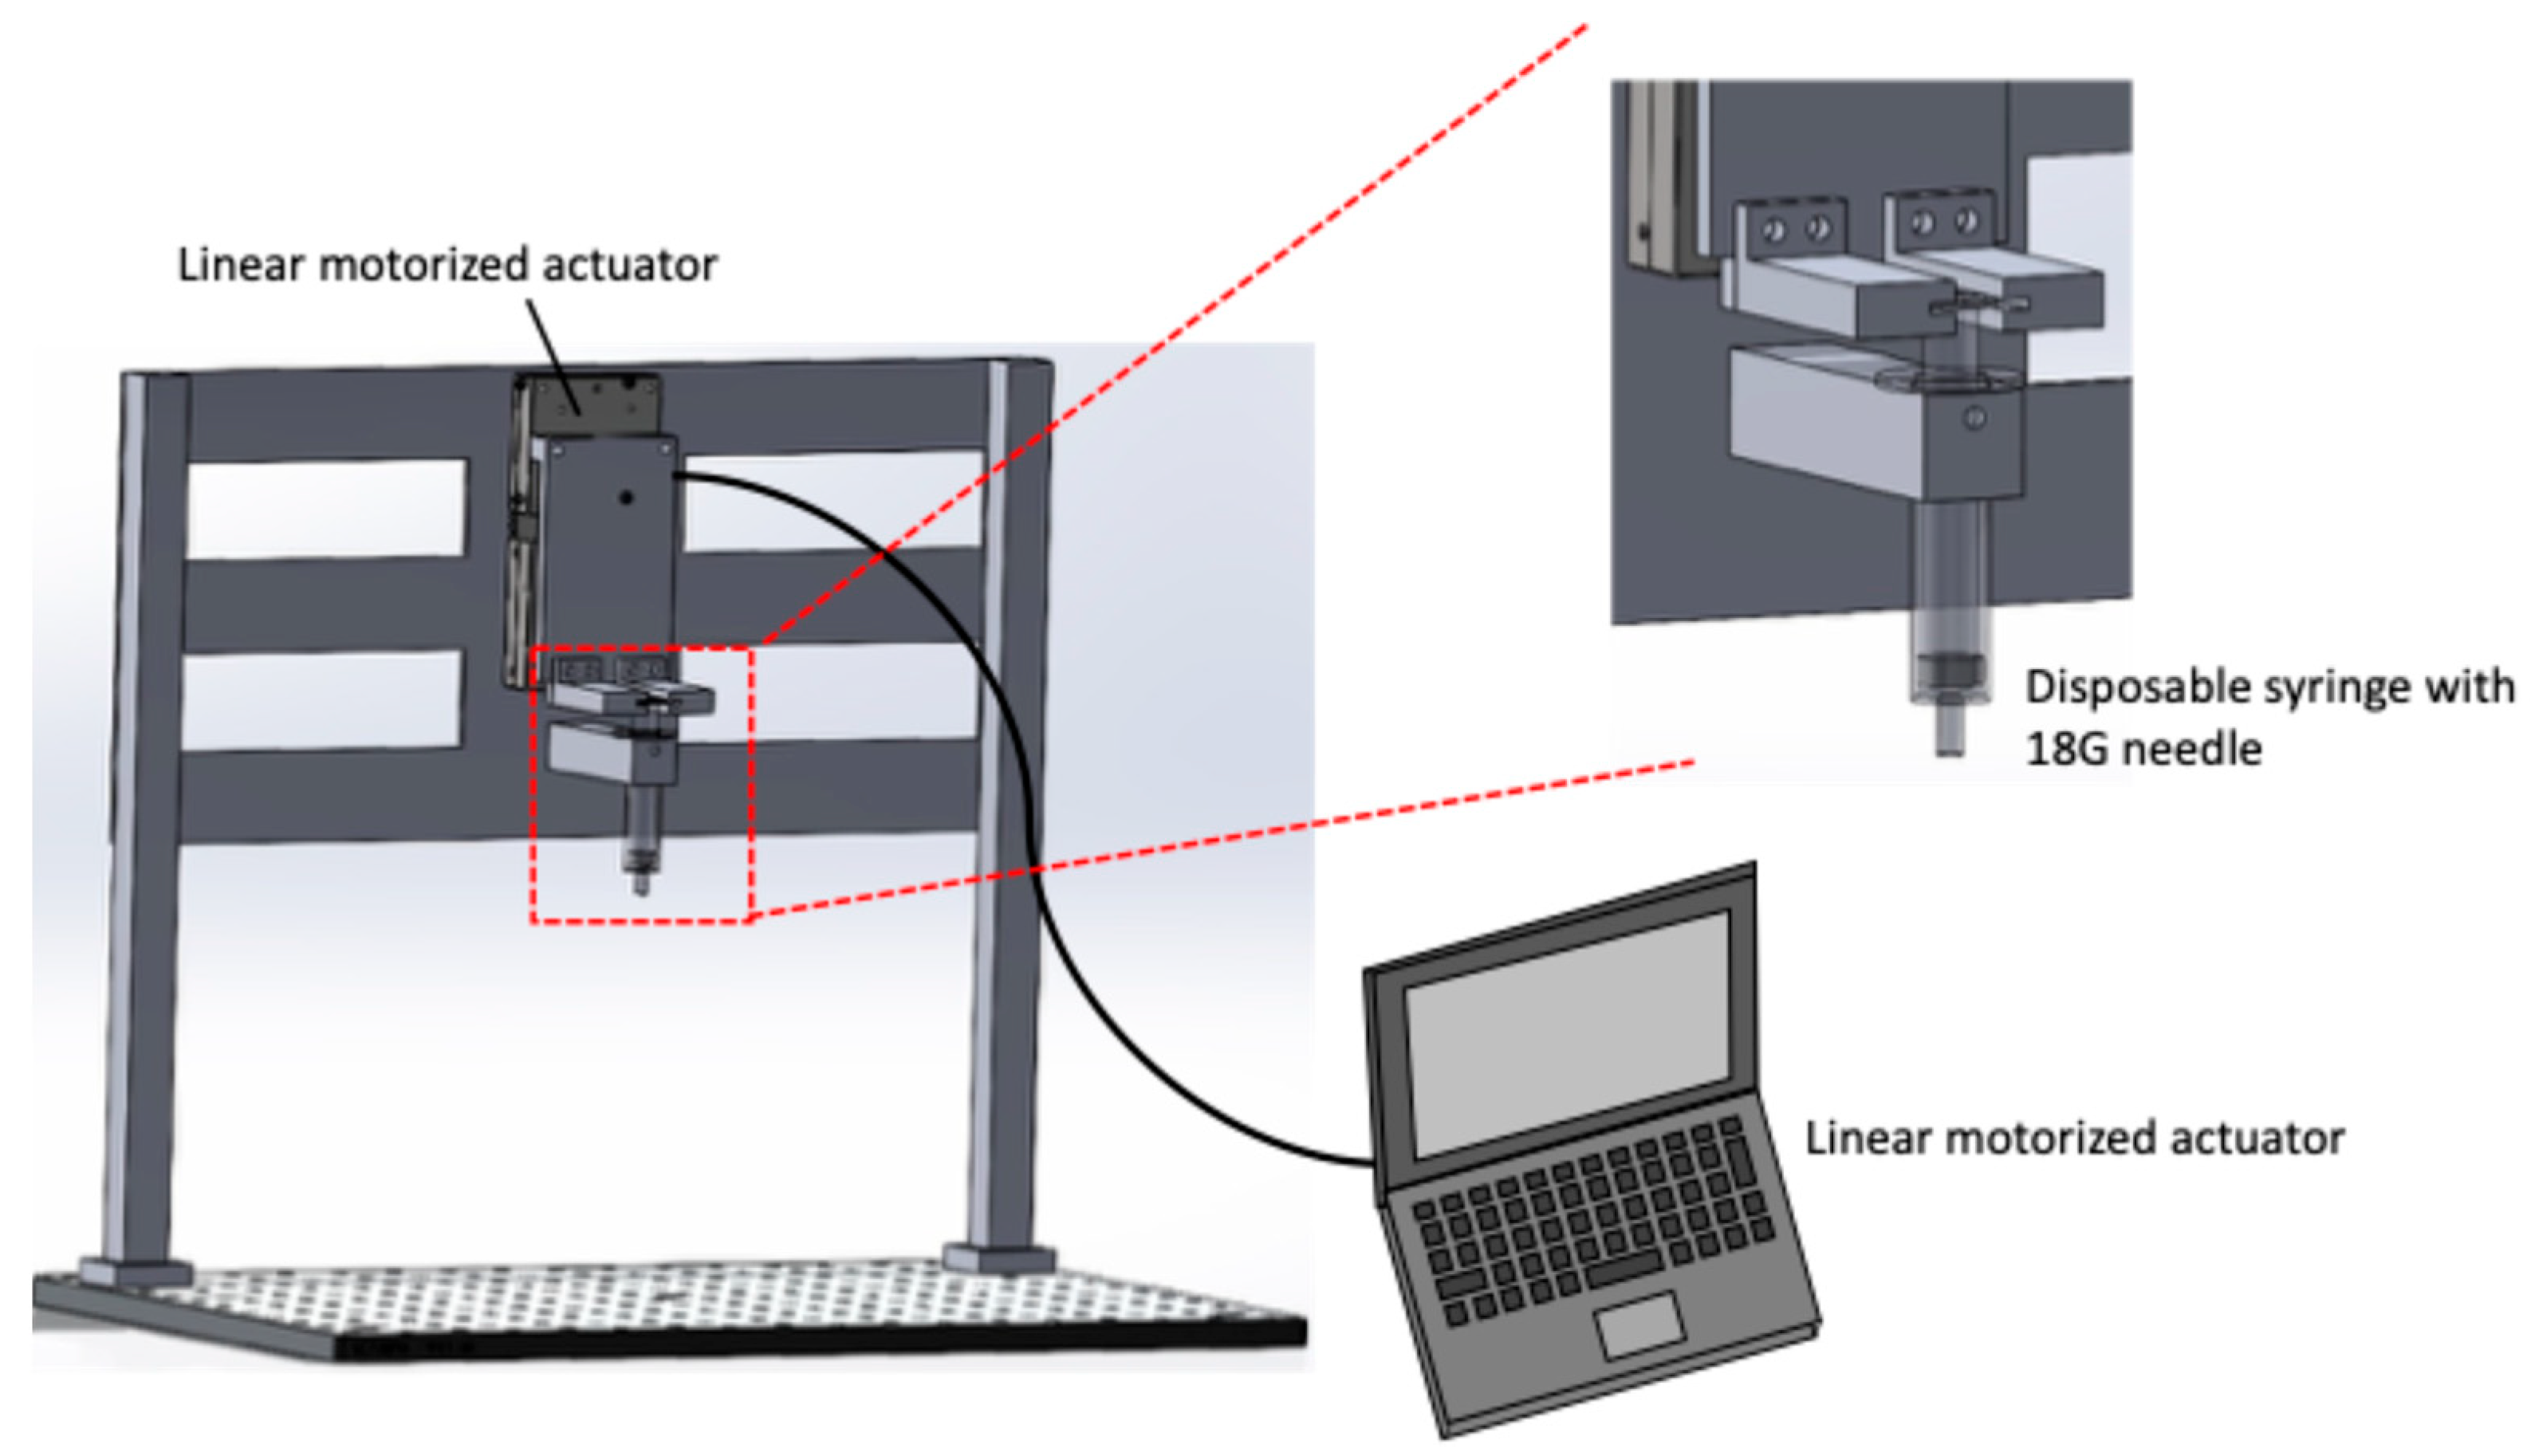
Figure 1 shows a schematic of the pipetting device. The device consists of a linear motorized actuator (TSDM60-20X-0B, Sigma Koki, Tokyo, Japan) and a disposable syringe. The actuator is controlled using a commercial systems-engineering software (LabVIEW ver. 9.0, National Instruments, Austin, TX, USA), allowing precise volume and speed regulation of the cell suspension aspiration and dispensing. A 5 mL disposable syringe equipped with an 18G needle was used to aspirate and dispense the solution. During pipetting, the needle position was fixed close to the bottom of a 115 mL tube containing the harvested cell suspension. The device was driven at a flow rate of 4.77 mm/s, based on the flow rate of the pipette-aid, with the stroke set to 0.75 mm to achieve a pipetting volume of 1 mL. The number of pipetting actions was set to three different conditions: 3, 10, and 20 cycles.

Figure 1.
Schematic of the automated pipetting device. The device consists of a linear motorized actuator and a disposable syringe with 18G needle to control the liquid aspiration and dispensing volume and rate. The stroke and maximum speed of linear motorized stage are 20 mm and 5 mm/s, respectively.
2.2. Clump Passaging Experiment of miPSCs for Pluripotency and Proliferation Evaluation
In this experiment, a mouse-induced pluripotent stem cell line (iPS-MEF-Ng-20D-17, provided by RIKEN Cell Bank) derived from mouse embryonic fibroblasts (MEFs) via retroviral transfection of Oct3/4, Sox2, Klf4, and c-Myc [12] was used. This cell line was modified to express green fluorescent protein (GFP) using the Nanog promoter as a marker for pluripotency. DMEM (sodium pyruvate-free) supplemented with 15% FBS, 1% Antibiotic-Antimycotic, 0.1 mM non-essential amino acids (NEAA), 0.1 mM 2-mercaptoethanol (2ME), and 1000 U/mL Leukemia Inhibitory Factor (LIF) was used as the culture medium. Prior to cell seeding, 25-cm2 flasks were coated with 0.1% gelatin solution and incubated for 30 min to allow the gelatin to coat the flasks. Subsequently, the gelatin solution was aspirated and the MEFs were seeded as the feeder layer. The following day, the medium was aspirated, and mouse iPSCs were seeded onto the MEF layer. Clump and single-cell passaging experiments were conducted when the cells reached 80% confluence.
The clump and single-cell passaging experimental flow is illustrated in Figure 2. Clump passaging was performed as follows. After washing the cultured cells with PBS, 0.25% trypsin solution was applied for 30 s to detach the MEF layer. Following trypsin treatment, fresh culture medium was added, and miPSC colonies were detached and collected using a cell scraper. The immediately collected cell aggregate suspension was directly passaged into a new flask for the 0-time pipetting (P0) group without pipetting. Suspensions pipetted 3, 10, and 20 times were seeded and cultured for the 3-, 10-, and 20-time pipetting (P3, P10, and P20, respectively) groups. In addition, cultured cells passaged via single-cell passaging were evaluated as the control group. Cells were treated with 0.25% trypsin for 2 min to dissociate colonies into single cells. The pluripotency and proliferative ability of passaged miPSCs were assessed after a 2-day culture period. The cell colony sizes before passaging and the clumps after pipetting were observed using a phase-contrast microscope (CKX53, Olympus, Tokyo, Japan) and a fluorescence microscope (IX73, Olympus, Tokyo, Japan).
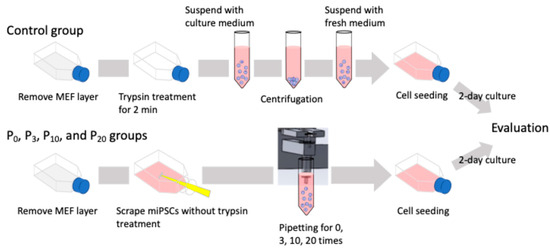
Figure 2.
Schematic of the experimental flow of clump and single-cell passaging. Cells were treated with 0.25% trypsin for 2 min to dissociate the colonies into single cells for the control group. For the clump passaging experimental groups, cell colonies were collected by a cell scraper and fragmented with the automated pipetting device.
2.3. Passaged miPSC Pluripotency and Proliferation Evaluation
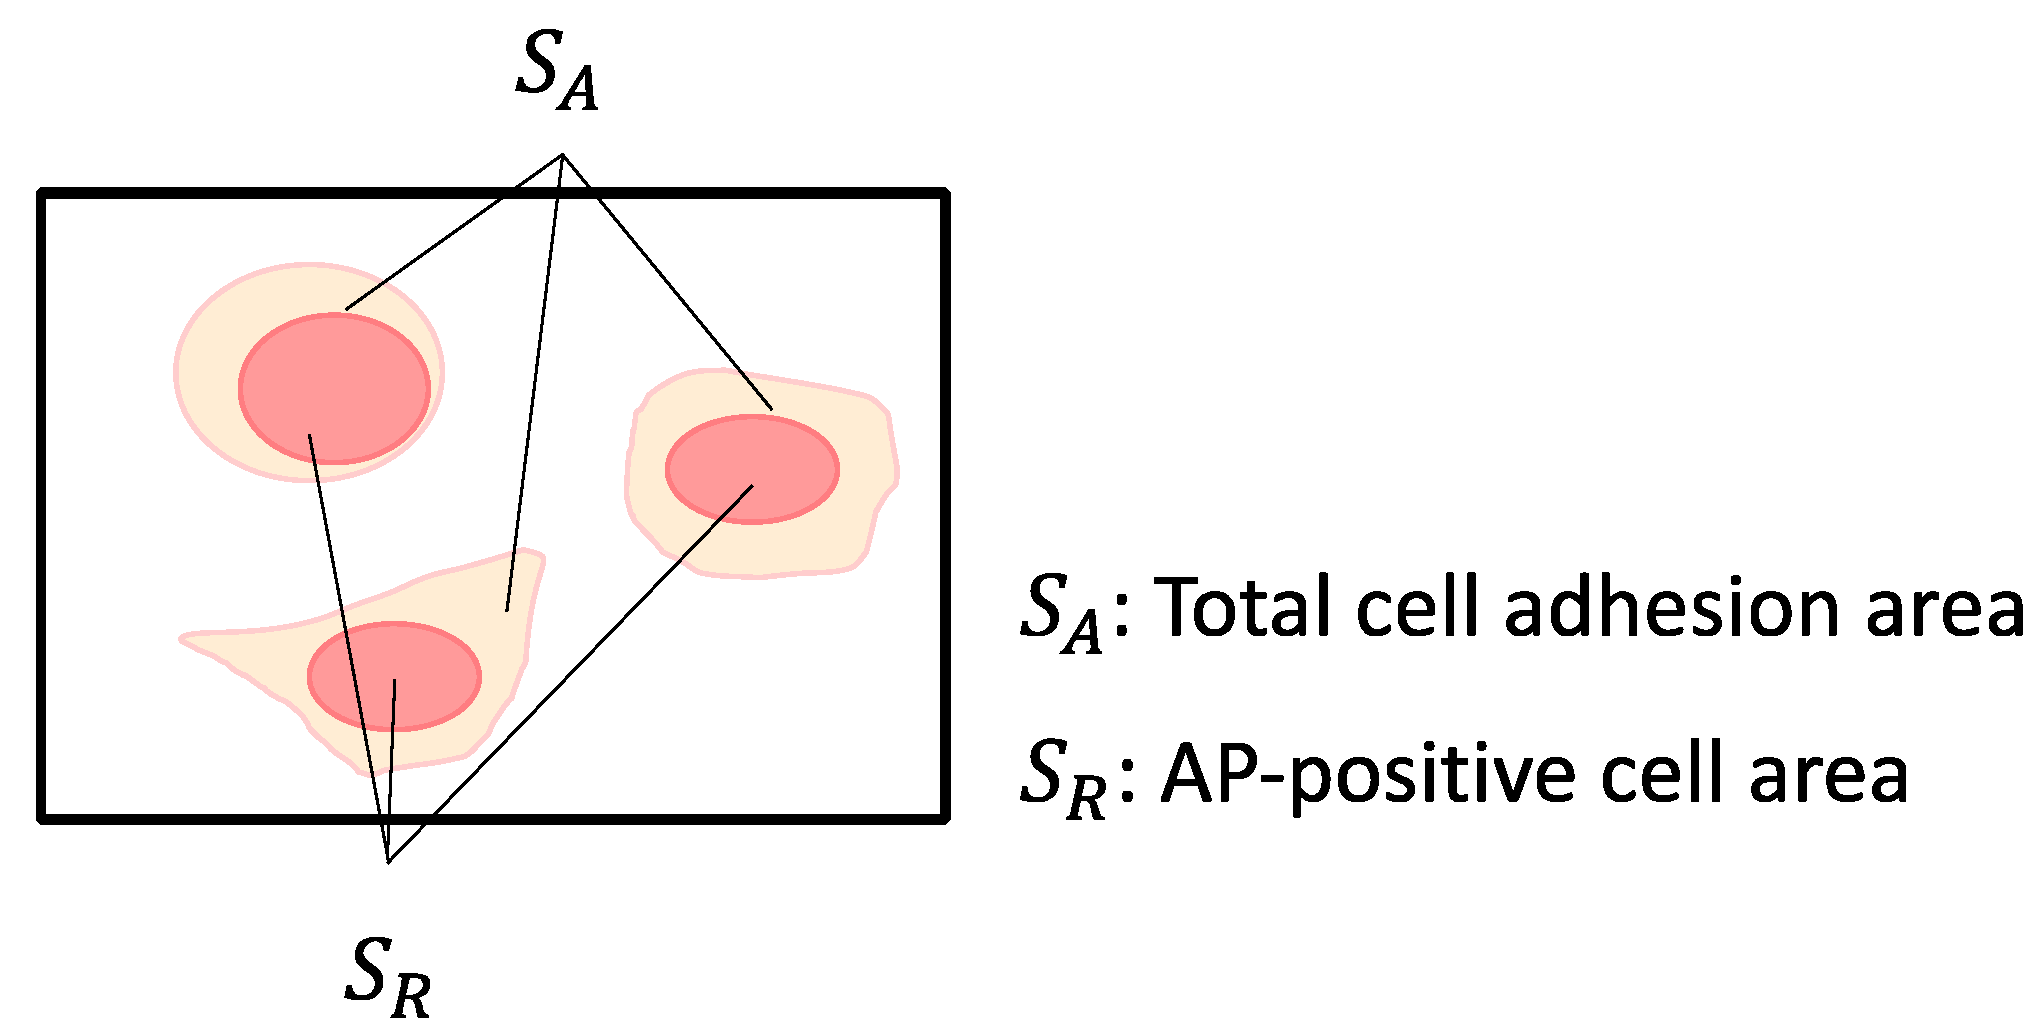
Alkaline phosphatase (AP) staining was performed using a commercially available staining kit (Alkaline Phosphatase Assay Kit, Merck, Rahway, NJ, USA). The stained cells were observed under a phase-contrast microscope (CKX53; Olympus). Phase-contrast microscopic images were analyzed using image analysis software (ImageJ 1.54a, NIH, Bethesda, MD, USA) to calculate the stained area proportion in cultured miPSCs. The cell adhesion area was measured by applying Otsu’s method to binarize the obtained RGB images. The AP-stained area was measured by splitting the RGB image into the red channels using the ‘Split Channels’ function and then applying Otsu’s method for binarization. The total area of all adhesive cells in the microscopic images was designated as the total cell adhesion area (SA), and the area of red-stained cells was designated as the AP-positive cell area (SR) (Figure 3). The AP-positive ratio (SR/SA) was calculated by dividing the AP-positive area with the total cell adhesion area. The cell adhesion ratio (SA/S) was calculated by dividing the cell adhesion area by the area of the microscopic image (S). The total cell adhesion area was measured by binarizing the RGB images obtained using the Otsu method. The AP-positive cell area was measured by separating the red pixels from the RGB images, followed by binarization using the Otsu method. The AP-positive ratio and cell adhesion area are related to pluripotency and proliferation of passaged miPSCs, respectively.
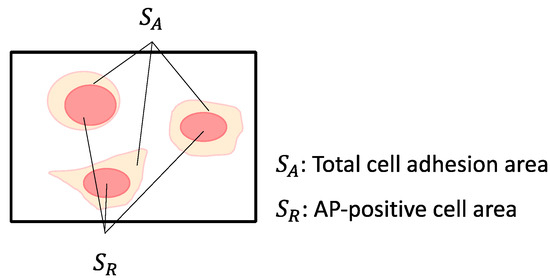
Figure 3.
Evaluation of the AP-stained cell area and cell adhesion area. SA: Total cell adhesion area, SR: AP-positive cell area.
Cultured miPSCs were detached and harvested for quantitative analysis via flow cytometry (BD Accuri C6, BD Bioscience, San Jose, CA, USA). Immunophenotypic characterization was performed via flow cytometry using the monoclonal antibody, Anti-SOX2-PE. Sox2 is a key transcription factor that maintains the pluripotency of PSCs [13]. The cells were incubated with antibodies according to the manufacturer’s instructions. The number of cells stained with the SOX2 antibody was counted using the flow cytometry instrument. Finally, the data were analyzed to evaluate the percentage of miPSCs expressing SOX2.
2.4. Stastical Analysis
Quantitative data are representative of three independent experiments using distinct cell populations. For each experimental group, three samples (n = 3) were analyzed, with each data point representing the mean and standard deviation. The statistical significance of the experimental data were evaluated using the Tukey–Kramer test, with significance set at p < 0.05.
3. Results and Discussion
3.1. Colony Size Distribution of miPSCs Before Cell Passaging
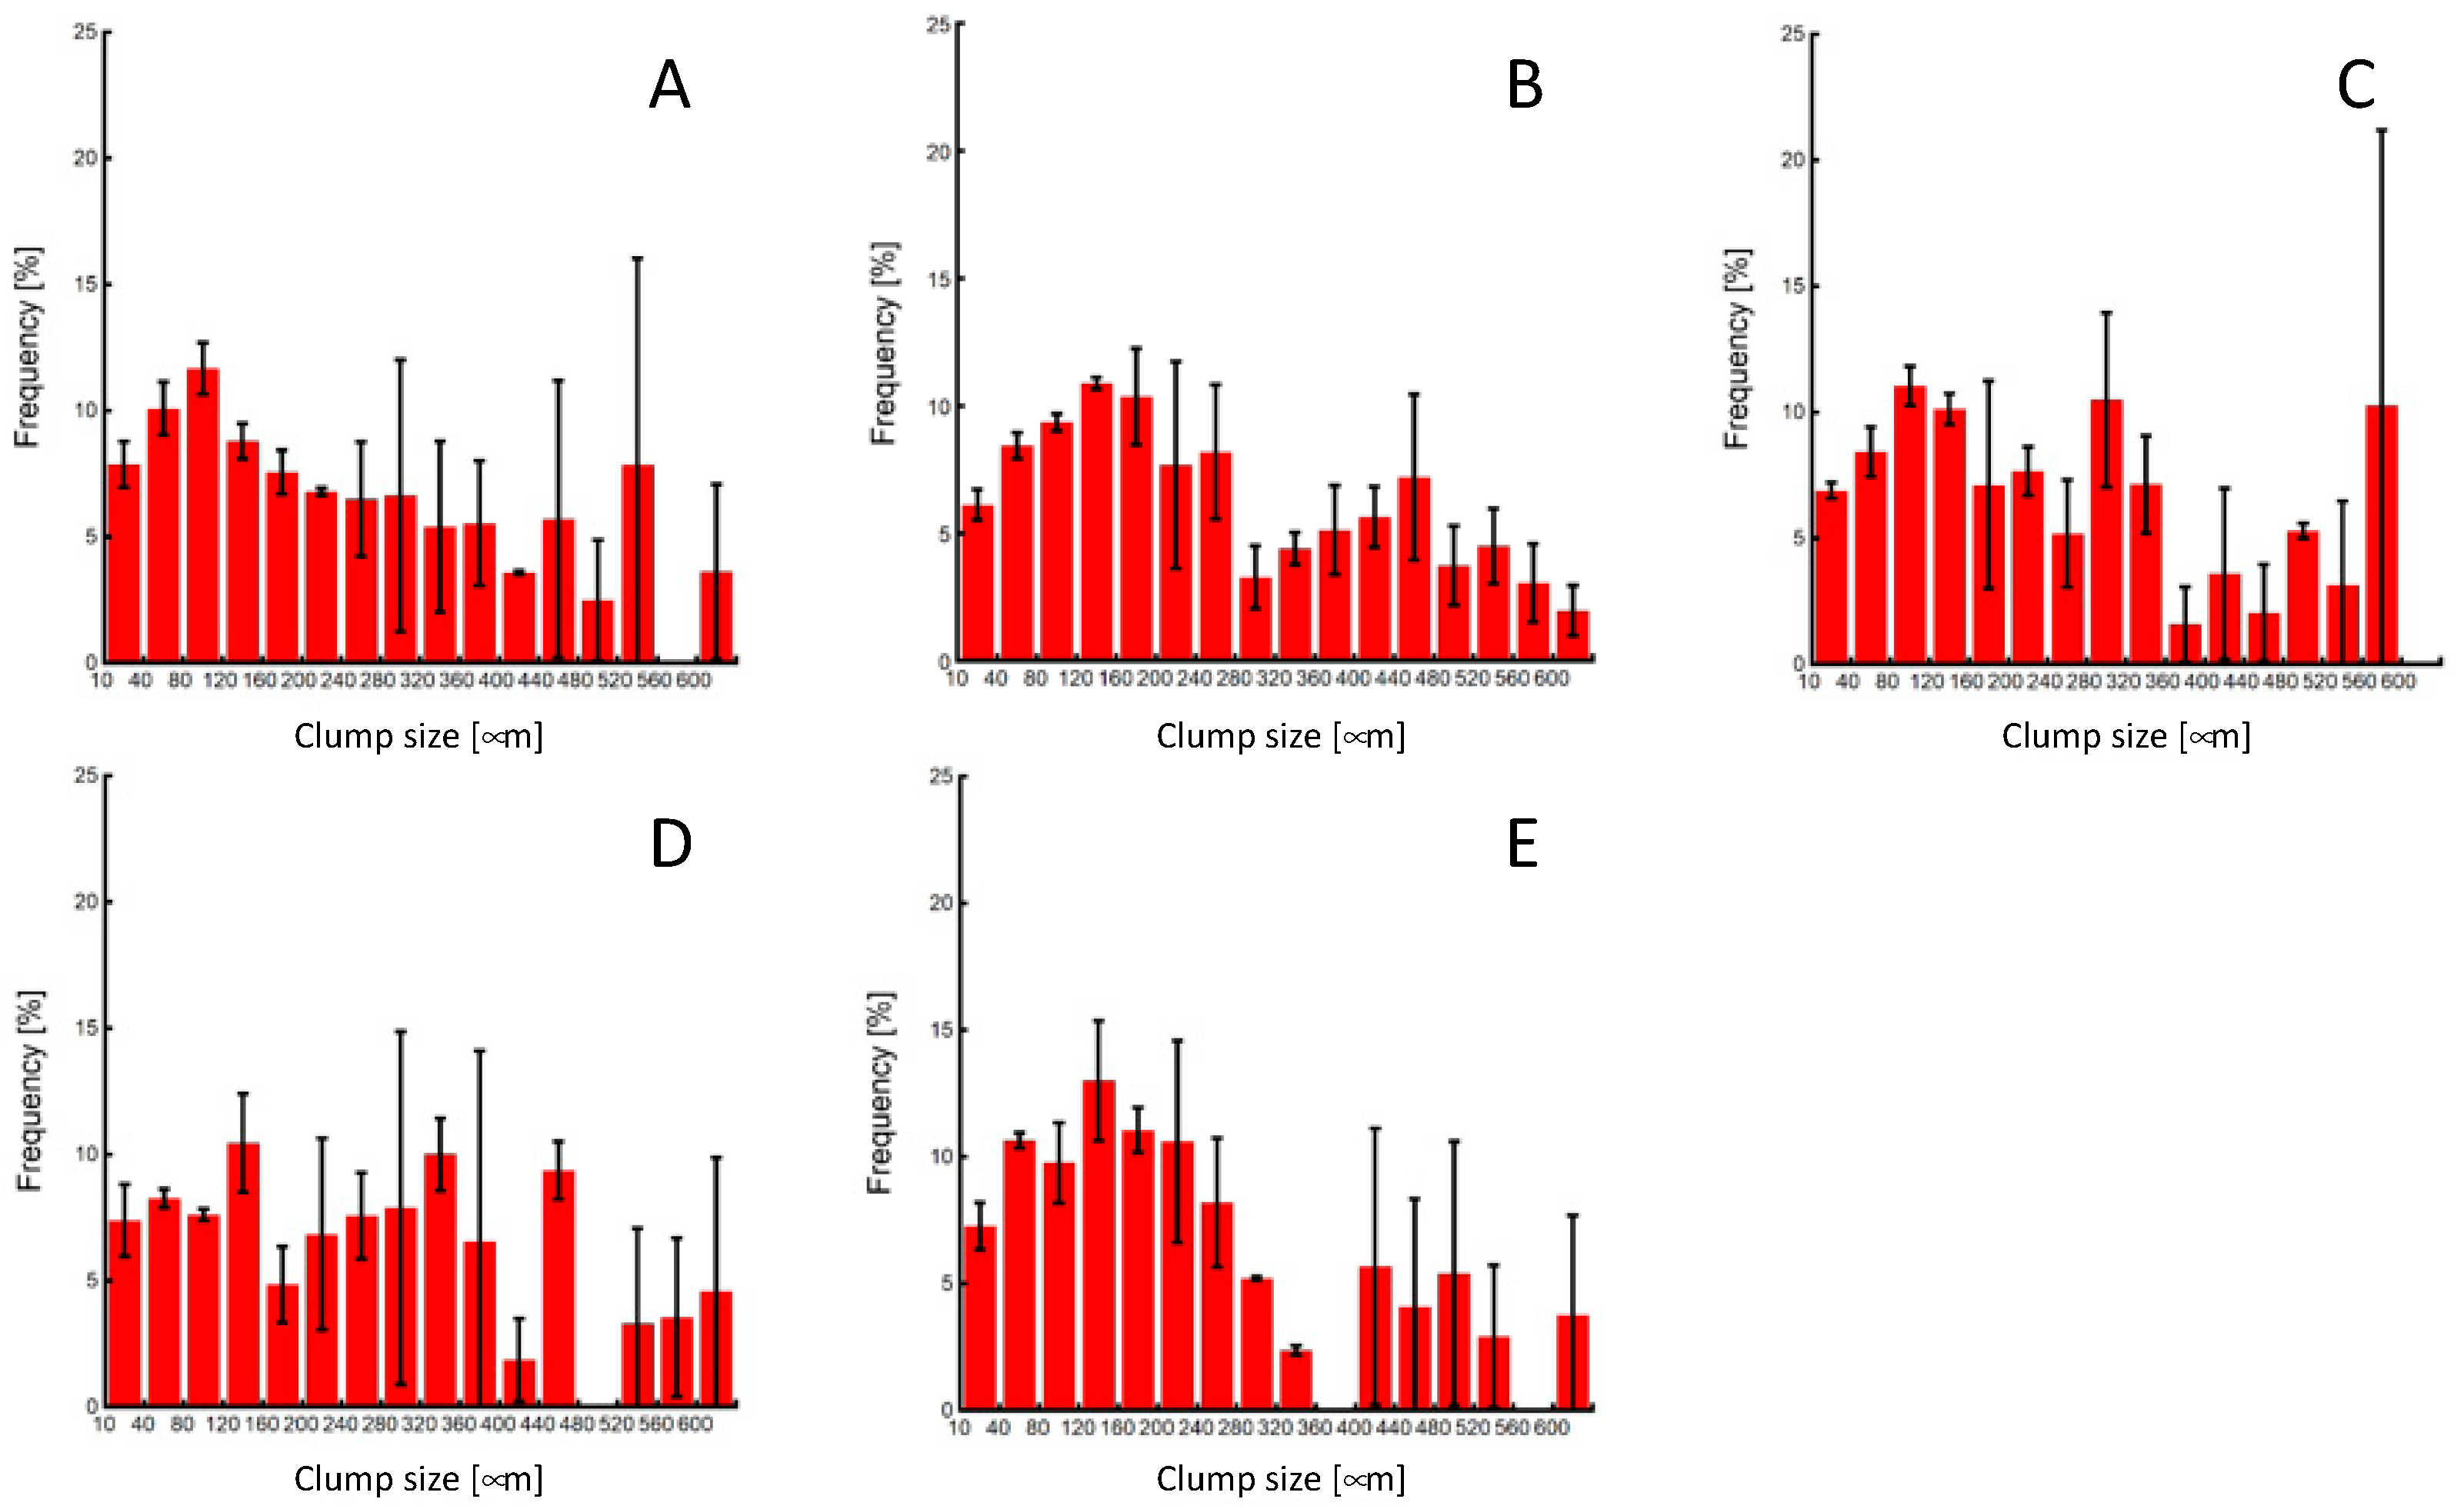
The miPSC line (iPS-MEF-Ng-20D-17) used in this study was modified to express GFP in conjunction with Nanog expression. Merged images of phase-contrast and fluorescent microscopic images of cells prior to passaging showed that colonies specific to undifferentiated iPSCs were formed in all experimental groups, and GFP fluorescence was also observed in both the center and outer regions of the colonies. These results confirm the maintenance of pluripotency in miPSCs before the clump passaging experiments (Figure 4). The colony sizes just before clump passaging were distributed widely, with an average colony size of approximately 250 µm in diameter (Figure 5).
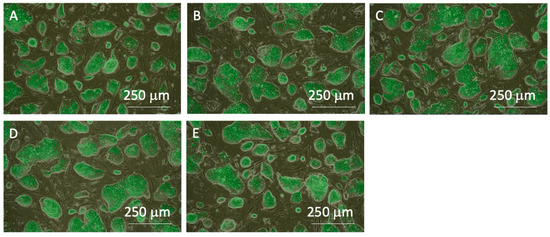
Figure 4.
Phase-contrast images merged with fluorescent images of miPSCs before the subculture process. (A) 0-, (B) 3-, (C) 10-, (D) 20-time pipetting, and (E) control groups. All images were captured using a 4× objective lens.
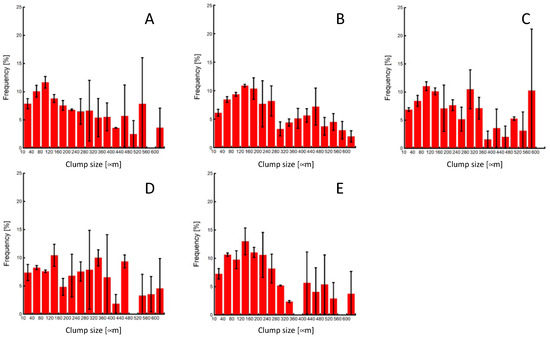
Figure 5.
Colony-size distributions of miPSCs before the subculture process. (A) 0-, (B) 3-, (C) 10-, (D) 20-time pipetting, and (E) control groups.
3.2. Clump Size Distribution After Pipetting
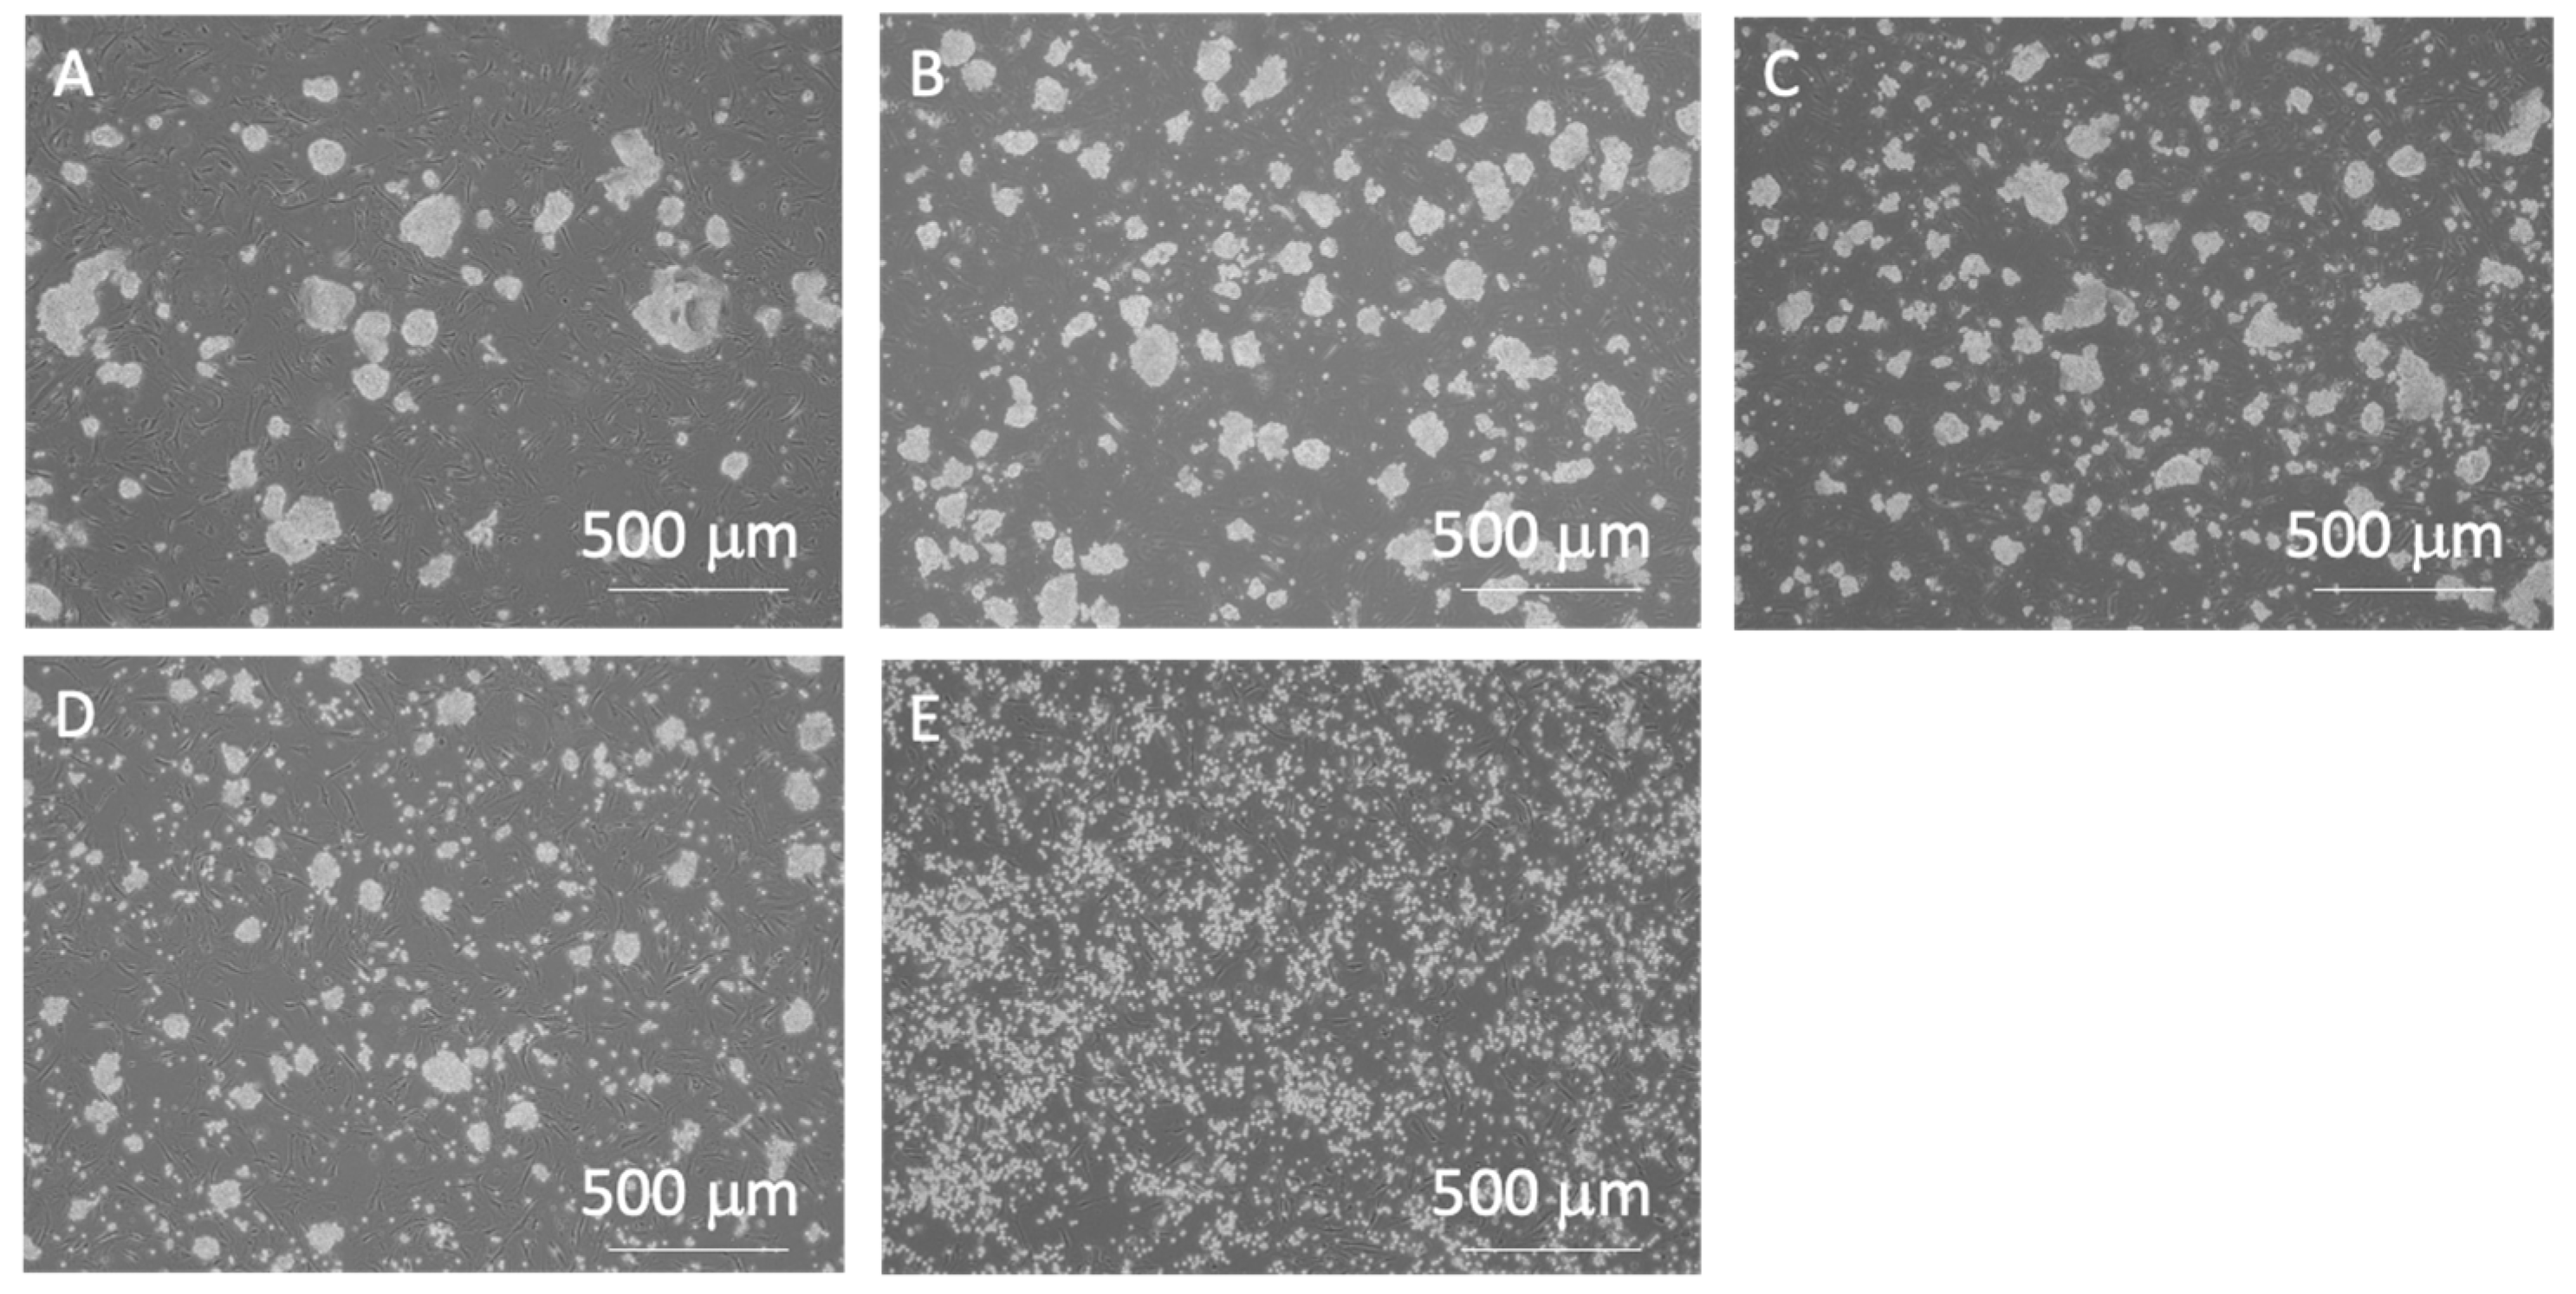
As the number of pipetting actions increased, a tendency towards reduced clump size was observed, with the control group exhibiting an almost complete cell dispersion into a single-cell state (Figure 6 and Figure 7). The cell clump size decreased as the number of pipetting actions increased. Figure 8 shows the clump size proportion in each experimental group. There was an increase in the number of cell aggregates sized below 50 µm and between 50 and 100 µm, while a decrease in aggregates sized 150–200 µm and over 200 µm was noted (Figure 8a). In the P3 experimental group, the combined proportion of clumps ranging between 50 and 100 µm and 100–150 µm was larger compared to the other experimental groups (Figure 8b). However, the proportion of clumps smaller than 50 µm was smaller than that of the P10 and P20 experimental groups. Additionally, in the control group, clump sizes below 50 µm accounted for over 90% of the total, indicating that cell passaging was conducted in a single-cell state. Considering the colony size distribution before cell passaging, the colonies were fragmented to sizes ranging from half to a quarter of their original size by the 3- and 10-time pipetting actions. It is also suggested that as the number of pipetting processes increases, the proportion of clumps smaller than 50 µm, reaching the single-cell size, also increases.

Figure 6.
Phase-contrast images of miPSCs after pipetting or trypsin treatment. (A) 0-, (B) 3-, (C) 10-, (D) 20-time pipetting, and (E) control groups. All images were captured using a 4× objective lens.
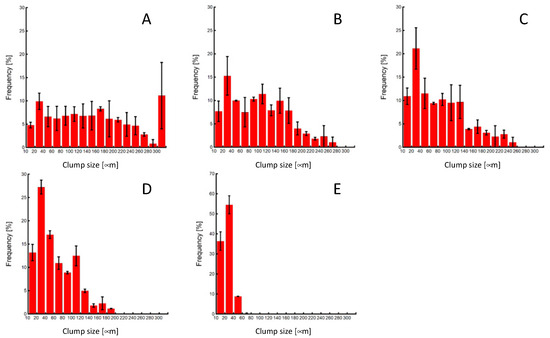
Figure 7.
Clump-size distributions of miPSCs after pipetting or trypsin treatment. (A) 0-, (B) 3-, (C) 10-, (D) 20-time pipetting, and (E) control groups.
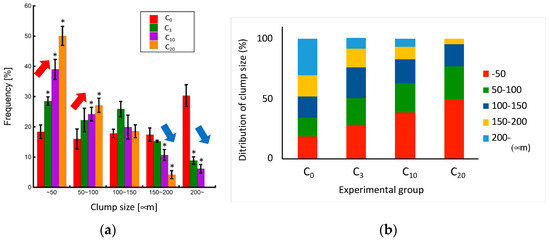
Figure 8.
Relationship between clump size and the number of pipetting actions. (a) Change in each clump size proportion (n = 3, mean ± S.D.) and (b) clump size distribution in each experimental group. Mean +/− SD, n = 3. * indicates a significant difference compared to the value of the C0 group, p < 0.05.
3.3. Pluripotency and Proliferation of miPSCs After Clump Passaging
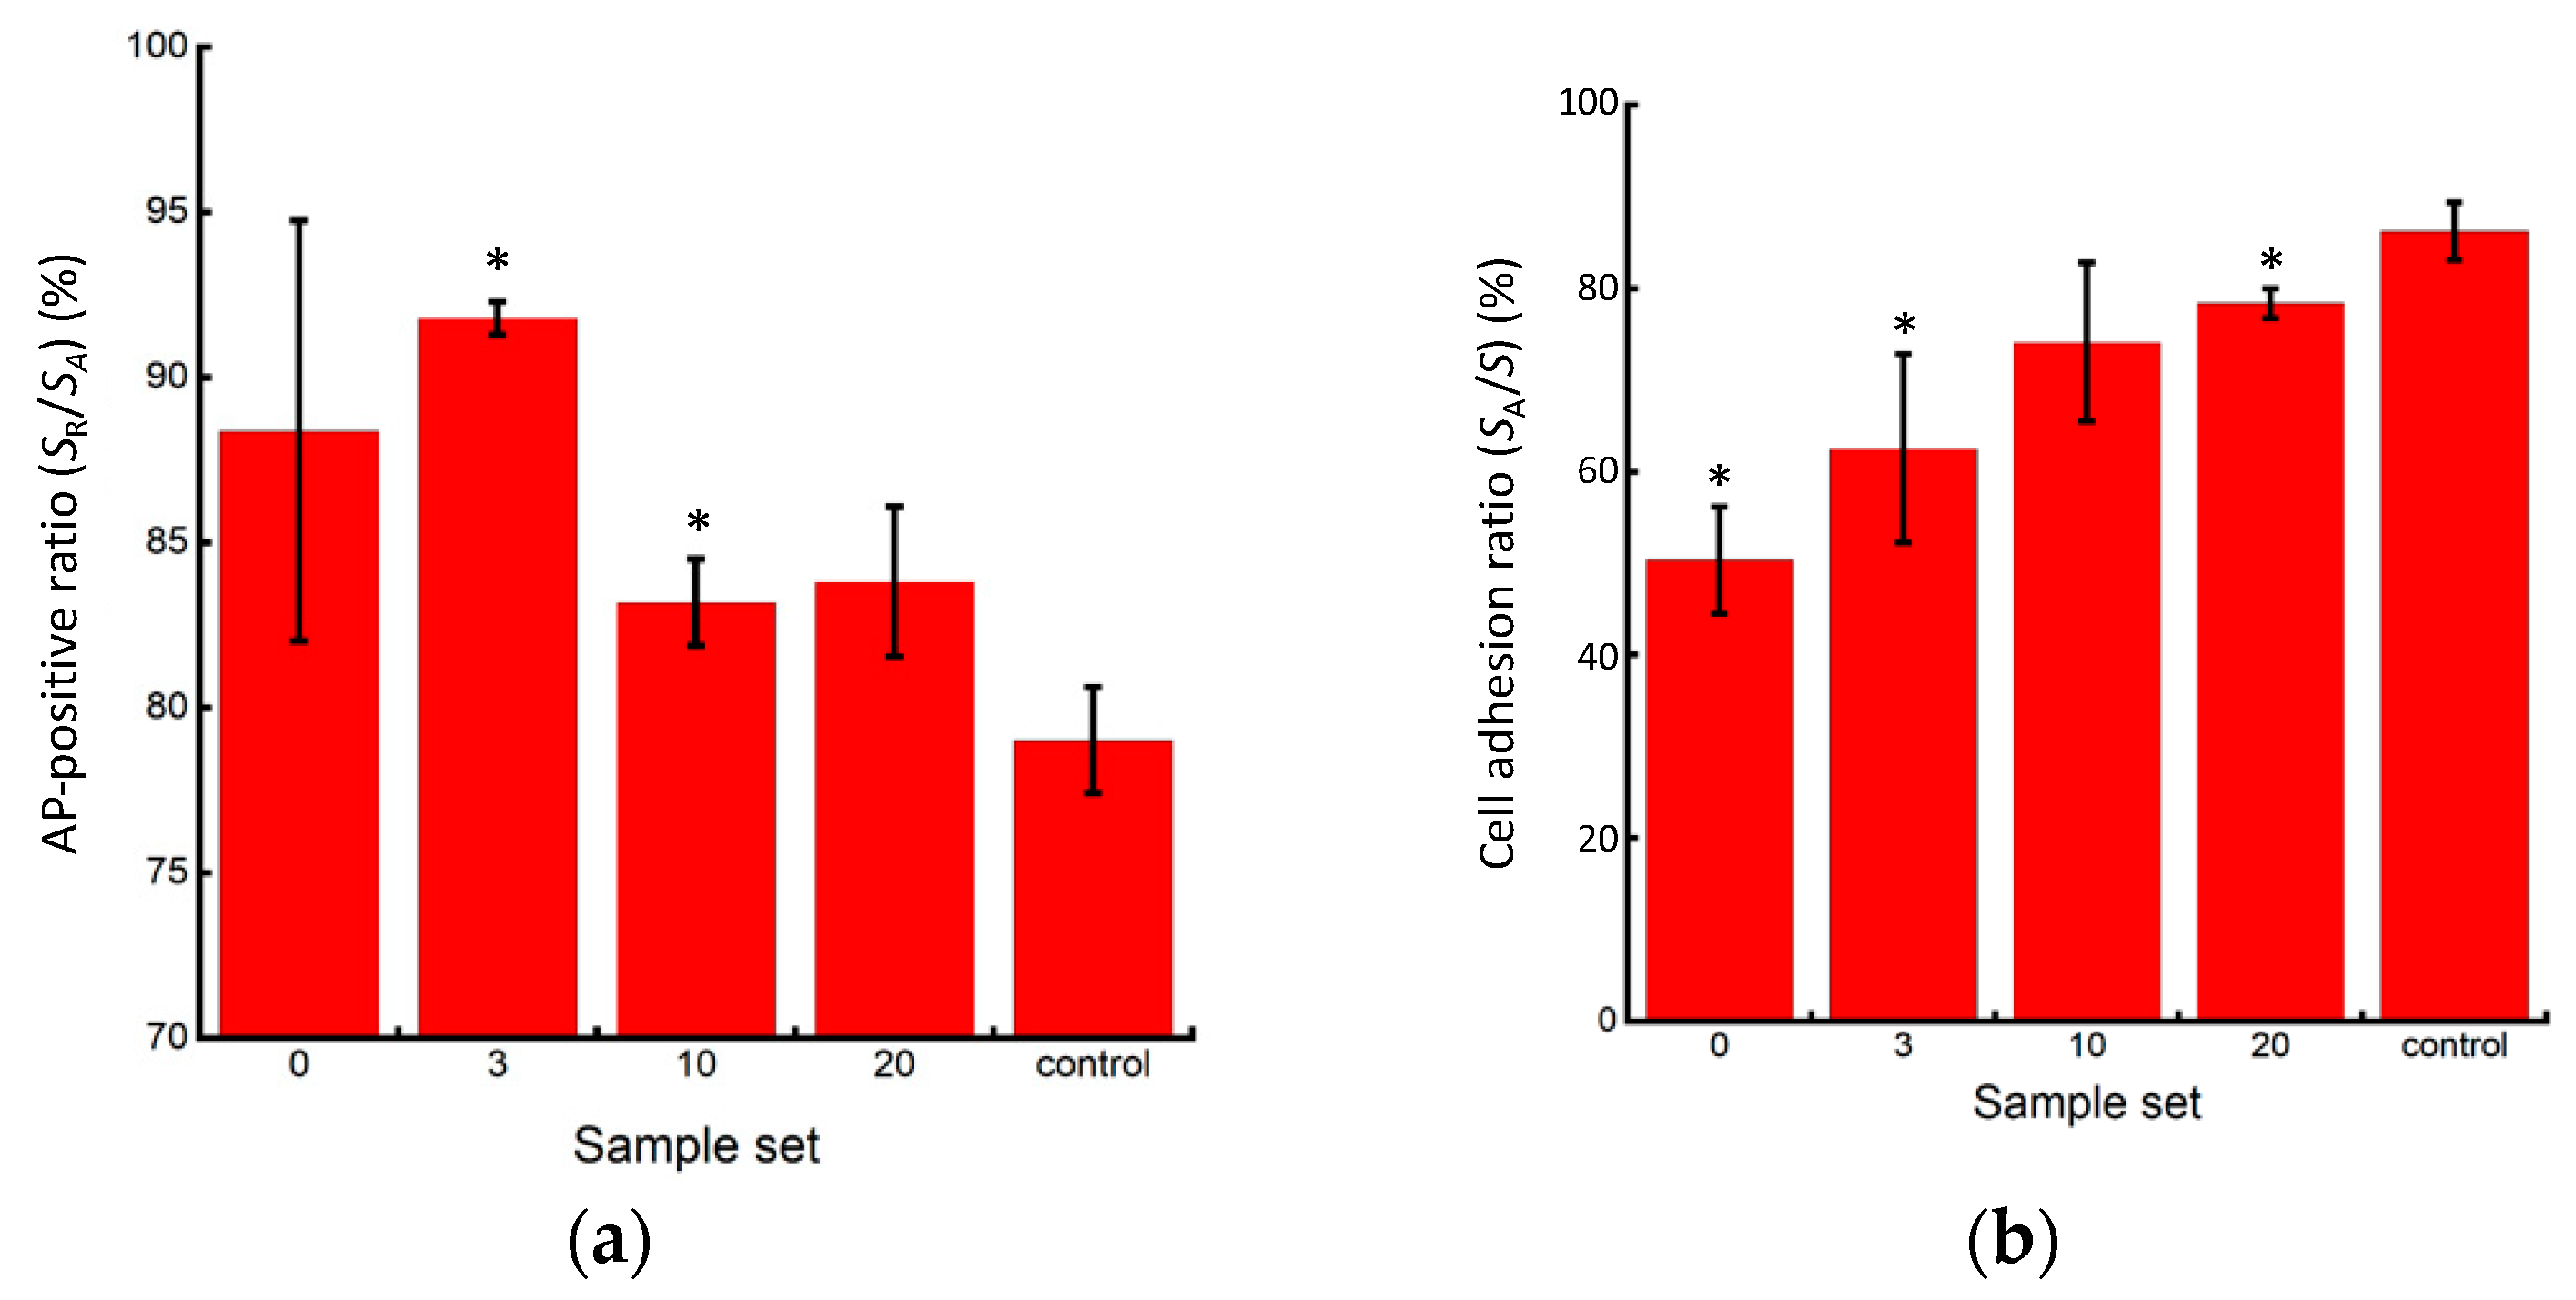
In all experimental groups, the cells exhibited red coloration, indicating positive AP activity (Figure 9). However, lower AP activity, indicating pluripotency loss, was observed at the center of larger colonies after cell passaging without pipetting. Furthermore, the control group exhibited a higher percentage of the cell adhesion area in the microscopic images, indicating higher cell proliferation after passaging. While the cells in the P3 and P10 pipetting groups maintained a high percentage of AP positivity, indicating their pluripotency, the control group exhibited the most significant decrease in the positivity rate, indicating pluripotency loss (Figure 10a). This result suggests that seeding cells at small clump sizes of 50 µm or less, or as single cells, has a risk of inhibiting the maintenance of pluripotency. The reduction in cell number within each clump, as the colony size decreased, led to a reduction in cell–cell interactions, which have been reported to be crucial for maintaining the pluripotency of iPSCs [14,15]. In addition, the lower AP positivity rate in the passaged cells without pipetting action compared to those in the P3 and P10 pipetting groups could be attributed to pluripotency deactivation in the center region of larger clumps sized 200 µm and over. The cell adhesion area ratio increased as the clump size decreased, with the most significant increase observed in the control group (Figure 10b).
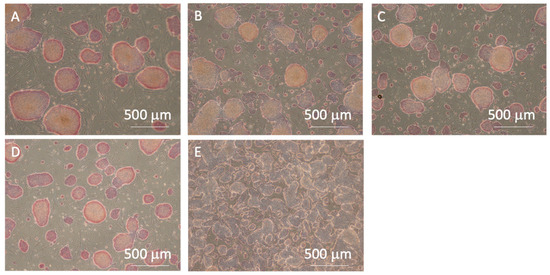
Figure 9.
Microscopic images of alkaline phosphatase staining for the (A) 0-, (B) 3-, (C) 10-, (D) 20-time pipetting groups, and (E) control groups. All images were captured using a 4× objective lens.

Figure 10.
Quantitative evaluation of AP staining results. (a) Rate of AP staining area in cultured miPSC colonies; (b) Area ratio of cultured miPSC colonies (n = 3, mean ± S.D.). Mean +/− SD, n = 3. * indicates a significant difference compared to the value of the control group, p < 0.05.
Figure 11 presents the flow cytometry analysis results for each experimental group. Cells expressing SOX2 were identified in all experimental groups. The proportion of SOX2-expressing cells was higher in the P3 and P10 groups. Similar to the AP staining results, an increase in the proportion of SOX2-expressing cells was observed with increasing clump sizes ranging from 50 to 200 µm in the cell suspension used for seeding, suggesting a tendency to maintain pluripotency. Considering the AP staining and the flow cytometry SOX2 expression evaluation results, the appropriate pipetting action for clump passaging was to fragment the collected original cell colonies into sizes ranging from half to a quarter of their original colony size.
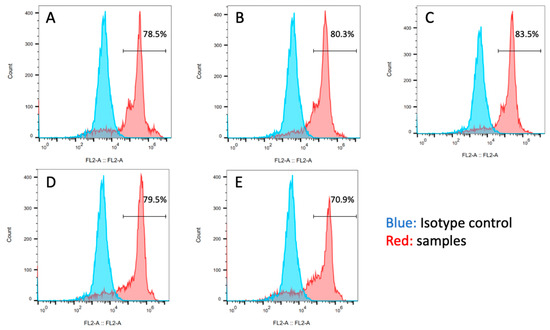
Figure 11.
Flow cytometry analysis of SOX2 expression in the (A) 0-, (B) 3-, (C) 10-, (D) 20-time pipetting groups, and (E) control groups.
4. Conclusions
In this study, the effects of clump size on pluripotency and proliferation during cell passaging were investigated. An automated pipetting device was developed to standardize pipetting operations during the fragmentation process of cultured cell colonies and to evaluate the effect of miPSC clump size on pluripotency and proliferation. The effects of clump size on miPSC pluripotency and proliferation differed. The cell proliferation rate increased as colony size decreased, while the pluripotency was observed to be higher when the original cell colonies were fragmented into sizes ranging from half to a quarter of their original size. For the large-scale culture of pluripotent stem cells, it is necessary to consider whether to prioritize pluripotency or their proliferative capacity when determining the pipetting operational conditions during cell passaging.
Author Contributions
Conceptualization, T.S., H.H. and S.M.; Methodology, K.I., K.A. and S.M.; Investigation, K.I.; Writing—Original Draft, K.I. and S.M.; Writing—Review and Editing, T.S., K.A. and S.M.; Visualization, K.I. and S.M.; Supervision, H.H. and S.M. All authors have read and agreed to the published version of the manuscript.
Funding
This research was funded by a joint research grant from the Shimizu Corporation.
Data Availability Statement
The datasets presented in this article are not readily available because the data are part of an ongoing project. Requests to access the datasets should be directed to the corresponding author.
Conflicts of Interest
The authors declare the following financial interests/personal relationships that may be considered as potential competing interests: Shogo Miyata reports that financial support was provided by the Shimizu Corporation. The Shimizu Corporation had no role in the design of the study; in the collection, analyses, or interpretation of data; in the writing of the manuscript, or in the decision to publish the results.
References
- Nishikawa, S.; Goldstein, R.A.; Nierras, C.R. The promise of human induced pluripotent stem cells for research and therapy. Nat. Rev. Mol. Cell Biol. 2008, 9, 725–729. [Google Scholar] [CrossRef] [PubMed]
- Miyazaki, T.; Isobe, T.; Nakatsuji, N.; Suemori, H. Efficient adhesion culture of human pluripotent stem cells using laminin fragments in an uncoated manner. Sci. Rep. 2017, 7, 41165. [Google Scholar] [CrossRef] [PubMed]
- Miyazaki, T.; Futaki, S.; Suemori, H.; Taniguchi, Y.; Yamada, M.; Kawasaki, M.; Hayashi, M.; Kumagai, H.; Nakatsuji, N.; Sekiguchi, K.; et al. Laminin E8 fragments support efficient adhesion and expansion of dissociated human pluripotent stem cells. Nat. Commun. 2012, 3, 1236. [Google Scholar] [CrossRef] [PubMed]
- Chen, K.G.; Mallon, B.S.; McKay, R.D.G.; Robey, P.G. Human pluripotent stem cell culture: Considerations for maintenance, expansion, and therapeutics. Cell Stem Cell. 2014, 14, 13–26. [Google Scholar] [CrossRef] [PubMed]
- Daniszewski, M.; Crombie, D.E.; Henderson, R.; Liang, H.H.; Wong, R.C.; Hewitt, A.W.; Pébay, A. Automated cell culture systems and their applications to human pluripotent stem cell studies. SLAS Technol. 2018, 23, 315–325. [Google Scholar] [CrossRef] [PubMed]
- Tischler, J.; Swank, Z.; Hsiung, H.A.; Vianello, S.; Lutolf, M.P.; Maerkl, S.J. An automated do-it-yourself system for dynamic stem cell and organoid culture in standard multi-well plates. Cell Rep. Methods. 2022, 2, 100244. [Google Scholar] [CrossRef] [PubMed]
- Ohta, A.; Kawai, S.; Pretemer, Y.; Nishio, M.; Nagata, S.; Fuse, H.; Yamagishi, Y.; Toguchida, J. Automated cell culture system for the production of cell aggregates with growth plate-like structure from induced pluripotent stem cells. SLAS Technol. 2023, 28, 433–441. [Google Scholar] [CrossRef] [PubMed]
- Gregor, B.W.; Coston, M.E.; Adams, E.M.; Arakaki, J.; Borensztejn, A.; Do, T.P.; Fuqua, M.A.; Haupt, A.; Hendershott, M.C.; Leung, W.; et al. Automated human induced pluripotent stem cell culture and sample preparation for 3D live-cell microscopy. Nat. Protoc. 2024, 19, 565–594. [Google Scholar] [CrossRef] [PubMed]
- Soares, F.A.C.; Chandra, A.; Thomas, R.J.; Pedersen, R.A.; Vallier, L.; Williams, D.J. Investigating the feasibility of scale up and automation of human induced pluripotent stem cells cultured in aggregates in feeder free conditions. J. Biotechnol. 2014, 173, 53–58. [Google Scholar] [CrossRef] [PubMed]
- Borys, B.S.; Dang, T.; So, T.; Rohani, L.; Revay, T.; Walsh, T.; Thompson, M.; Argiropoulos, B.; Rancourt, D.E.; Jung, S.; et al. Overcoming bioprocess bottlenecks in the large-scale expansion of high-quality hiPSC aggregates in vertical-wheel stirred suspension bioreactors. Stem Cell Res. Ther. 2021, 12, 55. [Google Scholar] [CrossRef] [PubMed]
- Yeon, J.Y.; Hwang, J.Y.; Lee, H.W.; Pyeon, H.J.; Won, J.S.; Noh, Y.J.; Nam, H.; Joo, K.M. Optimized clump culture methods for adult human multipotent neural cells. Int. J. Mol. Sci. 2018, 19, 3380. [Google Scholar] [CrossRef] [PubMed]
- Okita, K.; Ichisaka, T.; Yamanaka, S. Generation of germline-competent induced pluripotent stem cells. Nature 2007, 448, 313–317. [Google Scholar] [CrossRef] [PubMed]
- Liu, S.; Bou, G.; Sun, R.; Guo, S.; Xue, B.; Wei, R.; Cooney, A.J.; Liu, Z. Sox2 is the faithful marker for pluripotency in pig: Evidence from embryonic studies. Dev. Dyn. 2015, 244, 619–627. [Google Scholar] [CrossRef]
- Elsafi Mabrouk, M.H.; Goetzke, R.; Abagnale, G.; Yesilyurt, B.; Salz, L.; Cypris, O.; Glück, P.; Liesenfelder, S.; Zeevaert, K.; Ma, Z.; et al. The Spatial Self-Organization within Pluripotent Stem Cell Colonies Is Continued in Detaching Aggregates. Biomaterials 2022, 282, 121389. [Google Scholar] [CrossRef]
- Peerani, R.; Rao, B.M.; Bauwens, C.; Yin, T.; Wood, G.A.; Nagy, A.; Kumacheva, E.; Zandstra, P.W. Niche-Mediated Control of Human Embryonic Stem Cell Self-Renewal and Differentiation. EMBO J. 2007, 26, 4744–4755. [Google Scholar] [CrossRef] [PubMed]


Disclaimer/Publisher’s Note: The statements, opinions and data contained in all publications are solely those of the individual author(s) and contributor(s) and not of MDPI and/or the editor(s). MDPI and/or the editor(s) disclaim responsibility for any injury to people or property resulting from any ideas, methods, instructions or products referred to in the content. |
© 2024 by the authors. Licensee MDPI, Basel, Switzerland. This article is an open access article distributed under the terms and conditions of the Creative Commons Attribution (CC BY) license (https://creativecommons.org/licenses/by/4.0/).