Abstract
Accidental leakage from oil–gas storage tanks can lead to the formation of liquid pools. These pools can result in vapor cloud explosions (VCEs) if combustible vapors encounter ignition energy. Conducting accurate and comprehensive consequence analyses of such explosions is crucial for quantitative risk assessments (QRAs) in industrial safety. In this study, a methodology based on the SLAB-TNO model to calculate the overpressure resulting from a VCE is presented. Based on this method, the consequences of the VCE accident considering the gas cloud concentration diffusion are studied. The probit model is employed to evaluate casualty probabilities under varying environmental and operational conditions. The effects of key parameters, including gas diffusion time, wind speed, lower flammability limit (LFL), and environment temperature, on casualty diffusion are systematically investigated. The results indicate that when the diffusion time is less than 100 s, the VCE consequences are significantly more severe due to the rapid spread of the gas cloud. Furthermore, increasing wind speed accelerates gas dispersion, reducing the spatial extent of casualty isopleths. The LFL is shown to have a direct impact on both the mass and diffusion of the flammable gas cloud, with higher LFL values shifting the explosion’s epicenter upward. The environmental temperature promotes gas diffusion in the core area and increases the mass of the combustible gas cloud. These findings provide critical insights for improving the safety protocols in oil and gas storage facilities and can serve as a valuable reference for consequence assessment and emergency response planning in similar industrial scenarios.
1. Introduction
Oil and gas tanks can experience partial or complete failure during an accident, leading to leakage and the subsequent formation of a liquid pool. As the liquid pool expands, the evaporated gas disperses and forms a combustible gas cloud. This gas cloud has the potential to explode upon contact with an ignition source [1,2,3]. In 1998, a liquefied petroleum gas (LPG) leak occurred in the North Sea oil field of the United Kingdom, subsequently triggering an explosion. The disaster resulted in the deaths of 167 people. To mitigate the potential consequences of such accidents, it is essential to conduct a comprehensive quantitative risk assessment (QRA) for possible accidents [4]. The quantitative assessment of the consequences of explosion accidents is crucial for the QRA.
The evaporation of liquid pools is governed by both convection and heat evaporation effects. The associated heat transfer processes include solar radiation, long-wave radiation, evaporate heat absorption, air heat transfer, and ground heat transfer [5,6]. Galeev et al. [7] conducted numerical research about the evaporated heat absorption of organic liquid. The results indicate that the evaporation rate of a thin liquid pool is lower than that of a thick liquid pool. This could be due to the evaporation taking away heat, causing the temperature of the thin liquid pool to decrease more rapidly. The temperature at different positions in the liquid pool can be treated as a uniform value in the calculations. This phenomenon has been verified by experiments [8]. Zhang et al. [9] conducted research on the effects of the pool area on evaporation. The results indicate that increasing the pool area will decrease the downwind distance to the lower flammability limit (LFL). The diffusion process of low-temperature/pressurized liquids differs from the liquids at ambient temperature and pressure. The low-temperature/pressurized liquids have a lower boiling point, and the evaporation process is mainly driven by heat transfer. However, for liquids at ambient temperature and pressure, the evaporation process is driven by environmental airflow and vapor pressure [10]. The size and temperature of the liquid pool have a significant impact on its evaporation.
Gas diffusion in the atmosphere has always been a hot topic in the fields of environment and safety, and researchers have conducted extensive studies on this diffusion behavior [11,12]. Based on the differences in relative density or Richardson (Ri) number, gases can be classified into light gases, neutral gases, and heavy gases, each of them exhibits significant differences in diffusion characteristics [13]. The gas diffusion process is affected by many factors.
Alakalabi et al. [14] found that heavy gas exhibits a bimodal structure in the diffusion process under the effects of wind. Liao et al. [15] researched the effects of wind speed and atmospheric stability on the diffusion of natural gas; the results indicate that gas diffusion is most extensive with atmospheric stability. Tomos et al. [16] researched gas diffusion characteristics near buildings, revealing that buildings significantly promote the lateral diffusion of gas. Li et al. [17] constructed a hydrogen diffusion model combined with computational fluid dynamics (CFDs) and dimensional analysis, and researched the effects of wind direction and leakage direction based on the model. The process of gas diffusion is influenced by numerous factors. In order to achieve a quantitative assessment of the leak consequences, scholars devoted themselves to accurately predicting the diffusion of gas concentration. Modeling gas diffusion is important in the fields of environmental and safety. Based on the three aforementioned classifications, researchers have constructed numerous models about gas concentration. The Gaussian model is one of the most widely applied models, including the plume model for continuous leaks and the puff model for instantaneous leaks [18]. The SLAB model is used to solve conservation equations for heavy gases, and it is applicable in scenarios such as liquid pool evaporation and transient leak sources [19]. In addition, commonly used models include the ADAM model, AFTOX model, ISC3 model, and DEGADIS model [20,21]. The SLAB model is capable of considering the pool temperature, pool size, atmospheric stability, and physical properties of the medium, and it exhibits excellent performance in the calculation of liquid pool leak diffusion.
The flammable gas cloud formed by diffusion may lead to a VCE accident when encountering an ignition source [22]. The calculation of VCE overpressure mainly involves two approaches: numerical simulation and empirical formula. The empirical formula is widely used in accident consequence calculation and assessment due to its rapid, stable, and minimal requirement for fundamental knowledge. The empirical formulas mainly include the TNT equivalent method, the TNO method, and the BST method [23]. The TNT equivalent method is the point source explosion model, which significantly underestimates the far-field blast overpressure. The TNO method and BST method assume that the medium is completely vaporized to form a spherical combustible gas cloud and further calculate the explosion overpressure. Both of them neglect the changes in the shape and position of the combustible gas cloud under the influence of environmental wind and gravity, which has a significant impact on the explosion overpressure [23,24]. Therefore, it is crucial to accurately calculate the concentration of combustible gas clouds through the consideration of environmental and physical parameters using a gas diffusion model and to calculate the explosion overpressure for the safety assessment of the oil–gas cluster.
The analysis indicates that the diffusion of evaporated pool diffusion cloud is controlled by various influencing factors; the shape and position of the cloud further impact the consequences of VCE. However, the current quantitative assessment of accident consequences seldom considers the influence of the factors above.
In this study, the diffusion of evaporated gas clouds above the LFL is considered, and an SLAB-TNO explosion overpressure calculation method is developed. Furthermore, the probit model is incorporated to calculate the probability of casualties. The SLAB-TNO method takes into account the impact of diffusion time, environmental wind speed, the LFL, and the environment temperature of the medium on the probability of casualties. The findings of this study can be utilized for risk assessment and safety threshold determination in the oil–gas cluster, and it has a significant reference value for the accident consequence assessment of the oil–gas cluster.
2. Methodology
2.1. Method Construction
The combustible cloud is processed as a sphere in the TNO model. However, during the actual expansion process of the liquid pool, the combustible cloud is typically not spherical under the effects of environmental winds and gravity.
In this research, the gas concentration in three-dimensional space is calculated by the SLAB model, and the combustible cloud diffusion is obtained by taking into account the reaction limit of the evaporated gas. Concentrations below the LFL are considered non-reactive during the propagation of the reaction. In contrast, concentrations above the upper flammability limit are assumed to mix with fresh air under the influence of the shock wave and actively participate in the reaction. Therefore, the combustible gas cloud is defined as having a concentration higher than the LFL. Figure 1 is the diffusion and explosion schematic diagram of the evaporated gas cloud from the liquid pool.
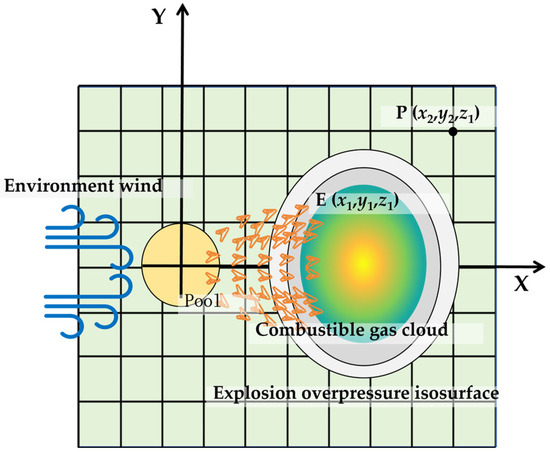
Figure 1.
Schematic diagram of the evaporated gas cloud and explosion overpressure.
The SLAB model obtains the average time concentration by solving the conservation equation. The mathematical description of the conservation equation includes the physical properties of heavy gas diffusion, the atmospheric convection, the turbulent diffusion, and the local thermodynamic equilibrium. The main governing equations are as follows:
Species transport
Mass conservation
Energy conservation
Moment conservation-Translation flow
Moment conservation-Gravity flow
where B and h are the cloud half width and height, m is the mass concentration, Cp is the specific heat, T is the temperature, fpc is the phase change energy, ft is the ground heat flux, Vg is the horizontal crosswind gravity flow velocity, Vex and Vey are the horizontal downwind and crosswind entrainment rates, ρ is the density, g is the gravity, and U, V, and W are the velocity of cloud. The subscript “a” refers to ambient air conditions, and the subscript “s” refers to source properties; the subscript “x”, “y”, and “z” refer to the direction in a cartesian coordinate system.
The three-dimensional space needs to be discretized before calculation, and a linear interpolation on the results of the SLAB model needs to be performed to obtain the gas concentration c(x,y,z,t) at each point. The coordinate sets S of the combustible gas cloud spatial points are obtained based on the LFL of the evaporated gas. These have a concentration higher than LFL, and the other points have a concentration lower than LFL and belong to coordinates sets S{P1, P2,……, Pn}. The distance between the sets S{E1, E2,……, En} and S{P1, P2,……, Pn} forms the sets S{r11, r12, r13,……, rnn}. In which the r11 is the minimum distance from the points P to the sets S{E1, E2,……, En}.
where EiPj is the distance between point Ei and point Pj, which can be calculated using the Pythagorean theorem.
The scaled distance corresponding to r11 is as follows:
where P0 is the ambient pressure, which is typically 101,325 Pa, and parameter E represents the total released energy of the combustible material involved in the reaction.
where Hc is the heat of combustion per unit mass of the combustible material, and Δx, Δy, and Δz are the distances between the target point and the adjacent points in the x, y, and z directions. They are all 10 m in this study. c is the concentration of the combustible material, where c = c(x,y,z,t).
The explosion overpressure is calculated by the TNO model:
where I is the reaction intensity, which in the TNO model ranges from 1 to 9; different explosion intensities correspond to different overpressure curves.
The probability of overpressure damage is calculated using the probit model proposed by Valerio Cozzani et al. [25]:
where μ and σ are the median and the variance of the Gaussian distribution, π is the pi, Y is the probability density, and V is the probability (0 ≤ V ≤ 1).
2.2. Case Study Scenario Description
The SLAB model is specifically designed for neutral or heavy gas. The relevant studies show that the model performs well in the diffusion of liquefied petroleum gas (LPG). Since LPG mainly consists of propane, its evaporated gas is calculated using propane as a substitute.
Assuming a sudden failure of a 200 m3 horizontal LPG tank with a filling rate of 80%, the internal storage weight is 92,800 kg. The cofferdam area required for the LPG tank is 200 m2 with a cofferdam wall height of 1 m [26].
A liquid pool forms because of the instantaneous leakage of the tank. The vaporization process of LPG is extremely rapid and very short due to LPG being a high-pressure liquefied gas. In order to perform the calculations, there are some idealized assumptions for certain scenarios and parameters as follows:
- -
- The accident scenario involves the instantaneous leakage leading to the spread of a liquid pool;
- -
- The area of the liquid pool under instantaneous leakage is equal to the cofferdam area;
- -
- There is 90% of the liquid vaporized at the formation of the liquid pool, and the liquid mass fraction is 0.1;
- -
- Propane is used as a substitute for LPG;
- -
- The saturated vapor pressure of propane satisfies the Clapeyron equation;
- -
- There are numerous obstacles in the calculation, and the explosion severity level in the TNO model is 5.
The parameters used in the case study are shown in Table 1.

Table 1.
Relevant parameters in the computation.
3. Results and Discussion
3.1. Comparison of Results Between the TNO Method and SLAB-TNO Method
Figure 2 illustrates the mass concentrations of propane in the xy, xz, and yz planes at 100 s. As can be seen in Figure 2, under the influence of the ambient wind, the contour lines of the propane mass concentration are approximately ellipsoidal, which is consistent with the contour lines of the cloud in the transient state given in the SLAB manual. The center of the cloud is near 50 m downwind, and since the relative molecular mass of propane gas is 1.52, the uplift of propane vapor is not obvious at 10 s, and the concentration of the gas is close to 0 kg/m3 at a height of more than 10 m. Because of the density variability of the gas cloud in the crosswind direction, the air entrainment under the ambient wind is more obvious, and the major axis of the ellipse in the xy plane is the x-axis.
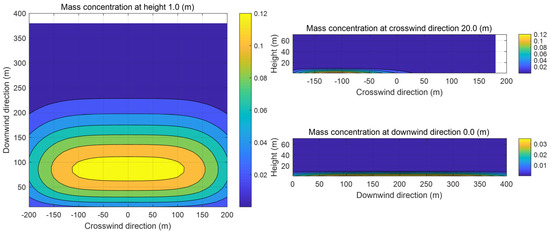
Figure 2.
Sectional images of the evaporated gas cloud.
The variations of combustible gas cloud mass obtained from the SLAB-TNO models at various times and the TNO model is shown in Figure 3. The results of the SLAB-TNO and TNO models at 100 s, 200 s, and 300 s are compared. The combustible gas cloud mass is regarded as constant in the TNO model, and it does not vary with time and environmental parameters. The mass of the combustible gas cloud calculated using the SLAB-TNO model decreases over time. Compared with the total evaporated gas cloud mass, the gas cloud mass decreases by 30.4% at 100 s, 53.6% at 200 s, and 78.6% at 300 s. The casualty probabilities obtained from the SLAB-TNO and TNO models are shown in Figure 4. From Figure 4, it can be seen that the probit value for fatality of the TNO model is symmetrically distributed with the x-axis and y-axis. Due to the influences of free diffusion, concentration gradient, buoyancy, and forced convection, the evaporated gas cloud does not form a spherical shape. At the same time, the probit value for fatality of the SLAB-TNO model is asymmetric in the wind direction.

Figure 3.
Mass of combustible gas cloud obtained from the SLAB-TNO and TNO models at various diffusion times.

Figure 4.
Diffusion diagrams of casualty probabilities were obtained from the SLAB-TNO and TNO models at various diffusion times. (a) SLAB-TNO model with diffusion 100 s, (b) SLAB-TNO model with diffusion 200 s, (c) SLAB-TNO model with diffusion 300 s, (d) TNO model.
The contour coordinates with a casualty probability of 0.9 at various diffusion times are shown in Figure 5 when the casualty probability is 0.9. It can be seen that with the increase in diffusion time, the area of casualty probability decreases. At 100 s, the area of casualty probability is at −1570 m upstream and 1820 m downstream distances of the leak point. At 200 s, the area is at −1310 m upstream and 1630 m downstream distances of the leak point. At 300 s, the area is at −960 m upstream and 1360 m downstream distances of the leak point, respectively. Since the ambient wind intensifies the mixing of evaporated gases with air, and as time increases, the concentration of more premixed gases decreases below the flammability limit. The area of casualty probability obtained from the TNO model is at −1620 m upstream and 1620 m downstream distances of the leak point. At the same time, the center point of the gas cloud moves downstream by the ambient wind, which leads to the downstream movement of the explosion center point. From 100 s to 300 s, the explosion center moves from 125 m downstream to 200 m, which is more different from the leakage center point. As a result of the movement of the explosion center point, the area of casualty probability downwind of 0.9 at 100 s is larger than the area obtained from the TNO model. This phenomenon can be explained by the movement of the combustible gas cloud mass, which counteracts the reduction in explosion intensity at the target point caused by the diminishing mass of the gas cloud. As a result, there is an increased risk at the downstream target point.
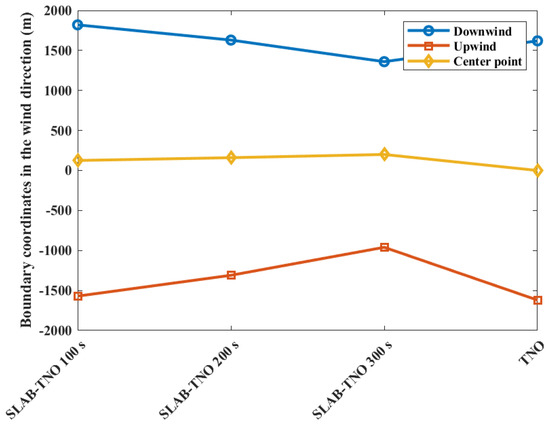
Figure 5.
Contour coordinates with a casualty probability of 0.9 at various diffusion times.
3.2. Effects of Wind Speed on Casualty Probability
Wind speed has a significant effect on the diffusion of the combustible gas cloud; the ambient wind may promote the spread of the combustible gas cloud and thus expand the consequences of the explosion. However, at the same time, the ambient wind may also disperse the gas cloud to reduce the consequences of the explosion. Figure 6 shows the variations of combustible gas cloud mass with the ambient wind speed at 100 s. It can be seen that when the wind speed increases from 0.5 m/s to 1 m/s, the combustible gas cloud mass decreases by 28.4%. When the wind speed increases from 0.5 m/s to 2 m/s, the combustible gas cloud mass decreases by 50.9%. When the wind speed increases from 0.5 m/s to 3 m/s, the combustible cloud mass decreases by 67.6%. When the wind speed increases to 5 m/s, the cloud mass does not exceed the reaction limit, preventing an explosion from occurring. The increased wind speed significantly enhances the diffusion of the gas cloud.

Figure 6.
Mass of combustible gas cloud obtained from the SLAB-TNO model at various wind speeds.
Ambient wind affects the size and mass of the combustible gas cloud, which will inevitably affect the explosion overpressure at the target point during the explosion. The casualty probabilities due to the explosion of the combustible gas cloud at 100 s are shown in Figure 7. With the increase in wind speed, the area of probit value for fatality decreases. When the wind speeds are 0.5 m/s and 1.0 m/s, the contour of the area where the casualty probability is 0.1 is outside 10,000 m. When the wind speeds are 2.0 m/s and 1.0 m/s, the contour of areas where the casualty probability is 0.1 is near 9500 m and 8000 m downstream. This means that increasing wind speeds can effectively reduce the diffusion of explosion-hazardous areas, which is caused by the decrease in the mass of combustible gas clouds.
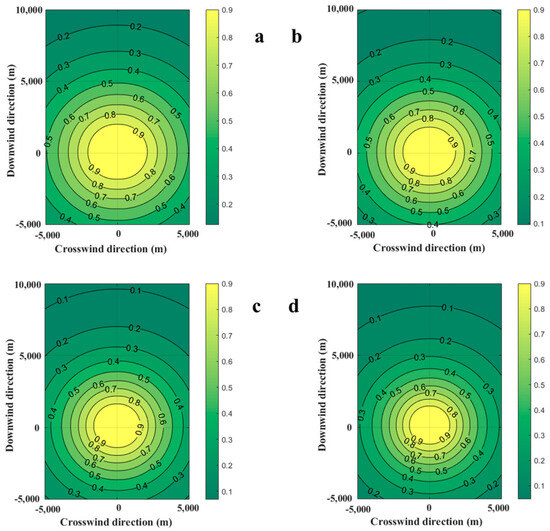
Figure 7.
Diffusion diagrams of casualty probabilities obtained from the SLAB-TNO model at various wind speeds. (a) Wind speed is 0.5 m/s, (b) Wind speed is 1.0 m/s, (c) Wind speed is 2.0 m/s, (d) Wind speed is 3.0 m/s.
The contour coordinates with a casualty probability of 0.9 at various wind speeds are shown in Figure 8. When the wind speed is 0.5 m/s, the area of casualty probability is at −1820 m upstream and 2100 m downstream distances of the leak point. When the wind speed is 1.0 m/s, the area is at −1570 m upstream and 1820 m downstream distances of the leak point. When the wind speed is 2.0 m/s, the area is at −1390 m upstream and 1650 m downstream distances of the leak point. When the wind speed is 3.0 m/s, the area is at −1200 m upstream and 1480 m downstream distances of the leak point, respectively. It can be seen that both the upper and lower boundaries of the probability contour decrease with increasing wind speed, while the coordinates of the center point of the probability contour do not change significantly. This is due to the fact that the gas cloud mixing speed with air increases with the increase in wind speed during the overall movement of the gas cloud downstream. However, at the same time, the mass and volume of the gas cloud are decreasing. Under the combined effects of the factors in above, there is no obvious change in the location of the explosion center point. Therefore, the increase in wind speed will only reduce the casualty probability at the target point.
Figure 8.
Contour coordinates with a casualty probability of 0.9 at various wind speeds.
3.3. Effects of LFL on Casualty Probability
Since most substances stored in oil and gas tank farms are mixtures, the evaporated gas components are complex. There is a difference in the lower limit of reaction of evaporated gas of the same substance, and the lower limit of reaction does not affect the diffusion process of the evaporated gas cloud. An increase in the lower reaction limit results in a reduction in the mass of the evaporated gas cloud, which in turn reduces the casualties caused by the explosion. In order to reveal the effect of the lower limit of reaction on the probability of casualties, the study explores the effect of the LFL on the probability of casualties by controlling the variables and setting the LFL to 0.0189, 0.0378, and 0.0756, respectively. A wind speed of 1.0 m/s and a time of 100 s were taken for study.
Figure 9 shows the variation of the gas cloud mass with the LFL. The mass of the gas cloud is 7.19 × 10⁴ kg at the LFL of 0.0189 kg/m3, and it decreases by 10.1% to 6.46 × 10⁴ kg when the LFL is doubled to 0.0378 kg/m3, and it decreases by 37.1% to 4.52 × 10⁴ kg when the LFL is further doubled to 0.0756 kg/m3. Increasing the LFL can significantly reduce the combustible gas cloud mass.

Figure 9.
Mass of combustible gas cloud obtained from the SLAB-TNO model at various LFLs.
The diffusion of casualty probabilities at various LFLs is shown in Figure 10. As the LFL increases, the contours of casualty probabilities become denser, which indicates that the area affected by the consequences of the accident decreases.
Figure 10.
Diffusion diagrams of casualty probabilities obtained from the SLAB-TNO model at various LFLs. (a) LFL is 0.0189 kg/m3, (b) LFL is 0.0756 kg/m3.
The contour coordinates with a casualty probability of 0.9 at various LFLs is shown in Figure 11. While the LFL is 0.0189 kg/m3, the area of casualty probability is at −1660 m upstream and 1920 m downstream distances of the leak point. When the LFL is 0.0378 kg/m3, the area is at −1570 m upstream and 1820 m downstream distances of the leak point. When the LFL is 0.0756, the area is at −1400 m upstream and 1580 m downstream distances of the leak point, respectively. It can be seen that the upper and lower boundaries of the probability contour decrease with the increase in the LFL, while the coordinates of the explosion center point do not change significantly. This can be explained by the fact that the gas cloud concentration diffusion is not affected by the LFL during the gas cloud diffusion process. The upstream contour line of the combustible gas cloud is located on the windward side, and the downstream contour line of the combustible gas cloud is located on the leeward side. Therefore, the upstream combustible gas cloud is more “flattened” by the ambient wind. This phenomenon can be observed in Figure 2. Therefore, the closer to the downstream, the “looser” the combustible gas cloud concentration contours are, which indicates a larger concentration gradient downstream of the gas cloud. Increasing the LFL has a more significant effect on the downstream position of the gas cloud, and therefore, the center point of the explosion is shifted upstream.
Figure 11.
Contour coordinates with a casualty probability of 0.9 at various LFLs.
3.4. Effects of Environment Temperature on Casualty Probability
From a global perspective, environmental temperatures exhibit significant variations with the change of seasons and latitudes. The environmental temperature has two effects on the evaporation and gas diffusion of a liquid pool. Firstly, it affects the evaporation efficiency of the liquid pool. Secondly, it affects the gas diffusion effect. The evaporation process is not considered in this research. Therefore, the environmental temperature changes the diffusion of flammable gas clouds by affecting the gas diffusion effect. Based on realistic environmental temperatures, six sets of temperatures are selected for the study, including 253 K, 263 K, 273 K, 289 K, 300 K, and 313 K.
Figure 12 shows the change in mass of the combustible gas cloud at different environment temperatures. It is evident that the mass of the combustible gas cloud increases with the rise in temperature. The mass reaches its maximum value of 6.79 × 10⁴ kg at 313 K. Compared to environmental temperatures of 253 K, 263 K, 273 K, 289 K, and 300 K, this represents an increase of 9.8%, 8.9%, 7.3%, 4.9%, and 2.7%, respectively. In this study, the combustible gas cloud concentration in the core area is 14.4% at an environmental temperature of 253 K, while the concentration decreases to 12.8% at an environmental temperature of 253 K. This indicates that the increase in environmental temperature enhances gas diffusion, leading to the outward spread of gas from the core area. As a result, the concentration of the combustible gas cloud in the core area decreases, causing the originally lower LFL at the edge of the gas cloud to rise above the LFL. This ultimately leads to an increase in the mass of the flammable gas cloud.
Figure 12.
Mass of combustible gas cloud obtained from the SLAB-TNO model at various temperatures.
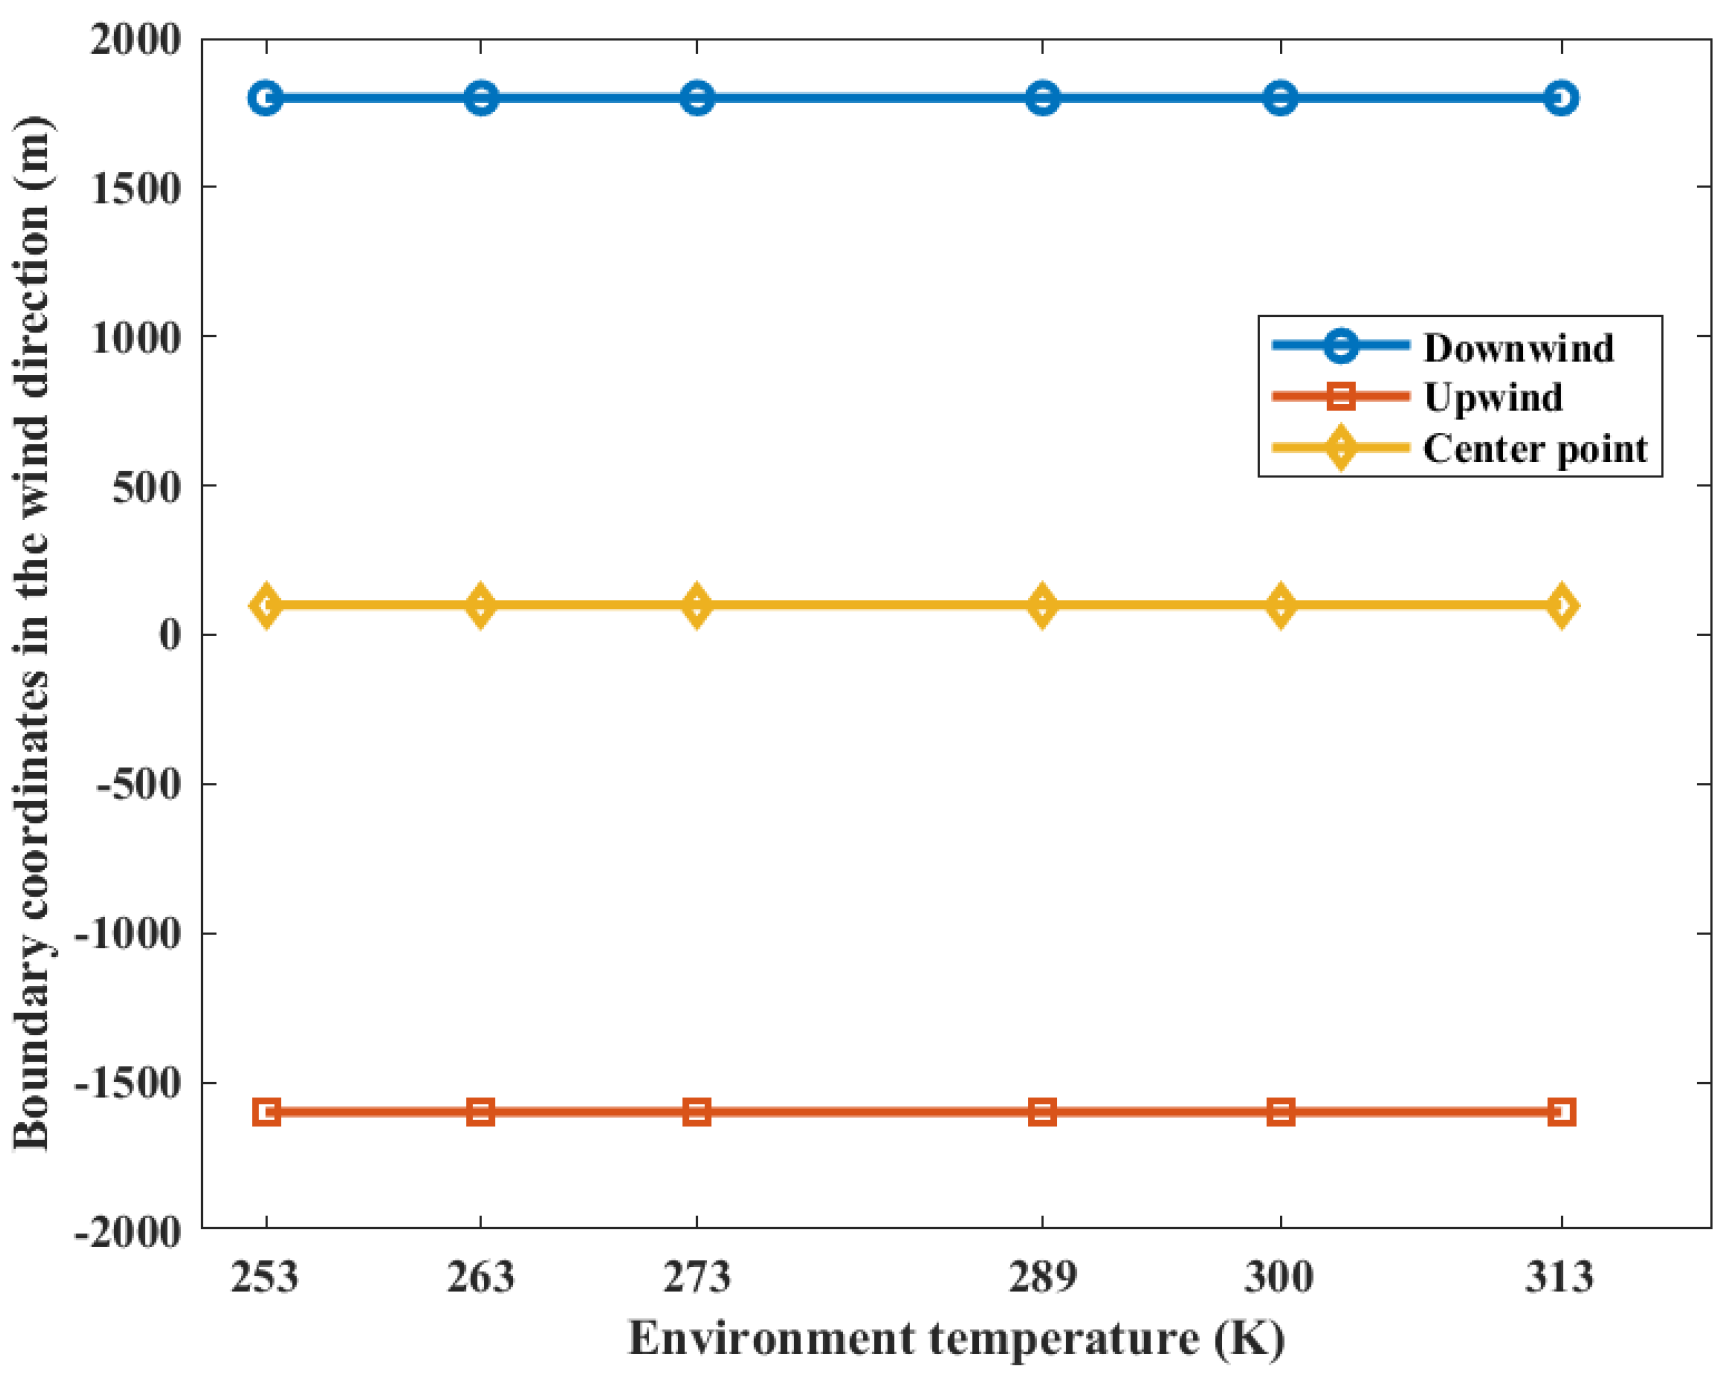
The distribution of casualty probabilities at various environment temperatures is shown in Figure 13. It can be seen that the increase in environmental temperature slightly increases the mass of the combustible gas cloud but has a very small impact on the distribution of the probability of casualties. The increase in temperature slightly expands the distribution range of the probability of fatalities among personnel. Figure 14 shows the distances of the probability of casualties being 0.9 on the axial coordinates. It can be seen that the increase in temperature has no effect on the distribution of the area, with a probability of casualties being 0.9.
Figure 13.
Diffusion diagrams of casualty probabilities obtained from the SLAB-TNO model at various temperatures. (a) Ambient temperature is 253 K, (b) Ambient temperature is 263 K, (c) Ambient temperature is 273 K, (d) Ambient temperature is 289 K, (e) Ambient temperature is 300 K, (f) Ambient temperature is 313 K.
Figure 14.
Contour coordinates with a casualty probability of 0.9 at various temperatures.
4. Conclusions
In this study, the SLAB-TNO method for calculating the probability of casualties in VCE is constructed by integrating the SALB model with the TNO model. This method takes into account the impact of the spatial-temporal evolution of the combustible gas cloud on the probability of casualties. The transient rupture accident of the LPG tank and the subsequent consequences of the formation of liquid pool evaporation diffusion explosion were studied based on the SLAB-TNO method. An in-depth analysis of the effects of diffusion time, ambient wind speed, LFL, and environment temperature on the probability of fatal injuries to personnel is conducted.
The study findings are as follows:
- (1)
- Under the effects of gas diffusion, the area with a personnel injury probability diffusion of 0.9 at 100 s is larger than calculated using the SLAB-TNO method. After 100 s, the combustible cloud mass reduces because of diffusion, and the hazardous area shrinks. The consequence of a VCE accident considering gas diffusion may be greater than that without considering gas diffusion;
- (2)
- Wind can promote the diffusion of combustible gas. When the wind speed reaches 5 m/s, there is no gas with the concentration above the LFL. Increasing the wind speed will reduce both the upper and lower boundaries of the probability contour lines for casualties. The changing of the central point coordinates can be ignored. Increasing the wind speed will decrease the accident consequences at the target point;
- (3)
- Increasing the LFL will reduce the mass and shrink the boundaries of the flammable gas clouds, assuming the diffusion of gas clouds remains unchanged. When the LFL increases from 0.0189 kg/m3 to 0.0756 kg/m3, the mass of the flammable gas cloud decreases by 37.1%. Due to the greater concentration gradient of gas clouds on the lee side, increasing the LFL has a more significant impact on the downstream position of the flammable gas cloud, resulting in the movement of the explosion center point toward the upstream. The reduction of LFL will significantly increase the consequences of VCE;
- (4)
- Increasing the environmental temperature promotes gas diffusion. The combustible gas cloud concentration in the core area is 14.4% at an environmental temperature of 253 K, while the concentration decreases to 12.8% at an environmental temperature of 253 K. The increase in environmental temperature causes the gas cloud in the core area to spread towards the edge, increasing the mass of the flammable gas cloud. The mass reaches its maximum value of 6.79 × 10⁴ kg at 313 K. An increase in ambient temperature will only slightly increase the consequences of VCE.
The calculation of VCE accident consequences is a crucial component of risk assessment. The findings of this study can be applied to accurately assess both individual and societal risks.
Author Contributions
Conceptualization, methodology, writing—original draft (lead), X.Z.; funding acquisition, Y.Y.; supervision, W.C.; conceptualization, G.C.; conceptualization, investigation, Q.X.; investigation, T.G. All authors have read and agreed to the published version of the manuscript.
Funding
This research was funded by Research on Deepening the Application of Integrity Management for Large Storage Tanks (No. AQWH202208), Deepening research on pipeline risk assessment based on multi-source data (No. AQWH202302), and Guangdong Basic and Applied Basic Research Foundation (No. 2024A1515011123).
Data Availability Statement
The raw data supporting the conclusions of this article will be made available by the authors on request.
Conflicts of Interest
Author Xixiang Zhang and Yufeng Yang were employed by the company China Oil & Gas Pipeline Network Corporation (Langfang, China). Author Wanzhou Cheng was employed by the company China Oil & Gas Pipeline Network Corporation (Beijing, China). The remaining authors declare that the research was conducted in the absence of any commercial or financial relationships that could be construed as a potential conflict of interest.
References
- Xu, Q.M.; Chen, G.H.; Xie, M.L.; Li, X.F.; Zhao, Y.M.; Su, S.; Li, S.M. Experimental and numerical studies on hydrogen leakage and dispersion evolution characteristics in space with large aspect ratios. J. Clean. Prod. 2024, 438, 140467. [Google Scholar] [CrossRef]
- Yang, Y.; Chen, G.; Zhao, Y. A Quantitative Framework for Propagation Paths of Natech Domino Effects in Chemical Industrial Parks: Part I—Failure Analysis. Sustainability 2023, 15, 8362. [Google Scholar] [CrossRef]
- Yang, Y.; Chen, G.; Zhao, Y. A Quantitative Framework for Propagation Paths of Natech Domino Effects in Chemical Industrial Parks: Part II—Risk Assessment and Mitigation System. Sustainability 2023, 15, 8306. [Google Scholar] [CrossRef]
- Zeng, T.; Chen, G.; Yang, Y.; Reniers, G.; Zhao, Y.; Liu, X. A Systematic Literature Review on Safety Research Related to Chemical Industrial Parks. Sustainability 2020, 12, 5753. [Google Scholar] [CrossRef]
- Beji, T.; Merci, B. Development of a numerical model for liquid pool evaporation. Fire Saf. J. 2018, 102, 48–58. [Google Scholar] [CrossRef]
- Galeev, A.D.; Starovoytova, E.V.; Ponikarov, S.I. Numerical simulation of the consequences of liquefied ammonia instantaneous release using FLUENT software. Process Saf. Environ. Prot. 2013, 91, 191–201. [Google Scholar] [CrossRef]
- Galeev, A.; Ponikarov, S. Numerical investigation of flammable vapour cloud formation from pools of heated organic liquids. Heliyon 2022, 8, 20. [Google Scholar] [CrossRef] [PubMed]
- Penelon, T.; Debuy, V.; Truchot, B.; Wagner, C.; Donnat, L.; Lechaudel, J.F. Pool evaporation: Experimental tests at medium-scale with gasoline. J. Loss Prev. Process Ind. 2020, 65, 104072. [Google Scholar] [CrossRef]
- Qian-Xi, Z.; Yu, Y.; Wen-Bing, Y.; Dong, L. The sensitivity of final consequence analysis results to the LNG pool area. In Proceedings of the 2014 7th International Conference on Intelligent Computation Technology and Automation, Changsha, China, 25–26 October 2014; pp. 840–843. [Google Scholar] [CrossRef]
- Luketa-Hanlin, A. A review of large-scale LNG spills: Experiments and modeling. J. Hazard. Mater. 2006, 132, 119–140. [Google Scholar] [CrossRef] [PubMed]
- Zheng, Y.P.; Guo, J.J.; Liu, X.X.; Su, X.K. Study on Theory of Hazardous Gas Puff Dispersion. In Proceedings of the 1st International Conference on Energy and Environmental Protection (ICEEP 2012), Hohhot, China, 23–24 June 2012; pp. 1625–1629. [Google Scholar]
- Gavelli, F.; Hendrickson, B.; Kooy, R.; Kolade, B. Evaluation protocols for flammable and toxic dispersion models. Process Saf. Prog. 2022, 41, 362–371. [Google Scholar] [CrossRef]
- Fthenakis, V.M. HGSYSTEM: A review, critique, and comparison with other models. J. Loss Prev. Process Ind. 1999, 12, 525–531. [Google Scholar] [CrossRef]
- Alakalabi, A.; Liu, W.M. Numerical Investigation into the effects of obstacles on heavy gas dispersions in the atomsphere. In Proceedings of the 12th International Conference on Computational Heat, Mass and Momentum Transfer (ICCHM2T), Rome, Italy, 3–6 September 2019. [Google Scholar]
- Liao, N.; Huang, K.; Chen, L.Q.; Wang, Z.F.; Wu, J.; Zhang, F. Numerical simulation of gas dispersion during cold venting of natural gas pipelines. Adv. Mech. Eng. 2018, 10, 1687814018755244. [Google Scholar] [CrossRef]
- Rich, T.; Vanderwel, C. Pollutant Dispersion Around a Single Tall Building. Bound.-Layer Meteorol. 2024, 190, 34. [Google Scholar] [CrossRef]
- Li, Z.L.; Simancas, N.S.N.; Vianna, S.S.V.; Zhang, B. A mathematical model for hydrogen dispersion cloud based on dimensional analysis and computational fluid dynamics (CFD). Int. J. Hydrogen Energy 2024, 60, 229–240. [Google Scholar] [CrossRef]
- Khan, S.; Hassan, Q. Review of developments in air quality modelling and air quality dispersion models. J. Environ. Eng. Sci. 2021, 16, 1–10. [Google Scholar] [CrossRef]
- He, J.X.; Liu, L.; Li, A.G.; Ma, Y.; Zhou, D.M.; Zhou, Q.Y.; Zhan, Y.Z. A dense gas dispersion model based on revised meteorological parameters and its performance evaluation. Atmos. Environ. 2021, 244, 117953. [Google Scholar] [CrossRef]
- Weiping, D. Modeling accidental releases toxic chemical release. Chem. Eng. Prog. 2005, 101, 33–39. [Google Scholar]
- Gronwald, F. Predicting Pollutant Concentration Using Multiple Air Dispersion Models in a 2-D Superensemble. Ph.D. Thesis, North Carolina Agricultural and Technical State University, Greensboro, NC, USA, 2016. [Google Scholar]
- Oran, E.S.; Chamberlain, G.; Pekalski, A. Mechanisms and occurrence of detonations in vapor cloud explosions. Prog. Energy Combust. Sci. 2020, 77, 100804. [Google Scholar] [CrossRef]
- Qian, X.M.; Feng, C.G.; Chen, L.S. Comparison study among the models to evaluate the consequence of vapor cloud explosion. In Proceedings of the Asia Pacific Symposium on Safety 2005, Shaoxing, China, 2–4 November 2005; pp. 194–198. [Google Scholar]
- Alonso, F.D.; Ferradás, E.G.; Sáncheza, T.D.J.; Aznar, A.M.; Gimeno, J.R.; Alonso, J.M. Consequence analysis to determine the damage to humans from vapour cloud explosions using characteristic curves. J. Hazard. Mater. 2008, 150, 146–152. [Google Scholar] [CrossRef] [PubMed]
- Cozzani, V.; Salzano, E. The quantitative assessment of domino effect caused by overpressure—Part II. Case studies. J. Hazard. Mater. 2004, 107, 81–94. [Google Scholar] [CrossRef] [PubMed]
- GB 50160-2008; Fire Prevention Code of Petrochemical Enterprise Design. Chinese Standard: Beijing, China, 2008.


Disclaimer/Publisher’s Note: The statements, opinions and data contained in all publications are solely those of the individual author(s) and contributor(s) and not of MDPI and/or the editor(s). MDPI and/or the editor(s) disclaim responsibility for any injury to people or property resulting from any ideas, methods, instructions or products referred to in the content. |
© 2024 by the authors. Licensee MDPI, Basel, Switzerland. This article is an open access article distributed under the terms and conditions of the Creative Commons Attribution (CC BY) license (https://creativecommons.org/licenses/by/4.0/).