Article

Ignition Characteristics and Flame Behavior of Automotive Lubricating Oil on Hot Surfaces

1
College of Safety Science and Engineering, Xi’an University of Science and Technology, Xi’an 710054, China
2
Shannxi Engineering Research Center for Industrial Process Safety and Emergency Rescue, Xi’an 710065, China
3
Xi’an Key Laboratory of Urban Public Safety and Fire Rescue, Xi’an 710007, China
*
Author to whom correspondence should be addressed.
Processes 2024, 12(11), 2522; https://doi.org/10.3390/pr12112522
Submission received: 20 September 2024 / Revised: 1 November 2024 / Accepted: 9 November 2024 / Published: 12 November 2024
(This article belongs to the Section Chemical Processes and Systems)

Abstract

:
Hot surfaces in industrial processes and automotive systems present a remarkable fire hazard. Lubricating oil is a widely used oil in these scenarios. Quantifying the ignition characteristics and flame behavior of lubricating oil on hot surfaces is critical for enhancing fire safety in energy-related applications. This paper utilizes a self-developed experimental platform for the hot surface ignition to systematically conduct combustion tests on lubricating oil with varying volumes at different surface temperatures. Through statistical analysis and image processing, the ignition temperature, flame height, flame propagation velocity, and flame temperature were examined to assess the fire risk of a hot surface ignition. The results demonstrate that the ignition and combustion process of lubricating oil on hot surfaces can be categorized into five stages. The ignition temperature decreases as the oil volume increases. The flame height and flame propagation velocity are positively correlated with the hot surface temperature. The maximum flame height increases with the increase in the oil volumes. When the flame height reaches the maximum value, the flame area is the largest, and the average flame temperature is 1540.30 °C, showing a greater fire risk. When the oil content is 0.2 mL, the flame propagation velocity is the fastest, reaching 3.81 m/s. Meanwhile, the flame is very close to the oil pipe, which may cause a secondary fire. Therefore, hot surface ignition of lubricating oil poses a direct threat to vehicle safety.

1. Introduction

Hot surface ignition (HSI) is a critical potential source of automotive fires, with a high likelihood of occurrence [1,2]. This is because lubricating oil (LO) leakage occurs when external forces are encountered during the operation of the car. When LO is directly in contact with the high-temperature components, especially the exhaust system, the LO temperature will rise rapidly. When its ignition point is satisfied, hot surface ignition will occur, even causing a vehicle fire [3,4]. Therefore, a quantitative study of the ignition characteristics and flame behavior of LO on hot surfaces is essential for optimizing vehicle safety design and mitigating the fire risk of the hot surface ignition.
The ignition process of LO on hot surfaces is complex and exhibits probabilistic behavior [5]. In recent years, researchers have primarily employed the droplet method, combined with various laboratory techniques to investigate the hot surface ignition characteristics and flame behavior [6,7]. Research methods include direct observation [8], thermocouple measurements [9], infrared thermography [10], and optoelectronic sensing [11]. Tang et al. [12] examined the ignition behavior of three combustible liquids (diesel oil, hydraulic oil, engine oil) on three metal surfaces (stainless steel, cast iron, carbon steel), utilizing visual inspection and thermocouple analysis to assess the probability of ignition under different conditions. Ping et al. [13] analyzed the ignition behavior of a single drop of lubricating oil in a cylinder, demonstrating that the ignition temperature is closely correlated with the evaporation dynamics of the oil. Shaw et al. [14] used infrared thermal imaging to evaluate the effect of surface thermal properties on the critical ignition temperature of a single droplet from a localized perspective. Babrauskas et al. [15] further established that hot surface ignition is probabilistic event, identifying a specific temperature range that defines two critical temperatures: the minimum temperature of ignition and the 100% ignition temperature.
In recent years, optical detection methods, particularly video and image processing techniques, have gained prominence in combustion experiments [16]. Researchers have utilized high-speed cameras to visualize the flame combustion process and investigate the ignition behavior and flame characteristics of combustible oils on hot surfaces [17,18]. Qi et al. [19] employed high-speed cameras to capture micrographs of oil droplets on hot surfaces, analyzing their ignition characteristics at various temperatures and revealing the ignition and explosion mechanisms of oil droplets. Schlegel et al. [20] and Fei et al. [21] conducted multi-component combustible liquid ignition experiments on hot surfaces, using digital imaging technology to analyze the combustion process. Building on these studies, Tao et al. [22] employed digital imaging to investigate the ignition delay time of small-volume oil droplets on hot surfaces. Chen et al. [23] further utilized digital imaging in hot surface ignition experiments involving typical liquid fuels, elucidating the ignition mechanism through a model that described the concentration of combustible vapors and the temperature distribution on the hot surface.
As highlighted in previous studies, investigating collisional ignition between oil and hot surfaces remains a crucial area of interest in industrial fire safety research. Current research focuses on collisions and microbursts between LO and hot surfaces. However, initial leakage from oil pipes is typically minimal. Limited research has been conducted on the quantitative analysis of ignition characteristics and flame behavior of small oil volumes. This study employed digital imaging technology to conduct hot surface ignition tests for LO at varying volumes. The ignition temperature, flame height, propagation velocity, and flame temperature were quantitatively analyzed. These findings enhance the understanding of LO ignition and combustion behavior on hot surfaces, contributing valuable insights for reducing the likelihood of fire accidents. Furthermore, the study offers recommendations for the safer design of automotive systems and the improvement of industrial safety.

2. Research Methods

2.1. Flame Image Processing Methods

Digital image processing technology was employed to analyze flame characteristics by obtaining surface feature points and coordinates from images captured during the combustion process [24]. A high-speed camera recorded the flame images in real time, saving them as digital video files for further analysis. Flame frames from each ignition test were extracted and processed using a custom Matlab program. The original high-speed camera images reveal two distinct flame types: blue and yellow. A noticeable “edge jitter” effect was observed during the flame development, characterized by numerous sharp corners along the flame edge, which varied irregularly over time [25]. Flame images were segmented based on color characteristics [26], and the edge jitter was accounted for using flame sharp angle processing principles. This allowed for the separation of the flame from its background, facilitating a more accurate extraction of the flame edges. The result was a more precise flame profile, minimizing errors in subsequent data processing [27]. The process is illustrated in Figure 1.
The original RGB (red, green, and blue) flame image is converted into a HIS (hue, saturation, and intensity) color image by Equation (1). The image pixel gradient information is preserved [28].
H = θ B G 360 ° B > G S = 1 min R , G , B I I = R + G + B 3
where θ = arccos 2 R G B 2 R G 2 + R B R G .
The image is segmented by Equation (2) and the completed segmented digital image is binarized [29].
I 1 x , y = 0 I u I 0 x , y I u I 2 x , y = 0 I u 255 I u
where I 0 x , y is the original flame image; I 1 x , y is the segmented flame image; I 2 x , y is the binarized flame image; u is the flame color feature space; (x, y) is the flame image pixels.
During real-time capture of flame combustion images by high-speed cameras, external noise can degrade the image quality [30]. A homomorphic filtering method was applied to enhance the brightness and contrast of the binarized images [31]. Additionally, a median filtering technique was used to eliminate isolated, discontinuous noise points within the binarized images [32], ensuring that the pixel values more closely represent the actual data. This approach ultimately results in a smoother and more accurate flame profile. The calculation formula for the median filtering method is provided in Equation (3).
I 3 x , y = Med i , j W I 2 i , j
where I 3 x , y is the denoised image; W is the size of the selected window in the image; i and j are the pixels corresponding to the median.

2.2. Calculation of Flame Height

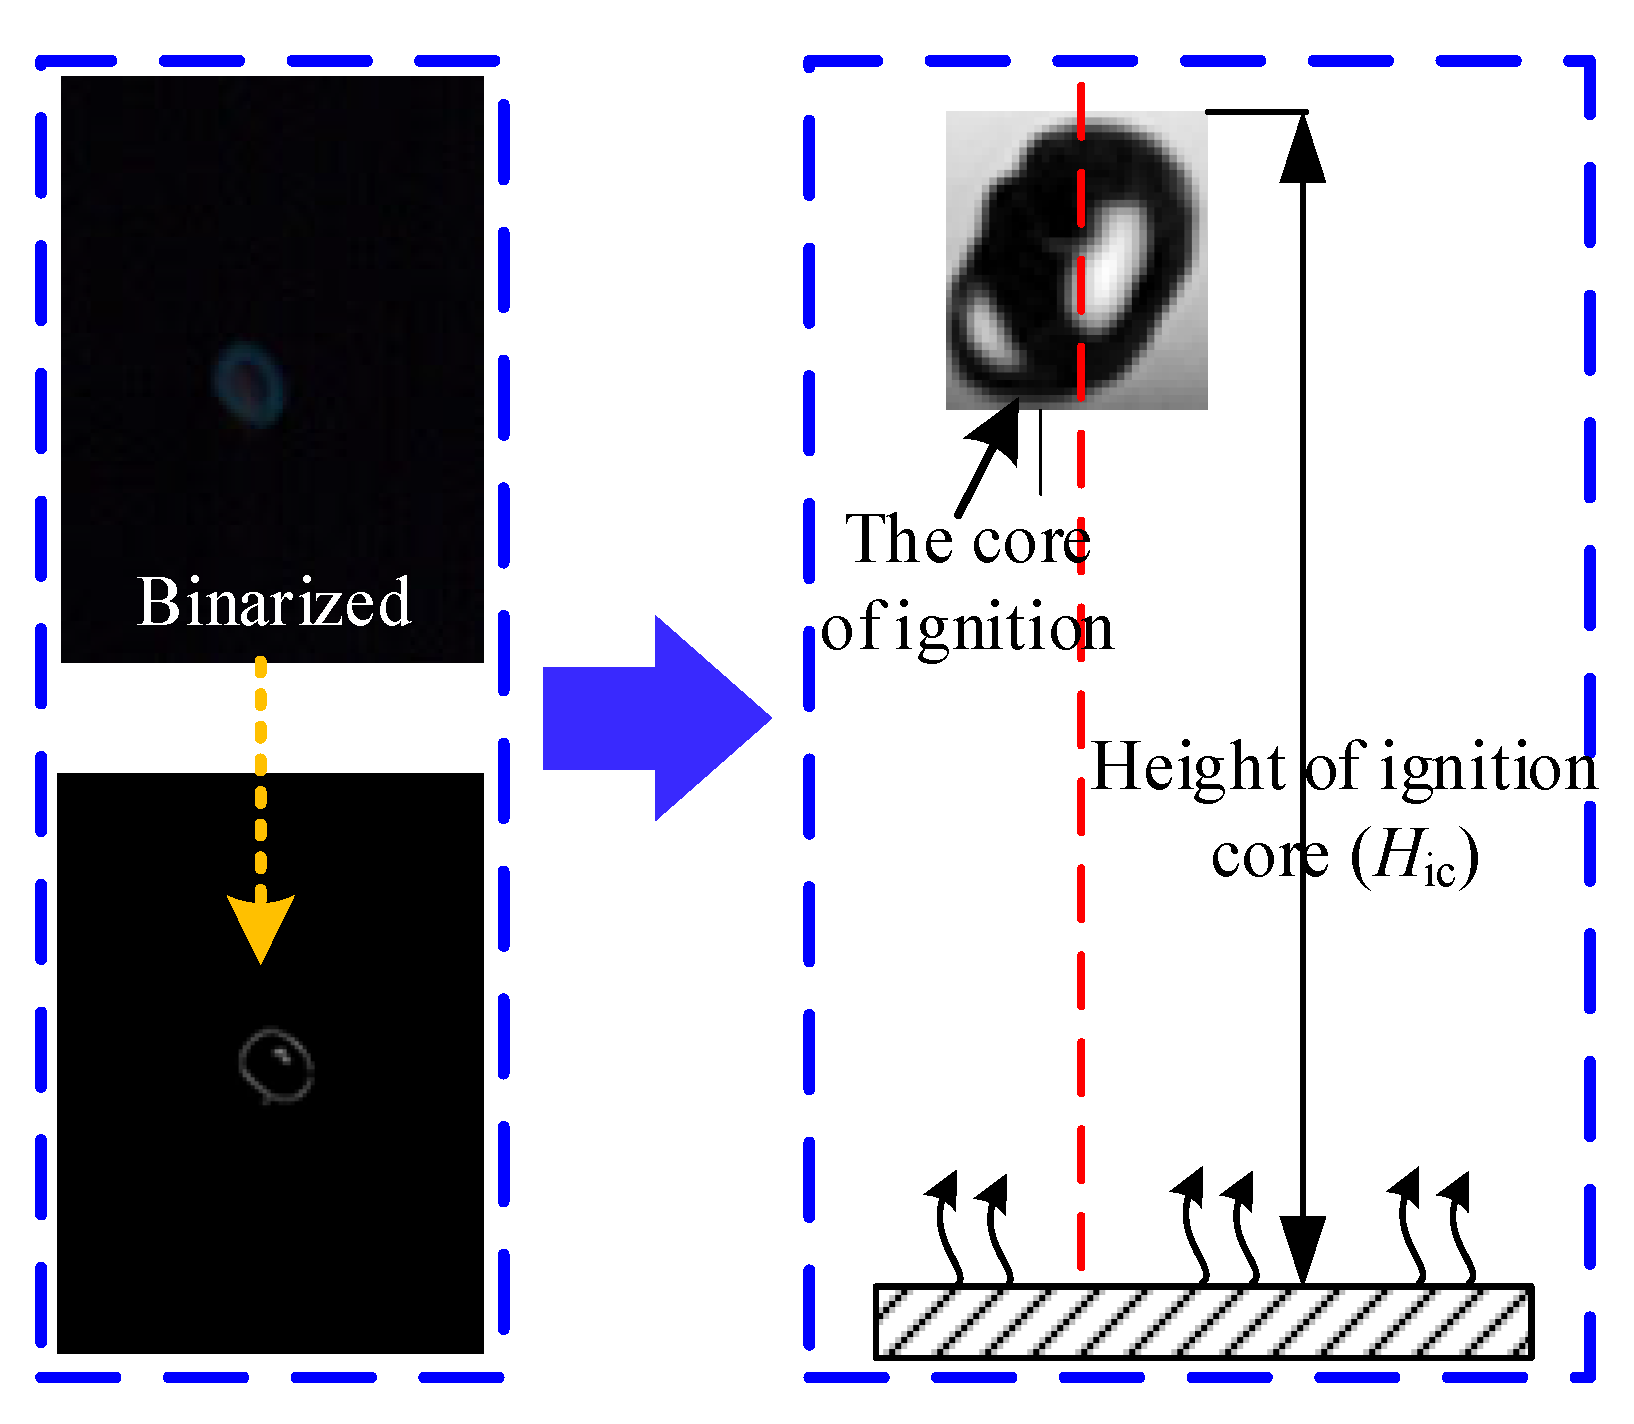
Flame height is a critical parameter in the combustion process. It is frequently used as a reference for industrial design, particularly in optimizing oil circuits and exhaust systems for gasoline, diesel, and motor oils [33]. This study selected the ignition core height and the maximum flame height as critical indicators for quantitatively analyzing flame behavior. The method used to determine the ignition core height (Hic) is illustrated in Figure 2. These measurements provide essential data for understanding combustion dynamics and improving the safety and efficiency of fuel system designs.
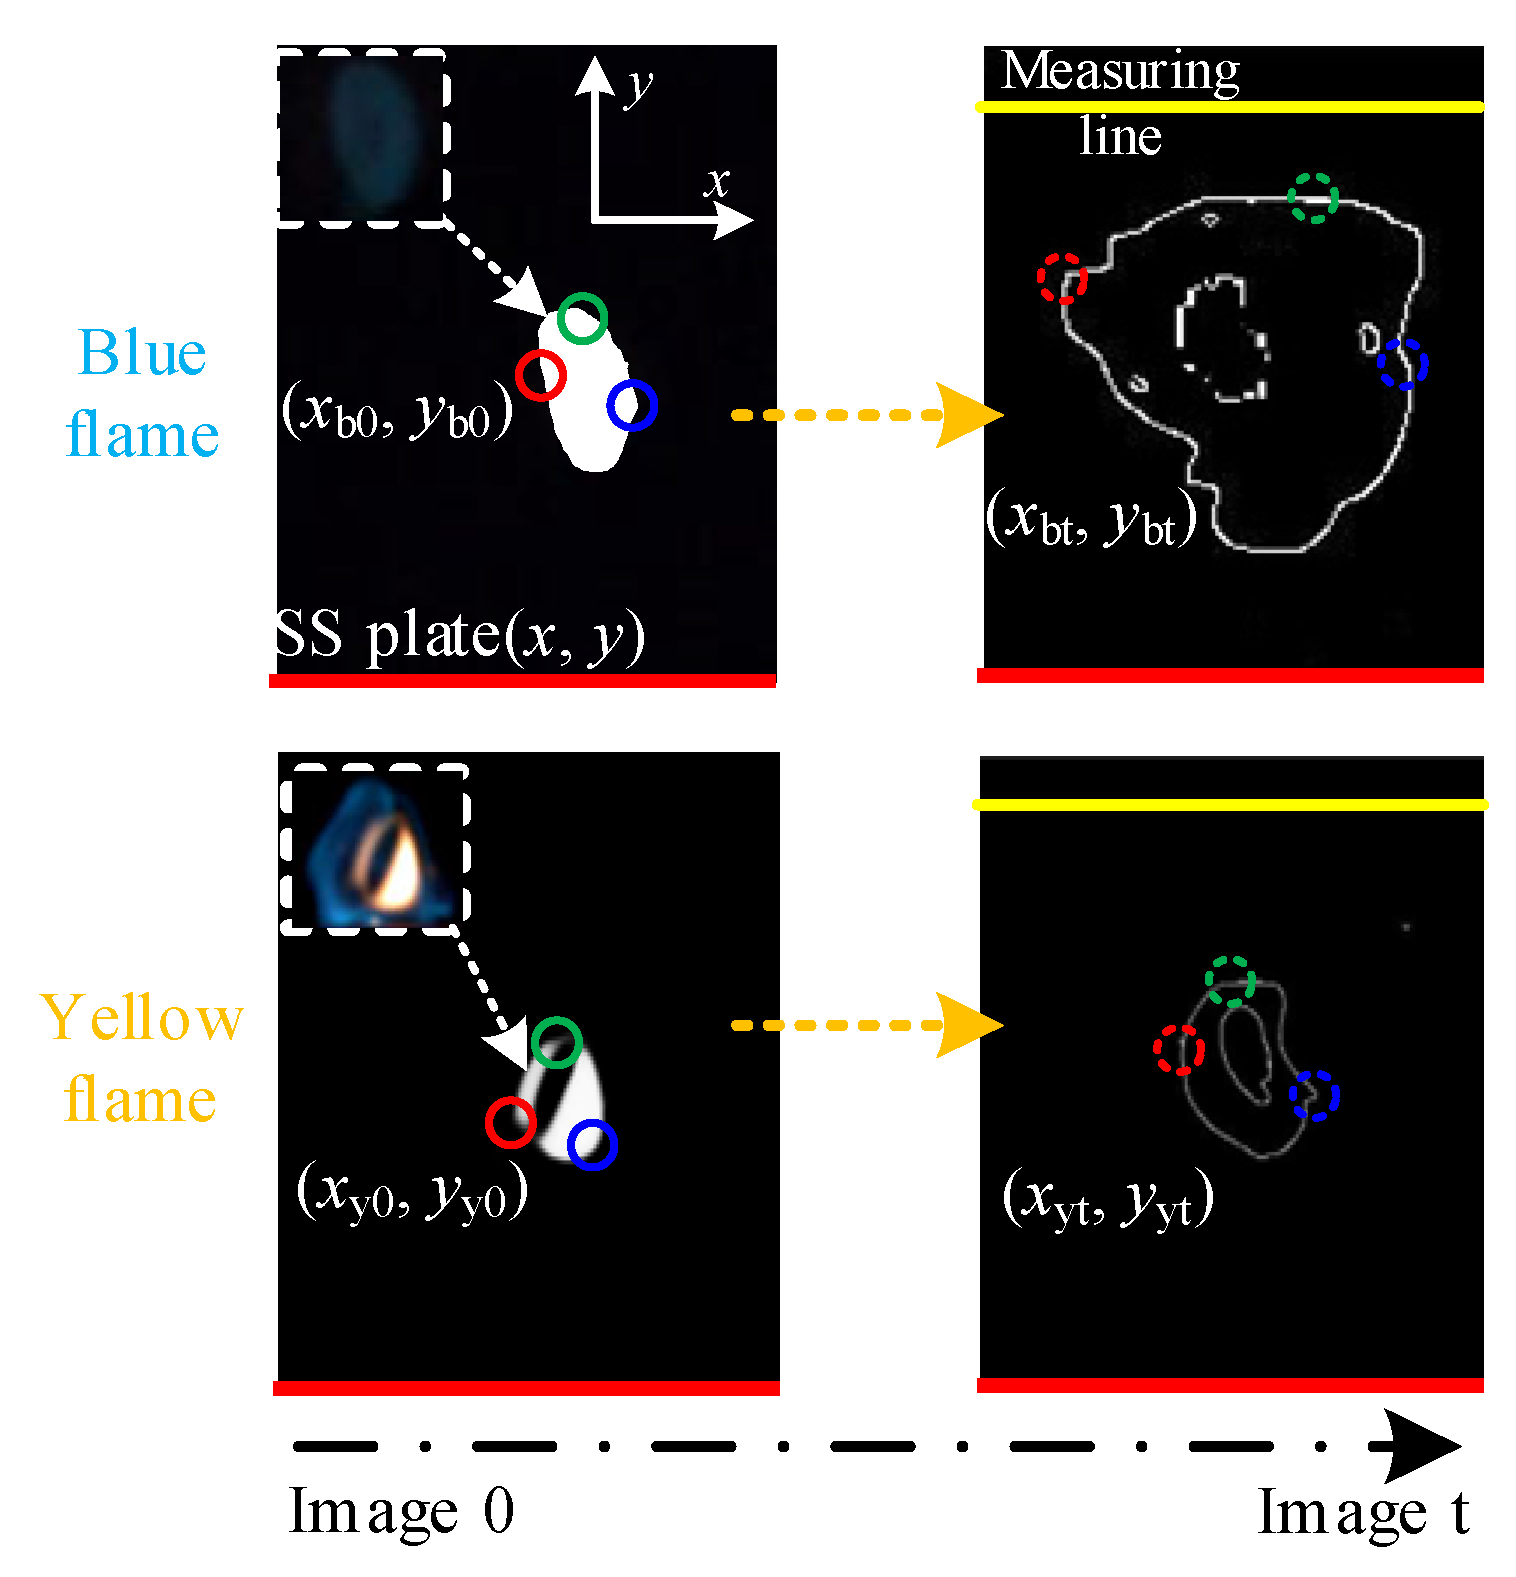
The processed images are output frame by frame to analyze the flame characteristics. As shown in Figure 3, the first frame of the flame image was taken with a blue flame and yellow flame coexisting (t = 5 s), and after segmenting the image, the flame edge pixel points were identified and localized.
In Figure 3, the edge pixels of the blue flame in the first frame (Image 0) are denoted as (xb0, yb0), and the edge pixels of the yellow flame in the same frame are denoted as (xy0, yy0). Similarly, the edge pixels of the blue flame in the t-the frame (Image t) are defined as (xbt, ybt), and those of the yellow flame as (xyt, yyt). The pixel coordinates on the upper surface of the hot SS plate are represented as (x, y), with a measurement line set at a height of 80 mm from the surface of the SS plate. Using the pixel positions of both the flame and SS plate, combined with Chebyshev’s theorem [35] to scale the flame image’s feature edges, the flame height is calculated as shown in Equation (4).
H b i = g b y f x β = y b t i i 0 , S f x β H y i = ρ y θ f x β = θ y t i i 0 , S f x β H max = max H b i , H y i β
where Hb(i) is the height of the blue flame, the vertical distance between the upper edge of the blue flame and the upper surface of the SS; Hy(i) is the height of the yellow flame, the vertical distance between the upper edge of the yellow flame and the upper surface of the SS; Hmax is the maximum value of the heights of the yellow flame and the blue flame.

2.3. Calculation of Flame Propagation Velocity

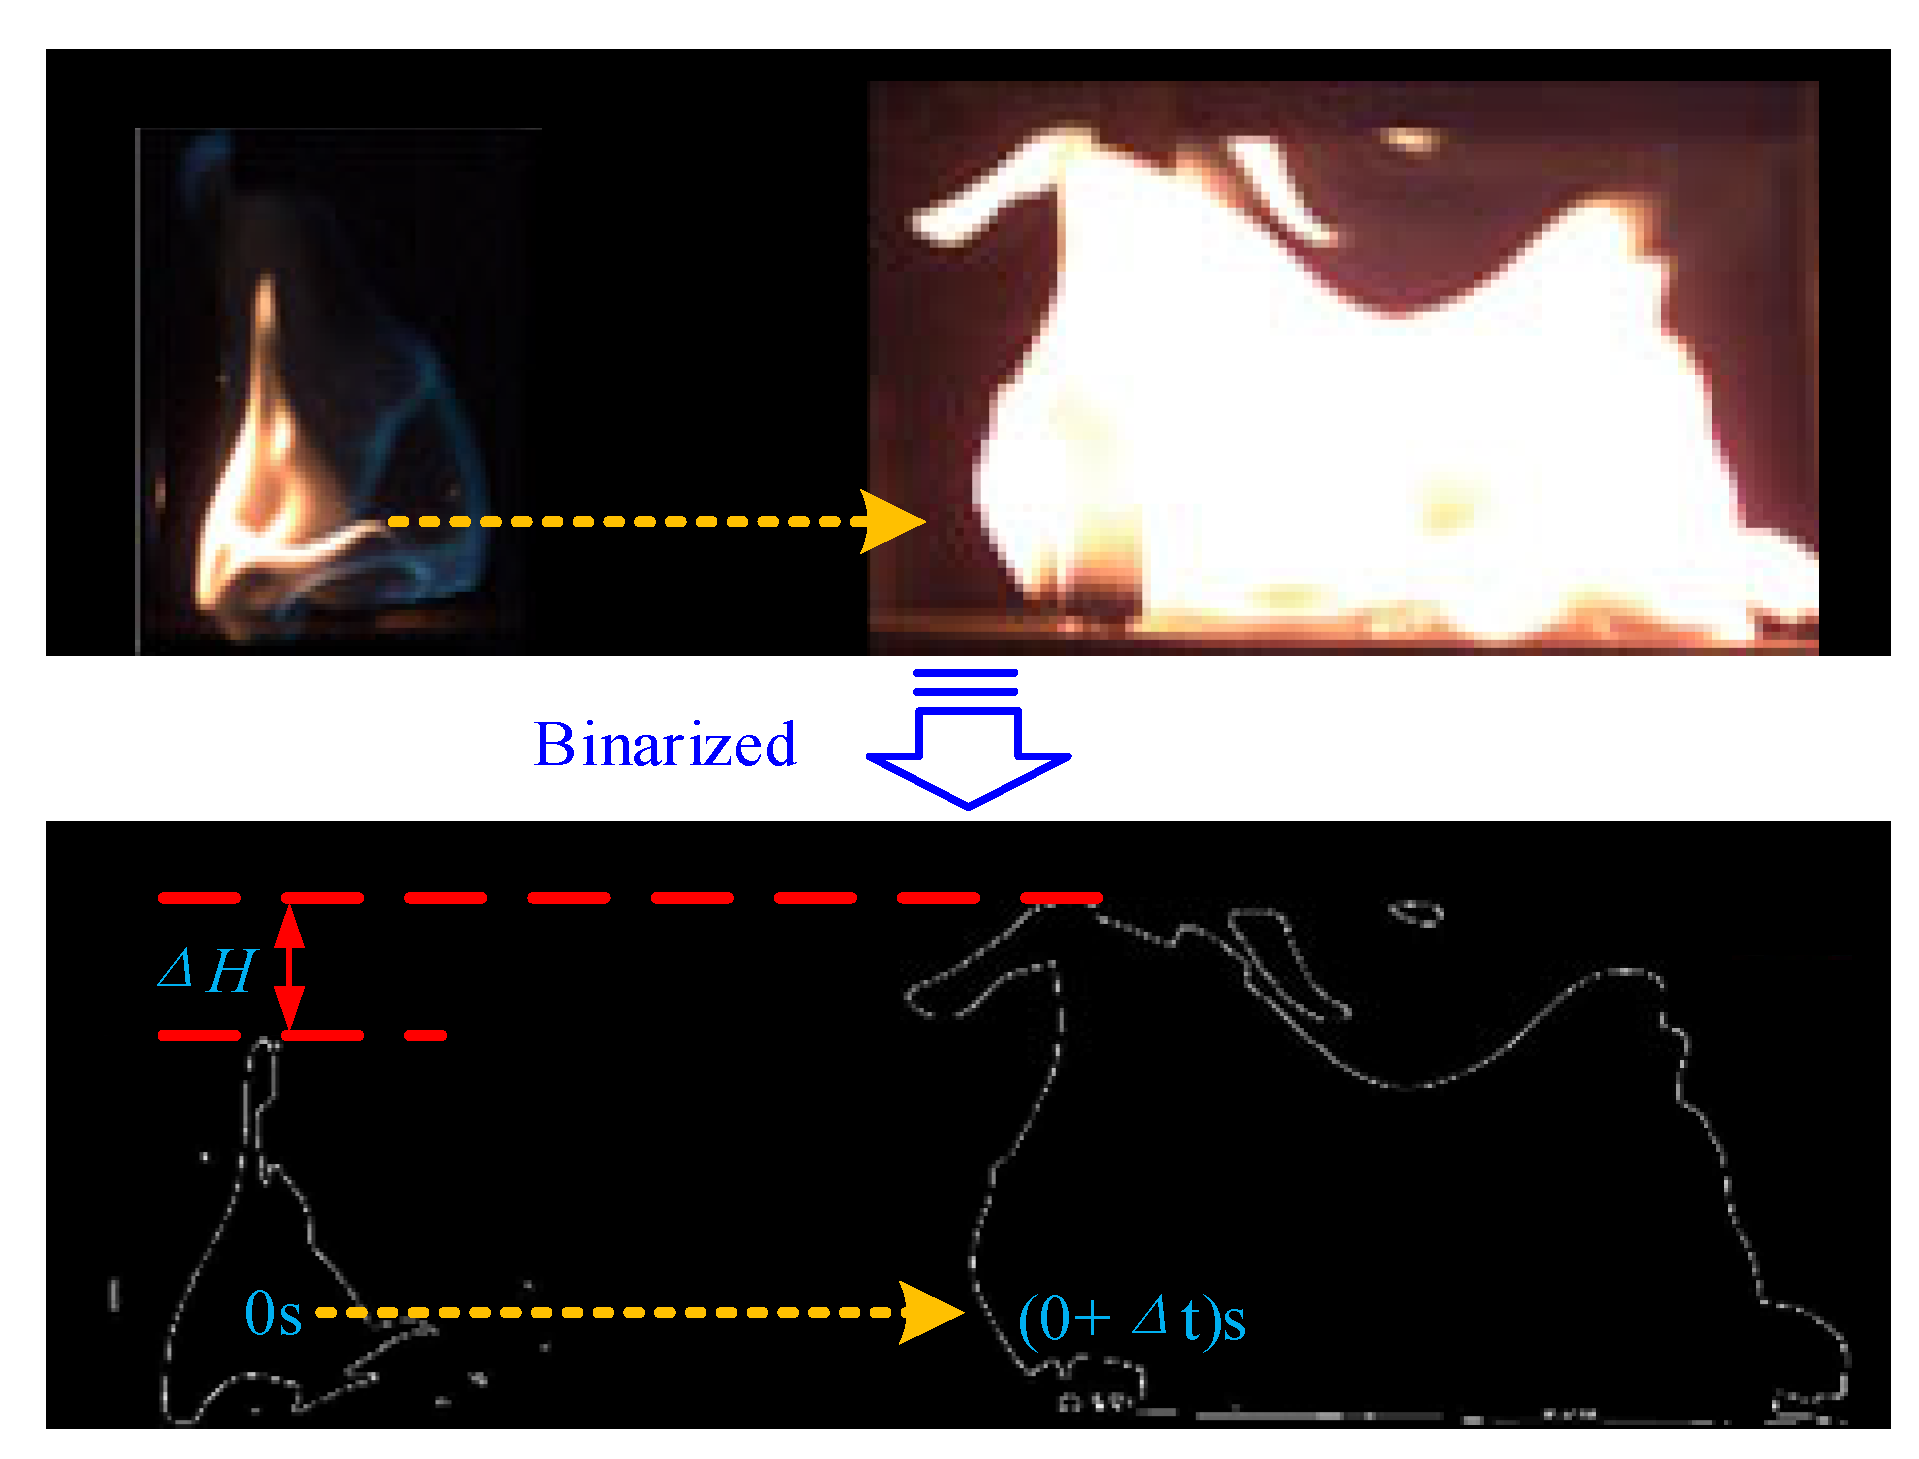
Fuel droplets contacted the hot SS plate, rapidly heating the fuel to its flash point. As the fuel vapor concentration accumulates, it eventually reaches the lower flammability limit, causing the ignition core to form just above the hot surface and quickly spread outward. The blue flame exists for only 0.03–0.05 s before disappearing, whereas the hot flame persists throughout the entire combustion process [36]. Consequently, this study uses the longitudinal propagation velocity of the hot flame, referred to as the flame propagation velocity, as a critical parameter for analyzing the spread of the flame. As shown in Figure 4, two points in the combustion image are selected. By measuring the distance (ΔH) between these points and the time (Δt) it takes for the flame to propagate between them, the average flame propagation velocity (Vf), can be calculated using Equation (5) [37].
V f = Δ H / Δ t

2.4. Calculation of Flame Temperature

During flame combustion, the flame emits substantial thermal energy and radiates varying degrees of heat to the surrounding environment. The intensity of this thermal radiation can, to some extent, characterize the flame temperature [38]. Consequently, the flame temperature is computed using Matlab software (R2023a) based on thermal radiation theories such as Wien’s law and blackbody radiation spectrum distribution [39]. Wien’s law is described in Equation (6).
E λ T = ε λ C 1 λ 5 exp C 2 λ T
where λ is the wavelength; T is the thermodynamic temperature; C1 and C2 are the first and second radiation constants.
At a specific temperature, the flame radiation is considered grey body radiation, and the colorimetric method can be taken to measure the flame temperature [40]. Assuming that the same point of an object with temperature T is at wavelength λ, the monochromatic radiant energy is M (λ1, T), M (λ2, T), which is known from the principle of colorimetric temperature measurement:
T = C 2 1 λ 1 1 λ 2 ln L λ 1 T L λ 2 T + ln S λ 2 S λ 1 + ln ε λ 2 ε λ 1 + ln λ 1 λ 2 5
where L λ 1 T , L λ 2 T are the spectral radiant brightness; S λ 1 , S λ 2 are the spectral response sensitivity; ε λ 1 , ε λ 2 are the spectral emissivity.
In the above Equation, the spectral emissivity of the gray body radiation wavelength is the same, ln ε λ 2 ε λ 1 0 . Therefore, Equation (7) can be simplified as:
T = C 2 1 λ 1 1 λ 2 ln L λ 1 T L λ 2 T + ln S λ 2 S λ 1 + ln λ 1 λ 2 5

3. Experimental Results and Discussion

3.1. Specimen

The engine lubricant is the most easily ignited fluid on the hot surface of the car [41]. Therefore, a 0 w-–40 type fully synthetic lubricant commonly used in automobile engines was selected for this test. The oil has good low-temperature and viscous properties, low volatilization loss, high thermal stability, and anti-wear, which align with advanced international environmental standards and other technical specialities. Its principal physical parameters are shown in Table 1.
The test was conducted using LO (0.1 mL, 0.2 mL, 0.3 mL, 0.4 mL, and 0.5 mL) with different oil quantities, and 10 repeatability tests were carried out, respectively. The samples were named and numbered according to the amount of oil and the number of tests. For example: LO–0.1–1 represents the first test conducted with 0.1 mL of LO.

3.2. Test System

In this paper, the hot surface ignition test was carried out using the experimental platform for the hot surface ignition. The experimental platform mainly includes the lifting platform, temperature testing system, and image monitoring system; the system arrangement is shown in Figure 5.
The lifting platform comprises a lifting base, an insulation cover, a hot plate, a heating control system, and an LO injection hole. The lifting base allows for the adjustment of the distance between the hot surface plate and the lubricant injection hole, with this distance set to 80 mm to replicate the vertical spacing between the oil pipeline and the three-way catalytic converter of the test vehicle. The insulation cover ensures the safety of the test process by preventing heat transfer. The hot plate is constructed from 304 stainless steel (SS), identical in material, cross-sectional dimensions, and thickness to the automotive three-way catalytic converter, with specific dimensions of 150 mm in length, 80 mm in width, and 1.5 mm in height. Before testing, the SS plate is polished to a surface roughness of Ra < 0.02 μm. The heating control system includes a top water tank and a bottom heating chamber. The top water tank uses a constant-temperature heater to simulate the temperature near the oil pipe during the vehicle operation. At the same time, the bottom heating chamber heats the SS plate to replicate the temperature on the surface of the three-way catalytic converter. The lubricant injection hole is connected to a high-precision automatic oil injection pump, capable of injecting LO at a rate of 0.01 to 0.6 mL/s for the oil dripping test.
The temperature testing system using 12 k–type thermocouples (temperature range of 0–1150 °C, temperature response time of 0.5 ms, test accuracy of 0.1 °C; Asmik Sensing Technology Co., Ltd., Zhejiang, China) in a 2 × 2 manner was arranged in the top plate tank below the 2 cm overhanging position at the location and the surface of the SS board, and supporting the Keysight DAQ970A temperature collector (TC DAQ) real-time measurement of the surface temperature of the SS board and the ambient temperature. The acquisition frequency was set to 25 Hz.
The image monitoring system used a set of Phantom® VEO640 high-speed cameras (VEO640, Vision Research, Inc., Wayne, NJ, USA; sensor: CMOS; resolution: 2560 pixel × 1600 pixel; maximum shooting rate: 350,000 frames/s; pixel size: 10 μm; sensitivity: 40,000 B/W, 6400 color), with a Canon® 100 mm fixed-focus lens (EF 100 mm f/2.8, Canon Company, Inc., Tokyo, Japan; focal length: 100 mm) real-time acquisition of LO combustion video during the test. The test shooting speed was 700 pps and the exposure time was 700 μs. Finally, the video was stored on a computer in Avi and Cine formats.

3.3. Test Process

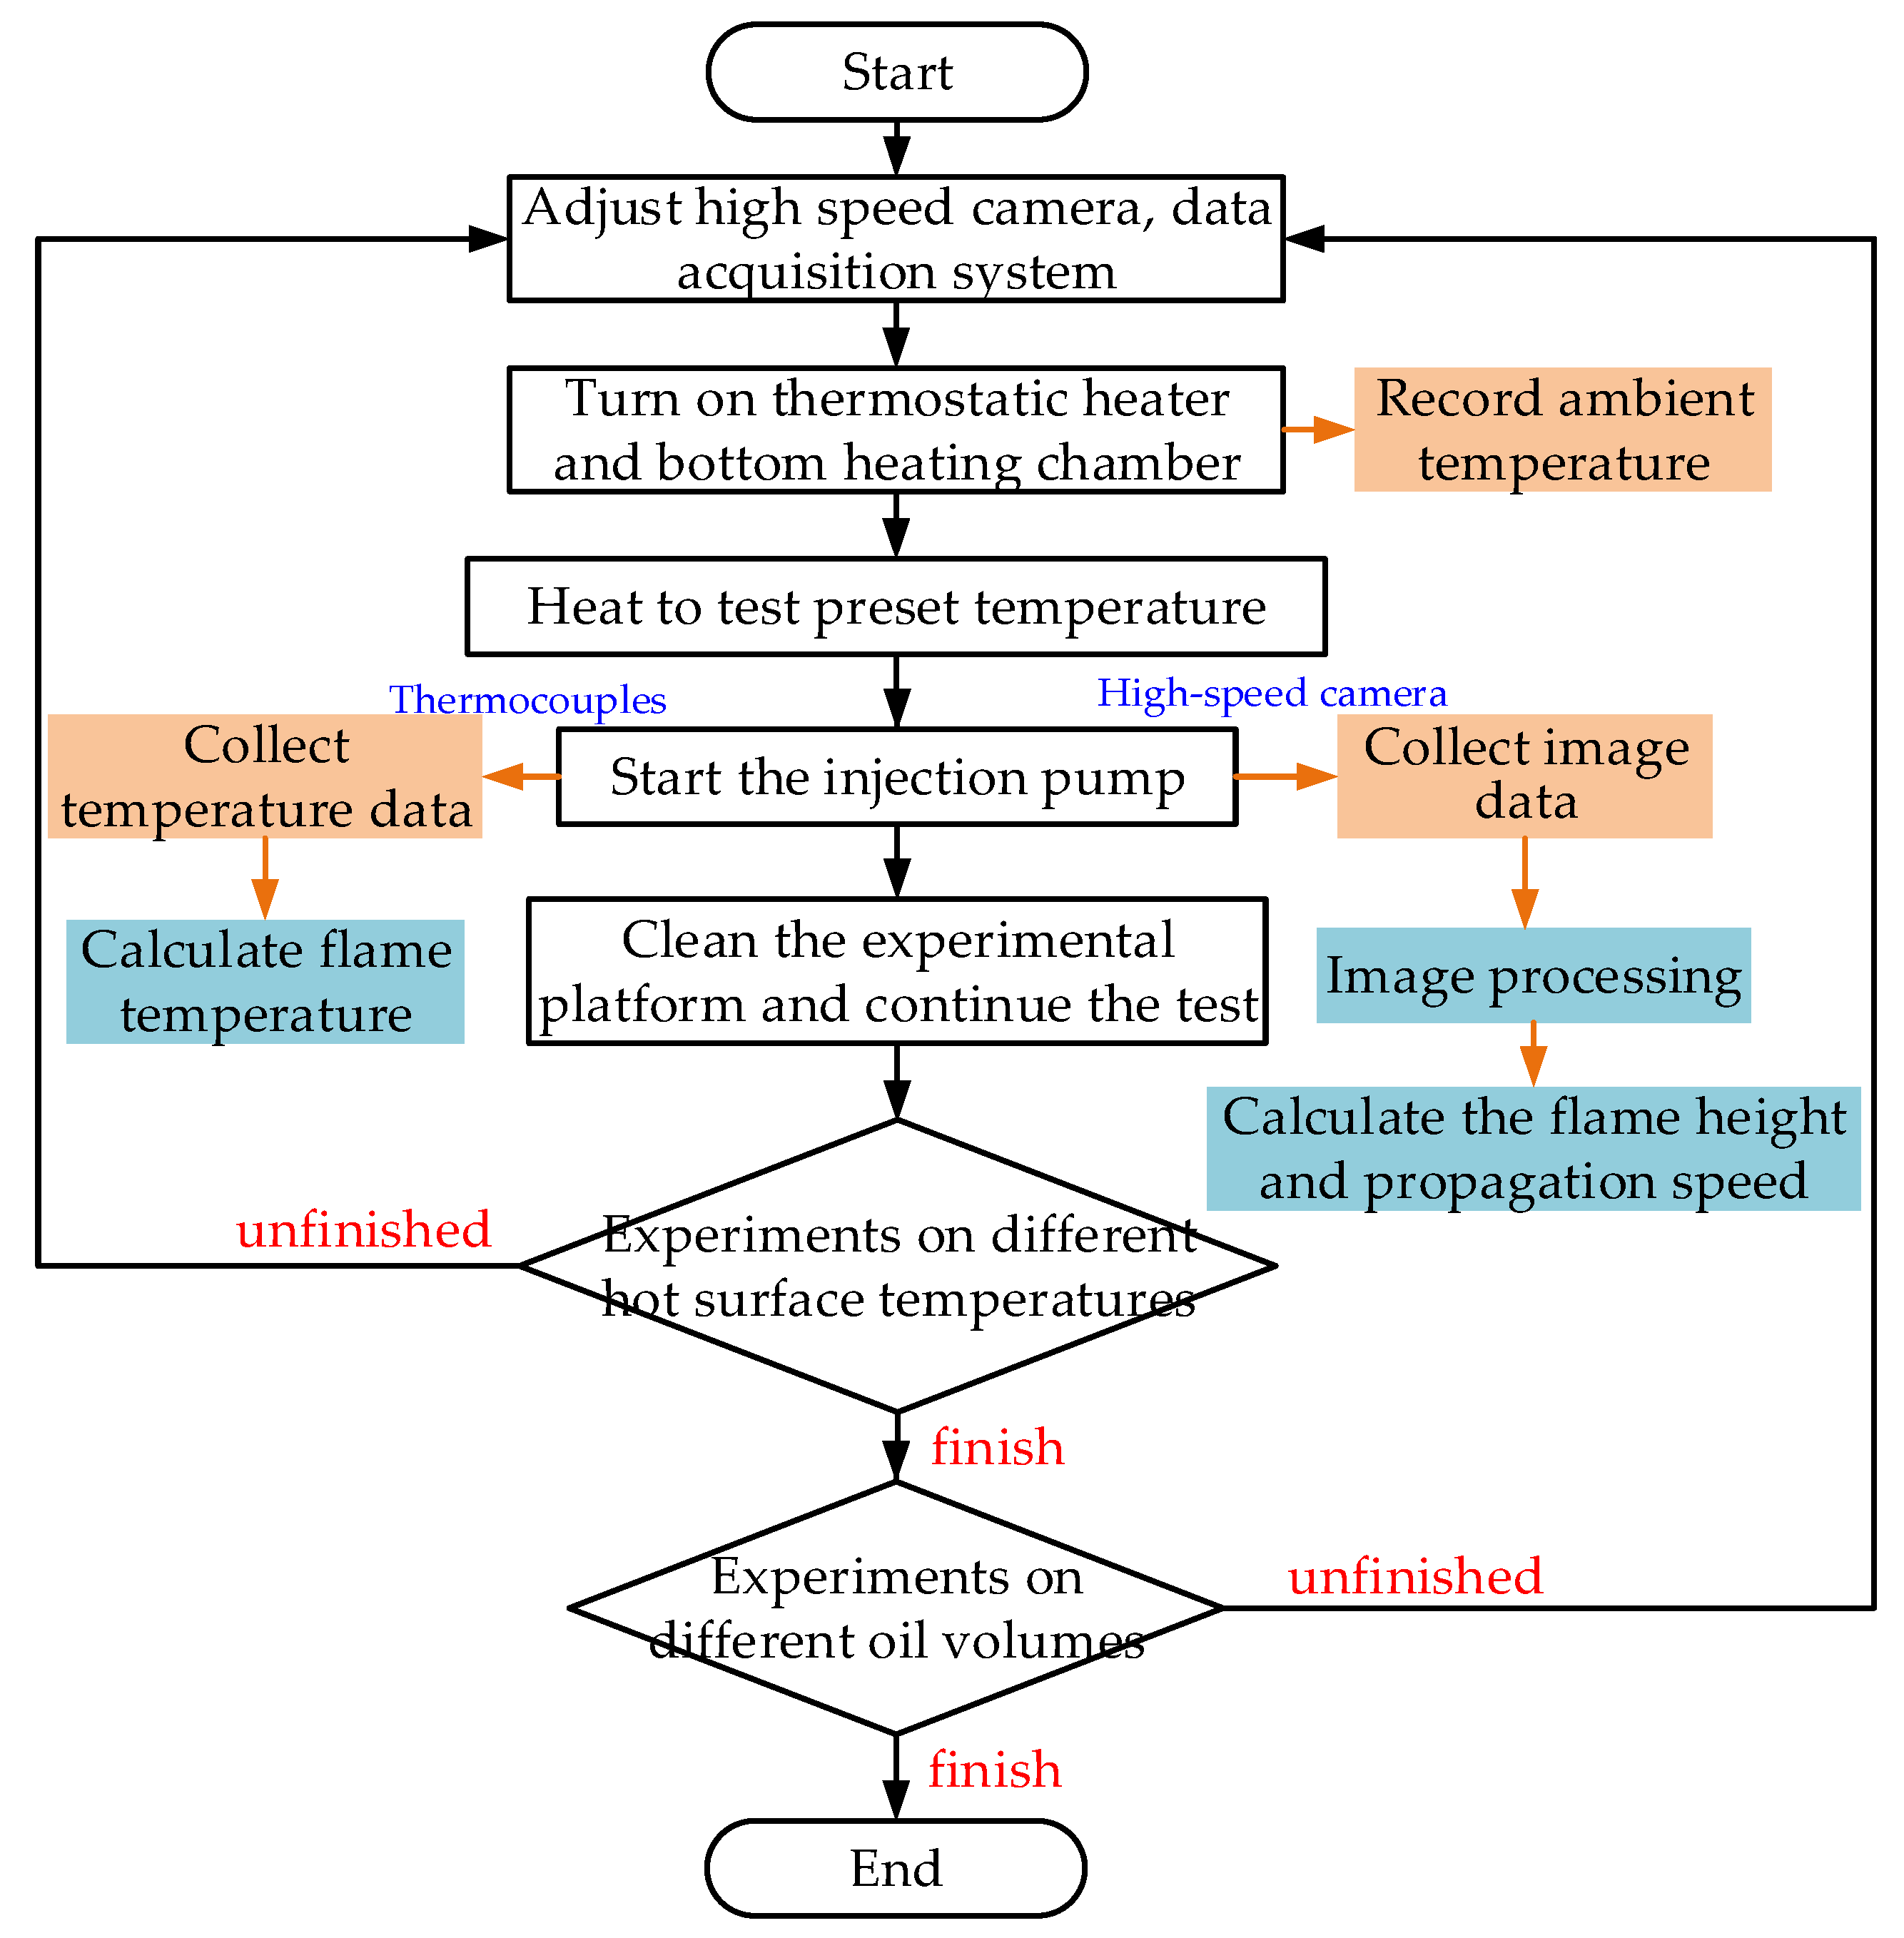
According to the test design of this paper, the hot surface ignition test of the automotive lubricant ignition is carried out by considering the effects of the oil volume and hot surface temperature on flame combustion characteristics. The specific test process is shown in Figure 6.
During the test, the ambient temperature range was maintained at 30.0~32.6 °C, and the humidity range was 78.9~82.5%. The hot surface temperature was increased in steps of 5 °C, and the temperature range was 370~500 °C [45]. It should also be noted that after each test, the surface of the test material was purged using a blower to exclude the interference of the remaining oil vapors on the next experiment, and the surface of the SS plate was polished to remove the surface oil residue.

4. Results

4.1. Ignition Temperature

Lubricant ignition on a hot surface is a probabilistic event and the probability of ignition on the hot surface increases from 0 to 100% as the temperature increases. The hot surface temperature at which the lubricant has a 100% ignition probability is defined as the maximum ignition temperature (Tmax), and the minimum ignition temperature of the lubricant on the hot surface is defined as the minimum ignition temperature (Tmin). Based on the above hot surface ignition test, the ignition temperature of the lubricant on the hot surface is obtained, as shown in Table 2.
As shown in Table 2, there is a notable negative correlation between the minimum and maximum ignition temperatures of the hot surface and the volume of oil. As the oil volume increases from 0.1 mL to 0.5 mL, the minimum ignition temperature decreases from 370 °C to 312 °C, and the maximum ignition temperature decreases from 415 °C to 355 °C, thereby elevating the risk of ignition. This trend is attributed to variations in combustible concentrations on the hot surface at the same temperature, which affect the oxidation reaction rate, vapor pressure, and free radical dynamics. Specifically: ① Within a given temperature range, an increase in oil volume leads to a higher concentration of free radicals, accelerating the oxidation reaction rate of the combustibles and thereby reducing the minimum ignition temperature of the hot surface. ② Higher combustible concentrations and increased vapor pressure enhance the likelihood of hot surface ignition, lowering the minimum ignition temperature.
However, when the droplet oil volume is 0.5 mL (LO-0.5), the minimum ignition temperature of 312 °C is paradoxically higher than that of 0.4 mL, indicating a reduced likelihood of ignition. The main reasons for this phenomenon are as follows [46,47]: ① Larger volumes of lubricant oil tend to form a greater thermal capacity during heating, which requires higher temperatures to initiate ignition. ② Within a defined combustion system, as the concentration of combustible gas rises to a certain level, the relative concentration of the fluxing agent (oxygen) decreases, making ignition more difficult. ③ When the concentration of the mixture is too high, heat disperses more readily, reducing the heat absorbed by the combustible gas per unit volume. This condition requires more heat for the occurrence of a hot-surface ignition. ④ Larger oil volumes may also lead to stronger interactions between oil droplets, such as collisions and coalescence, which can further raise the ignition temperature.

4.2. Flame Development Characteristics

Figure 7 shows an image sequence of a flame combustion of the engine lubricant LO-0.1-1 with a hot surface temperature of 370 °C. It can be seen that the flame characteristics change significantly during the flame combustion process and that there are two typical flames: a blue flash flame (referred to as a blue flame) and a yellow diffusion flame (referred to as a hot flame).
As illustrated in Figure 7a, during the early stage of the flame combustion (t0), a blue flash flame appears above the hot plate, characterized by a round, transparent, and low-brightness “ignition core”. This blue coloration is attributed to the production of CH2O and H2O2 during fuel oxidation, which decomposes into free radicals CH and C2 [48]. As combustion progresses (t0 + 8.35 μs), the blue flame rapidly enlarges, leading to further oxidation that produces substantial amounts of carbon monoxide and methane. The central region of the blue flame, being the hottest, initiates the formation of a yellowish-white flame. This results in a dual flame structure where the blue flame envelops the hot flame, as depicted in Figure 7b. Due to the more incredible exothermic reaction and higher temperature of the hot flame compared to the blue flame, the hot flame propagates more rapidly [49], eventually surpassing and merging with the blue flame, causing the latter to disappear. Simultaneously, unburned carbon monoxide, methane, and other substances are fully oxidized to CO2 and H2O, forming the predominant hot flame [50], as shown in Figure 7c. Figure 7c,d indicate that the hot flame dominates the combustion process, comprising over 80% of the total duration. As the concentration of combustible gases diminishes and the hot plate cools, the hot flame’s combustion area gradually contracts into a “cone-like” shape, with only a minimal blue flame remaining at the base. By t0 + 2408.14 μs, the hot flame area further decreases and eventually disappears, leaving only a small area of blue flame.
The test results reveal that the combustion behavior of engine lubricating oil on a hot surface can be categorized into three distinct stages: (i) the appearance of the blue flame, which is subsequently enveloped by the hot flame; (ii) the hot flame’s emergence through the blue flame, leaving only minor irregular blue flame remnants at the hot flame’s periphery; and (iii) the eventual disappearance of the hot flame, with only a tiny blue flame remaining at the base.
Based on these observations, the following definitions are proposed: ① the maximum height of the blue flame is defined as the maximum blue flame height observed when its vertical height reaches its peak; ② the duration for which the blue flame remains visible, defined as the period from the appearance of the blue flame to its dispersion by the hot flame, as depicted in Figure 7a–c; ③ the maximum height of the hot flame is defined as the distance from the hot plate to the highest point of the hot flame; ④ the flame propagation velocity is defined as the rate at which the hot flame reaches its maximum height, as illustrated in Figure 7a–d.

5. Flame Combustion Characteristics

5.1. Flame Height

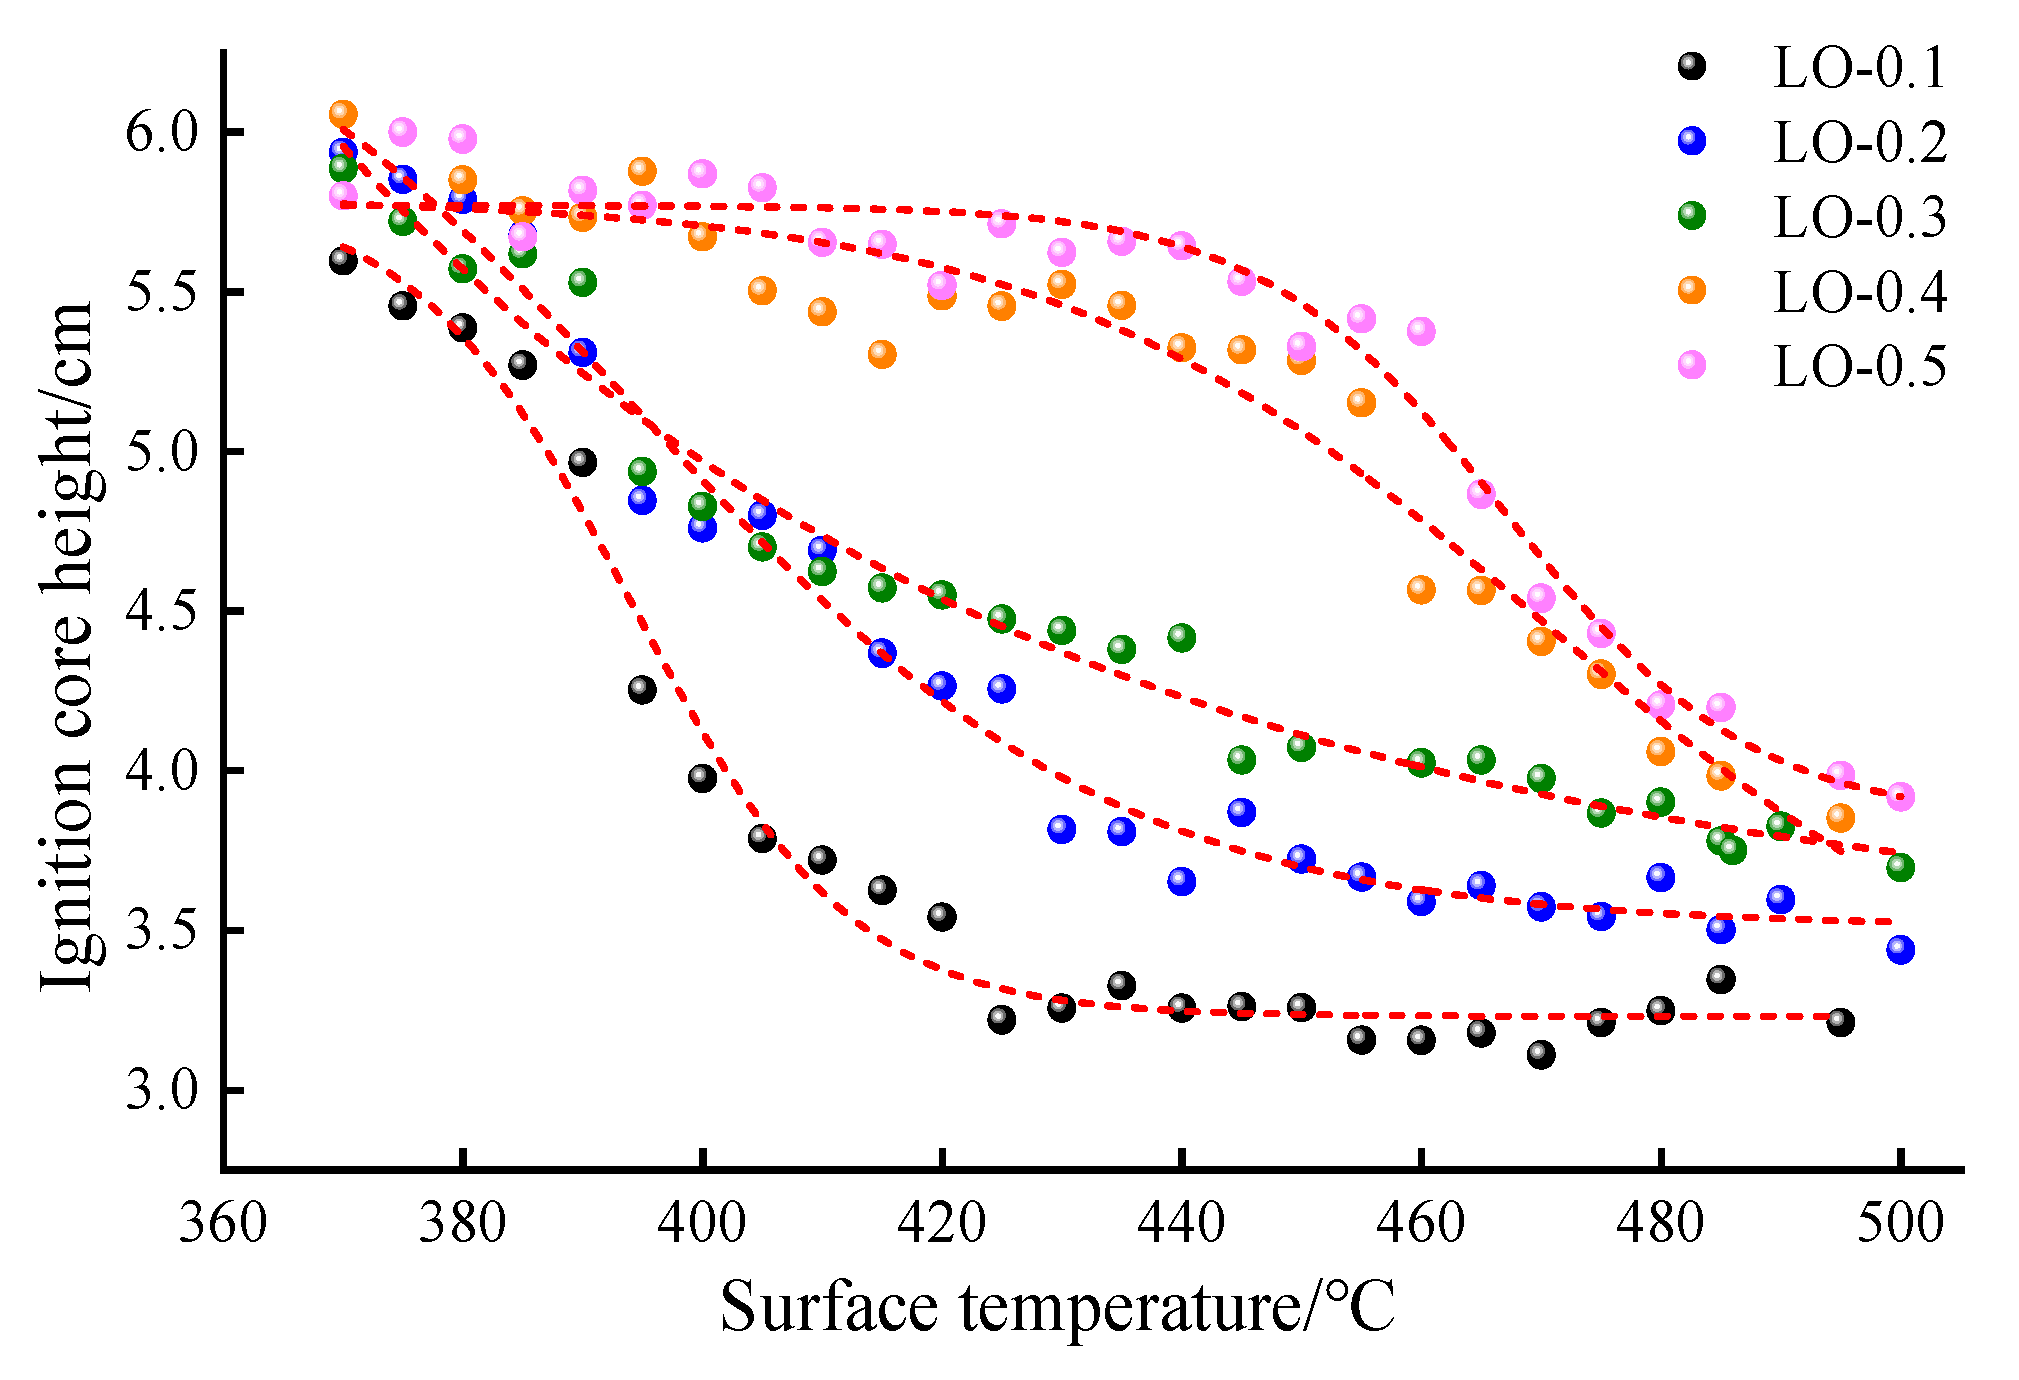
According to the above flame development characteristics, combined with the lubricant ignition core height determination method in Figure 2, the ignition core heights under different working conditions are collected and calculated, and the calculation results are shown in Figure 8.
As can be seen from Figure 8, the hot surface temperature is one of the main factors leading to the lubricant ignition core height. The lubricant ignition core height decreases exponentially with the increase in the hot surface temperature under different oil volumes. Further analyzing Figure 8, it is evident that at lower hot surface temperatures (370 °C to 390 °C), the ignition core height of the lubricant is relatively high, ranging from 5.5 to 6 cm from the hot plate, with minimal variation between different oil quantities. As the hot surface temperature further increases (390~480 °C), the ignition core heights for low oil quantity lubricant samples (LO-0.1, LO-0.2, LO-0.3) decrease rapidly with the temperature rise, eventually stabilizing. Conversely, the ignition core heights for high oil quantity lubricant samples (LO-0.4, LO-0.5) decrease gradually before accelerating. Near 480 °C, the ignition core heights for all oil quantities are reduced to 3–4 cm from the hot plate. Further temperature increases cause the ignition core heights to initially decrease before stabilizing, with lower oil quantities resulting in relatively lower ignition core heights. This phenomenon is primarily due to the increased evaporation rate of the lubricant at higher temperatures, leading to a fuel vapor cloud around each oil droplet. When the oil droplet quantity is small, the lubricant evaporates entirely before reaching the boundary layer, causing the combustible concentration at the boundary layer to reach ignition levels closer to the hot plate, thereby resulting in a lower ignition core height.
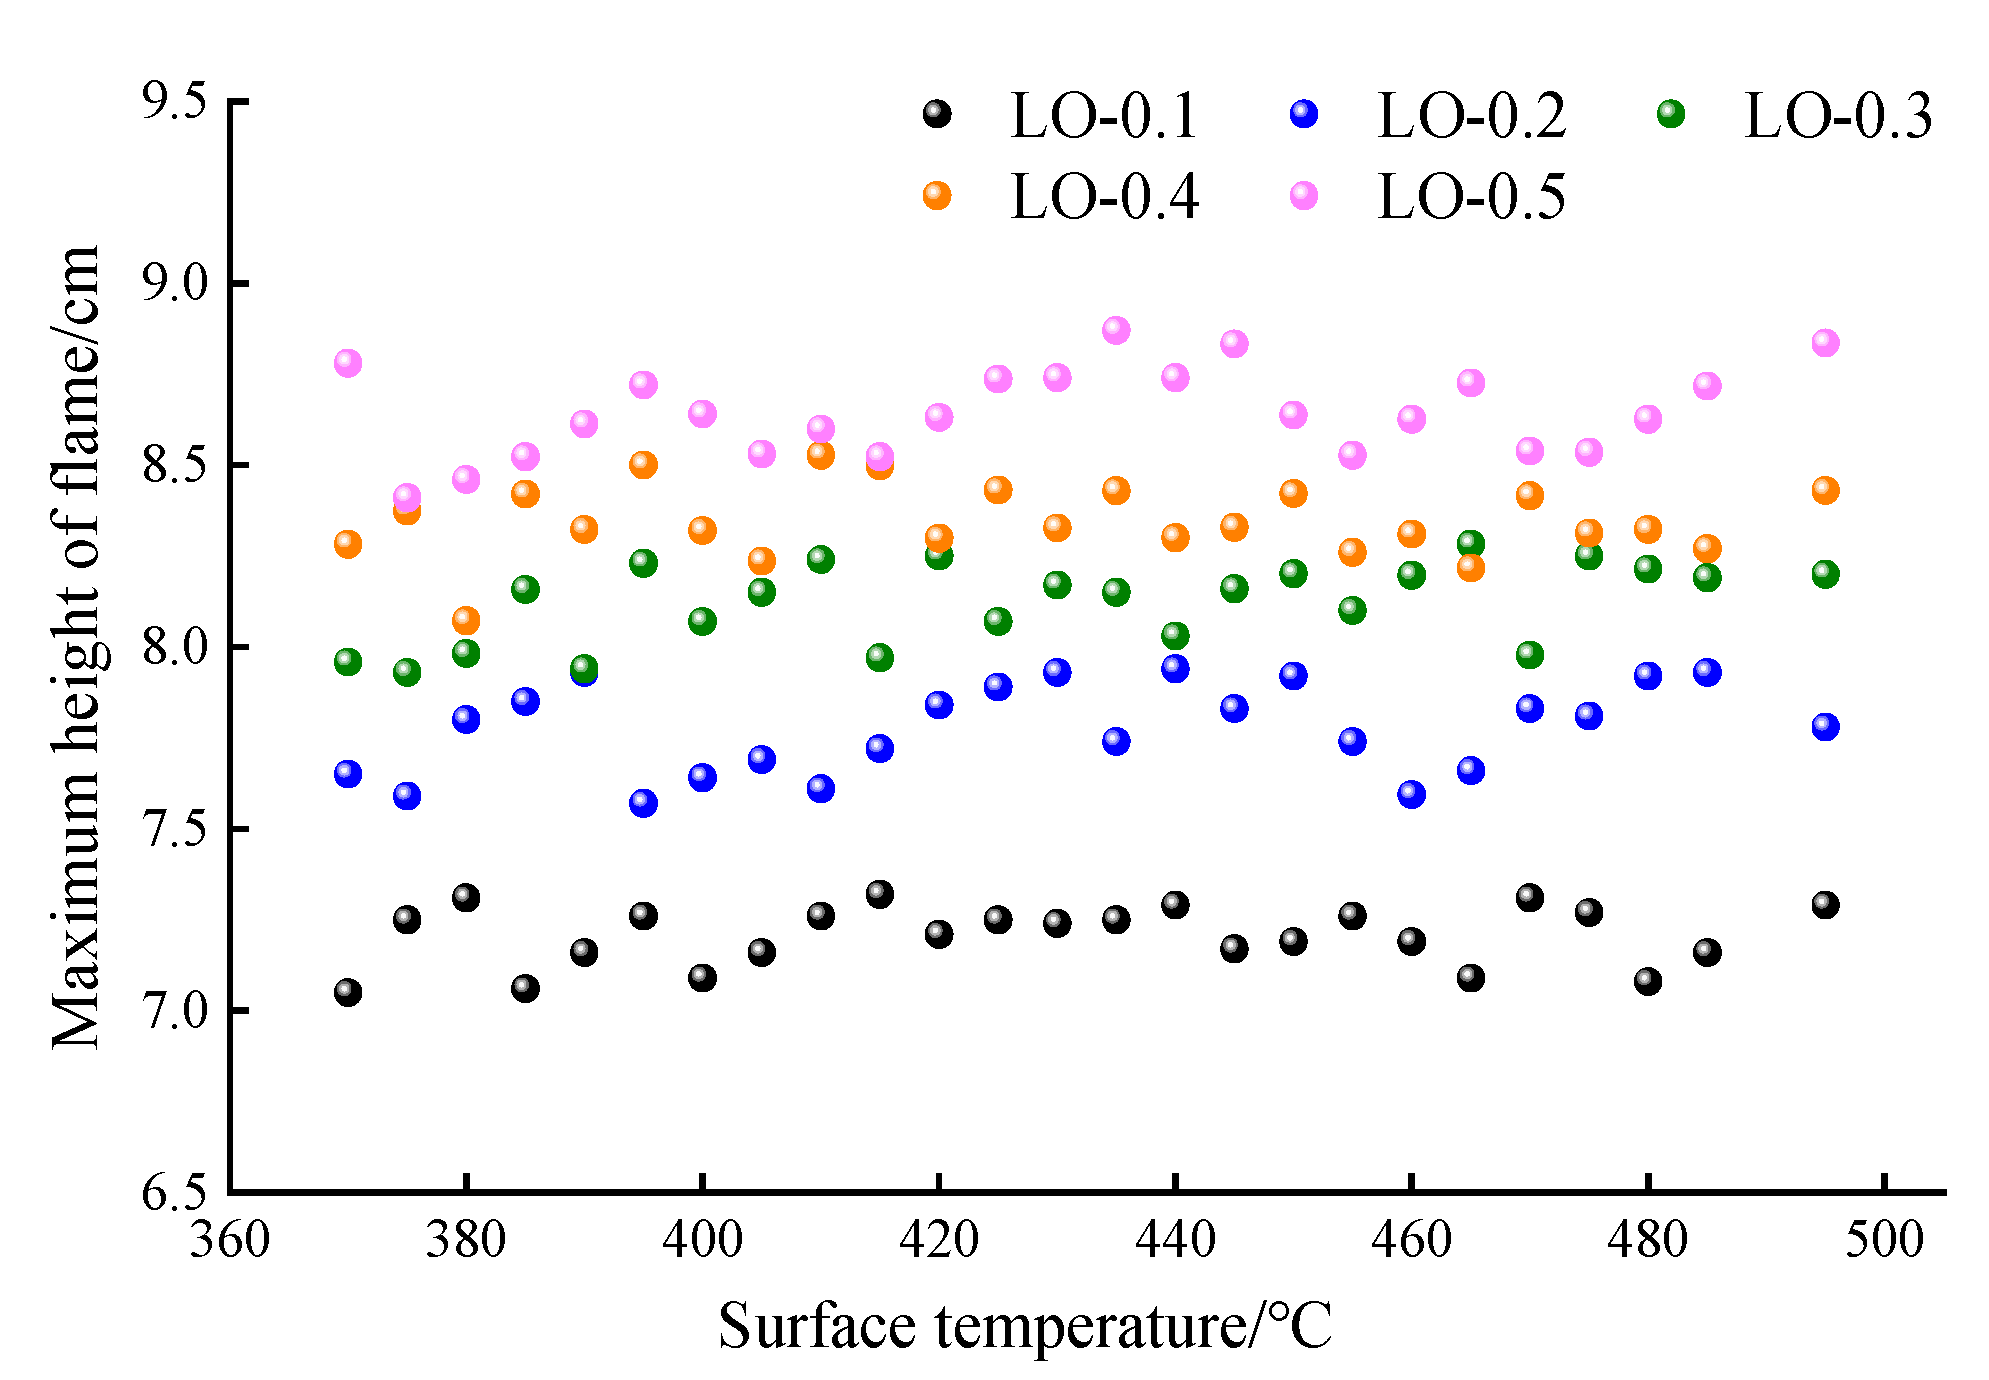
The height of the flame is closely related to its radiation intensity and propagation velocity, which are critical indicators of fire hazard [51]. Consequently, this study focuses on analyzing the maximum flame height of the hot flame during lubricating oil combustion. Using the calculation method outlined in Figure 3 and Equation (5), the maximum thermal flame heights for various oil volumes are presented in Figure 9.
Figure 9 shows that the initial hot surface temperature influences the maximum thermal flame height less but also shows a clear positive correlation with the oil volume. Specifically, the maximum thermal flame heights are as follows: for LO-0.1, between 70.3 and 73.2 mm; for LO-0.2, between 75.7 and 79.5 mm; for LO-0.3, between 79.3 and 82.5 mm; for LO-0.4, between 82.2 and 85.2 mm; and for LO-0.5, between 84.6 and 88.7 mm. This indicates that (1) the maximum hot flame height tends to increase with the oil volume, although the increase is relatively modest. This is due to the substantial temperature and concentration gradients at the flame boundary, which result in significant heat and mass exchange and promote further chemical reactions in the gas mixture near the flame. (2) At an oil volume of 0.2 mL (LO-0.2), the maximum hot flame height at a hot surface temperature of 500 °C is 79.5 mm, which is nearly equal to the distance between the oil pipe and the hot surface (80 mm). This height poses a considerable fire risk to the oil pipe, increasing the likelihood of a vehicle fire. For oil volumes exceeding 0.3 mL (LO-0.3), the hot flame height exceeds 80 mm, further elevating the risk of combustion and potential vehicle fire.

5.2. Flame Propagation Velocity

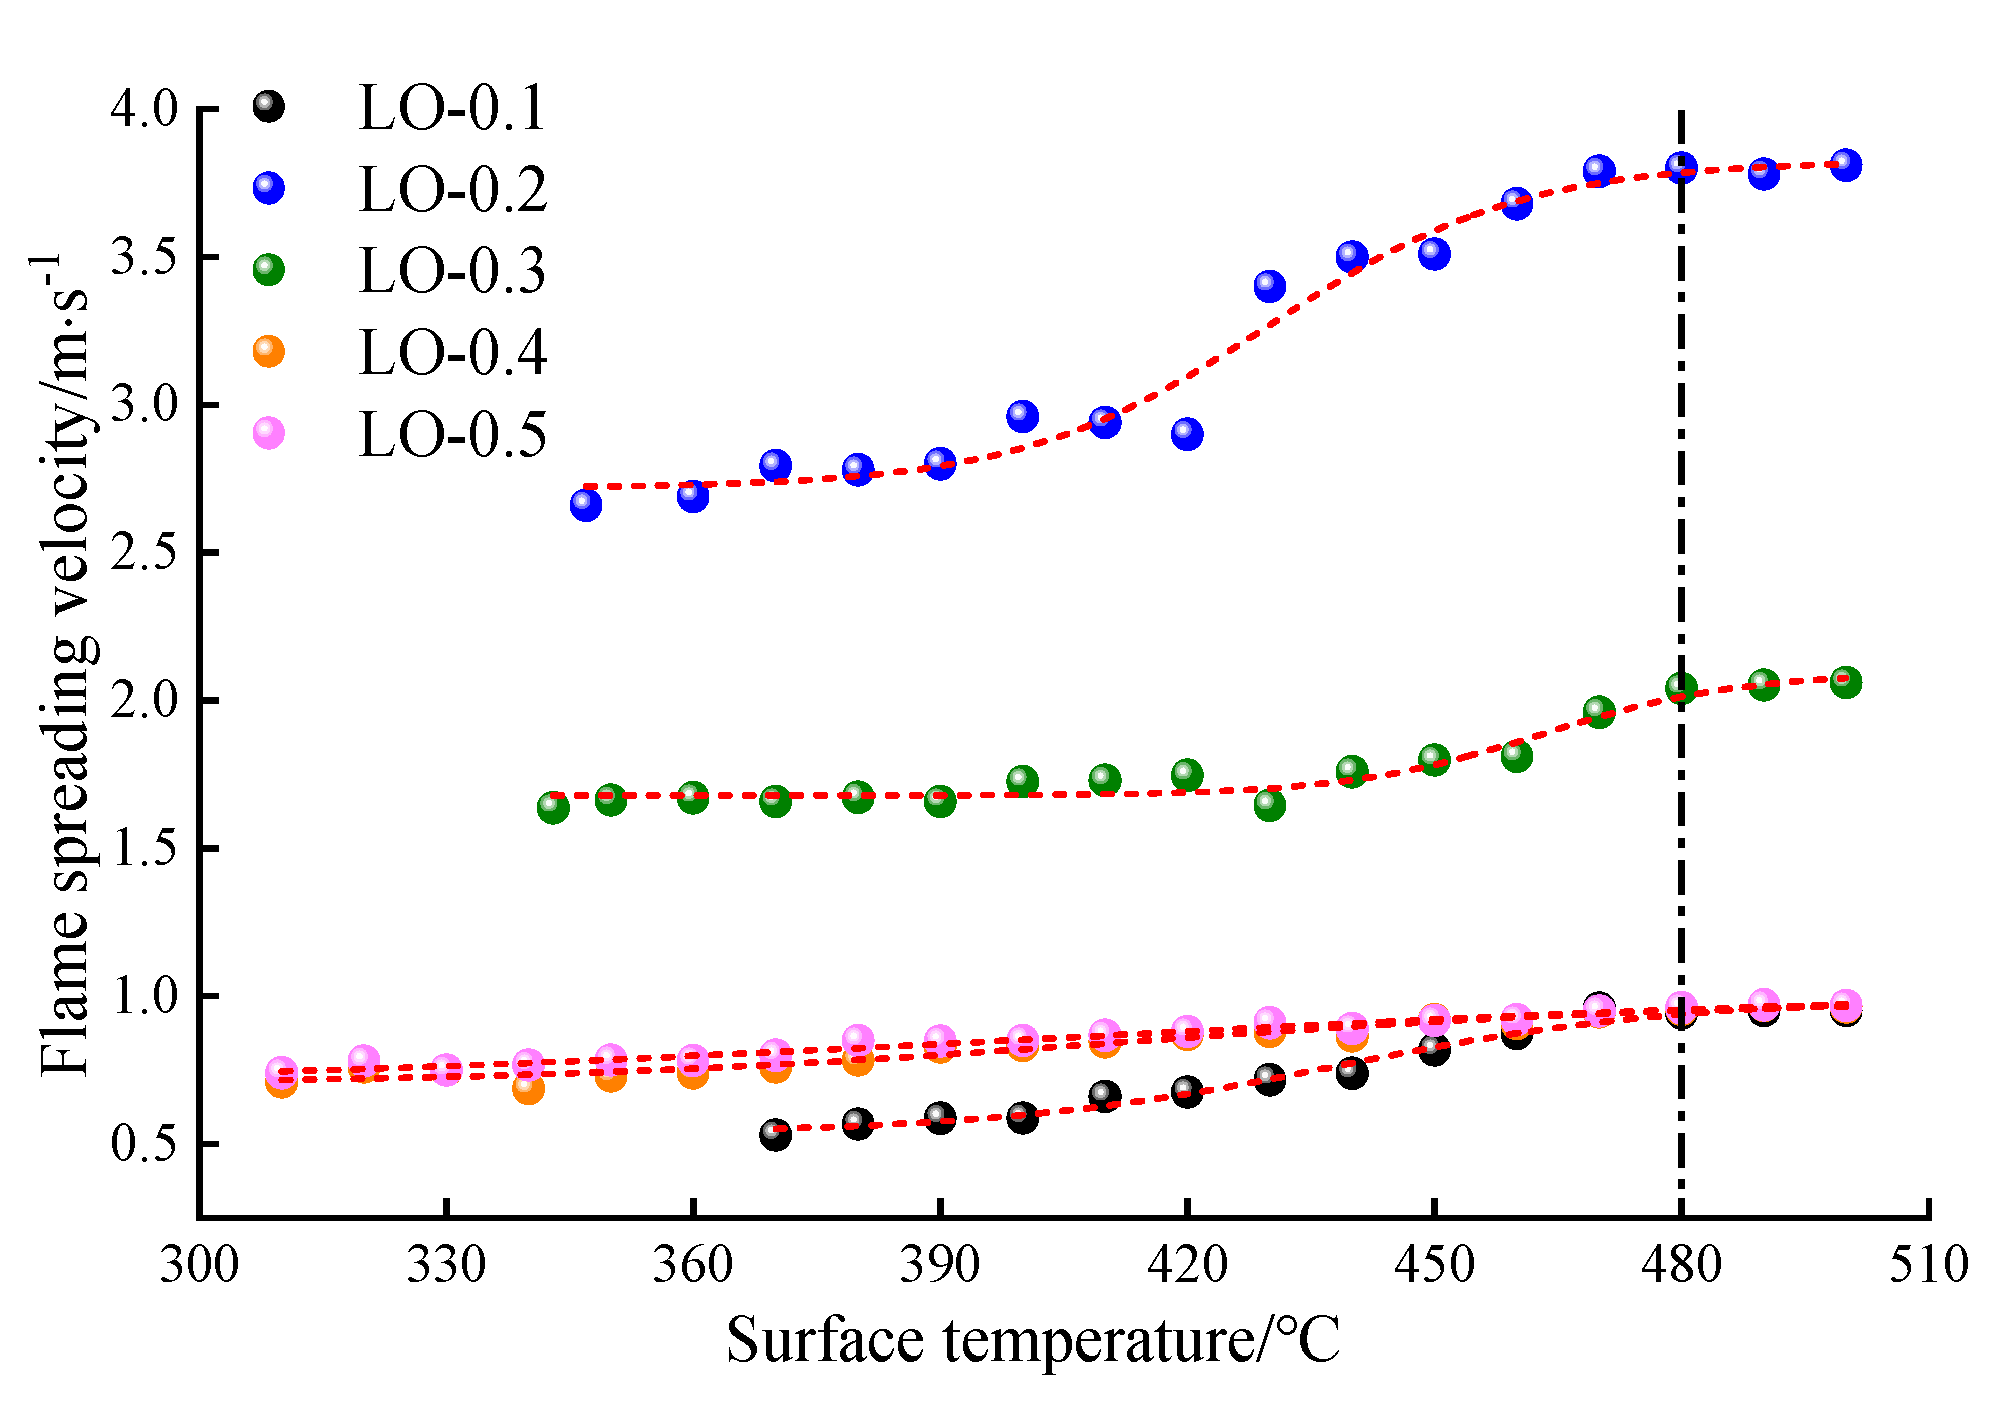
This paper uses a quantitative analysis method to study the flame propagation velocity. Using the flame propagation velocity formula (Equation (5)) proposed in Section 2.3, the flame propagation velocities at different hot surface temperatures for five oil drops are calculated and shown in Figure 10.
As shown in Figure 10, the hot surface temperature is one of the main factors affecting the flame propagation velocity. Under different oil volumes, the flame propagation velocity increases with the increase in the hot surface temperature. When the hot surface temperature reaches 480 °C, the growth trend of the flame propagation velocity slows down until smooth. Through the function fitting obtained, in a specific temperature range, the flame propagation velocity of the lubricating oil combustion and the hot surface temperature combine to meet the Boltzmann relationship, that is:
H I C = A 1 A 2 1 + e t t 0 / d t + A 2
where A1 and A2 are coefficients.
This is due to the increase in the hot surface temperature, which results in more energy input from the hot surface to the fuel, accelerating the temperature rise of the fuel itself, which in turn increases the initial evaporation rate of the lubricant, increases the kinetic energy of the gas mixture molecules, and increases the rate of chemical reaction in the lubricant combustion process. As a result, the rate of flame propagation increases.
In addition, according to Feoktistov [52], the heat required for producing high-temperature vapor from the droplets is one of the main factors affecting the flame propagation velocity. The variation in high-temperature vapor pressure generated by lubricant droplets with an initial temperature can be calculated from the Clausius–Clapeyron equation [53,54].
ln P δ = Δ v a p h m R T 2 + C
where Pδ is the saturated vapor pressure; T is the two-phase equilibrium temperature; ∆vaphm is the value of the change in enthalpy during the phase transition; R is the universal gas constant; C is a constant.
The above equation elucidates the relationship between the increased saturated vapor pressure and rising hot surface temperatures. Due to the fact that the energy required to produce high-temperature vapor from a lubricant droplet is significantly greater than that needed to reach its flash point, an increase in hot surface temperature reduces the time required for the lubricant to reach its flash point. As the hot surface temperature increases, the heat transferred to the lubricant droplets elevates their temperature and vapor pressure, enhancing the evaporation process and resulting in a higher concentration of high-temperature vapors above the hot plate, accelerating the flame propagation. However, as the distance between the vapor and the hot plate increases, the fuel vapor concentration diminishes and becomes non-uniform. When the hot surface temperature reaches a certain temperature and continues to rise, the hot surface temperature only acts on changing the position of the stoichiometric concentration point and will not affect the flame propagation velocity. Therefore, when the hot surface temperature surpasses 480 °C, the flame propagation velocity tends to be stable.
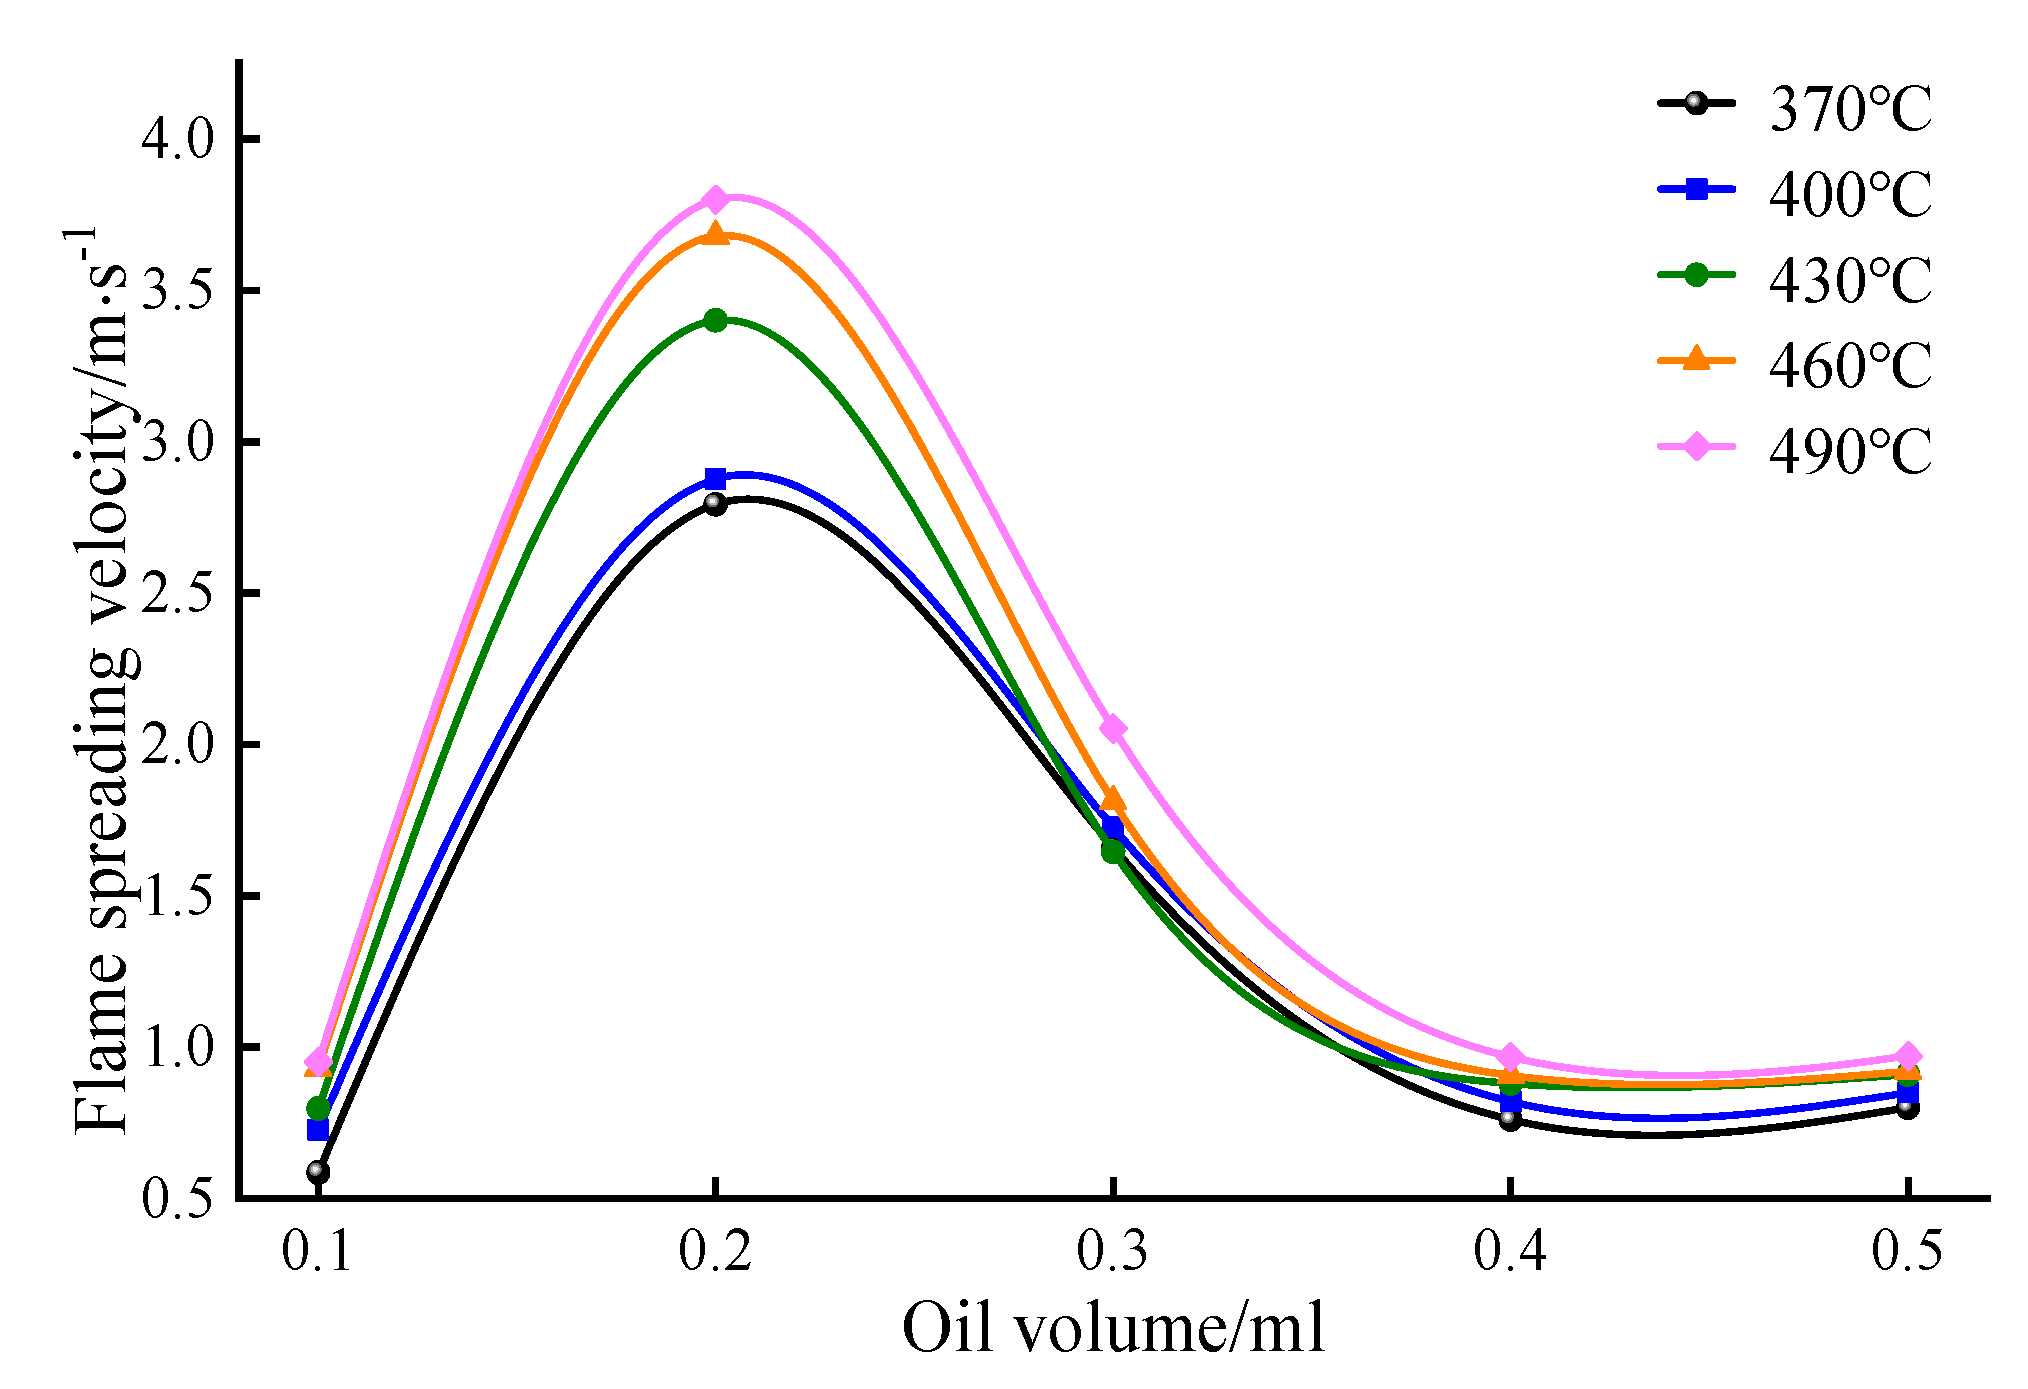
From the results depicted in Figure 10, the flame propagation velocities are as follows: LO-0.1 (0.1 mL oil volume) ranges from 0.59 to 0.95 m/s; LO-0.2 (0.2 mL oil volume) ranges from 2.66 to 3.81 m/s; LO-0.3 (0.3 mL oil volume) ranges from 1.64 to 2.06 m/s; and LO-0.4 (0.4 mL oil volume) and LO-0.5 (0.5 mL oil volume) are similar, ranging from 0.76 to 0.97 m/s and 0.80 to 0.97 m/s, respectively. In order to further analyze the flame propagation velocities under different oil volumes, the relationship between the flame propagation velocity and the oil volume is drawn, as shown in Figure 11.
It can be seen from Figure 11 that the maximum flame propagation velocity occurs with an oil volume of 0.2 m. As the lubricant oil volume increases from 0.1 mL to 0.2 mL, the flame propagation velocity rises rapidly, reaching a maximum of 3.82 m/s at 490 °C. With further increases in the oil volume, the flame propagation velocity begins to decline. At oil volumes of 0.3 to 0.5 mL, the flame propagation velocity stabilizes between 1.06 and 2.05 m/s. This phenomenon is attributed to the experimental conditions in a confined laboratory space, which limits the air volume around the hot surface and avoids the effects of air convection and wind velocity. At 0.2 mL oil volume, the air volume around the hot surface is closest to the theoretical amount for the combustible gas mixture, providing an optimal concentration of activated molecules (e.g., H, OH) that enhances the chemical reaction rate and flame propagation velocity. In contrast, at 0.1 mL, the mixture is fuel-rich (excess air coefficient α < 1), while at 0.3 to 0.5 mL, the mixture is fuel-poor (excess air coefficient α > 1). Excessive or insufficient air affects the combustion temperature and reduces the flame propagation velocity.
In addition, the flame propagation velocity is also closely related to the vapor pressure change in the combustible mixture during the combustion process [55]. The amount of oil at the same temperature affects the vapor concentration, which in turn affects the pressure change so that the pressure change will affect the flame propagation velocity. According to Lewis, the vapor pressure of the combustible mixture and the flame propagation velocity is expressed as:
v L P m m = n / 2 1
where m is the Lewis pressure index; n is the number of combustion reaction stages.
From the above formula, when the flame propagation velocity is low (vL < 0.5 m/s), the corresponding combustion reaction level n < 2, Lewis pressure index m < 0, when the flame propagation velocity decreases with the pressure increase. When 0.5 m/s < vL < 1.0 m/s, the number of reaction stages n = 2, the Lewis pressure index m = 0, and the flame propagation velocity is independent of the pressure change. When vL > 1.0 m/s, the number of reaction stages n > 2, and the Lewis pressure index m > 0, the flame propagation velocity increases with the pressure increase. In the hot surface ignition test of LO in this paper, when the oil volume is 0.1 mL, 0.4 mL, and 0.5 mL, the flame propagation velocity is in the range of 0.5–1.0 m/s, the lubricating oil undergoes a second-stage combustion reaction, and the flame propagation velocity is independent of the pressure. Its main influencing factor is the amount of air in the combustible mixture. When the oil volume is 0.2 mL, the flame propagation velocity is 2.79~3.83 m/s. The LO is fully combusted, the corresponding combustion reaction level n is greater than 2, and the flame propagation velocity is affected by the pressure and air in the combustible mixture.

5.3. Flame Temperature

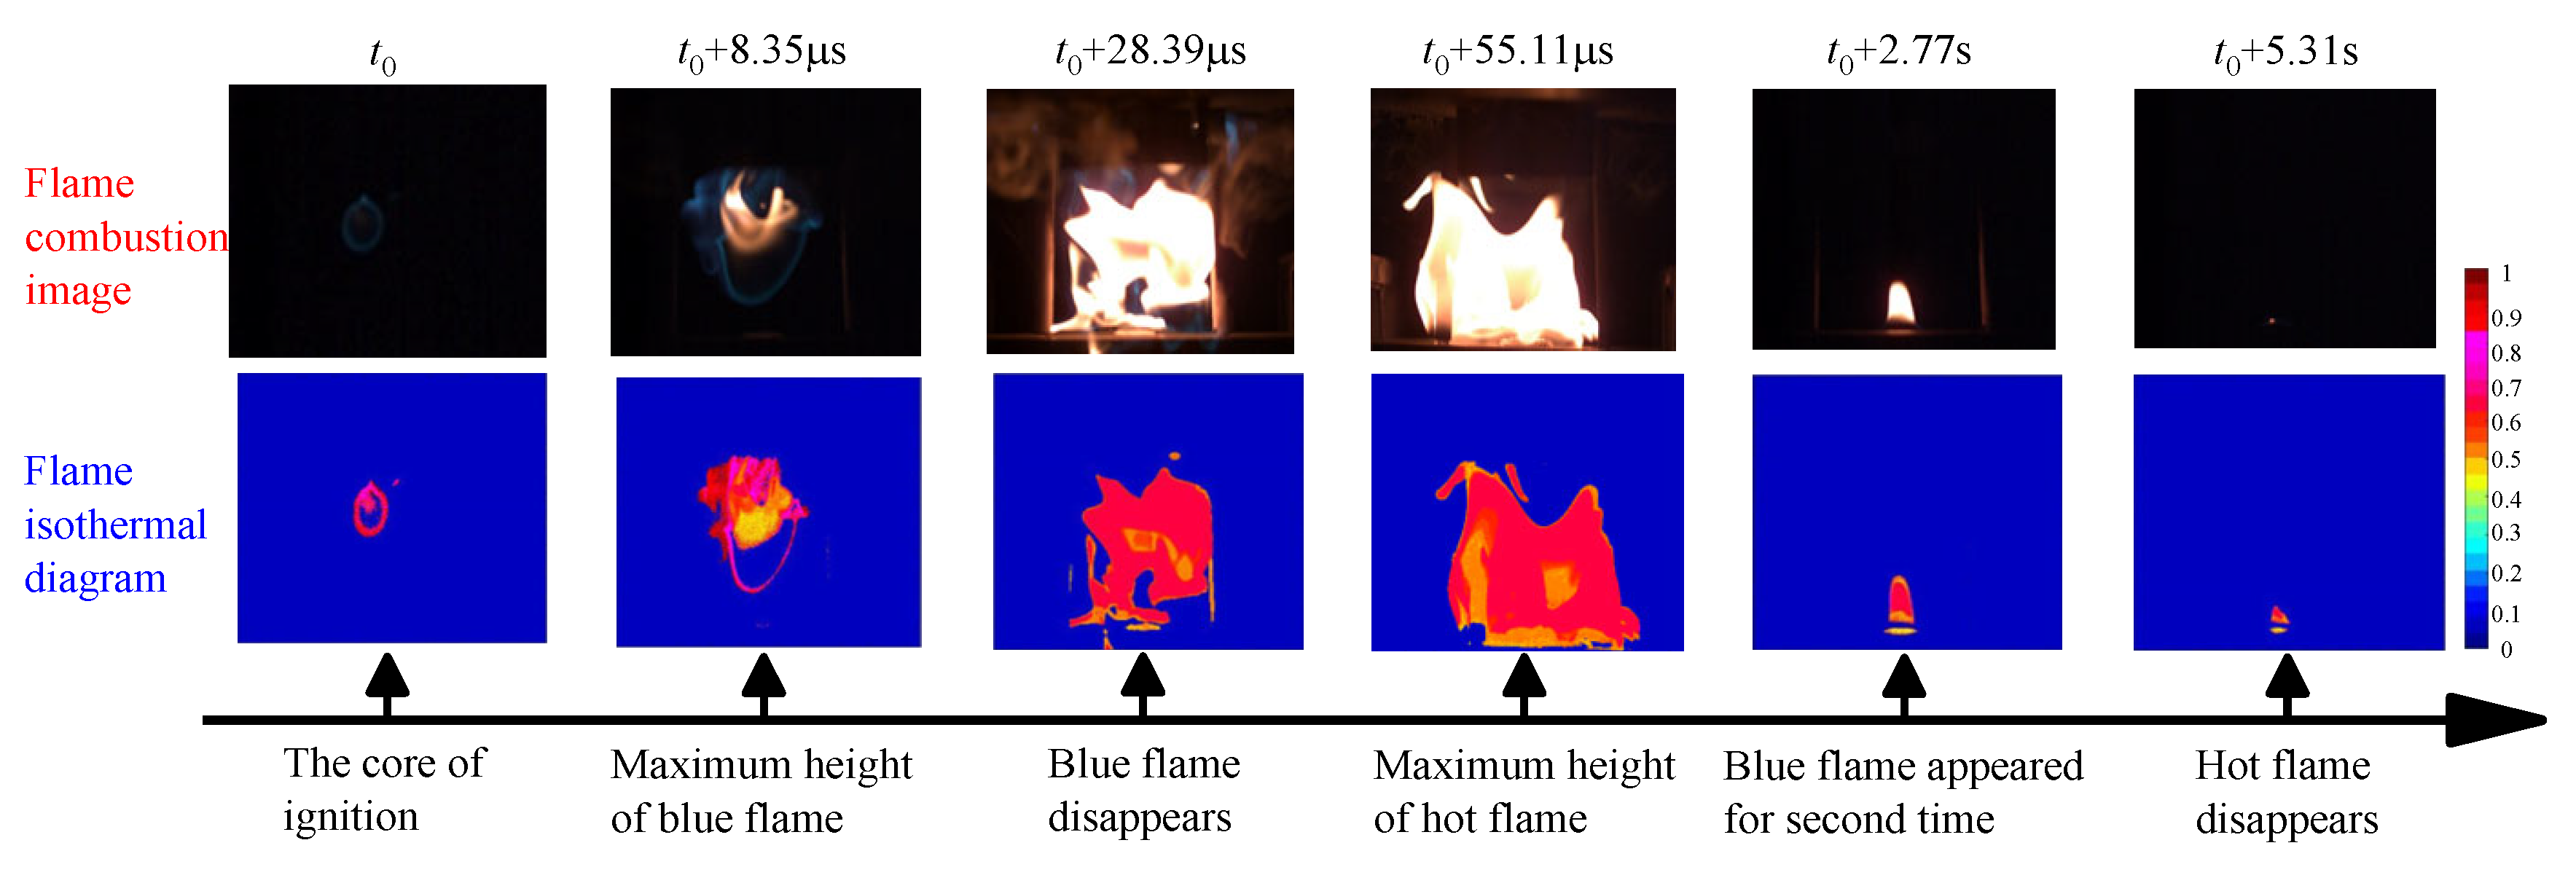
In the flame combustion process, the transformation of the flame structure often stems from the mixture concentration and mixture vapor pressure together. Select the flame image at the moment of flame transformation, analyze the temperature change and the reason for the structural transformation, and better understand the flame combustion process. From the analysis of the above results, it can be seen that when the amount of lubricant oil is 0.2 mL, the height of the hot flame is close to the height of the oil pipe, and the flame propagation velocity is the largest, so it is more dangerous. Therefore, this section selected a hot surface temperature of 370 °C and an oil volume of 0.2 mL when the flame propagation image was in a representative six images to analyze the change rules in the flame temperature. The flame combustion image and its corresponding flame isothermal map are shown in Figure 12.
As illustrated in Figure 12, the flame temperature is closely related to the flame progression during the combustion process. At the initial stage of LO combustion (t0), the flame manifests as a blue spherical flame above the hot surface, characterized by weak brightness, uniform color, and high transparency. This phenomenon is attributed to the LO composition containing stable hydrocarbons such as olefins and aromatic hydrocarbons. There are few components that carry out the degradation branched chain reaction, and the branched chain reaction pathway formed is [56]:
HCHO → HCO → CO
CH2O → HCO → H2O → H2O2 → OH
At this stage, the average temperature of the blue flame is 732.7 °C, and the ignition core forms above the hot surface, indicating incomplete combustion of the lubricant. During the pre-combustion phase (t0 + 8.35 μs), the flame develops a dual-layer structure comprising an inner blue flame and an outer hot flame. The inner blue flame exhibits a lower temperature than the outer hot flame, and the height of the blue flame reaches its maximum. This occurs because the mixture diffuses slowly while the combustion reaction proceeds rapidly, thinning the flame boundary and raising the average temperature to 762.79 °C. As combustion progresses (t0 + 28.39 μs), explosive combustion of hot carbon particles generates a yellow-white flame with an average temperature of 1346.5 °C. The high-temperature carbon particles contribute to a reduction in or even disappearance of the incomplete combustion zone (blue flame area). When the hot flame area reaches its maximum (t0 + 55.11 μs), the average flame temperature peaks at 1540.3 °C, indicating complete combustion and maximum hot flame height. As the fuel vapor volume decreases (t0 + 2.77 s), the flame begins to retract, revealing a blue flame again with a temperature of 986.9 °C. As the air coefficient increases (t0 + 5.31 s), the tip of the hot flame gradually diminishes, with the flame height decreasing and color fading until the hot flame completely disappears, leaving only a tiny blue flame with an average temperature of 621.6 °C.
The analysis of flame temperature trends reveals an overall increase followed by a decrease. The flame temperature increases during maximum blue and hot flame heights, indicating a more dangerous combustion phase. Based on this analysis, five lubricant oil volumes were evaluated for their impact on the flame temperature, as shown in Figure 13.
Figure 13a presents the maximum height of the blue flame and its corresponding isothermal map for the five lubricant oil volumes. The average temperatures are 735.54 °C for LO-0.1-1, 762.79 °C for LO-0.2-1, 829.32 °C for LO-0.3-3, 895.64 °C for LO-0.4-7, and 954.73 °C for LO-0.5-5. When the blue flame height is the highest, the average flame temperatures increase with the oil volume, though their differences are relatively small. The length of the blue flame’s existence does not show a significant correlation with the average flame temperature, with durations between 0.025 and 0.051 s, while 91.46% of the durations fall within 0.03 to 0.04 s.
Figure 13b illustrates that at the maximum height of the thermal flame, the average flame temperatures for LO-0.1-1, LO-0.2-1, LO-0.3-3, LO-0.4-7, and LO-0.5-5 are 1390 °C, 1540 °C, 1580 °C, 1620 °C, and 1640 °C, respectively. This shows a positive correlation between oil volume and average flame temperature. Notably, at an oil volume of 0.2 mL (LO-0.2-1), the increase in flame temperature is substantial, heightening the risk of automotive fires.
The results of the above experimental analysis show that the temperature of the flame when it reaches the maximum value of the hot flame height is much higher than that of the maximum value of the blue flame height, and the flame combustion time accounts for about 40% of the total combustion time. It is known through the theory of combustion science that when a blue flame exists, it is an incomplete combustion reaction. The energy in the system comes from its accumulation, and its flame temperature is relatively low [57]. Subsequently, when the concentration of active molecules gradually increases, the chemical reaction rate of the system is promoted to form an explosive combustion. At the same time, a large amount of thermal energy is released, and the explosive combustion of the hot carbon particles shows a bright, hot flame. The energy release is equivalent to 85% to 95% of the total chemical energy of the fuel, and the temperature of the hot flame is much higher than the temperature of the blue flame. Representative samples of the above chemical reactions include:
CH 2 O 2 CO + H 2 O + OH
C 2 H 5 O + 2 O 2 2 CO + 2 H 2 O + OH
RH + OH R + H 2 O
R = CH 3

6. Conclusions

This study investigates the flame combustion characteristics of LO during hot surface ignition through a series of tests with the oil volume. The primary conclusions drawn from the research are as follows:
  • The lowest ignition temperature and the highest ignition temperature of the hot surface are significantly negatively correlated with the oil volume. As the oil quantity increases from 0.1 mL to 0.5 mL, the minimum ignition temperature decreases from 370 °C to 312 °C, and the maximum ignition temperature decreases from 415 °C to 355 °C. This indicates an increased risk of ignition on the hot surface with higher oil quantities. The combustion process of LO on the hot surface can be categorized into five stages: formation of the ignition core with blue flame; a dual-structure flame with the blue flame enveloping the hot flame; development of a yellowish-white hot flame; a secondary dual-structure flame with a small blue flame at the base of the hot flame; a final stage with a small area of blue flame.
  • The ignition core height is positively correlated with the hot surface temperature, and the ignition core height difference in the LO with a different oil volume is small. The maximum height of the hot flame is less affected by the initial hot surface temperature, but it is significantly positively correlated with the oil volume. At the oil volume of 0.2 mL (LO-0.2), the maximum hot flame height is 79.5 mm, close to the 80 mm distance between the oil pipe and the hot surface, posing a direct risk to fuel line safety. When the oil volume exceeds 0.3 mL (LO-0.3), the hot flame height surpasses 80 mm, further elevating the potential risk of automobile fires.
  • The flame propagation velocity increases with the increase in the hot surface temperature and adheres to the Boltzmann relationship. The flame propagation velocity is the highest among the tested oil volumes, with an oil volume of 0.2 mL. At this volume, the air around the hot surface is closest to the theoretical air volume mixed with the combustible gas mixture according to chemical equivalence ratios, resulting in a high concentration of activated molecules. This enhances the chemical reaction rate of the lubricating oil and accelerates the flame propagation velocity.
  • During the flame combustion, the flame temperature generally shows a trend of increasing first and then decreasing. At the peaks of the blue and hot flame heights, the flame area is the largest, and the average flame temperature is relatively high, indicating greater danger. The average flame temperature increases with the oil volume at the maximum height of the blue flame, although the difference is relatively small. Conversely, the average flame temperature rises at the maximum hot flame height with the increased oil volume. Notably, at the oil volume of 0.2 mL, the increment in the average flame temperature is the largest, intensifying the fire risk in automotive applications.

Author Contributions

Conceptualization, L.B.; methodology, L.B. and F.C.; software, F.C. and Y.D.; validation, L.B. and F.C.; formal analysis, L.B.; investigation, L.B.; resources, F.C.; data curation, L.B. and Y.D.; writing—original draft preparation, L.B.; writing—review and editing, L.B. and F.C.; visualization, Y.D.; supervision, L.B.; project administration, L.B.; funding acquisition, F.C. All authors have read and agreed to the published version of the manuscript.

Funding

This research was funded by National Natural Science Foundations of China grant number [52104214], and Shaanxi Provincial Engineering Center after the subsidy project grant number [2024ZG-GCZH-21]. The APC was funded by the National Natural Science Foundations of China.

Data Availability Statement

The data of this study are available from the corresponding author upon reasonable request.

Conflicts of Interest

The authors declare no conflicts of interest.

References

  1. Deng, J.; Yang, W.; Zhang, Y.; Chen, J.; Li, Y.; Ji, X.; Shu, C. Experimental study on hot surface ignition and flame characteristic parameters of lubricating oil. J. Therm. Anal. Calorim. 2024, 149, 10213–10225. [Google Scholar] [CrossRef]
  2. Colwell, J.; Reza, A. Hot surface ignition of automotive and aviation fluids. Fire Technol. 2005, 41, 105–123. [Google Scholar] [CrossRef]
  3. Arndt, S.; Stevens, D.; Arndt, M. The motor vehicle in the post-crash environment, an understanding of ignition properties of spilled fuels. SAE Trans. 1999, 108, 116–128. [Google Scholar]
  4. Davis, S.; Kelly, S.; Somandepalli, V. Hot surface ignition of performance fuels. Fire Technol. 2010, 46, 363–374. [Google Scholar] [CrossRef]
  5. Li, Y.; Wang, Y.; Lu, S. Ignition process of leaked fuel on horizontal heated surface. Fire Saf. J. 2010, 45, 160–164. [Google Scholar] [CrossRef]
  6. Wang, Z.; Zhang, D.; Fang, Y.; Song, M.; Gong, Z.; Feng, L. Experimental and numerical investigation of the auto-ignition characteristics of cylinder oil droplets under low-speed two-stroke natural gas engines in-cylinder conditions. Fuel 2022, 329, 125498–125512. [Google Scholar] [CrossRef]
  7. Ebrahim, M.; Elkenani, B.; Ortega, A. Transient surface temperatures upon the impact of a single droplet onto a heated surface in the film evaporation regime. Int. J. Heat Mass Transf. 2022, 186, 122463–122495. [Google Scholar] [CrossRef]
  8. Lv, X.; Yao, S.; Du, M. Analysis of inerting index when inerting capability of aircraft fuel tank was degraded. J. Aerosp. Power 2023, 38, 1067–1074. [Google Scholar]
  9. Jeff, C.; Kaushik, B. Steady-state and transient motor vehicle exhaust system temperatures. SAE Int. J. Passeng. Cars-Mech. Syst. 2009, 2, 206–218. [Google Scholar]
  10. Boeck, L.; Melguizo, G.; Shepherd, J. Hot surface ignition dynamics in premixed hydrogen—Air near the lean flammability limit. Combust. Flame 2019, 210, 467–478. [Google Scholar] [CrossRef]
  11. Wu, Z.; Wang, Z.; Li, R.; Li, K.; Hua, M.; Pan, X.; Wang, S.; Jiang, J. Study on the effect of ignition mode on overpressure of underexpanded hydrogen jet explosion. CIESC J. 2023, 74, 1409–1418. [Google Scholar]
  12. Tang, W.; Bahrami, D.; Yuan, L.; Thomas, R.; Soles, J. Hot surface ignition of liquid fuels under ventilation. Min. Metall. Explor. 2022, 39, 961–968. [Google Scholar] [CrossRef] [PubMed]
  13. Yi, P.; Long, W.; Feng, L.; Chen, L.; Cui, J.; Gong, W. Investigation of evaporation and auto-ignition of isolated lubricating oil droplets in natural gas engine in-cylinder conditions. Fuel 2019, 235, 1172–1183. [Google Scholar] [CrossRef]
  14. Shaw, A.; Weckman, B. Evaluation of the ignition of diesel fuels on hot surfaces. Fire Technol. 2010, 46, 407–423. [Google Scholar] [CrossRef]
  15. Babrauskas, V. Ignition of gases, vapors, and liquids by hot surfaces. Fire Technol. 2022, 58, 281–310. [Google Scholar] [CrossRef]
  16. Orlova, E.; Glushkov, D.; Abedtazehabadi, A.; Belyaev, S.; Feoktistov, D. Influence of the texture configuration of heating surfaces created by laser irradiation on the ignition and combustion characteristics of liquid fuels. Appl. Sci. 2023, 13, 95. [Google Scholar] [CrossRef]
  17. Psarros, E.; Polykrati, A.; Karagiannopoulos, C.; Bourkas, P. A model for calculating the temperature of aluminium particles ejected from overhead low-voltage lines owing to a short-circuit. Int. J. Wildland Fire 2009, 18, 722–726. [Google Scholar] [CrossRef]
  18. Feoktistov, D.; Glushkov, D.; Kuznetsov, G.; Nikitin, D.; Orlova, E.; Paushkina, K. Ignition and combustion characteristics of coal-water-oil slurry placed on modified metal surface at mixed heat transfer. Fuel Process. Technol. 2022, 233, 107291–107303. [Google Scholar] [CrossRef]
  19. Qi, Y.; Fei, S.; Wang, Z. Explosion mechanism of lubricating oil droplets in high-temperature and high-pressure combustion environments. Lubricants 2023, 11, 118. [Google Scholar] [CrossRef]
  20. Shlegel, N.; Strizhak, P. Regime maps of collisions of fuel oil/water emulsion droplets with solid heated surface. Fuel 2023, 342, 127734–127744. [Google Scholar] [CrossRef]
  21. Fei, S.; Qi, Y.L.; Liu, W.; Wang, Y.; Wang, Z.; Zhang, H. Combustion modes induced by oil-droplet gas-phase pre-ignition in the chamber under different environmental conditions. Combust. Sci. Technol. 2023, 195, 379–397. [Google Scholar] [CrossRef]
  22. Tao, C.; Miao, K.; Tang, F.; Qian, Y.; Zhang, Y.; Meng, S. Evaporation and combustion characteristics for a droplet of lubricating oil and gasoline. Int. Commun. Heat Mass Transf. 2021, 127, 105513–105520. [Google Scholar] [CrossRef]
  23. Chen, J.; Wang, Z.; Zhang, Y.; Li, Y.; Tam, W.; Kong, D.; Deng, J. New insights into the ignition characteristics of liquid fuels on hot surfaces based on TG-FTIR. Appl. Energy 2024, 360, 122827. [Google Scholar] [CrossRef]
  24. Yang, W.; Zhang, Y.; Deng, J.; Chen, J.; Ji, X.; Wu, H.; Zhao, J. Experimental study on combustion characteristics of electrolyte pool fire. J. Energy Storage 2024, 93, 112214. [Google Scholar] [CrossRef]
  25. Cui, Y.; Fang, Q. Experimental discussion on fire image recognition based on feature extraction. J. Phys. Conf. Ser. 2021, 2066, 21086–21094. [Google Scholar] [CrossRef]
  26. De, S.; Bhattacharya, A.; Mukhopadhyay, A.; Sen, S. Early detection of lean blowout in a combustor using symbolic analysis of colour images. Measurement 2021, 186, 110113–110130. [Google Scholar] [CrossRef]
  27. Chen, J.; He, Y.; Wang, J. Multi-feature fusion based fast video flame detection. Build. Environ. 2010, 45, 1113–1122. [Google Scholar] [CrossRef]
  28. Hu, A. Color features description and extraction of flame image segmented region of early fire in large space. Adv. Mater. Res. 2013, 706, 1862–1865. [Google Scholar] [CrossRef]
  29. Xie, K.; Cui, Y.; Wang, C.; Cui, G.; Wang, G.; Qiu, X. Study on threshold selection method of continuous flame images of spray combustion in the low-pressure chamber. Case Stud. Therm. Eng. 2021, 26, 101195–102103. [Google Scholar] [CrossRef]
  30. Guo, X.; Zhang, L.; Xing, Y. Study on analytical noise propagation in convolutional neural network methods used in computed tomography imaging. Nucl. Sci. Tech. 2022, 33, 116–129. [Google Scholar] [CrossRef]
  31. Chen, Y.; Fan, Y.; Han, Q.; Bai, X. Study on ignition process and flame expansion and propagation characteristics in jet-cooled pilot flameholders using image processing techniques. Aerosp. Sci. Technol. 2022, 129, 107807–107818. [Google Scholar] [CrossRef]
  32. Patcharaporn, W.; Makiko, T.; Akio, U.; Mohammad, H.; Isao, Y.; Hidetoshi, O. Isolation and characterization of novel strains of pseudomonas aeruginosa and serratia marcescens possessing high efficiency to degrade gasoline, kerosene, diesel oil, and lubricating oil. Curr. Microbiol. 2004, 49, 415–422. [Google Scholar]
  33. Wang, Z.; Chen, J.; Yu, Y.; Kong, D. Experimental study on the ignition and burning characteristics of liquid fuels on hot surfaces. Process Saf. Environ. Prot. 2023, 176, 725–733. [Google Scholar] [CrossRef]
  34. Pejman, N.; Ehsan, H.; Mehdi, A.; Pilva, S. Experimental investigation on premixed flame of H2/CO in a slot burner using the Mach-Zehnder interferometry. Opt. Laser. Technol. 2019, 115, 140–148. [Google Scholar]
  35. Shang, J.; Gan, Z.; Li, J. Effects of pressure on soot formation in laminar coflow kerosene diffusion flames at pressures between 1 and 20 atm. J. Therm. Anal. Calorim. 2024, 149, 4733–4753. [Google Scholar] [CrossRef]
  36. Tang, Q.; Shi, H.; Uddeen, K.; Sharma, P.; Yao, M.; Turner, J.W.G.; Magnotti, G. Study of engine knocking combustion using simultaneous high-speed shadowgraph and natural flame luminosity imaging. Appl. Therm. Eng. 2023, 235, 121440. [Google Scholar] [CrossRef]
  37. Seunghyun, J. Effects of CO2 dilution on ignition characteristics in lean premixed H2/Air flames. Int. J. Hydrogen Energy 2024, 84, 265–278. [Google Scholar]
  38. Zhang, X.; Liu, X.; Huang, W.; Hu, J.; Du, Y.; Ge, D.; Sun, X. Gas-flow-rate inversion based on experiments and simulation of flame combustion characteristics in a drilling blowout. Processes 2024, 12, 766. [Google Scholar] [CrossRef]
  39. Pezoa, J.; Arias, L. Data-Driven Models for Predicting the Flame Spectral Behavior in Industrial Combustion Processes; Universidad de Concepción: Concepción, Chile, 2012; Volume 8439, pp. 84391A–84391A-10. [Google Scholar]
  40. Wang, L.; Pan, J.; Wei, H.; Shu, G. Thermal and chemical effects of low-temperature chemistry on flame initiation and propagation. Combust. Flame 2023, 253, 112779. [Google Scholar] [CrossRef]
  41. Walter, V.; Pascal, S.; Patrick, A.; Silas, W.; Kai, H. Experimental study of lube oil pre-ignition in an optical gas engine test rig. Int. J. Engine Res. 2024, 25, 1037–1049. [Google Scholar]
  42. Tormos, B.; Garcia-Oliver, J.M.; Carreres, M.; Moreno-Montagud, C.; Dominguez, B.; Cardenas, M.D. Experimental assessment of ignition characteristics of lubricating oil sprays related to low-speed preignition. Int. J. Engine Res. 2022, 23, 1327–1338. [Google Scholar] [CrossRef]
  43. Shi, Y.X.; Ni, S.J.; Zhao, N.; Wang, W.K.; Cai, Y.X. Effect of aged lubricating oil on the regeneration of diesel particulate filters and ash physical characteristics with non-thermal plasma technology. Int. J. Automot. Technol. 2021, 22, 1189–1200. [Google Scholar]
  44. Espada, J.J.; Coto, B.; Grieken, R.V.; Moreno, J.M. Simulation of pilotplant extraction experiments to reduce the aromatic content from lubricating oils. Chem. Eng. Process. 2007, 47, 1403–1415. [Google Scholar]
  45. Sommer, H.T. Ignition studies of fuel droplet streams. Symp. Combust. 1988, 21, 641–646. [Google Scholar] [CrossRef]
  46. Yehia, O.R.; Reuter, C.B.; Ju, Y. Low-temperature multistage warm diffusion flames. Combust. Flame 2018, 195, 63–74. [Google Scholar] [CrossRef]
  47. Johnson, A.M.; Roth, A.J.; Moussa, N.A. Hot-Surface Ignition Tests of Aircraft Fluids. Final Report, May 1987–May 1988; Boeing Advanced Systems Co.: Seattle, WA, USA, 1988. [Google Scholar]
  48. Yamamoto, A.; Oshibe, H.; Nakamura, H.; Tezuka, T.; Hasegawa, S.; Maruta, K. Stabilized three-stage oxidation of gaseous n-heptane/air mixture in a micro flow reactor with a controlled temperature profile. Proc. Combust. Inst. 2011, 33, 3259–3266. [Google Scholar] [CrossRef]
  49. Zhang, T.; Ju, Y. Structures and propagation speeds of autoignition-assisted premixed n-heptane/air cool and warm flames at elevated temperatures and pressures. Combust. Flame 2020, 211, 8–17. [Google Scholar] [CrossRef]
  50. Yuan, L. Ignition of hydraulic fluid sprays by open flames and hot surfaces. J. Loss Prev. Process Ind. 2005, 19, 353–361. [Google Scholar] [CrossRef]
  51. Liu, H.; Wang, J.; Duan, H.; Jia, M.; Zhang, Y. Experimental study on the boiling criterion of the fuel film formed from spray/wall impingement. Exp. Fluids 2019, 60, 179. [Google Scholar] [CrossRef]
  52. Feoktistov, D.; Glushkov, D.; Kuznetsov, G.; Orlova, E.; Paushkinaet, K. Ignition and combustion enhancement of composite fuel in conditions of droplets dispersion during conductive heating on steel surfaces with different roughness parameters. Fuel 2022, 314, 122745. [Google Scholar] [CrossRef]
  53. Yi, P.; Long, W.; Feng, L.; Wang, W.; Liu, C. An experimental and numerical study of the evaporation and pyrolysis characteristics of lubricating oil droplets in the natural gas engine conditions. Int. J. Heat Mass Tranf. 2016, 103, 646–660. [Google Scholar] [CrossRef]
  54. Zhu, F.; Li, K. Numerical Modeling of Heat and Moisture Through Wet Cotton Fabric Using the Method of Chemical Thermodynamic Law Under Simulated Fire. Fire Technol. 2011, 47, 801–819. [Google Scholar] [CrossRef]
  55. John, G.; Benjamin, L.; Brian, G. Experimental study of high compression ratio spark ignition with ethanol, ethanol–water blends, and methanol. Fuel 2024, 375, 132528. [Google Scholar]
  56. Zhang, T.; Ju, Y. Propagation speeds and kinetic analysis of premixed hep tane/air cool and warm flames at large ignition. Damköhler numbers. In Proceedings of the 11th US National Combustion Meeting, Pasadena, CA, USA, 24–27 March 2019; pp. 1–4. [Google Scholar]
  57. Peters, G.P.; Andrew, R.M.; Canadell, J.G.; Friedlingstein, P.; Jackson, R.B.; Korsbakken, J.I.; Le Quéré, C.; Peregon, A. Carbon dioxide emissions continue to grow amidst slowly emerging climate policies. Nat. Clim. Change 2020, 10, 3–6. [Google Scholar] [CrossRef]
Figure 1. Flame image processing.
Processes 12 02522 g001
Figure 2. Ignition core height (Hic) determination method [34].
Processes 12 02522 g002
Figure 3. Flame combustion height calculation process.
Processes 12 02522 g003
Figure 4. Determination method of the flame propagation velocity.
Processes 12 02522 g004
Figure 5. The experimental platform for the hot surface ignition.
Processes 12 02522 g005
Figure 6. Flow chart of the test.
Processes 12 02522 g006
Figure 7. Image sequence of flame combustion of LO-0.1-1. (a) t0. (b) t0 + 8.35 μs. (c) t0 + 46.76 μs. (d) t0 + 2241.14 μs. (e) t0 + 2408.14 μs.
Processes 12 02522 g007
Figure 8. Relationship between ignition core height and hot surface temperature.
Processes 12 02522 g008
Figure 9. Relationship between the maximum height of the hot flame and the amount of LO.
Processes 12 02522 g009
Figure 10. Relationship between the flame propagation velocity and the hot surface temperature.
Processes 12 02522 g010
Figure 11. Relationship between the flame propagation velocity and oil volume.
Processes 12 02522 g011
Figure 12. Flame combustion images and its corresponding flame isothermograms.
Processes 12 02522 g012
Figure 13. The maximum flame height and its corresponding isothermal diagram. (a) Maximum height of blue flame. (b) Maximum height of hot flame.
Processes 12 02522 g013
Table 1. Mechanical parameters of specimens [42,43,44].
Physical ParametersStandardResults
Kinematic viscosity at 100 °CASTM D44513.420 mm2/s
Kinematic viscosity at 40 °CASTM D44574.190 mm2/s
Flash pointASTM D92234 °C
Boiling temperatureASTM D92232 °C
Surface tensionASTM D9710.03 N/m
Dynamic viscosity (−35 °C)ASTM D52936125 mpa.s
Viscosity indexASTM D2270180
Density (15 °C)ASTM D40520.85 kg/m3
Evaporative lossASTM D580010.16%
Zinc contentASTM D64810.104%
Sulphur contentASTM D8740.78%
Table 2. Hot surface ignition characteristic temperature value.
Oil SamplesOil Volume (mL)Minimum Ignition Temperature Tmin (°C)Maximum Ignition Temperature Tmax (°C)
Test ValueAverage ValueTest ValueAverage Value
LO-0.1-10.1370370415415
LO-0.1-2368416
LO-0.1-3369415
LO-0.1-4370414
LO-0.1-5369415
LO-0.1-6372417
LO-0.1-7371416
LO-0.1-8370414
LO-0.1-9371415
LO-0.1-10368416
LO-0.2-10.2347347390390
LO-0.2-2344388
LO-0.2-3348389
LO-0.2-4346392
LO-0.2-5349392
LO-0.2-6350389
LO-0.2-7347391
LO-0.2-8346390
LO-0.2-9346389
LO-0.2-10348390
LO-0.3-10.3345343385385
LO-0.3-2343384
LO-0.3-3343386
LO-0.3-4342383
LO-0.3-5346388
LO-0.3-6345385
LO-0.3-7340384
LO-0.3-8341383
LO-0.3-9343387
LO-0.3-10343385
LO-0.4-10.4309310360360
LO-0.4-2310359
LO-0.4-3310361
LO-0.4-4312361
LO-0.4-5308358
LO-0.4-6309360
LO-0.4-7310360
LO-0.4-8310361
LO-0.4-9311362
LO-0.4-10312358
LO-0.5-10.5311312355355
LO-0.5-2313356
LO-0.5-3312356
LO-0.5-4311354
LO-0.5-5312355
LO-0.5-6310353
LO-0.5-7313355
LO-0.5-8312355
LO-0.5-9314356
LO-0.5-10312355
Disclaimer/Publisher’s Note: The statements, opinions and data contained in all publications are solely those of the individual author(s) and contributor(s) and not of MDPI and/or the editor(s). MDPI and/or the editor(s) disclaim responsibility for any injury to people or property resulting from any ideas, methods, instructions or products referred to in the content.