
Fault Diagnosis of Aircraft Hydraulic Pipeline Clamps Based on Improved KPCA and WOA–KELM

Abstract
1. Introduction
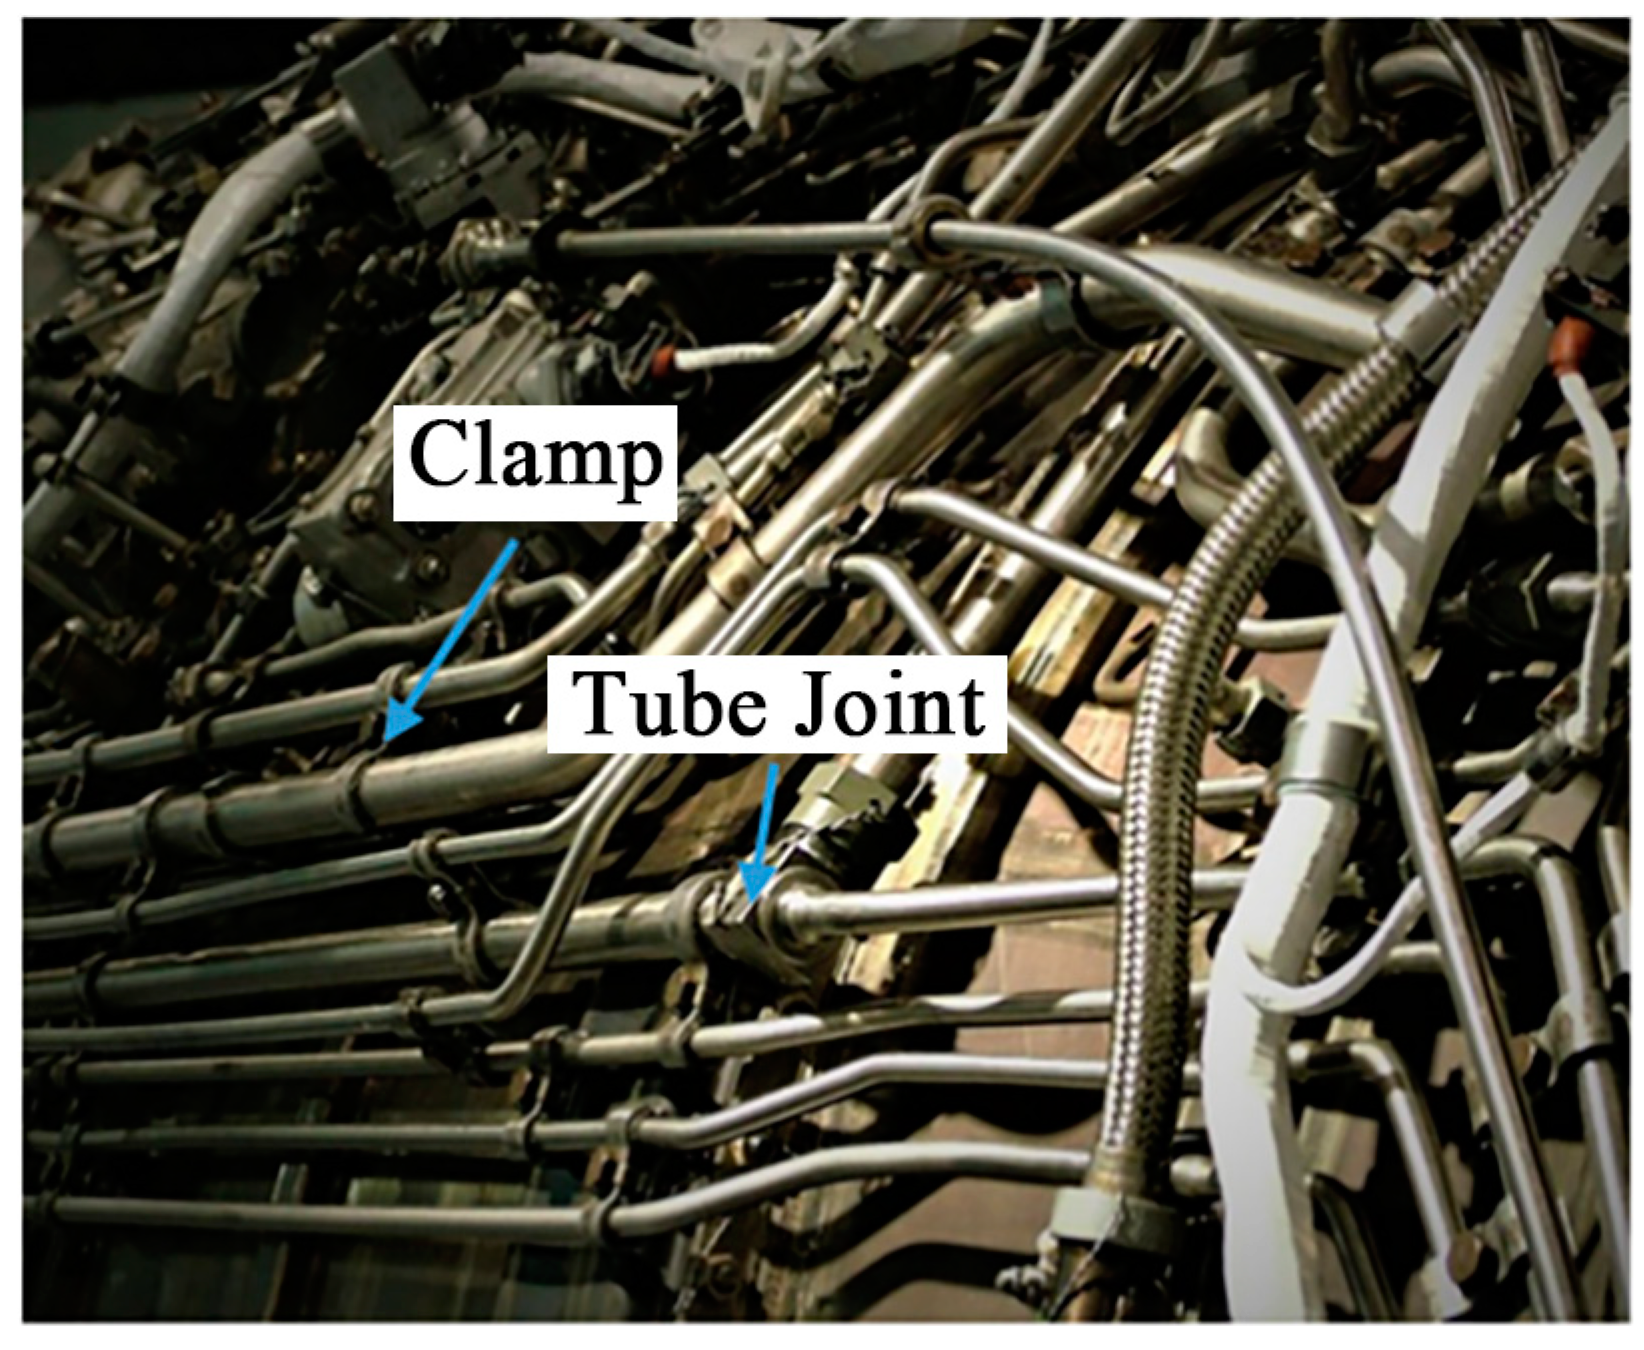
2. Clamp Failure
Hydraulic System and Clamp Failures in Aviation
3. Fault Diagnosis Model
3.1. Improved Kernel Principal Component Analysis
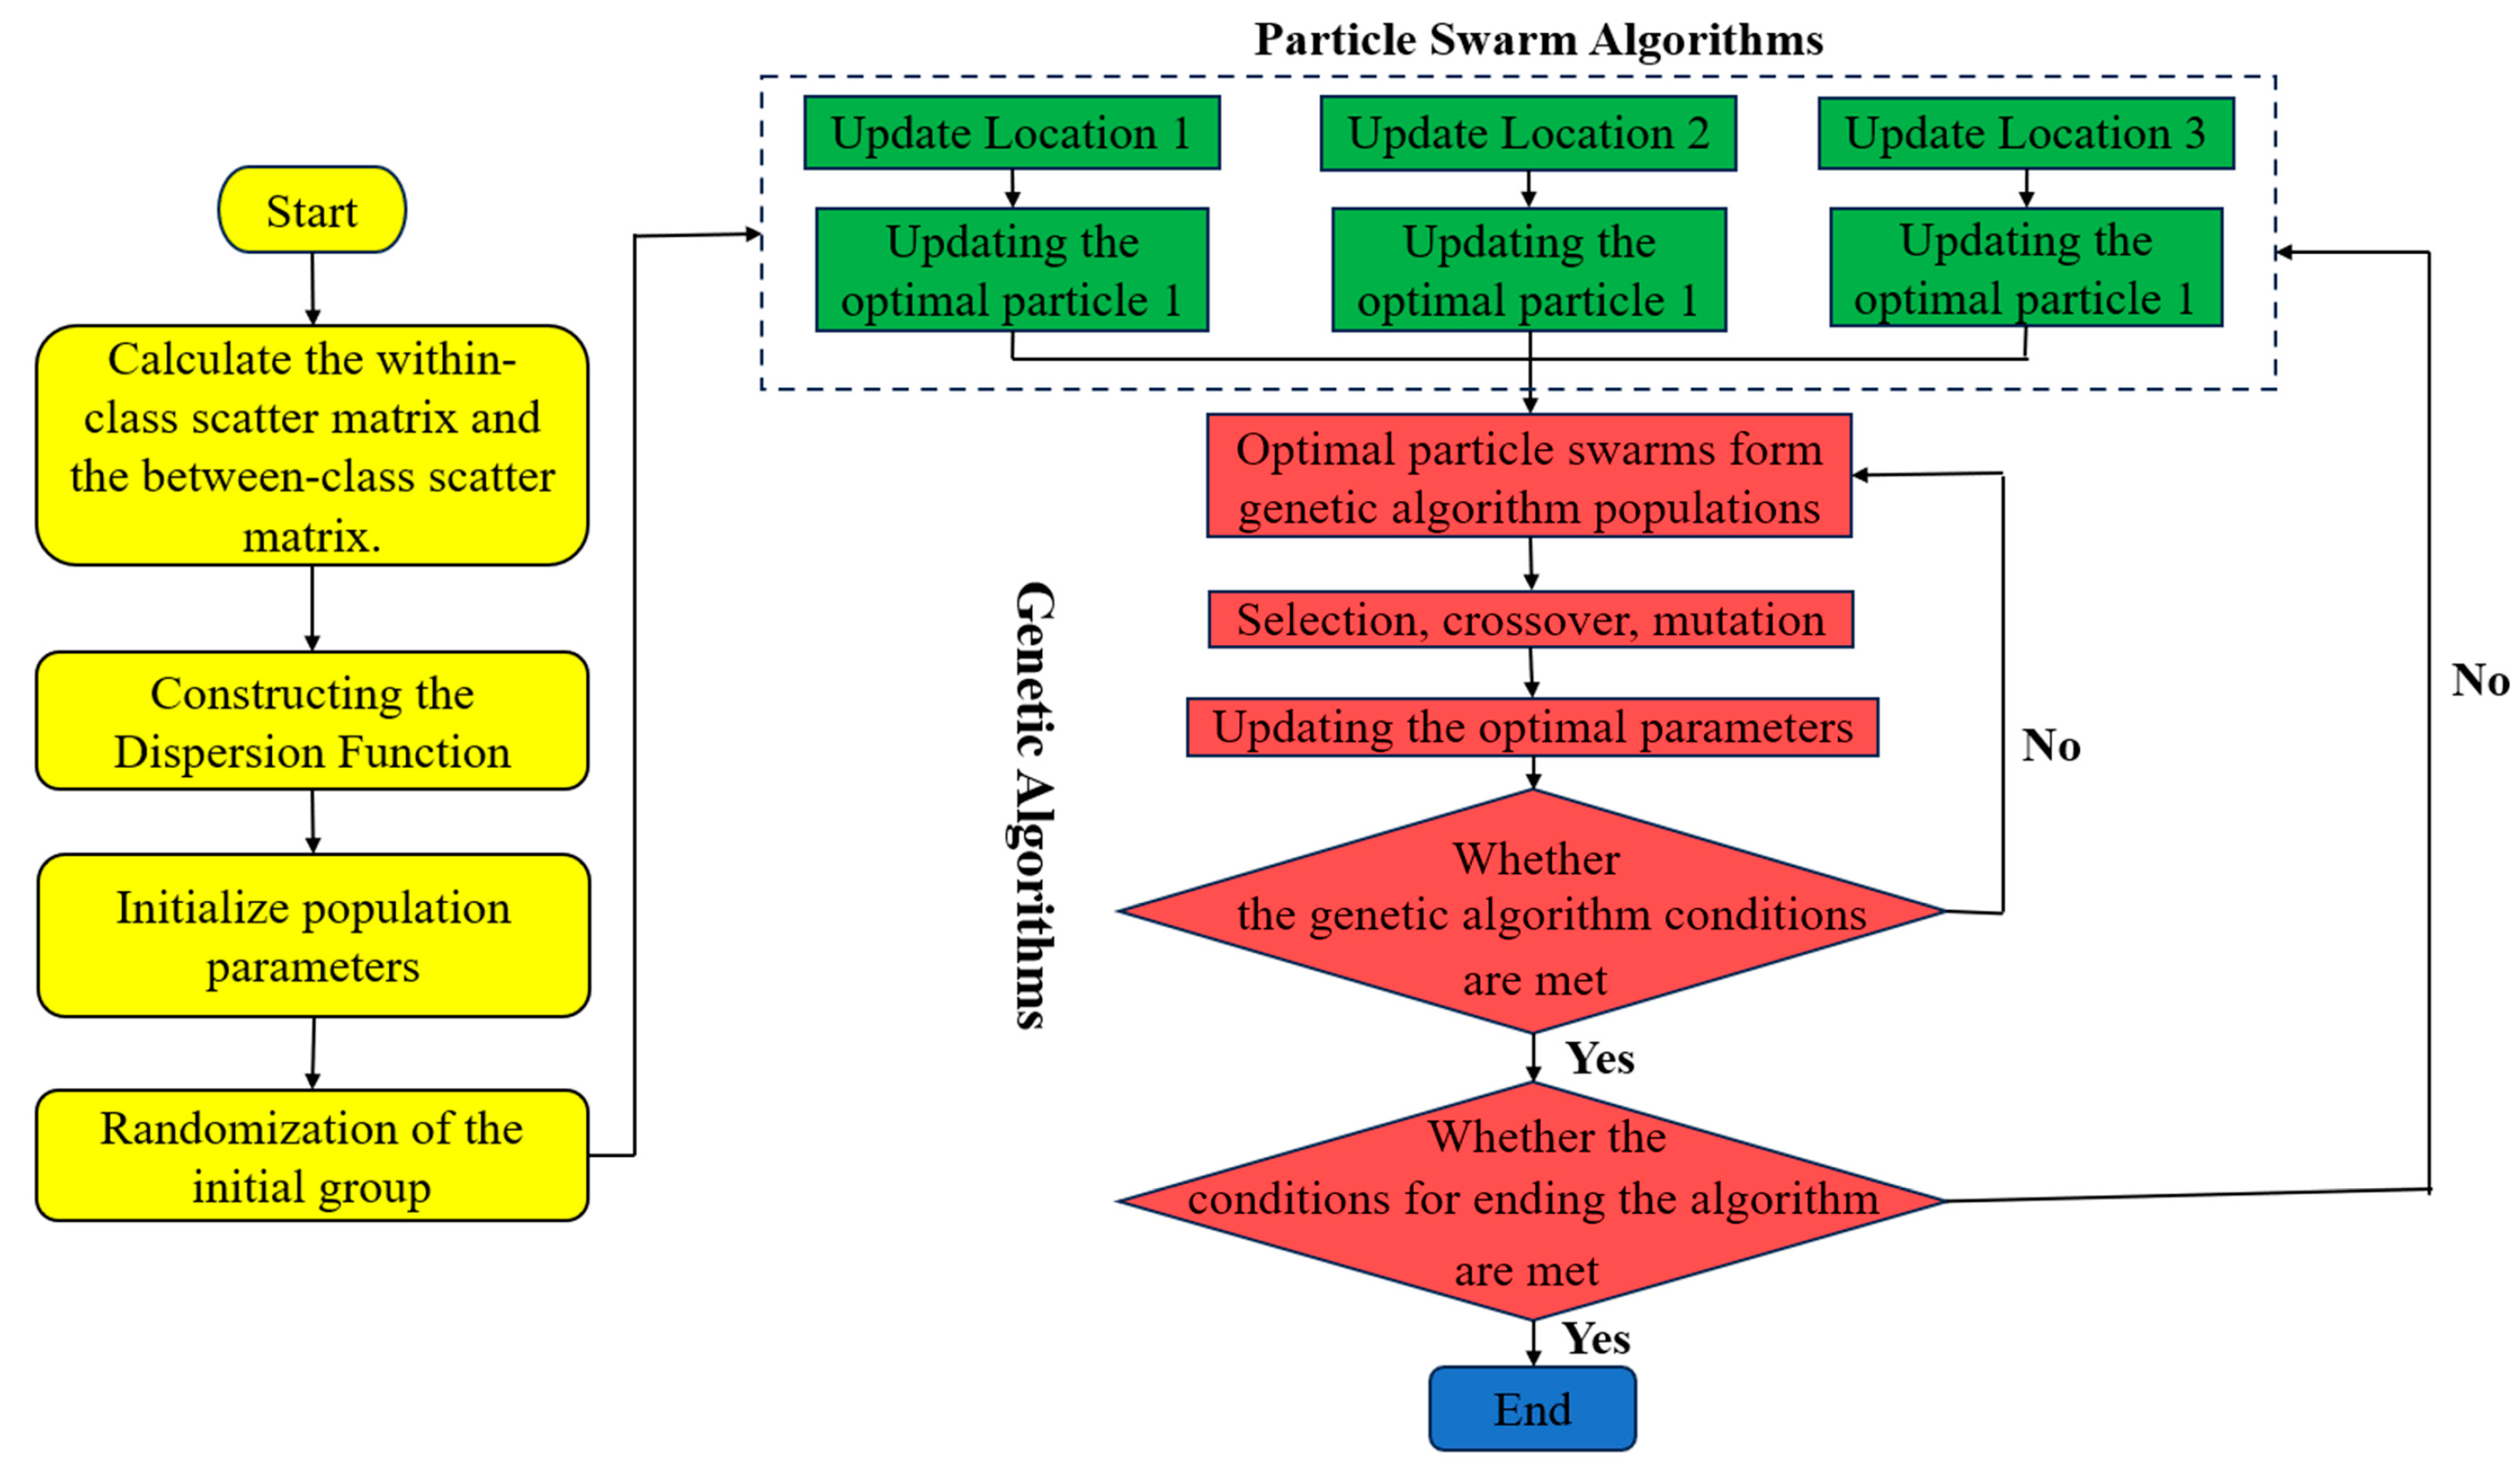
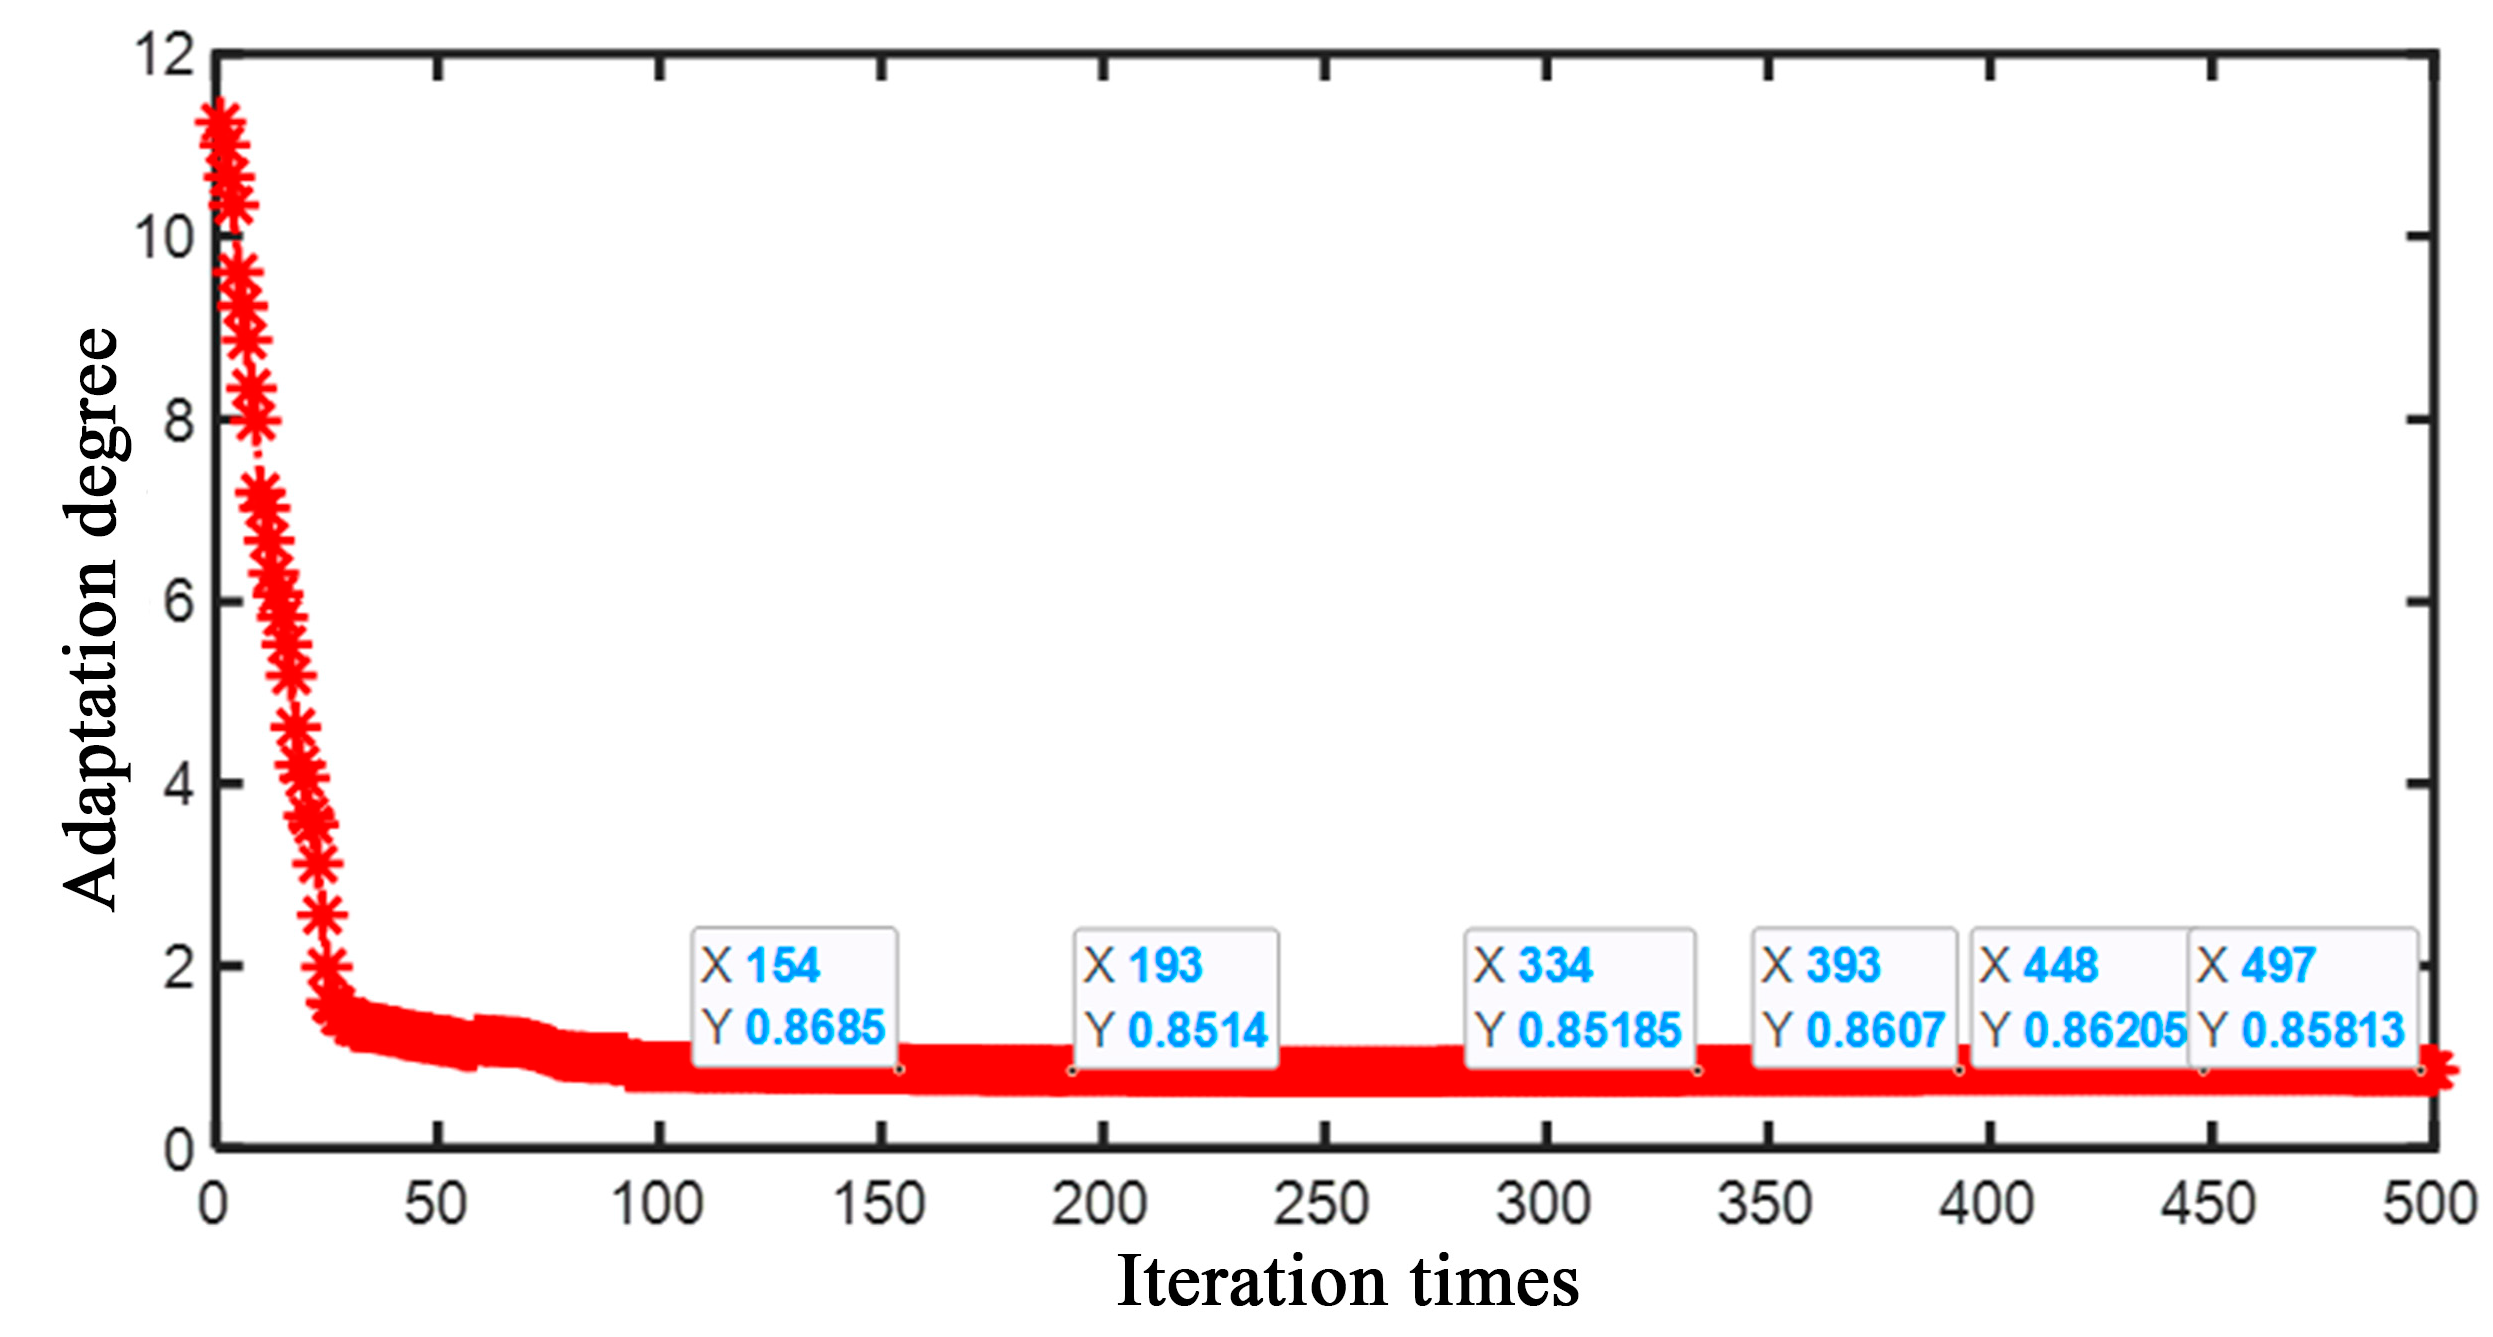
3.2. GA–PSO Hybrid Algorithm
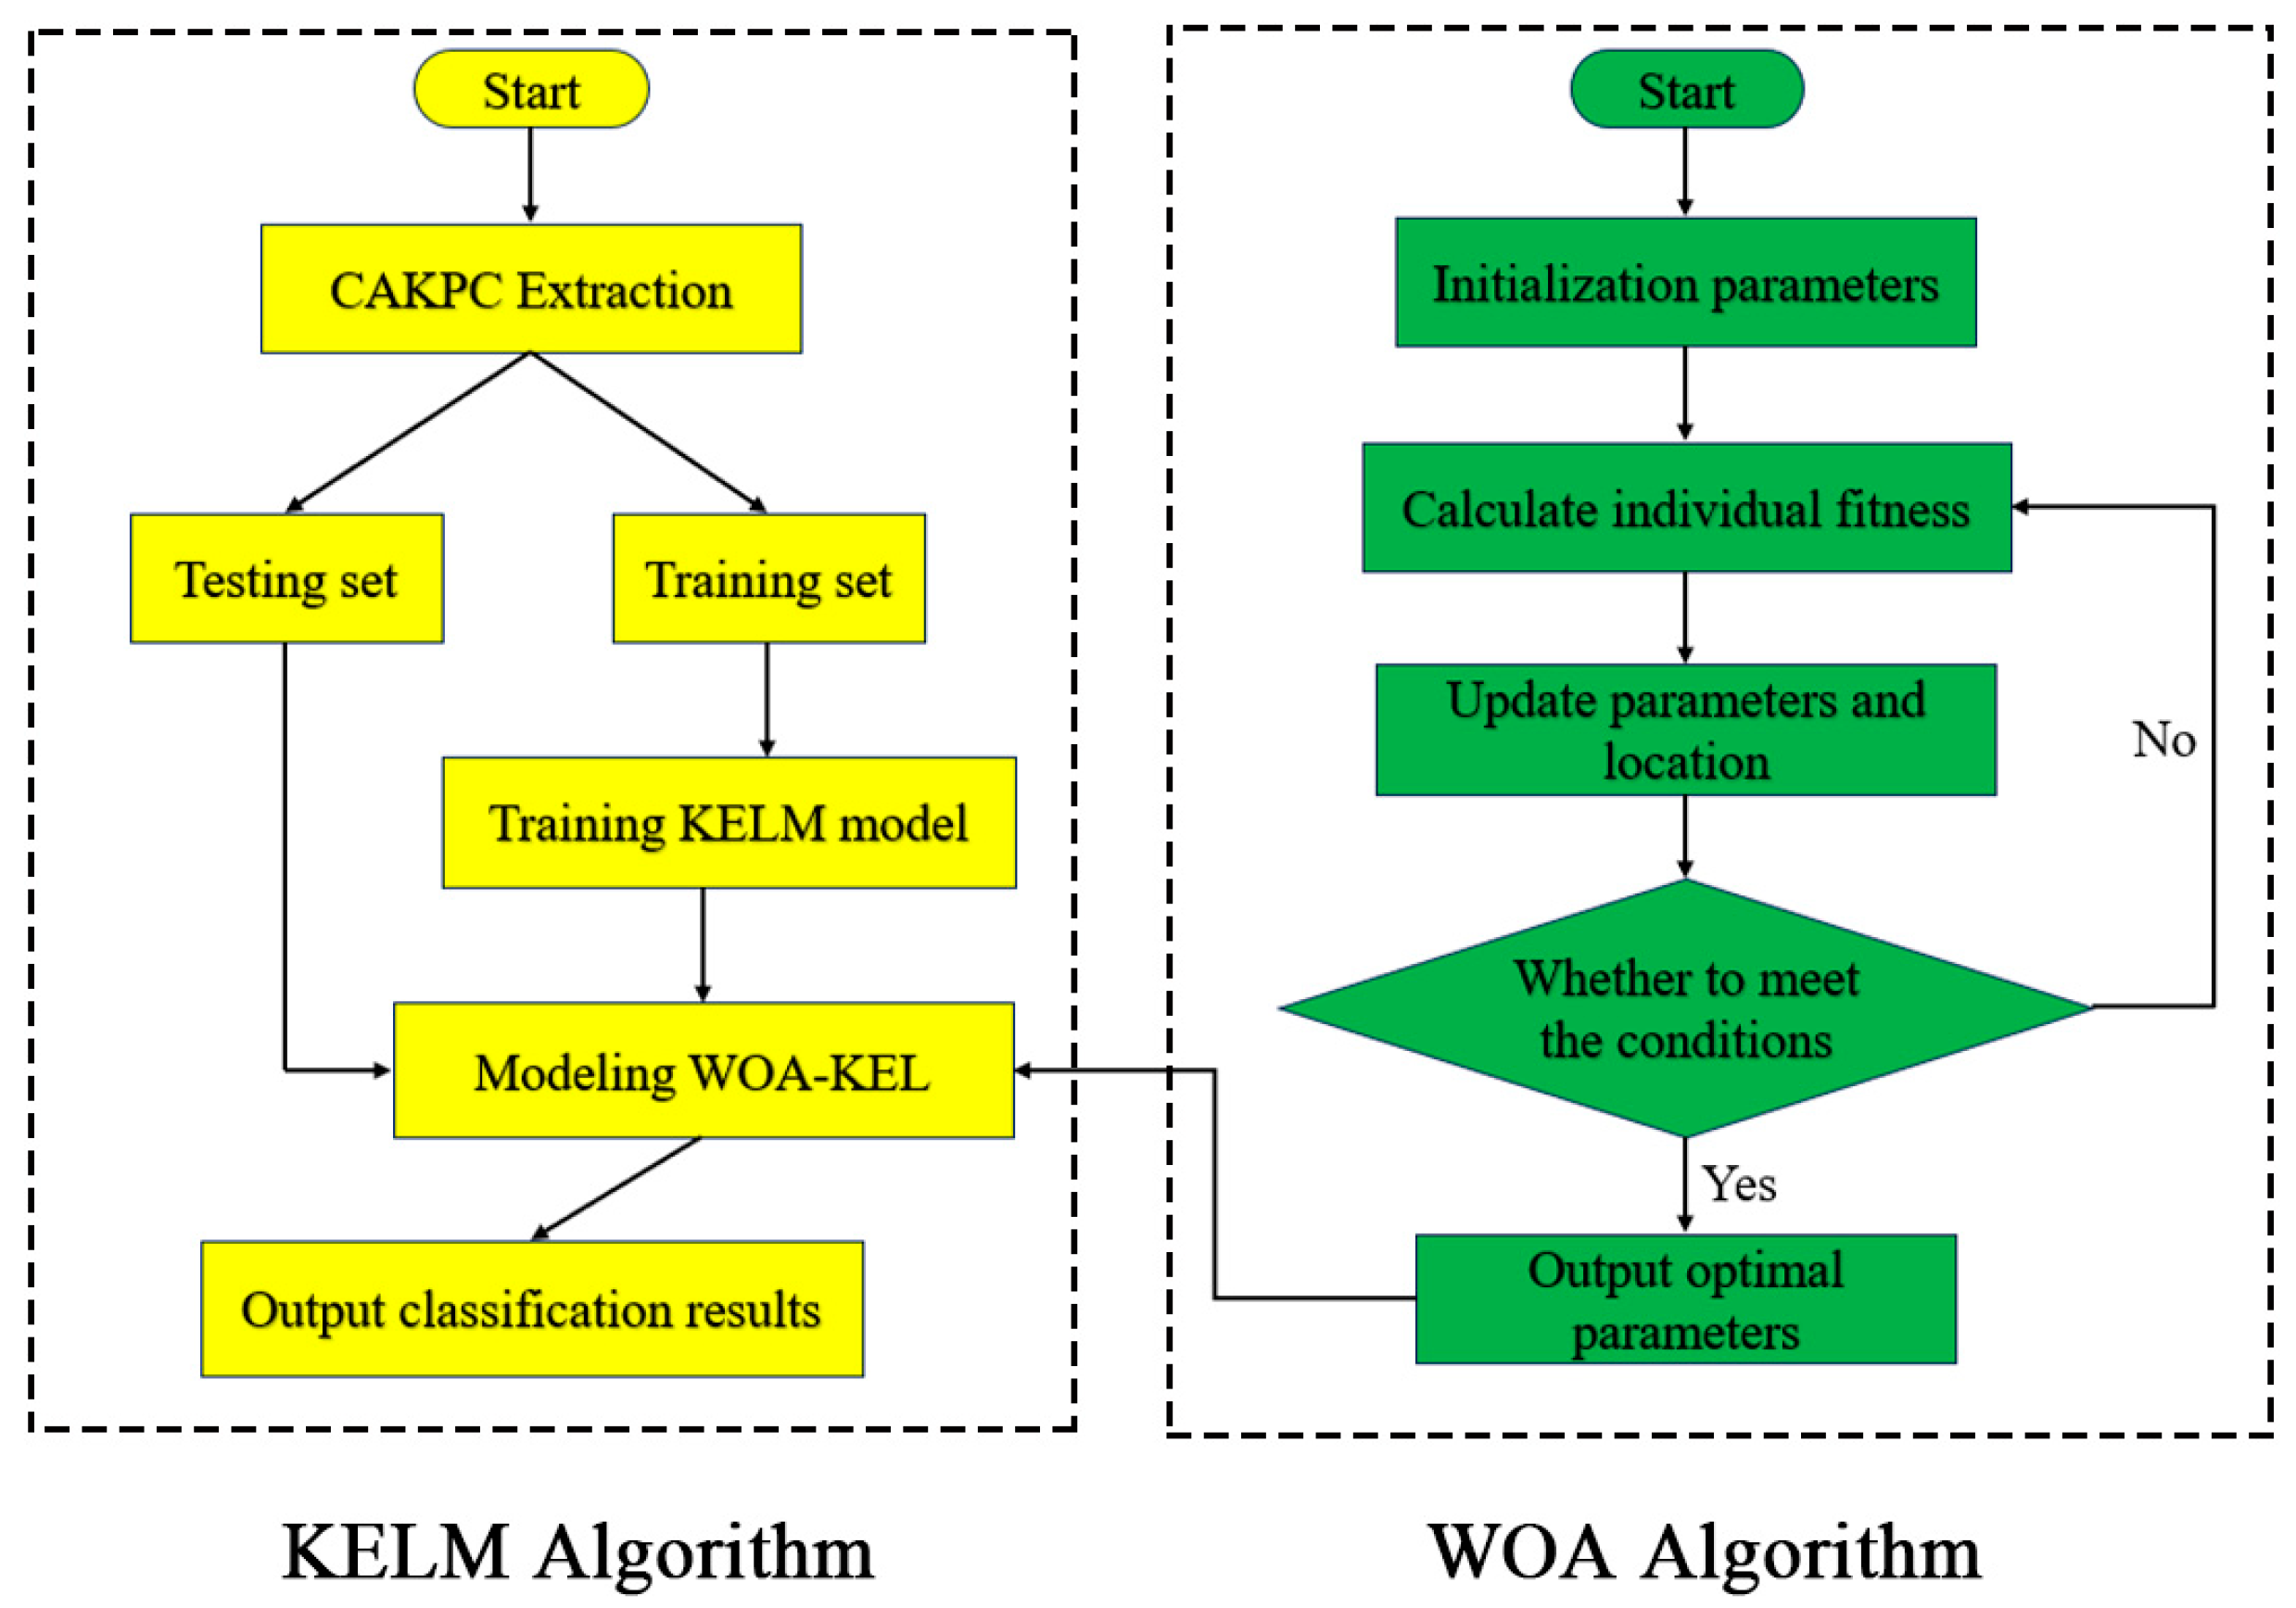
3.3. Optimizing Kernel Extreme Learning Machine
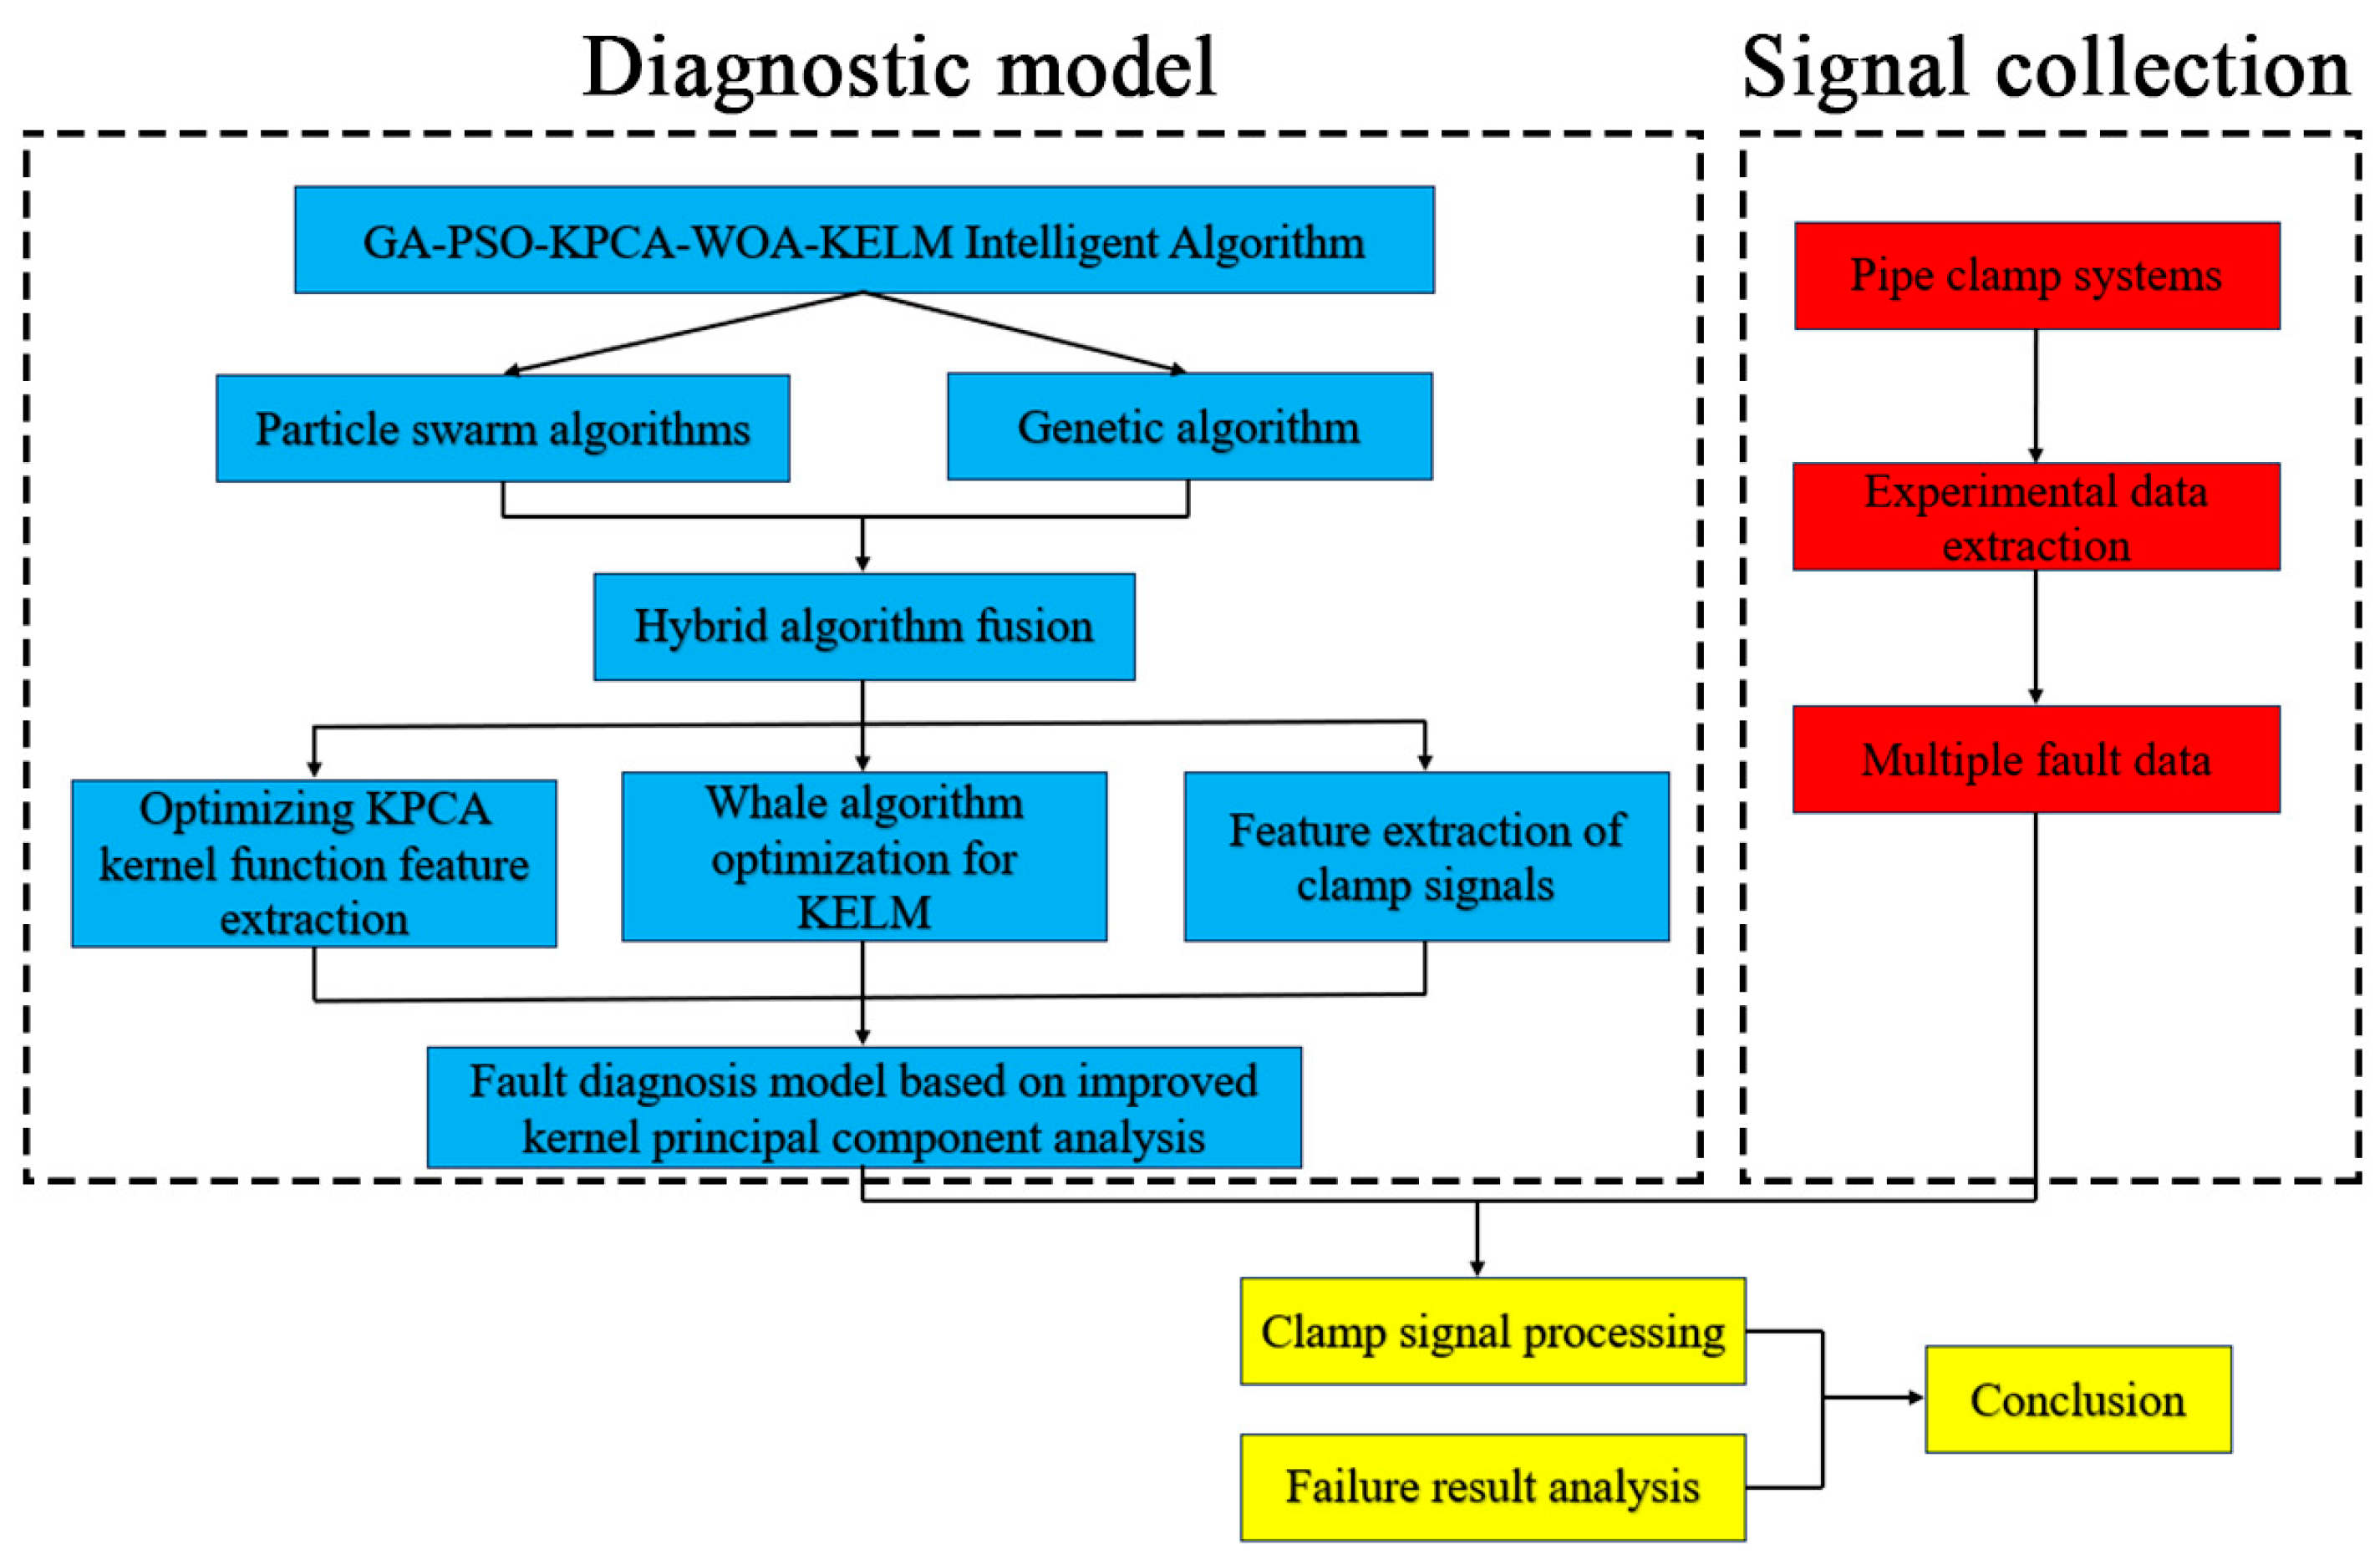
3.4. Establish a Diagnostic Model
4. Experimental Results and Analysis
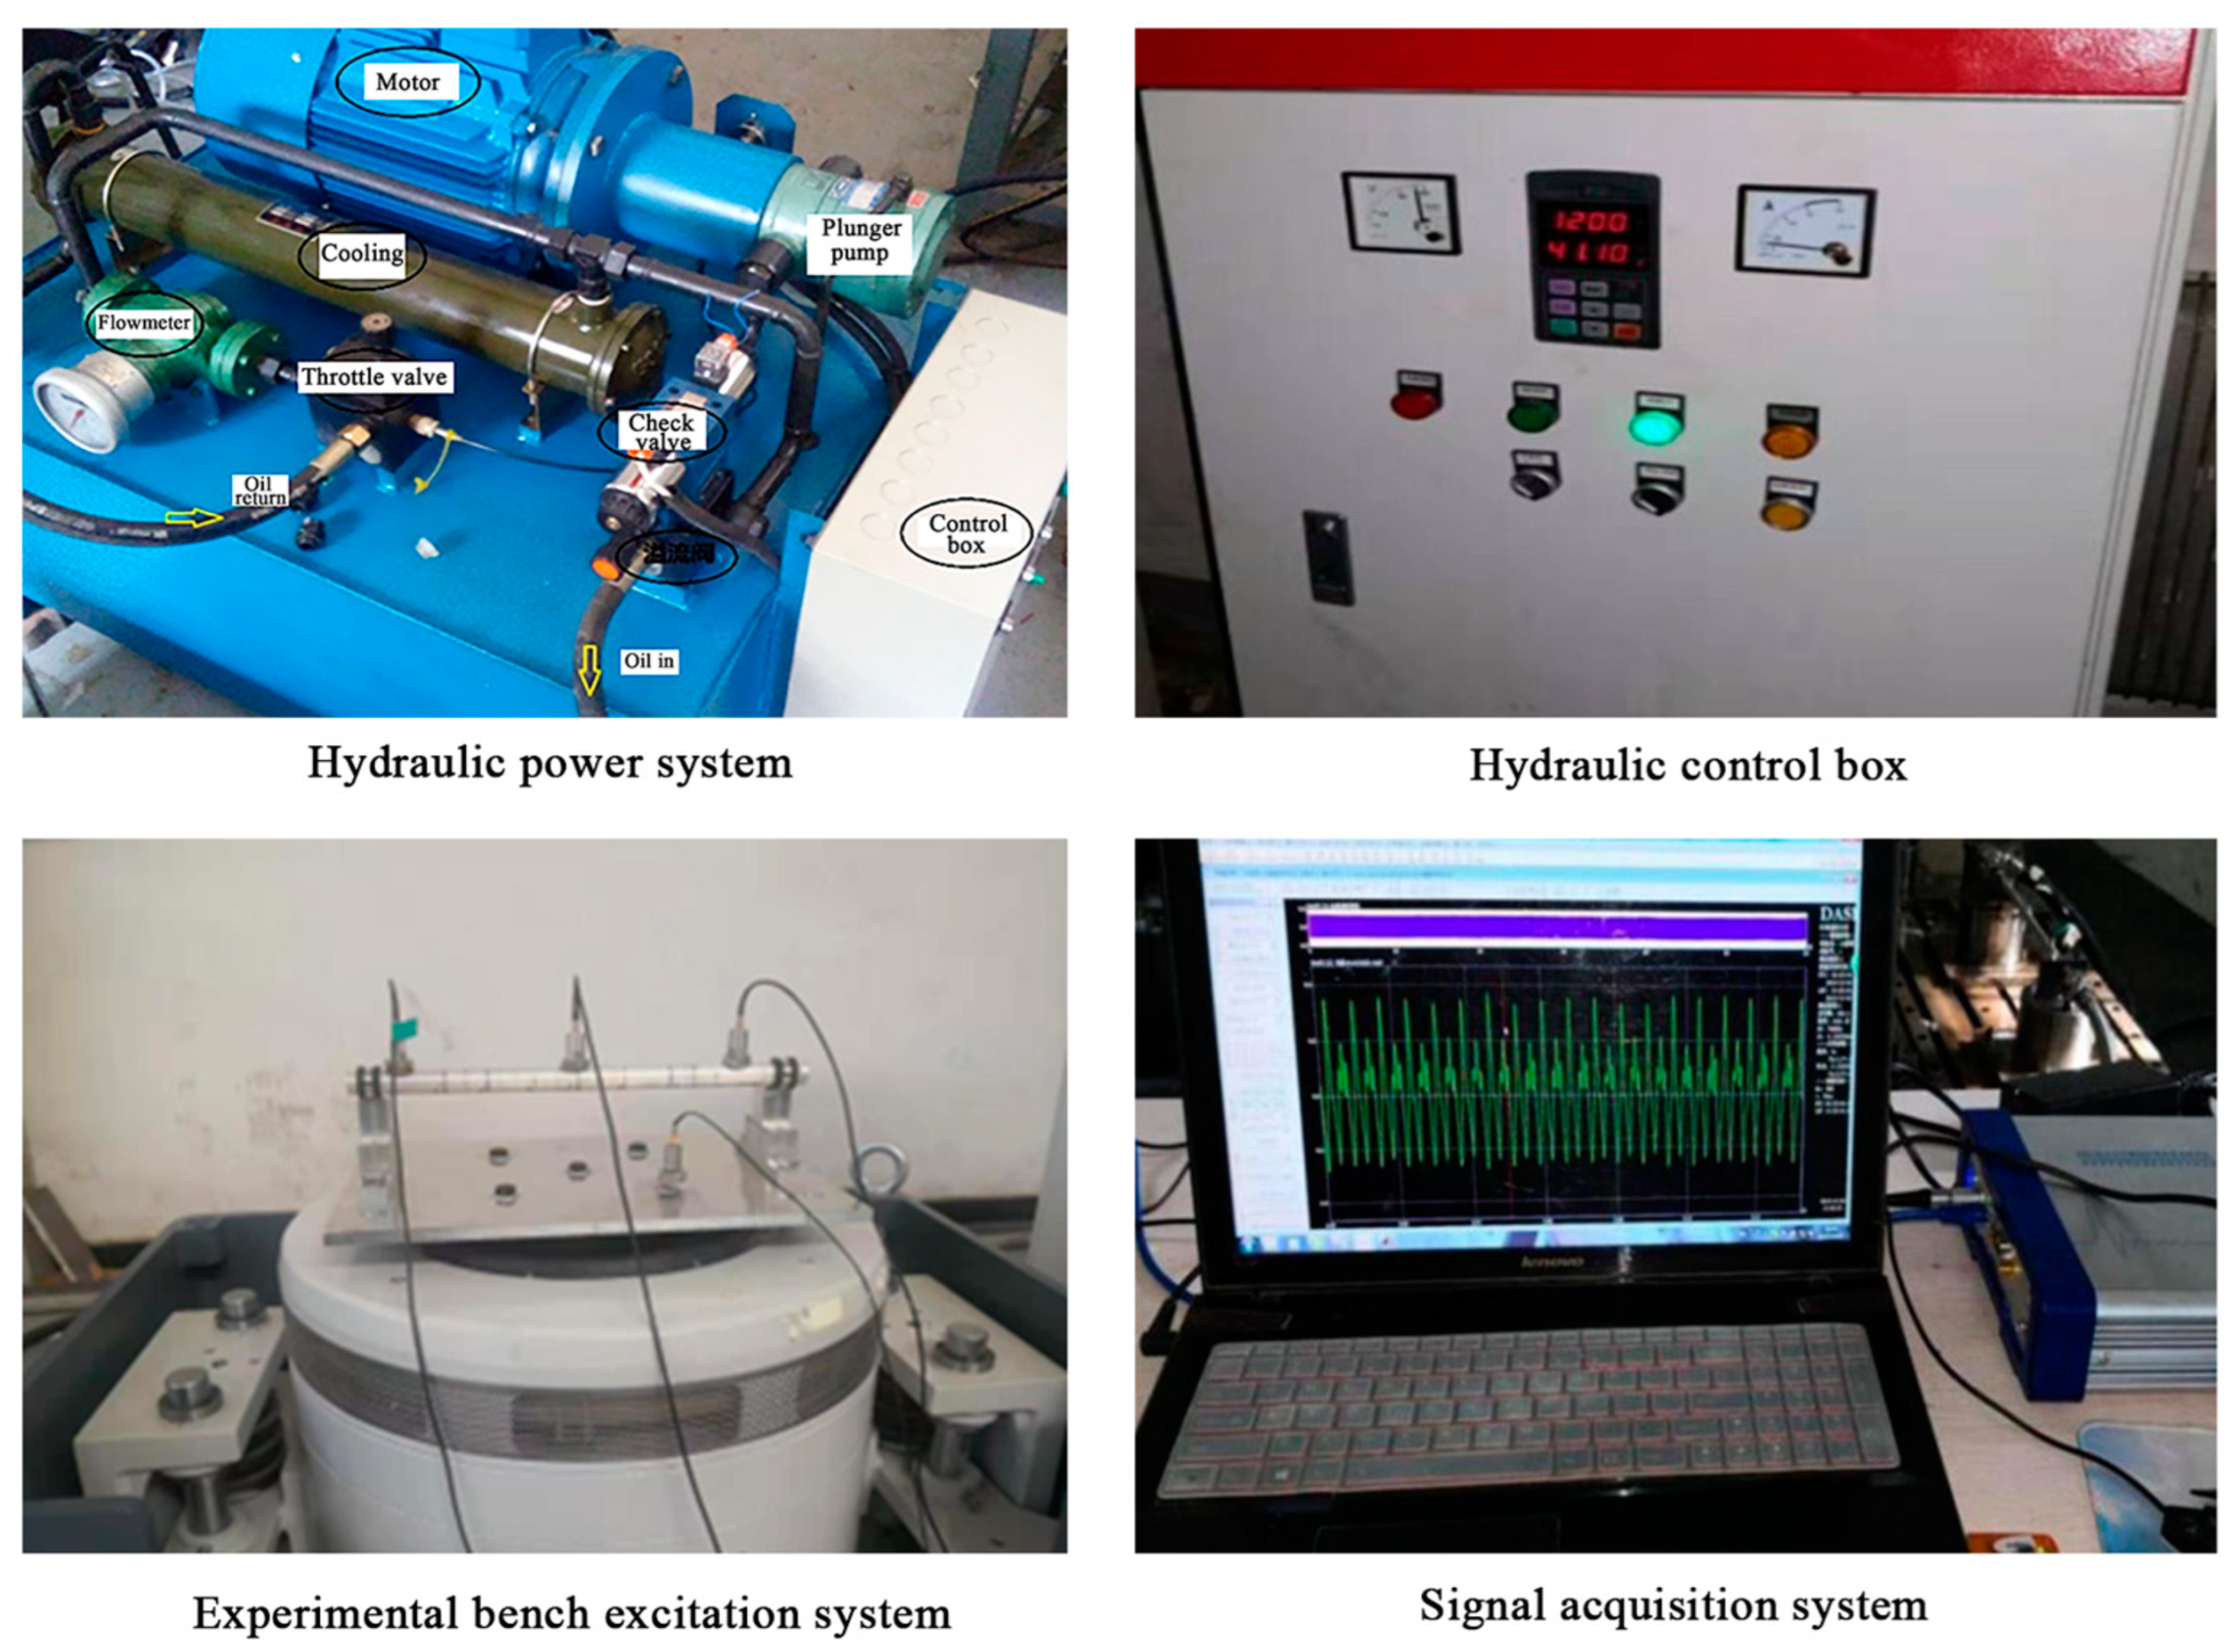
4.1. Fault Simulation Experiments for Hydraulic Pipeline Clamps
4.2. Feature Extraction
4.3. Fault Diagnosis and Comparative Analysis
5. Conclusions
- 1
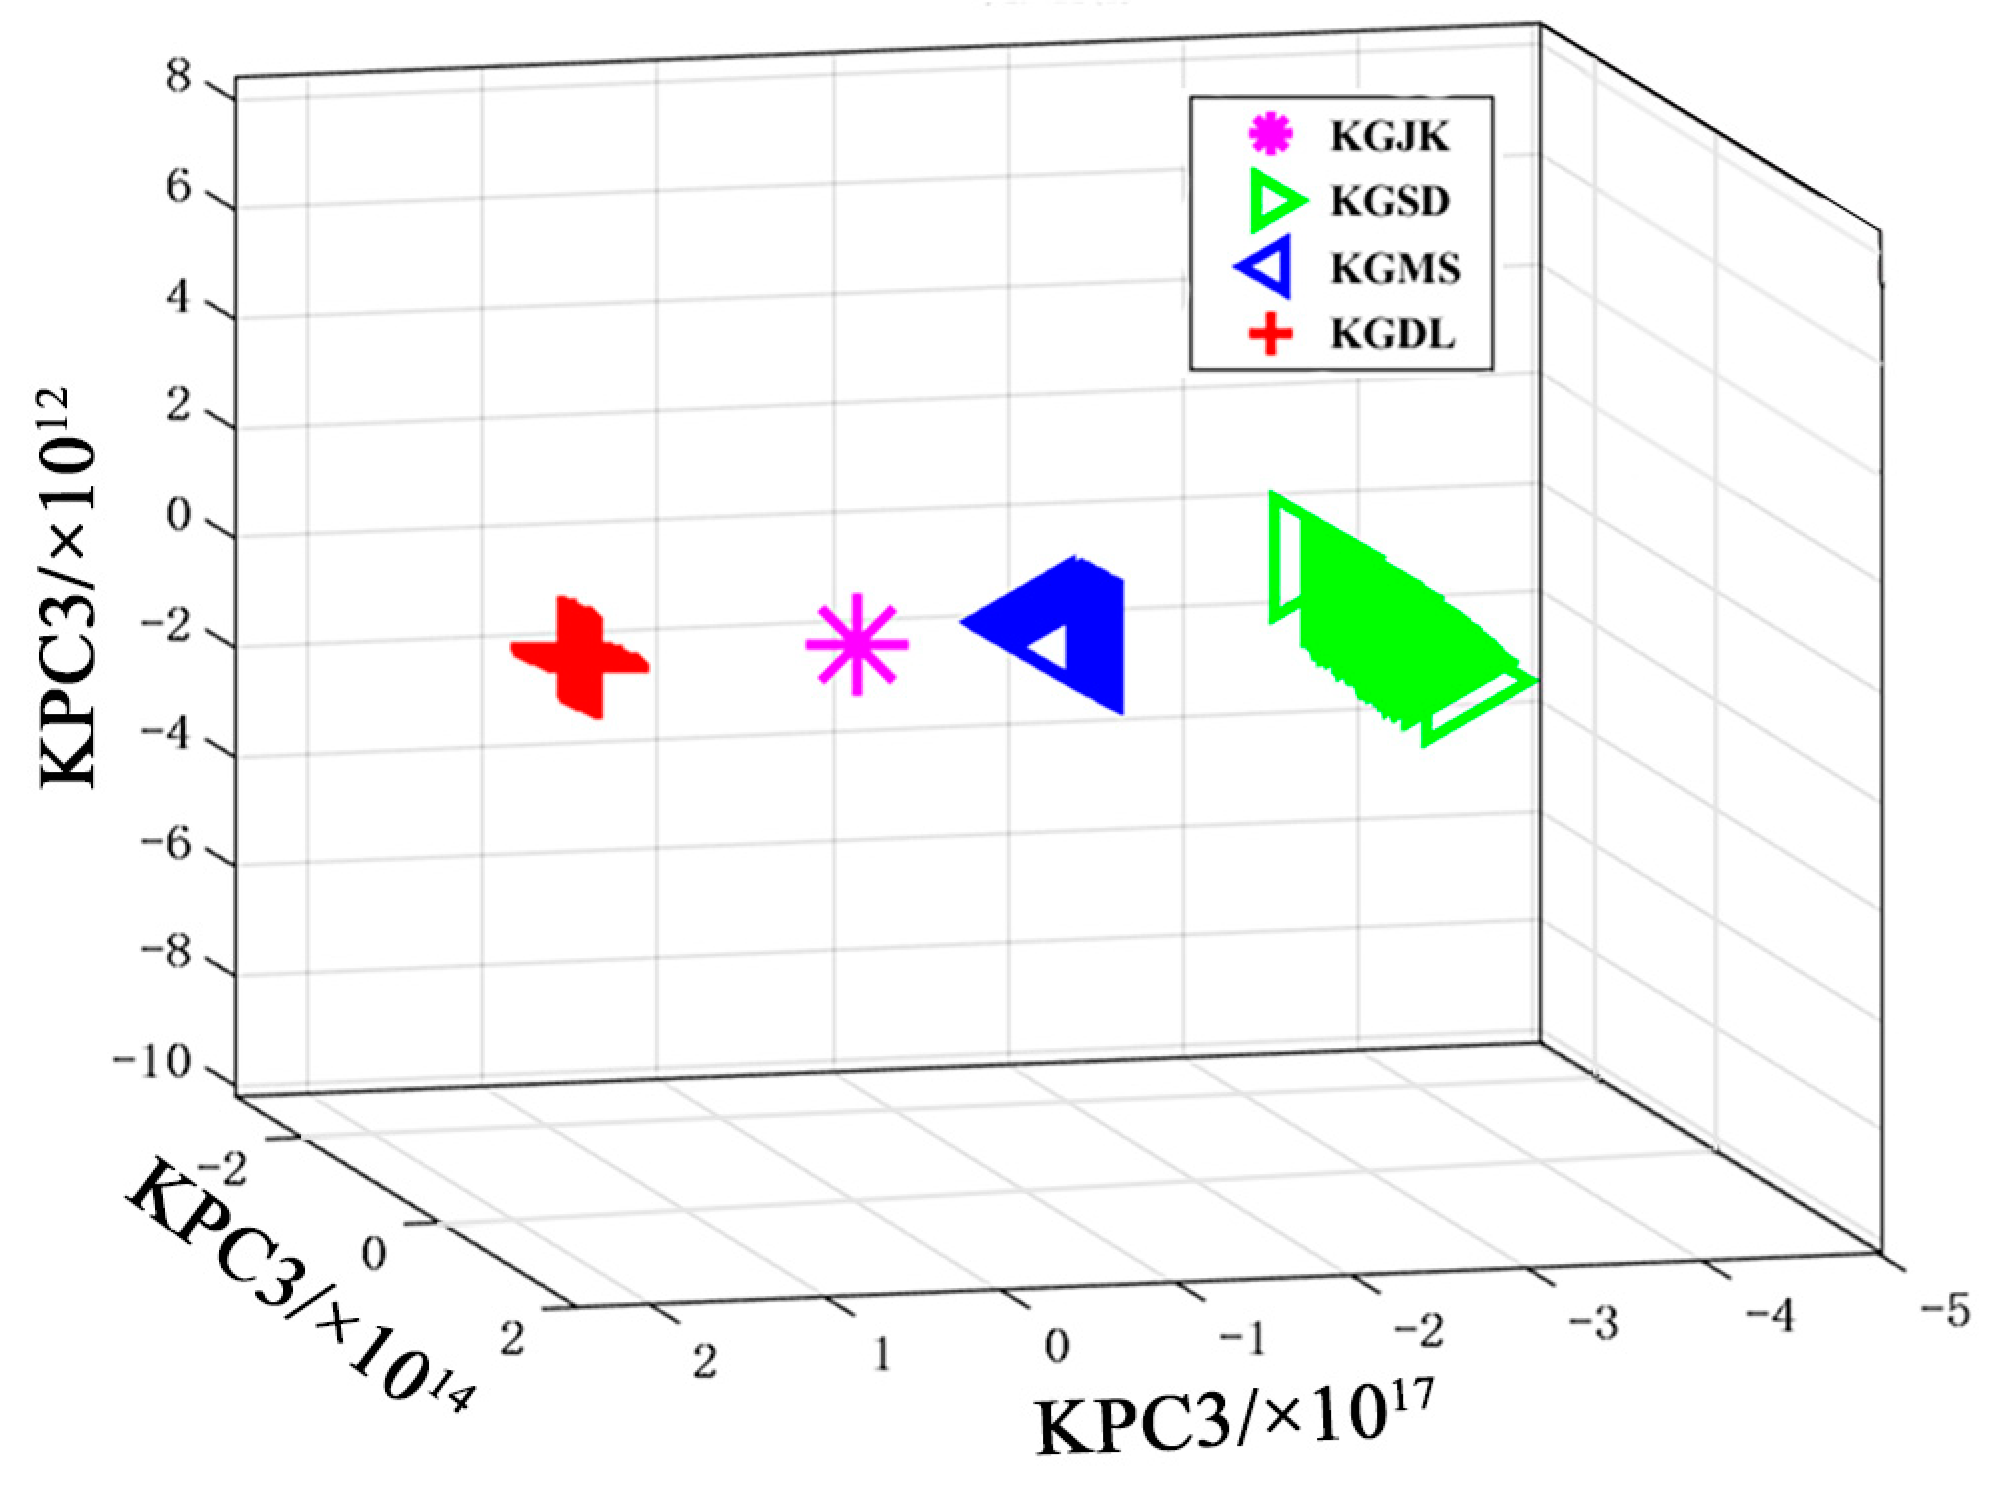
- The GA–PSO hybrid algorithm optimizes multiple kernel parameters for improved KPCA, establishing a feature extraction method model based on Kernel Principal Component Analysis (KPCA). Through validation studies, it was demonstrated that a single principal component contributes 99.99% of the original sample data attributes, surpassing single-kernel KPCA and unprocessed PCA methods. This approach exhibits excellent feature extraction capability, thereby validating the feasibility of the proposed feature extraction method.
- 2
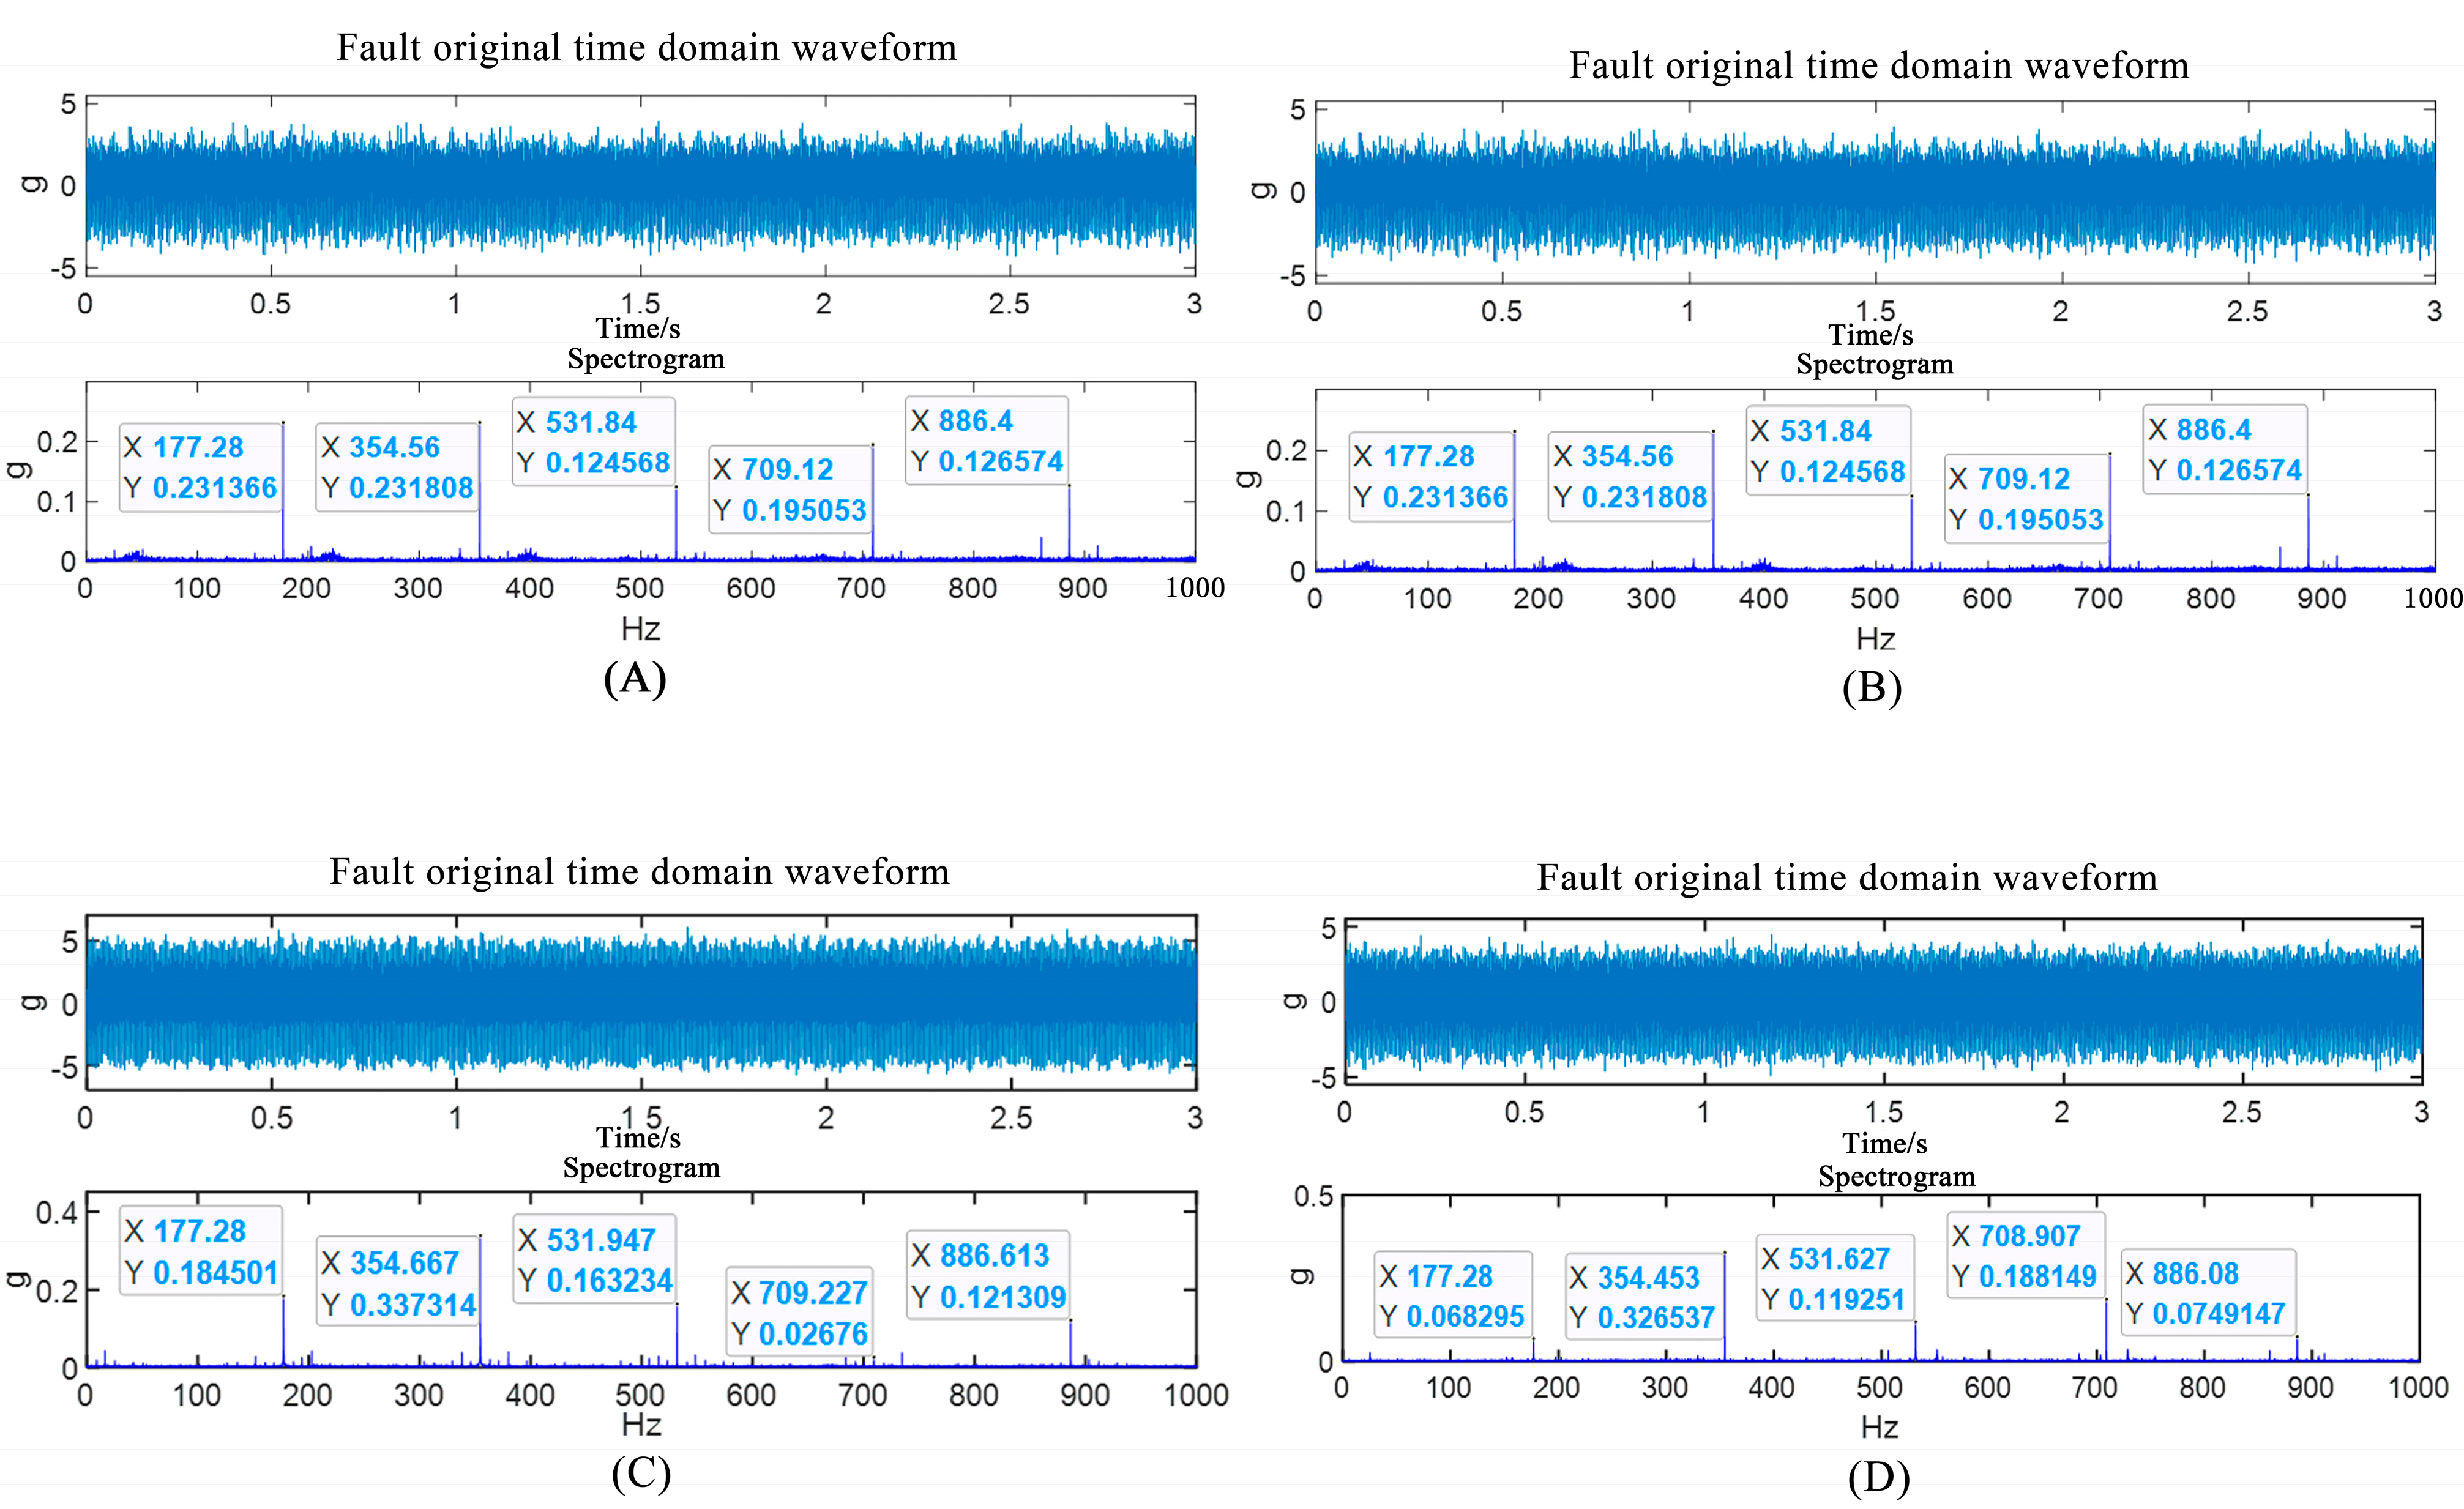
- This study designed a vibration testing experimental plan for fixed clamps in aviation engine hydraulic pipelines, focusing on the aviation hydraulic pipe clamp system. Vibration experiments were conducted to evaluate the health status of fixed clamps and simulate conditions such as clamp root fractures, liner wear, and clamp bolt loosening. Test data were collected from different clamp states within the same pipeline, and both time-domain and frequency-domain analyses were performed. The paper proposes using the Kernel Principal Component Analysis (KPCA) with parameters optimized using a GA–PSO fusion algorithm to analyze clamp vibration signals. Comparative analyses were conducted between different kernel functions and unoptimized combined kernel functions for KPCA of clamp data. The results validate that the proposed method efficiently and accurately maps and extracts vibration data from clamps. Data analysis demonstrates that the method effectively identifies different clamp fault states across various pipelines, thereby providing robust data support for subsequent fault diagnosis.
- 3
- Experimental vibration signals were subjected to time-domain and frequency-domain feature extraction, resulting in a dataset comprising 13 time-domain features and 4 frequency-domain features. This combined dataset was input into a feature extraction model, yielding processed feature datasets via GA–PSO–KPCA. Subsequently, these features were incorporated into a Whale Optimization Algorithm (WOA)-enhanced Kernel Extreme Learning Machine (KELM) network model to achieve fault classification, recognition, and diagnosis of clamps. The proposed GA–PSO–KPCA–WOA–KELM fault diagnosis model demonstrated an average accuracy of 99.99%. This validates the method’s stability, effectiveness, and feasibility in extracting and identifying fault characteristics in aviation hydraulic pipe clamps.
Author Contributions
Funding
Data Availability Statement
Conflicts of Interest
References
- Li, Z.Z.; Gao, P.X.; Zhao, D.Z.; Liu, J.R. Fault diagnosis and location of the aero-engine hydraulic pipeline based on Kalman filter. Adv. Mech. Eng. 2017, 9, 168781401774281. [Google Scholar] [CrossRef]
- Lv, Z.Y.; Xiong, J.J.; Tong, L.; Zhu, Y.T. A practical approach for evaluating safe fatigue life of hydraulic actuator in helicopter based on a nominal force concept and minimal datasets. Aerosp. Sci. Technol. 2017, 62, 158–164. [Google Scholar] [CrossRef]
- Shang, Y.X.; Liu, X.C.; Jiao, Z.X.; Wu, S. An integrated load sensing valve-controlled actuator based on power-by-wire for aircraft structural test. Aerosp. Sci. Technol. 2018, 77, 117–128. [Google Scholar] [CrossRef]
- Gomes, J.P.P.; Rodrigues, L.R.; Leao, B.P.; Galvao, R.K.H.; Yoneyama, T. Using degradation messages to predict hydraulic system failures in a commercial aircraft. IEEE Trans. Autom. Sci. Eng. 2018, 15, 214–224. [Google Scholar] [CrossRef]
- Jani, D.B.; Ashish, S.; Aditya, S.; Yash, S.; Bishambhar, S.; Nikhil, S.; Manmohan, S. An overview on aircraft hydraulic system. Renew. Sustain. Energy Rev. 2019, 6, 6–10. [Google Scholar]
- Lu, C.Q.; Wang, S.P.; Wang, X.J. A multi-source information fusion fault diagnosis for aviation hydraulic pump based on the new evidence similarity distance. Aerosp. Sci. Technol. 2017, 71, 392–401. [Google Scholar] [CrossRef]
- Jiao, Z.X.; Liu, X.C.; Shang, Y.X.; Huang, C. An integrated self-energized brake system for aircrafts based on a switching valve control. Aerosp. Sci. Technol. 2017, 60, 20–30. [Google Scholar] [CrossRef]
- Mehmood, Z.; Hameed, A.; Javed, A.; Hussain, A. Analysis of premature failure of aircraft hydraulic pipes. Eng. Fail. Anal. 2020, 109, 104356. [Google Scholar] [CrossRef]
- Liu, Q.; Tang, Z.; Liu, H.J.; Yu, J.P.; Ma, H.; Yang, Y.H. Integrated Optimization of Pipe Routing and Clamp Layout for Aeroengine Using Improved MOALO. Int. J. Aerosp. Eng. 2021, 2021, 6681322. [Google Scholar] [CrossRef]
- Chen, Z.M.; Song, C.Y.; Yang, G.S. Braking resistance to vibration damage after a certain aircraft design analysis. J. Aircr. Des. 2003, 2, 34–35. [Google Scholar] [CrossRef]
- Li, S.Z.; Song, Y.J.; Zhou, G.Q. Leak detection of water distribution pipeline subject to failure of socket joint based on acoustic emission and pattern recognition. Measurement 2018, 115, 39–44. [Google Scholar] [CrossRef]
- McFadden, P.D. A technique for calculating the time domain averages of the vibration of the individual planet gears and the sun gear in an epicyclic gearbox. J. Sound Vib. 1991, 144, 163–172. [Google Scholar] [CrossRef]
- Chen, J.; Patton, R.J.; Liu, G.P. Optimal residual design for fauly diagnosis using multi-objective optimization and genetic algorithms. Int. J. Syst. Sci. 1996, 27, 567–576. [Google Scholar] [CrossRef]
- Roberts, P.D. Robust Model-Based Fault Diagnosis for Dynamic Systems Jie Chen and R. J. Patton Kluwer Academic Publishers Boston MA U.S.A. 1999; 354 pages ISBN 0-7923-8411-3. Int. J. Robust Nonlinear Control 2001, 11, 1400–1401. [Google Scholar] [CrossRef]
- Kwong, A.H.M.; Edge, K.A. Wave Propagation in Fluid-filled Pipe System. In Proceedings of the Euro-Noise’95, Conference on ‘Software for Noise Control’, Lyon, France, 21–23 March 1995; Volume 3, pp. 745–750. [Google Scholar]
- Kwong, A.H.M.; Edge, K.A. Structure-borne Noise Prediction in Liquid-conveying Pipe System. Proc. Inst. Mech. Eng. Part I J. Syst. Control Eng. 1996, 210, 189–200. [Google Scholar] [CrossRef]
- Kwong, A.H.M.; Edge, K.A. A Method to Reduce Noise in Hydraulic Systems by Optimizing Pipe Clamp Locations. Proc. Inst. Mech. Eng. Part I J. Syst. Control Eng. 1998, 212, 267–280. [Google Scholar] [CrossRef]
- Barthelme, W.; Zimroz, R. Vibration condition monitoring of planetary gearbox under varying external load. Mech. Syst. Signal Process. 2009, 23, 246–257. [Google Scholar] [CrossRef]
- Wang, H.; Peng, M.J.; Yu, Y.; Saeed, H.; Hao, C.M.; Liu, Y.K. Fault identification and diagnosis based on KPCA and similarity clustering for nuclear power plants. Ann. Nucl. Energy 2021, 150, 107786. [Google Scholar] [CrossRef]
- Sun, H.T.; Lv, G.D.; Mo, J.Q.; Lv, X.Y.; Du, G.L.; Liu, Y.J. Application of KPCA combined with SVM in Raman spectral discrimination. Optik 2019, 184, 214–219. [Google Scholar] [CrossRef]
- Su, H.; Xiang, L.; Hu, A.J.; Gao, B.F.; Yang, X. A novel hybrid method based on KELM with SAPSO for fault diagnosis of rolling bearing under variable operating conditions. Measurement 2021, 177, 109276. [Google Scholar] [CrossRef]
- Gao, Y.; Sun, W. Inverse identification of the mechanical parameters of a pipeline hoop and analysis of the effect of preload. Front. Mech. Eng. 2019, 14, 358–368. [Google Scholar] [CrossRef]
- Guo, X.; Ma, H.; Zhang, X.; Ye, Z.; Fu, Q.; Liu, Z.; Han, Q. Uncertain frequency responses of clamp-pipeline systems using an interval-based method. IEEE Access 2020, 8, 29370–29384. [Google Scholar] [CrossRef]
- Gao, P.X.; Yu, T.; Zhang, Y.L.; Wang, J.; Zhai, J.Y. Vibration analysis and control technologies of hydraulic pipeline system in aircraft: A review. Chin. J. Aeronaut. 2021, 34, 83–114. [Google Scholar] [CrossRef]
- Schölkopf, B. Kernel principal component analysis. In Proceedings of the International Conference on Artificial Neuralnetworks, Lausanne, Switzerland, 8–10 October 1997; pp. 583–588. [Google Scholar]
- David EGoldberg, A.I. Genetic and evolutionary algorithms come of age. Commun. ACM 1994, 37, 113–119. [Google Scholar] [CrossRef]
- Jyotisha, A.; Vivek, K.; Ashok, K. Effect of Network Topologies on Localization using DV-Hop based PSO Algorithm. In Proceedings of the International Conference on Trends in Electronics and Informatics, Tirunelveli, India, 3–5 June 2021; pp. 40–45. [Google Scholar] [CrossRef]
- Seyedali, M.; Andrew, L. The Whale Opti-mization Algorithm. Adv. Eng. Softw. 2016, 95, 51–67. [Google Scholar] [CrossRef]
- Ding, Y.F.; Chen, Z.J.; Zhang, H.W.; Wang, X.; Guo, Y. A short-term wind power prediction model based on CEEMD and WOA-KELM. Renew. Energy 2022, 189, 188–198. [Google Scholar] [CrossRef]
- Ding, T.S.; Yan, Y.J.; Li, X.; Liu, L.F. Study of scintillation detector fault diagnosis based on ELM method. Nucl. Instrum. Methods Phys. Res. Sect. A 2022, 1032, 166637. [Google Scholar] [CrossRef]
- Chen, X.; Ding, K.; Zhang, J.; Han, W.; Liu, Y.; Yang, Z.; Weng, S. Online prediction of ultra-short-term photovoltaic power using chaotic characteristic analysis improved PSO and KELM. Energy 2022, 248, 123574. [Google Scholar] [CrossRef]


| Fault Type | Label | Measurement Point Location |
|---|---|---|
| Healthy state of the fixed clamp | KGJK | 1 |
| 2 | ||
| Clamp padding wear fault | KGMS | 1 |
| 2 | ||
| Clamp padding wear fault | KGDL | 1 |
| 2 | ||
| Clamp bolt loosening fault | KGSD | 1 |
| 2 |
| Serial Code | WGJK | WGMS | WGDL | WGSD |
|---|---|---|---|---|
| 1 | 0.9999 | 0.9999 | 0.9998 | 0.9999 |
| 2 | 1.0000 | 1.0000 | 0.9999 | 1.0000 |
| 3 | 1.0000 | 1.0000 | 1.0000 | 1.0000 |
| 4 | 1.0000 | 1.0000 | 1.0000 | 1.0000 |
| Diagnostic Model | Standard Deviation | Precision/% |
|---|---|---|
| GA–PSO–KPCA–WOA–KELM | 0.00005164 | 0.9999 |
| GA–PSO–KPCA–KELM | 0.0042 | 0.9835 |
| WOA–KELM | 0.0074 | 0.9334 |
| KELM | 0.0043 | 0.8366 |
| GA–PSO–KPCA–BP | 0.0051 | 0.9155 |
| KPCA–BP | 0.0062 | 0.8053 |
| GA–PSO–KPCA–SVM | 0.0045 | 0.9259 |
| KPCA–SVM | 0.0098 | 0.8209 |
Disclaimer/Publisher’s Note: The statements, opinions and data contained in all publications are solely those of the individual author(s) and contributor(s) and not of MDPI and/or the editor(s). MDPI and/or the editor(s) disclaim responsibility for any injury to people or property resulting from any ideas, methods, instructions or products referred to in the content. |
© 2024 by the authors. Licensee MDPI, Basel, Switzerland. This article is an open access article distributed under the terms and conditions of the Creative Commons Attribution (CC BY) license (https://creativecommons.org/licenses/by/4.0/).
Share and Cite
Liu, C.; Zhang, X.; Bai, J. Fault Diagnosis of Aircraft Hydraulic Pipeline Clamps Based on Improved KPCA and WOA–KELM. Processes 2024, 12, 2572. https://doi.org/10.3390/pr12112572
Liu C, Zhang X, Bai J. Fault Diagnosis of Aircraft Hydraulic Pipeline Clamps Based on Improved KPCA and WOA–KELM. Processes. 2024; 12(11):2572. https://doi.org/10.3390/pr12112572
Chicago/Turabian StyleLiu, Chunli, Xiaolong Zhang, and Jiarui Bai. 2024. "Fault Diagnosis of Aircraft Hydraulic Pipeline Clamps Based on Improved KPCA and WOA–KELM" Processes 12, no. 11: 2572. https://doi.org/10.3390/pr12112572
APA StyleLiu, C., Zhang, X., & Bai, J. (2024). Fault Diagnosis of Aircraft Hydraulic Pipeline Clamps Based on Improved KPCA and WOA–KELM. Processes, 12(11), 2572. https://doi.org/10.3390/pr12112572