Abstract
A novel methodology is proposed for the development of empirical flow pattern maps for pulsating heat pipes (PHPs), which relies on the concept of virtual superficial velocity of the liquid and vapour phases. The virtual superficial velocity of each phase is defined using solely the design and operational parameters of the pulsating heat pipe, allowing the resulting flow pattern map to serve as a predictive instrument. This contrasts with existing flow pattern maps that necessitate direct measurements of temperatures and/or velocities within one or more channels of the pulsating heat pipe. Specifically, the virtual superficial velocities are derived from the relative significance of the driving forces and the resistances encountered by each phase during flow. The proposed methodology is validated using flow visualisation datasets obtained from two separate experimental campaigns conducted on flat-plate polypropylene pulsating heat pipe prototypes featuring transparent walls and meandering channels with three turns, five turns, seven turns, and eleven turns, respectively. The PHP prototypes were tested for gravity levels ranging between 0 g and 1 g and heat inputs ranging from 5 W to 35 W. The proposed approach enables the identification of empirical boundaries for flow pattern transitions as well as the establishment of an empirical criterion for start-up.
1. Introduction
Flow patterns in gas–liquid two-phase flows significantly affect heat transfer coefficients and pressure drops, as the mechanisms governing these phenomena are intrinsically associated with the spatial distribution of liquid and vapour phases [1]. Transitions in flow patterns, which represent a form of instability in two-phase flow, have been extensively studied across various applications, including nuclear reactors, pipelines, boiling and condensation heat exchangers, and microchannels, among others. The determination of flow patterns typically relies on visual assessments, photographic imaging methods, or sudden variations in the average pressure drop of the system. This may also involve the use of conductivity measurements or high-frequency impedance probes for localised holdup sampling, as well as monitoring local pressure fluctuations and average holdup values. Recently, advancements in neural network methodologies [2] and machine learning algorithms, which are trained on high-speed, high-resolution void fraction data [3], have been introduced to facilitate the automatic recognition of flow regimes in two-phase systems. These innovative approaches hold the potential to enhance the precision of flow pattern identification and classification compared with traditional methods, offering new data-driven strategies for defining and analysing flow regimes in a more systematic and objective manner.
The existing body of literature on two-phase flow patterns is extensive; however, the flow dynamics and the resulting flow patterns within pulsating heat pipes (PHPs) remain inadequately explored. Typically, four distinct flow patterns can be identified within pulsating heat pipes: (i) bubbly or dispersed flow; (ii) slug flow, also referred to as slug/plug flow; (iii) semi-annular flow; and (iv) annular flow. It is common for two or more of these flow patterns to coexist in various sections of the same channel. In addition, the flow is characterised by inherent unsteadiness, which arises from alternating regions where liquid slugs occupy the entire cross-section of the pipe and areas where the flow comprises a liquid layer alongside a gas layer. The complexity of the flow structure is further increased by the simultaneous occurrence of regions exhibiting co-current flow, where both phases move in the same direction, and regions where the two phases are in counterflow, as observed when vapour bubbles advance toward the condenser while the surrounding liquid film is propelled back toward the evaporator [4,5].
An additional complication arises from the heterogeneity of the literature data due to the variety of heat transfer fluids utilised in the functioning of pulsating heat pipes. Besides water, two of the most common fluids used in PHPs are ethanol and perfluorohexane (FC-72), which exhibit significant differences in their properties, making them suitable for distinct heat transfer applications. Ethanol, a polar solvent with a relatively low boiling point of 78.4 °C, has high thermal conductivity and specific heat capacity, which allows it to efficiently absorb and transfer heat in various systems, particularly in cooling applications and heat exchangers. Its ability to mix with water also enhances its versatility in thermal management. In contrast, perfluorohexane, a non-polar, fluorinated hydrocarbon with a higher boiling point of 56.5 °C, offers exceptional thermal stability and low surface tension, making it ideal for applications requiring inertness and chemical resistance, such as in electronics cooling and specialised heat transfer fluids [6]. The non-polar nature of perfluorohexane also results in lower heat capacity compared with ethanol, which can limit its effectiveness in certain heat transfer scenarios. Overall, the choice between ethanol and perfluorohexane in heat transfer applications depends on the specific thermal properties required and the environmental conditions of the application.
The inherent complexity of the flow structure, coupled with the challenges associated with flow visualisation and intrusive measurements in pulsating heat pipes, has hindered a comprehensive characterisation of flow regimes. This limitation has consequently affected the development of reliable flow pattern maps that could serve as predictive instruments in the design of pulsating heat pipes (PHPs) and assist in conducting accurate numerical simulations. While several flow pattern maps have been established for mini- and micro-channels, there exists a scarcity of flow pattern maps specific for pulsating heat pipes. Initial efforts to systematically characterise flow patterns in pulsating heat pipes [7,8] have simply reported empirical findings in tabular format, correlating these observations with variables such as the heat input and the filling ratio. Typically, the heat input is utilised in the formulation of flow pattern maps, in conjunction with either the inclination angle or the number of turns [9,10].
Thongdaeng et al. [11] proposed a flow pattern map for a top heat, closed-loop pulsating heat pipe using as coordinates the momentum fluxes of the liquid and the vapour, respectively, calculated based on flow rate and temperature measurements. They identified six flow patterns, resulting from different combinations of elementary flow patterns: (I) slug, dispersed bubble, and annular flow; (II) slug, dispersed bubble, and churn flow; (III) slug, bubble, and annular flow; (IV) slug and dispersed bubble flow; (V) bubble and annular flows; and (VI) slug and annular flows. More recently, Bhardwaj and Das [12] developed an empirical flow pattern map for a two-phase thermosyphon using the condenser temperature and the wall superheat in the evaporator as coordinates. The obvious limitation of these approaches is they require the measurement of various quantities during the PHP operation, which is not simple, even in a laboratory environment; therefore, the relative flow pattern maps cannot be used as predictive tools. Moreover, the high spatial and temporal unsteadiness of the flow makes the choice of where and when such measurements should be carried out quite arbitrary, as well as the identification of suitable spatial and temporal averaging. Recent attempts to generate flow pattern maps for PHPs with the assistance of machine learning do not appear particularly successful to date [13], as opposed to their promising use in the automatic flow regime recognition of standard two-phase flows [3].
Historically, two-phase flow pattern maps have been constructed using two independent variables representative of the two phases, respectively, such as the superficial velocity of the liquid and the superficial velocity of the gas, or the corresponding Reynolds numbers. This approach is very common in the existing literature because flow patterns arise from the reciprocal distribution of the two phases within the channel, which in turn depend on the flow rates. However, due to the dynamic nature of pulsating heat pipes, which undergo rapid changes in the mass flow rate, pressure drop, rates of bubble growth and collapse, flow direction, and liquid film thickness, the superficial velocities of the liquid and vapour phases are unknown; therefore, they cannot be used as independent variables.
A less empirical approach to the construction of flow pattern maps consists of the characterisation of flow pattern transitions using suitable dimensionless numbers, such as the Bond, Weber, and Froude numbers, or modified versions of them, to account for the fluid acceleration and the bubble length [14]. Specifically, the modified dimensionless numbers used in these PHP flow pattern maps were originally introduced to characterise the breakup of isolated vapour slugs during saturated flow boiling; therefore, they may not be suitable to describe other flow pattern transition mechanisms. In particular, these numbers require the calculation of the acceleration of the liquid–vapour interface in the direction of the flow, based on the measurement of the meniscus velocity as well as the measurement of the bubble length. Thus, their calculation is possible only when a well-defined plug or slug flow is observed, and it becomes elusive in other cases, such as annular or churn flow. An additional limitation of this approach is that, at present, there is no consensus on which dimensionless numbers should be used as independent variables in the construction of flow pattern maps, which makes it difficult if not impossible to compare the maps produced by different authors with one another. Finally, it must be observed that the remarkably large number of experimental data points reported in these works do not correspond to distinct sets of design and operation parameters because they are generated by taking several measurements at different times during the pseudo-steady state operation of the PHP.
In the present work, it is proposed to overcome the limitations of existing ex post approaches to construct empirical flow pattern maps for pulsating heat pipes by introducing two fictitious quantities, having the dimensions of a velocity, which are representative of the superficial velocities of the two phases inside a pulsating heat pipe. These quantities are defined only based on the design and operation parameters of the PHP and are used as the independent variables in the construction of a flow pattern map, which therefore can be used as a predictive tool in designing PHPs. The proposed approach is then validated using flow visualisation experiments that record the flow patterns observed in the adiabatic section of a flat-plate polypropylene pulsating heat pipe under a wide range of design and operation parameters.
2. Methodology
2.1. Concept
The main idea underpinning the proposed approach to the construction of flow pattern maps is to identify two independent variables, to be used as map coordinates, that are expressed in terms of geometric and operation parameters and in terms of the fluid thermophysical properties so that the map can be used as a truly predictive tool in PHP design and simulation. In fact, with few exceptions, the construction of flow pattern maps available in the open literature requires the direct or indirect measurement of one or more flow parameters, which poses a severe limitation to the possibility of using these maps as predictive tools.
The distribution of the liquid and vapour phases is mainly driven by their volumetric fluxes, i.e., their superficial velocities, which are unknown a priori. However, because the velocity of each phase is determined by the balance of driving forces and resistances, it is possible to define two virtual (or “ideal”) superficial velocities based essentially on dimensional arguments. In particular, in PHPs, the liquid phase is driven by capillary forces and/or gravity, and the main resistance to flow is viscus friction; meanwhile, the vapour phase is driven by the heat input and/or buoyancy, and the flow is opposed by viscous friction as well as the latent heat of the fluid. Thus, the virtual superficial velocities of the liquid and the gas phase can be defined as:
where is the superficial velocity of the liquid, is the superficial velocity of the vapour, F is the filling ratio, is the surface tension at the saturation temperature, is the static contact angle, is the hydraulic diameter, and are, respectively, the liquid and vapour densities at the saturation temperature, is the PHP inclination angle, is the dynamic viscosity of the liquid at the saturation temperature, L is the length of the adiabatic section, is the heat input, N is the number of turns, and is the latent heat of the fluid. The first additive term in Equation (1) represents the relative importance of the capillary force with respect to the viscous friction, while the second term compares gravity and viscous friction. In Equation (2), the first additive term is representative of the relative importance of the heat input in comparison with the latent heat, while the second term expresses the relative importance of buoyancy and viscous friction for the vapour phase. Note that in Equation (1), the filling ratio is used as a correction factor for the viscous friction, while in Equation (2), it also accounts for the sensible heat of the liquid.
The virtual superficial velocities defined by Equations (1) and (2) are therefore derived through a carefully constructed dimensional analysis that captures the fundamental driving forces and resistances encountered by liquid and vapour phases within the pulsating heat pipe. In particular, for the liquid phase, the velocity encapsulates the interplay between capillary forces and viscous friction, incorporating additional gravitational effects. Similarly, for the vapour phase, they construct a velocity that reflects the relative significance of heat input against latent heat while also accounting for buoyancy and viscous friction.
By using these virtual superficial velocities as coordinate axes, one can therefore create a flow pattern map that can predict flow regimes before actual PHP operation. In other words, the approach provides a semi-theoretical framework for understanding flow pattern transitions and establishing a start-up criterion for pulsating heat pipes. The strength of the proposed methodology lies in its ability to generate a predictive tool using only design and operational parameters, thereby circumventing the challenges of intrusive measurements and the high spatial and temporal unsteadiness characteristic of the flow inside pulsating heat pipes.
2.2. Experiments
The proposed flow pattern map was validated using two independent datasets generated from flow visualisation experiments in the adiabatic section of a flat-plate polypropylene PHP measuring 250 mm in length, 100 mm in width, and 1.5 mm in thickness, which was fabricated via selective transmission laser welding.
The first dataset was obtained from flow visualisation experiments on three prototypes, each with a hydraulic diameter of the meandering channel equal to 1.23 mm and featuring three turns, five turns, and seven turns, respectively. For each prototype, experiments were carried out with inclinations of 0°, 45°, and 90° with respect to the horizontal axis and heat inputs ranging from 10 W to 25 W. Both ethanol and perfluorohexane (FC-72) were used as heat transfer fluids. High-speed video recordings of the flow pattern in the adiabatic section of the PHPs were captured at 500 fps using a CMOS camera (MC1362, Mikrotron GmbH, Eching, Germany) equipped with an 18-108/2.5 zoom lens (Zoom 7000, Navitar Inc., Rochester, NY, USA). To enhance the contrast of the fluid interface, a diffuse, uniform LED back-to-front illumination was used. The liquid–vapour interfaces were further enhanced by a proprietary digital image processing algorithm running in the Matlab environment, which performed background subtraction and adjusted the digital gain and gamma correction of the resultant images.
The second dataset was obtained from flow visualisation experiments carried out during the 77th ESA Parabolic Flight Campaign on two prototypes featuring seven turns and eleven turns in the meandering channel, with hydraulic diameters in the meandering channel equal to 1.23 mm and 1.13 mm, respectively. For each PHP prototype, experiments were carried out under standard (1 g) and zero-gravity (0 g) conditions, featuring heat inputs ranging from 20 W to 35 W and using ethanol and FC-72 as heat transfer fluids. High-speed videos of the flow pattern in the adiabatic section of the PHPs were captured at 100 fps using both a CMOS camera (XiQ, Ximea GmbH, Münster, Germany) and an FLIR high-speed camera (FAST-IR M100K, Telops Inc, Québec City, Canada). The geometries of the four PHP prototypes considered in the present work are displayed in Figure 1, while Figure 2 shows the schematic layouts of the two experimental kits.
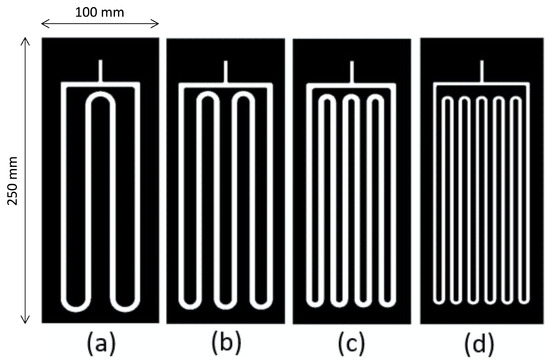
Figure 1.
Prototype pulsating heat pipes with 3-turn (a), 5-turn (b), 7-turn (c), and 11-turn (d) serpentine channels. The meandering channel has a rectangular cross-section with a 0.7 mm thickness and widths of 5 mm (3 turns, 5 turns, and 7 turns) and 3 mm (11 turns).
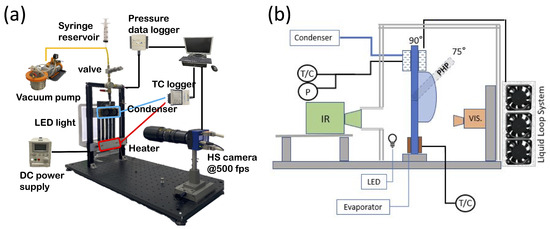
Figure 2.
Schematic layout of the two experimental kits used. (a) Ground experiments. (b) Parabolic flight experiments, incorporating visualisation systems for the visible (VIS) and infrared (IR) spectra.
3. Results
3.1. Flow Patterns
The identification of flow patterns in pulsating heat pipes is significantly more difficult than in steady-state two-phase flows in straight channels. If the serpentine channel is unbent and put to straight, the flow experiences alternating heating and cooling at regular intervals; in addition, gravity exerts opposing forces in adjacent sections of the channel. As a consequence, the flow structure is not uniform in the parallel sections of the PHP channel and is strongly time-dependent. This also means one can observe different flow patterns in the same section of the channel at different times. Due to the variety of PHP geometries, arrangements, and operating conditions, along with the relatively limited amount of experimental data available, the definition of flow patterns in PHPs is still highly subjective, and the observed flow patterns and flow pattern transitions can be considerably different from those observed in straight channels.
Examples of the flow patterns observed in the adiabatic section of flat-plate polypropylene PHPs during ground experiments with different design parameters and different experimental conditions are displayed in Figure 3, while Figure 4 shows examples of infrared images of the flow patterns observed during parabolic flight experiments. In particular, during these experiments, four different combinations of flow patterns were observed: bubbles flow or bubbles and elongated bubbles or plug flow (e.g., Figure 3b); bubbles and churn flow (e.g., Figure 3c); bubbles, plug/slug flow, and churn flow (e.g., Figure 3d and Figure 4a,b); and bubbles, slug flow, and annular flow (e.g., Figure 4c,d). In addition, in a number of cases, no flow is observed (e.g., Figure 3a).
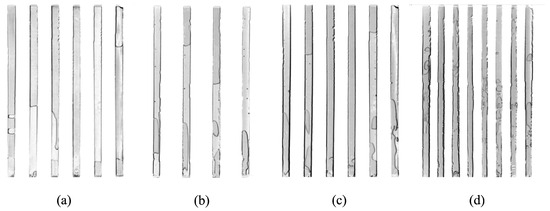
Figure 3.
Examples of flow patterns observed during ground experiments for different numbers of turns, different fluids, different heat inputs, and different orientations with respect to the horizontal, . (a) Five turns, ethanol, 10 W, ; (b) three turns, ethanol, 15 W, ; (c) five turns, ethanol, 20 W, ; (d) seven turns, FC-72, 25 W, . See the corresponding Supplementary Videos S1–S4.
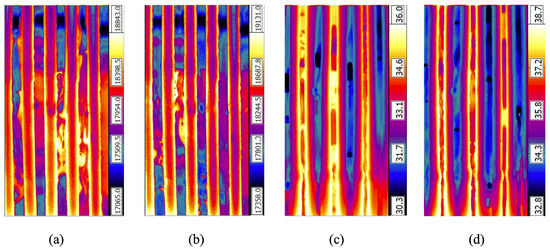
Figure 4.
Examples of the FLIR images of flow patterns observed in different PHP prototypes with vertical orientation () and filled with FC-72 during parabolic flight experiments in normal gravity conditions (1 g). (a) Seven turns, FC-72, 20 W, ; (b) seven turns, FC-72, 30 W, ; (c) eleven turns, FC-72, 25 W, ; (d) eleven turns, FC-72, 35 W, . Colour bars indicate temperature variations in arbitrary units. See the corresponding Supplementary Videos S5–S8.
Notably, the absence of flow is observed in case of either horizontal inclination or zero gravity, which means this type of pulsating heat pipe requires the assistance of gravity to induce the flow; therefore, it works essentially as a thermosyphon. When flow is observed, in most cases, it consists of oscillations between the evaporator and the condenser in the straight sections of the meandering channel. A continuous and uni-directional flow in the closed-loop channel, resulting in a pattern of alternating flows from the evaporator to the condenser and from the condenser to the evaporator in adjacent parallel sections of the channel in the adiabatic region of the PHP, can be observed only in the case of the 11-turn prototype, as shown in Figure 4c,d.
3.2. Flow Pattern Map
Figure 5 displays the flow pattern map constructed using the ideal superficial velocities defined above as independent variables for a selection of flat-plate PHPs, with different geometries (three turns, five turns, seven turns, and eleven turns, respectively) containing either ethanol or FC-72 as heat transfer fluids and operating under different conditions of heat input and orientation with respect to gravity. For the sake of clarity and accessibility of information, the map is presented in both semilogarithmic (Figure 5a) and linear (Figure 5b) coordinates. The points corresponding to the four different combinations of flow patterns described above, as well as the points corresponding to cases where no flow can be observed, are located in well-distinguished regions of the map, thereby demonstrating the effectiveness of the proposed approach.
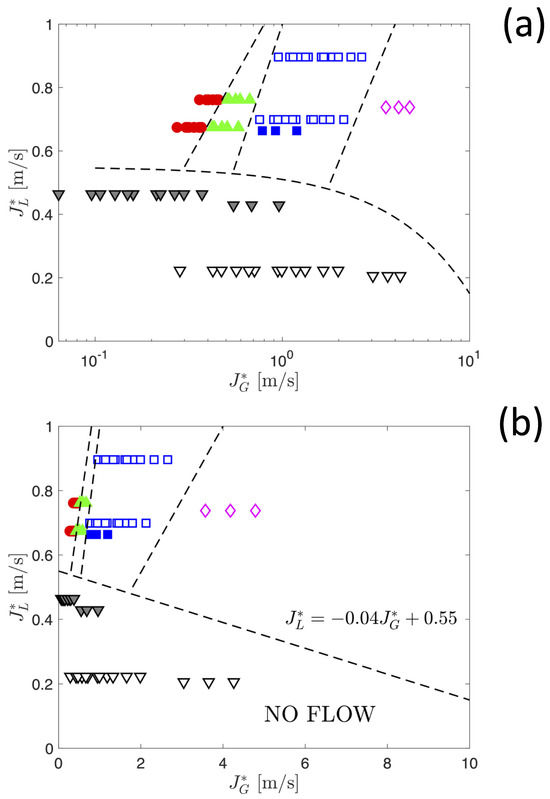
Figure 5.
Empirical flow pattern map for a flat-plate pulsating heat pipe based on the virtual superficial velocities of the liquid and vapour phase in semilogarithmic coordinates (a) and linear coordinates (b). (▽): No flow; (◯): bubbles or bubbles and plug flow; (△): bubbles and churn flow; (□): bubbles, plug/slug, and churn flow; (⋄): bubbles, slug, and annular flow. Filled symbols indicate experiments carried out using ethanol, while open symbols correspond to experiments carried out using perfluorohexane FC-72. Discontinuous lines are provided as a guide to the eye to identify empirical transition boundaries between different flow patterns.
The distribution of experimental points on the flow pattern map shows that when subjected to comparable operating conditions, the gas velocity in the case of FC-72 is greater than that of ethanol, which can be attributed to the difference in their respective thermophysical properties. Furthermore, it is observed that as the number of turns within the PHP increases, alongside an escalation in the heat input applied, the gas velocity also experiences an increase, while the liquid velocity tends to remain relatively constant, a behaviour that can be primarily ascribed to the dominance of capillarity as the principal driving force governing liquid flow within the system.
The region of the map corresponding to the absence of flow is located, as expected, at low magnitudes of the virtual superficial velocities, i.e., in the bottom-left part of the map. Such a distribution of experimental points suggests that an empirical criterion to determine the onset of flow in the meandering channel, i.e., the PHP start-up, can be formulated in the first approximation as a linear relationship between the virtual superficial velocities:
where and are empirical constants which, for the experimental dataset considered, are equal to m/s and m/s, respectively. The start-up limit defined by Equation (3) is clearly visualised using the linear coordinates of Figure 5b.
As a final remark, the magnitude of the virtual superficial velocities defined in Equations (1) and (2) which, in the present study, spans from 0.1 m/s to 1.5 m/s, is consistent with measurements of bubble or slug velocities reported in the literature [15,16,17,18].
4. Conclusions
The innovative methodology proposed in this study represents a significant advancement in understanding and predicting flow patterns within pulsating heat pipes (PHPs). By introducing the novel concept of virtual superficial velocities for liquid and vapour phases, a predictive tool that transcends the limitations of existing approaches has been developed. Unlike previous methodologies that relied on intrusive measurements during PHP operation, this approach uniquely derives flow pattern characterisations solely from design and operational parameters.
The proposed approach has been validated on flat-plate polypropylene PHP prototypes with varying channel geometries, different working fluids (ethanol and perfluorohexane), and different operational conditions. The resulting flow pattern map revealed well-distinguished areas for the different flow patterns observed, unlike most of the existing maps.
An additional benefit of the proposed method is the formulation of an empirical start-up criterion, expressed as a linear relationship between virtual superficial velocities, which could prove useful at the stage of preliminary PHP design and optimisation.
Although further validation in a broader range of operational parameters and PHP designs is necessary, the proposed approach has a potential that extends beyond its current implementation, offering a promising foundation for predictive modelling in thermal management systems.
Supplementary Materials
Author Contributions
Conceptualization, V.B.; Formal analysis, V.B.; Investigation, A.A.A.; Writing—original draft, V.B.; Writing—review & editing, V.B.; Supervision, V.B.; Project administration, V.B.; Funding acquisition, V.B. All authors have read and agreed to the published version of the manuscript.
Funding
This work was carried out in the framework of the project “Two-Phase Passive Thermal Devices for Deployable Space Systems (TOPDESS),” funded through the Microgravity Application Program (No. 4000128640) by the European Space Agency.
Data Availability Statement
Data provided as Supplementary Videos.
Acknowledgments
A.A. Alqahtani gratefully acknowledges a doctoral studentship from the Saudi Ministry for Education (King Khalid University). For the purpose of open access, the authors have applied a Creative Commons Attribution (CC-BY) licence to any author-accepted manuscript version arising from this submission.
Conflicts of Interest
The authors declare no conflicts of interest.
References
- Cheng, L.; Ribatski, G.; Thome, J.R. Two-Phase Flow Patterns and Flow-Pattern Maps: Fundamentals and Applications. Appl. Mech. Rev. 2008, 61, 050802. [Google Scholar] [CrossRef]
- Malakhov, I.; Seredkin, A.; Chernyavskiy, A.; Serdyukov, V.; Mullyadzanov, R.; Surtaev, A. Deep learning segmentation to analyze bubble dynamics and heat transfer during boiling at various pressures. Int. J. Multiph. Flow 2023, 162, 104402. [Google Scholar] [CrossRef]
- Breitenmoser, D.; Prasser, H.M.; Manera, A.; Petrov, V. Machine learning based flow regime recognition in helically coiled tubes using X-ray radiography. Int. J. Multiph. Flow 2023, 161, 104382. [Google Scholar] [CrossRef]
- Nagasato, N.; Pei, Z.; Koito, Y. Flow Patterns and Heat Transfer Characteristics of a Polymer Pulsating Heat Pipe Filled with Hydrofluoroether. Front. Heat Mass Transf. 2024, 22, 49–63. [Google Scholar] [CrossRef]
- Su, Z.; Hu, Y.; Zheng, S.; Wu, T.; Liu, K.; Zhu, M.; Huang, J. Recent advances in visualization of pulsating heat pipes: A review. Appl. Therm. Eng. 2023, 221, 119867. [Google Scholar] [CrossRef]
- Becker, W. Use of Highly Fluorinated Compositions as a Heat-Carrier. EP0612825B1, 31 August 1994. [Google Scholar]
- Liu, S.; Li, J.; Dong, X.; Chen, H. Experimental study of flow patterns and improved configurations for pulsating heat pipes. J. Therm. Sci. 2007, 16, 56–62. [Google Scholar] [CrossRef]
- Goshayeshi, H.R.; Chaer, I. Experimental study and flow visualization of Fe2O3/kerosene in glass oscillating heat pipes. Appl. Therm. Eng. 2016, 103, 1213–1218. [Google Scholar] [CrossRef]
- Shi, Y.; Xu, D.; Yan, J.; Guo, R.; Lyu, B.; Huang, C.; Li, L. Visualized investigation of a nitrogen pulsating heat pipe. Cryogenics 2024, 138, 103783. [Google Scholar] [CrossRef]
- Rudresha, S.; Babu, E.; Thejaraju, R. Experimental investigation and influence of filling ratio on heat transfer performance of a pulsating heat pipe. Therm. Sci. Eng. Prog. 2023, 38, 101649. [Google Scholar] [CrossRef]
- Thongdaeng, S.; Bubphachot, B.; Rittidech, S. Two-phase flow patterns of a top heat mode closed loop oscillating heat pipe with check valves (THMCLOHP/CV). J. Appl. Mech. Tech. Phys. 2016, 57, 1101–1107. [Google Scholar] [CrossRef]
- Bhardwaj, U.; Das, S.P. Operational regimes in a confined pulsatory two-phase thermosyphon. Therm. Sci. Eng. Prog. 2022, 30, 101233. [Google Scholar] [CrossRef]
- Ahmad, H.; Kim, S.K.; Park, J.H.; Jung, S.Y. Development of two-phase flow regime map for thermally stimulated flows using deep learning and image segmentation technique. Int. J. Multiph. Flow 2022, 146, 103869. [Google Scholar] [CrossRef]
- Slobodeniuk, M.; Ayel, V.; Bertossi, R.; Romestant, C.; Bertin, Y. Experimental study of two- phase flow inside flat plate pulsating heat pipe operating under μ-gravity. In Proceedings of the Congrès Annuel de la Société Française de Thermique 2022, Valenciennes, France, 31 May–3 June 2022. [Google Scholar]
- Xu, J.; Li, Y.; Wong, T. High speed flow visualization of a closed loop pulsating heat pipe. Int. J. Heat Mass Transf. 2005, 48, 3338–3351. [Google Scholar] [CrossRef]
- Xue, Z.H.; Qu, W. Experimental and theoretical research on a ammonia pulsating heat pipe: New full visualization of flow pattern and operating mechanism study. Int. J. Heat Mass Transf. 2017, 106, 149–166. [Google Scholar] [CrossRef]
- Borgmeyer, B.; Ma, H.B. Experimental Investigation of Oscillating Motions in a Flat Plate Pulsating Heat Pipe. J. Thermophys. Heat Transf. 2007, 21, 405–409. [Google Scholar] [CrossRef]
- Patel, V.M.; Mehta, H.B. Channel wise displacement-velocity-frequency analysis in acetone charged multi-turn Closed Loop Pulsating Heat Pipe. Energy Convers. Manag. 2019, 195, 367–383. [Google Scholar] [CrossRef]
Disclaimer/Publisher’s Note: The statements, opinions and data contained in all publications are solely those of the individual author(s) and contributor(s) and not of MDPI and/or the editor(s). MDPI and/or the editor(s) disclaim responsibility for any injury to people or property resulting from any ideas, methods, instructions or products referred to in the content. |
© 2024 by the authors. Licensee MDPI, Basel, Switzerland. This article is an open access article distributed under the terms and conditions of the Creative Commons Attribution (CC BY) license (https://creativecommons.org/licenses/by/4.0/).