Article

Mechanical Characterization of Main Minerals in Carbonate Rock at the Micro Scale Based on Nanoindentation

1
Chongqing Gas Mine, Petro China Southwest Oil and Gasfield Company, Chongqing 400700, China
2
State Key Laboratory of Oil and Gas Reservoir Geology and Exploitation, Southwest Petroleum University, Chengdu 610500, China
*
Author to whom correspondence should be addressed.
Processes 2024, 12(12), 2727; https://doi.org/10.3390/pr12122727
Submission received: 14 October 2024 / Revised: 14 November 2024 / Accepted: 21 November 2024 / Published: 2 December 2024
(This article belongs to the Special Issue Advances in Enhancing Unconventional Oil/Gas Recovery, 2nd Edition)

Abstract

:
The mechanical characterization of carbonate rock is crucial for the development of a hydrocarbon reservoir and underground gas storage. As a kind of natural composite material, the mechanical properties of carbonate rock exhibit multiscale characteristics. The macroscopic mechanical properties of carbonate rock are determined by the mineral composition and structure at the micro scale. To achieve a mechanical investigation at the micro scale, this study designed a scheme for micromechanical characterization of carbonate rock. First, scanning electron microscope observation and energy dispersive spectroscopy analysis were combined to select the appropriate micromechanical test areas and to identify the mineral types in each area. Second, the selected test area was positioned in the nanoindentation instrument through the comparison of different-type microscopic images. Finally, quasi-static nanoindentation was carried out on the surface of different minerals in the selected test area to obtain quantitative mechanical evaluation results. A typical carbonate rock sample from the Huangcaoxia gas storage was investigated in this study. The experimental results indicated apparent micromechanical heterogeneity in the carbonate rock. The Young’s modulus of pyrite was over 200 GPa, while that of clay minerals was only approximately 50 GPa. In addition, the proposed micromechanical characterization scheme was discussed based on experimental results. For minerals with an unknown Poisson’s ratio, the maximum error introduced by the 0.25 assumption was lower than 15%. To discuss the effectiveness of the nanoindentation results, the characterization abilities constituted by lateral spatial resolution and elastic response depth were analyzed. The analysis results revealed that the nanoindentation measurement of clay was more susceptible to influence by the surrounding environment as compared to other kinds of minerals with the experimental setup in this study. The micromechanical characterization scheme for clay minerals can be optimized in future research. The mechanical data obtained at the micro scale can be used for the interpretation of the macroscopic mechanical features of carbonate rock for the parameter input and validation of mineral-related simulation and for the construction of a mechanical upscaling model.

1. Introduction

Carbonate rock is of great significance for oil and gas reservoirs, and the mechanical behavior of carbonate rock plays an important role in different engineering practices. For acid-fracturing stimulation, the mechanical evaluation of carbonate rock serves as the basis of the design of reservoir reformation [1,2]. For CO2 geological sequestration, the study on the influence of supercritical CO2 on the mechanical properties of carbonate rock provides theoretical fundamentals for relevant sequestration activities [3,4]. For gas storage construction, the mechanical features of carbonate formation constitute the key factors of the determination of the maximum operating pressure and expansion potential [5,6].
Macroscopic mechanical experiments are an effective way to obtain the overall mechanical evaluation of rock samples. The macroscopic test results can be influenced by many factors, including the mechanical properties of the rock, the test temperature, and the saturated fluid. For example, the strength and elastic modulus of claystone can be largely reduced by water [7]. In previous works, various macroscopic mechanical test methods such as uniaxial/triaxial compression, semicircular bending, and the sound velocity test, were usually carried out to measure the mechanical parameters [8,9,10], analyze the failure mode [11,12], investigate the brittle-to-ductile transition mechanisms [13,14], and study the influence of extraneous fluid on the mechanical performance [15] of carbonate rock. As a kind of natural composite material, the mechanical properties of carbonate rock are mainly determined by its constituents and structure at the micro scale. Therefore, the systematic characterization of microscopic mechanical properties can assist with the understanding and prediction of macroscopic mechanical behaviors. Due to the limitation of spatial resolution, conventional macroscopic mechanical test methods can only achieve the mechanical evaluation of the whole rock. Some extant research attempted to provide microscale interpretation of the overall mechanical performance of carbonate rock, but it was usually realized through the analysis of the correlation between the macroscopic mechanical parameters and mineralogical composition or between the microscope observation of characteristic constituents and textures [16,17,18]. The direct mechanical characterization of the minerals in carbonate rock remains a challenge.
In recent years, the newly developed micromechanical test technologies, including nanoindenter-based quasi-static nanoindentation and modulus mapping, atomic force microscope (AFM)-based PeakForce quantitative nanomechanical mapping, nano-dynamic mechanical analysis, and the contact resonance method, have constituted effective approaches to determining the mechanical properties of a single constituent in composite materials at the micro scale [19,20,21,22,23]. Among these approaches, nanoindentation is generally treated as the most accurate method and usually used to determine the properties of the reference sample for the calibration of other micromechanical test technologies [24]. Nanoindentation has been widely applied to the investigation of the microscopic mechanical behavior of organic-rich shale and granite. Bennett et al. [25] coupled a focused ion beam (FIB) with nanoindentation to obtain the mechanical properties of different micro-constituents in Woodford shale at various lengths of scales. Yang et al. [26] conducted mineral-positioned nanoindentation and discussed the indentation size effect and substrate effect of shale matrix minerals. Zhao et al. [27] employed a combination of nanoindentation and geochemical characterization to study the influence of organic type and thermal maturation on the mechanical properties of organic matter in shale. Liu et al. [28] performed grid indentation to observe the mechanical weakening due to the effect of water-shale interactions. Mo et al. [29] characterized the mechanical evolution of the representative minerals in granite in the heating-cooling cycle in real time by using the high-temperature nanoindentation technique, and Li et al. [30] further analyzed the influence of heating and cooling rates. Liu et al. [31] measured the Young’s modulus and hardness of the mineral interfaces in granites using nanoindentation and linked the micromechanical properties to the crack propagation paths presented in the micro X-Ray-computed tomography images. The aforementioned works prove that nanoindentation is a powerful tool for the study of various micromechanical research problems in the fields of shale oil and gas development and geothermal resource utilization. However, there is a lack of reported micromechanical studies on carbonate rock to date.
This work systematically researched the micromechanical properties of a typical carbonate rock sample from the Huangcaoxia gas storage. Scanning electron microscope (SEM) observation, energy-dispersive spectrometer (EDS) analysis, and nanoindentation were combined to develop a micromechanical characterization scheme suitable for carbonate rock. In addition, the Young’s modulus and nanoindentation hardness of the main minerals in the carbonate rock sample were obtained by a nanoindentation test. The micromechanical heterogeneity and the characterization scheme designed for the carbonate rock were discussed based on the experimental results.

2. Materials and Methods

2.1. Sample Information

The test core was the grown-gray carbonate rock of the Lower Triassic Jialingjiang Formation, collected from the CC1 well in the Huangcaoxia gas storage. Powder X-Ray analysis was performed to determine the mineral composition. The result indicated that the rock sample was mainly constituted by dolomite and anhydrite, which composed 64.1% and 23.8% of the weight, respectively. The remaining minerals were clay (5.8%), quartz (5.4%), and pyrite (0.9%). From SEM observation, it was found that the characteristic size of the majority of the minerals was larger than 5 μm (Figure 1), but the situation of the clay minerals was different. As a kind of phyllosilicate mineral, clay was usually distributed among other granular minerals, and the width of each clay fiber was generally only 1~2 μm.
Unlike macroscopic mechanical test methods, nanoindentation only requires a small volume of rock sample, and even rock chips and cuttings from drilling operation can be used for the test [32]. In this work, a cuboid rock block of 7 mm × 7 mm × 4 mm was cut from the carbonate core. The size of the sample was markedly larger than that of the minerals in the rock block (Figure 1), which satisfied the test demand. Then, all of the six faces were mechanically polished to decrease the surface’s roughness and guarantee that the corresponding faces were parallel to each other, respectively. Finally, a 7 mm × 7 mm face was selected as the observation face and underwent ion polishing (EM TIC 3X, Leica, Wetzlar, Germany) to further decrease the surface roughness. The average surface roughness in a region of 20 μm × 20 μm was lower than 100 nm, which satisfied the surface condition demand of the micromechanical test [33].

2.2. Experimental Principle

The micromechanical test method involved in this research is quasi-static nanoindentation, which is based on contact mechanics [34]. When performing nanoindentation, an indenter with a known geometry and tip material is pressed into the sample surface at a certain speed until the maximum load or displacement is met. Then, after a load-holding segment, the indenter is withdrawn from the sample. The reduced modulus Er and nanoindentation hardness H can be obtained through the analysis of the load-displacement data (Figure 2) recorded during the nanoindentation measurement [35,36]:
E r = π 2 S A
H = P max A
where Pmax is the maximum load, and S, the unloading stiffness, is the initial slope of the unloading segment of the load-displacement curve. The unloading data is fitted to a power law equation:
P = a ( h h f ) m
where h is the displacement of the indenter, and a, hf, and m are the fitting parameters. Then, the unloading stiffness S can be found by analytically differentiating Equation (3) and evaluating the derivative at the maximum load and displacement. In Equations (1) and (2), A is the contact area of the indenter tip on the sample surface, which can be determined by using the calibrated area function:
A = 24.5 h c 2 + C 1 h c 1 + C 2 h c 1 / 2 + C 3 h c 1 / 4 + + C 8 h c 1 / 128
where hc is the contact depth of the indenter, and C1 to C8 are fitting constants. The contact depth can be computed through the relation to the maximum displacement hmax:
h c = h max β P max S
where β is the geometric constant corresponding to the shape of the indenter.
The reduced modulus is influenced by both the properties of the indenter tip and the sample. The corresponding Young’s modulus of the sample can be determined by the following equation [37]:
E = 1 v 2 1 E r 1 v tip 2 E tip
where v is the Poisson’s ratio of the indentation region on the sample surface, and Etip and vtip are the Young’s modulus and Poisson’s ratio of the indenter tip, respectively.

2.3. Experimental Scheme

2.3.1. Test Area Observation and Selection

The carbonate block was put into an environmental scanning electron microscope (ESEM, Quattro S, Thermo Fisher, Waltham, MA, USA). To avoid the influence of coating material on the micromechanical test, the sample was uncoated and directly observed at a low-vacuum condition at an accelerating voltage of 15 kV. Representative test areas were selected, and an EDS analysis was carried out to assist with the mineralogical identification in each test area (Figure 3).

2.3.2. Test Area Positioning

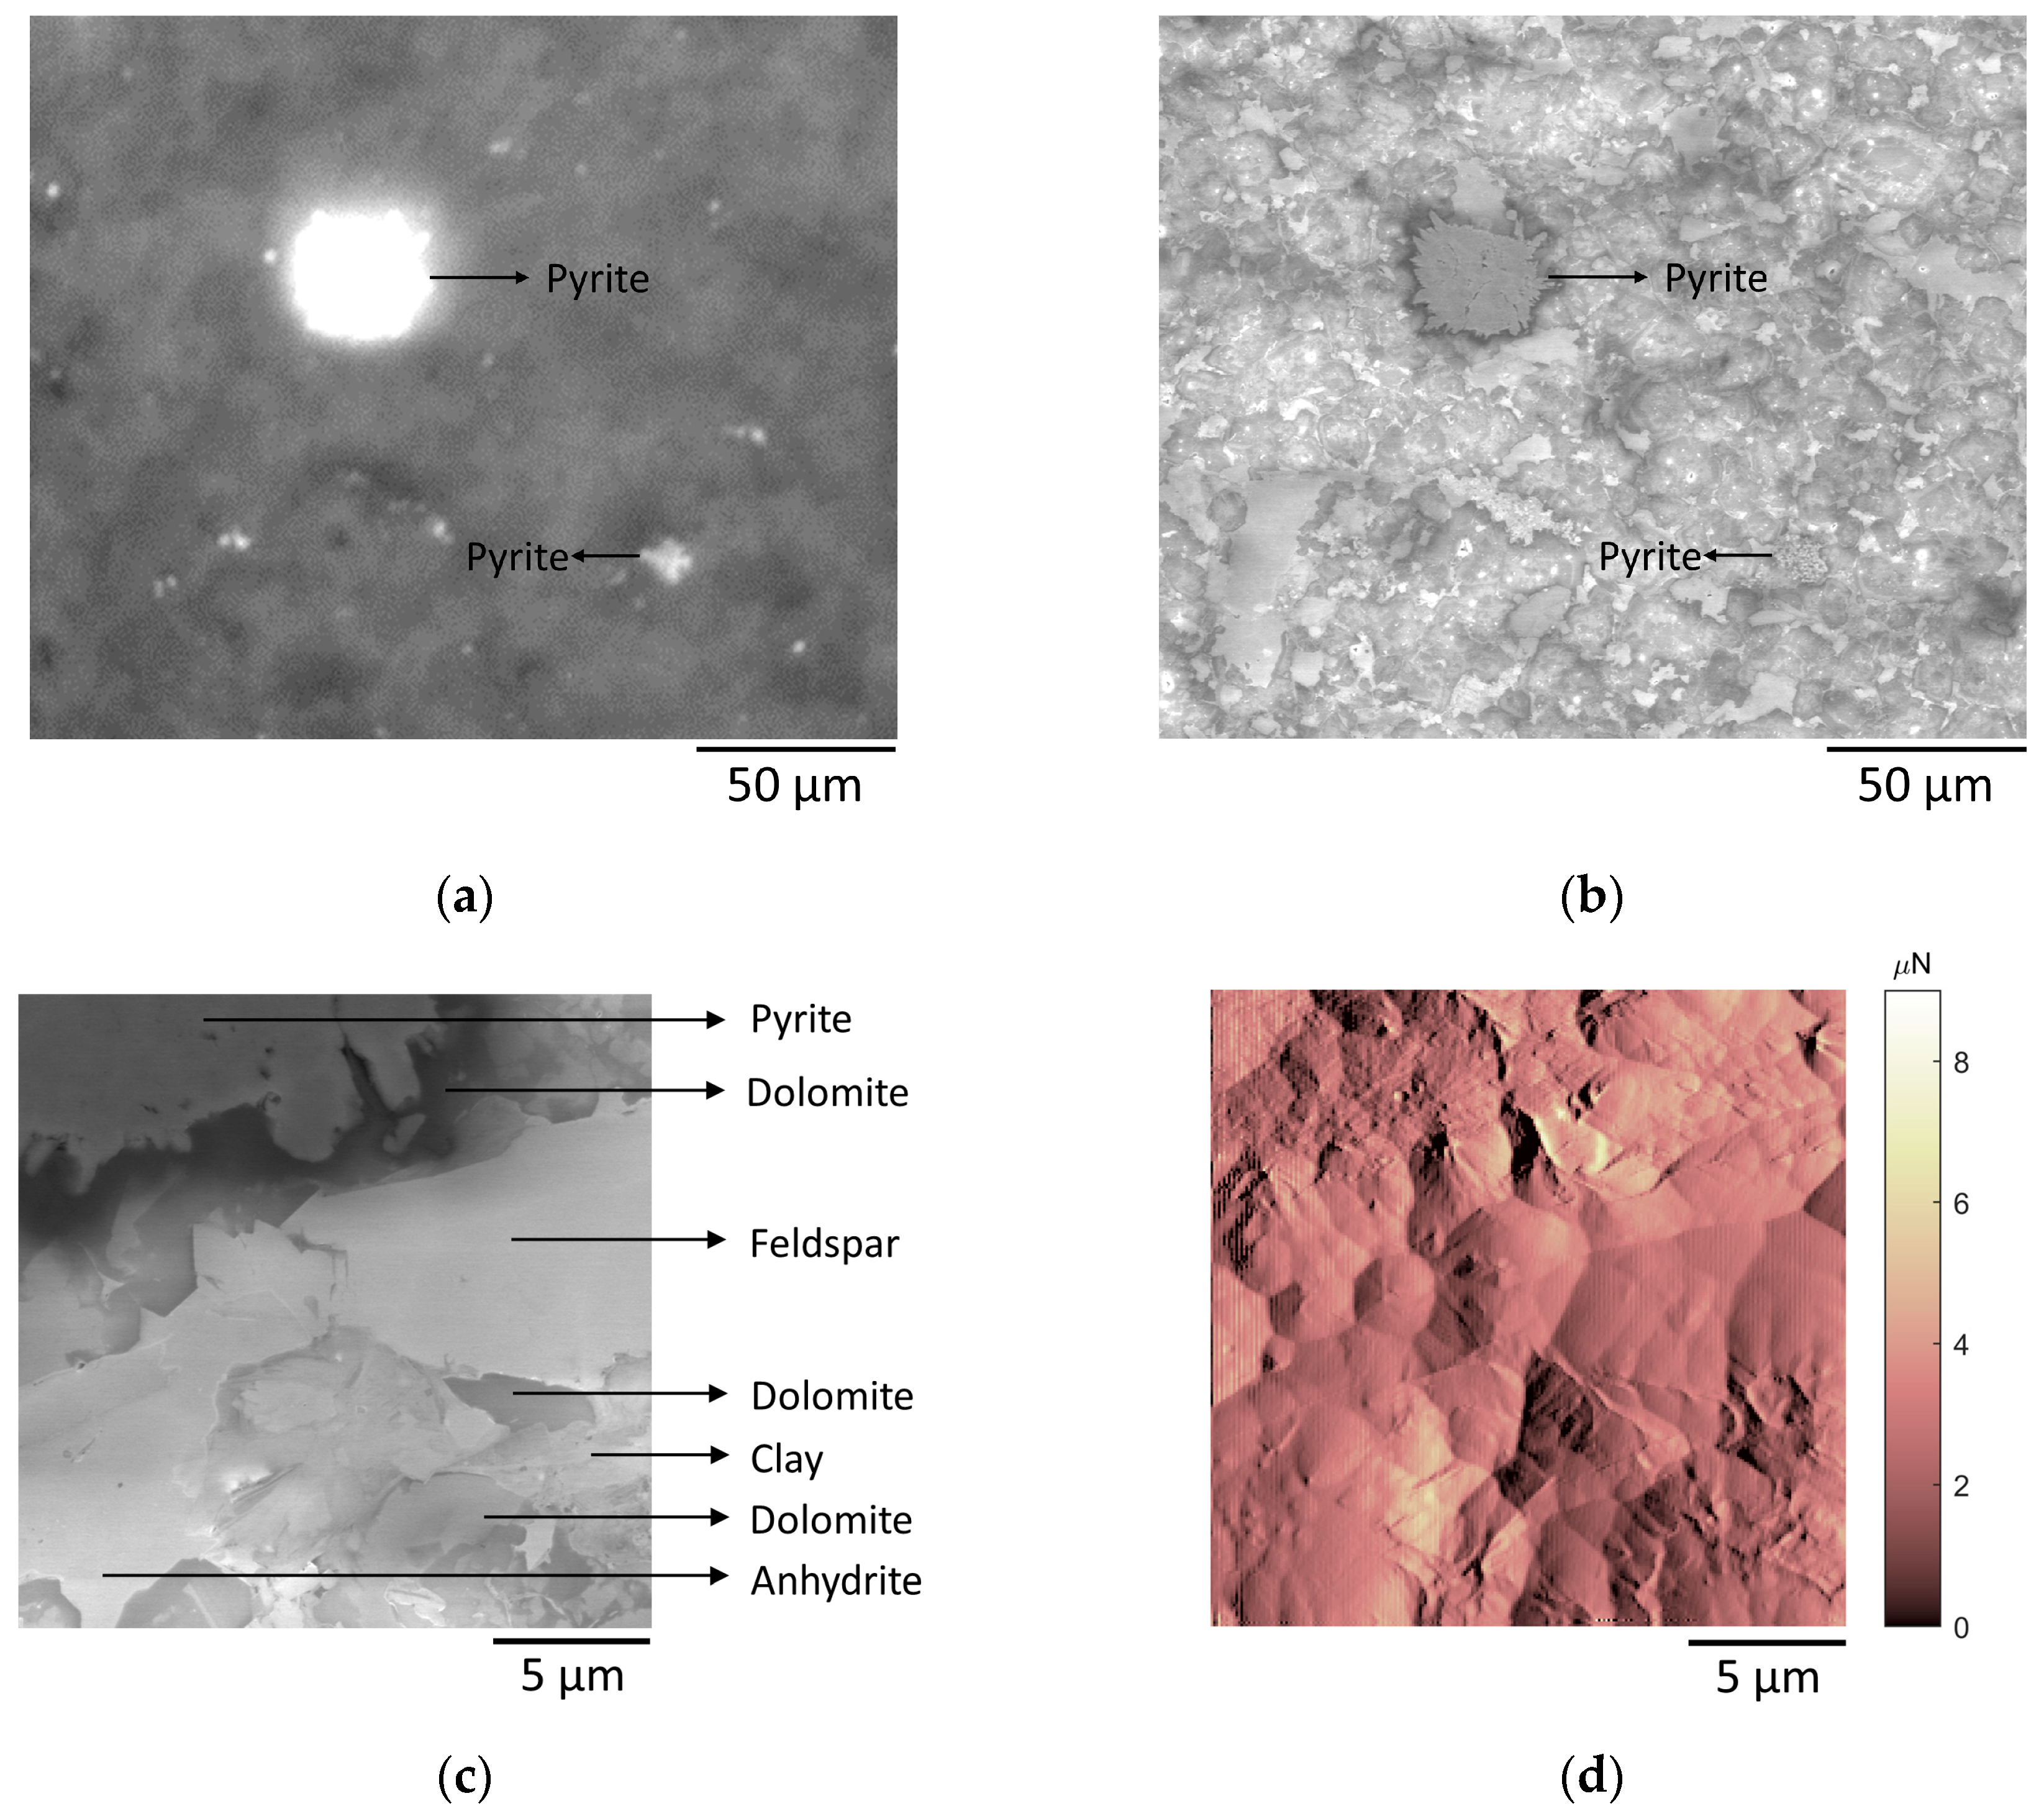
The carbonate block was transferred from the ESEM to a nanoindenter (TriboIndenter 900, Hysitron, Minneapolis, MN, United States) after the test area selection. Precisely positioning the selected test area in the nanoindenter is challenging. For one thing, the maximum magnification of the optical microscope equipped in the nanoindenter is markedly lower than that of the ESEM. For another thing, the image-contrast principles of the two kinds of microscope are different, which means that a certain mineral may show a different brightness and color under different microscopes. A two-step test area positioning scheme was designed to solve these two problems. First, the low-magnification (<1000×) SEM images were compared with the optical microscope images, and the test area was initially positioned through the observation of the characteristic mineral. In this study, pyrite was treated as the characteristic mineral because it was easy to identify in both the optical microscope image and the SEM image (Figure 4a,b). Then, scanning-probe microscopy (SPM) was performed at the coarsely determined position. The SPM image was compared with the high-magnification (>8000×) SEM image to achieve precise positioning (Figure 4c,d). During the SPM test, the indenter was driven by a periodically oscillating force and scanned the sample surface at a preset scanning rate, and an image constituted by 256 × 256 data points of contact force between the indenter tip and the sample was obtained. The scanning size was 20 μm × 20 μm, the scanning rate was 0.2 Hz, and the load setpoint and load amplitude were 2 μN and 1 μN, respectively.

2.3.3. Nanoindentation Test

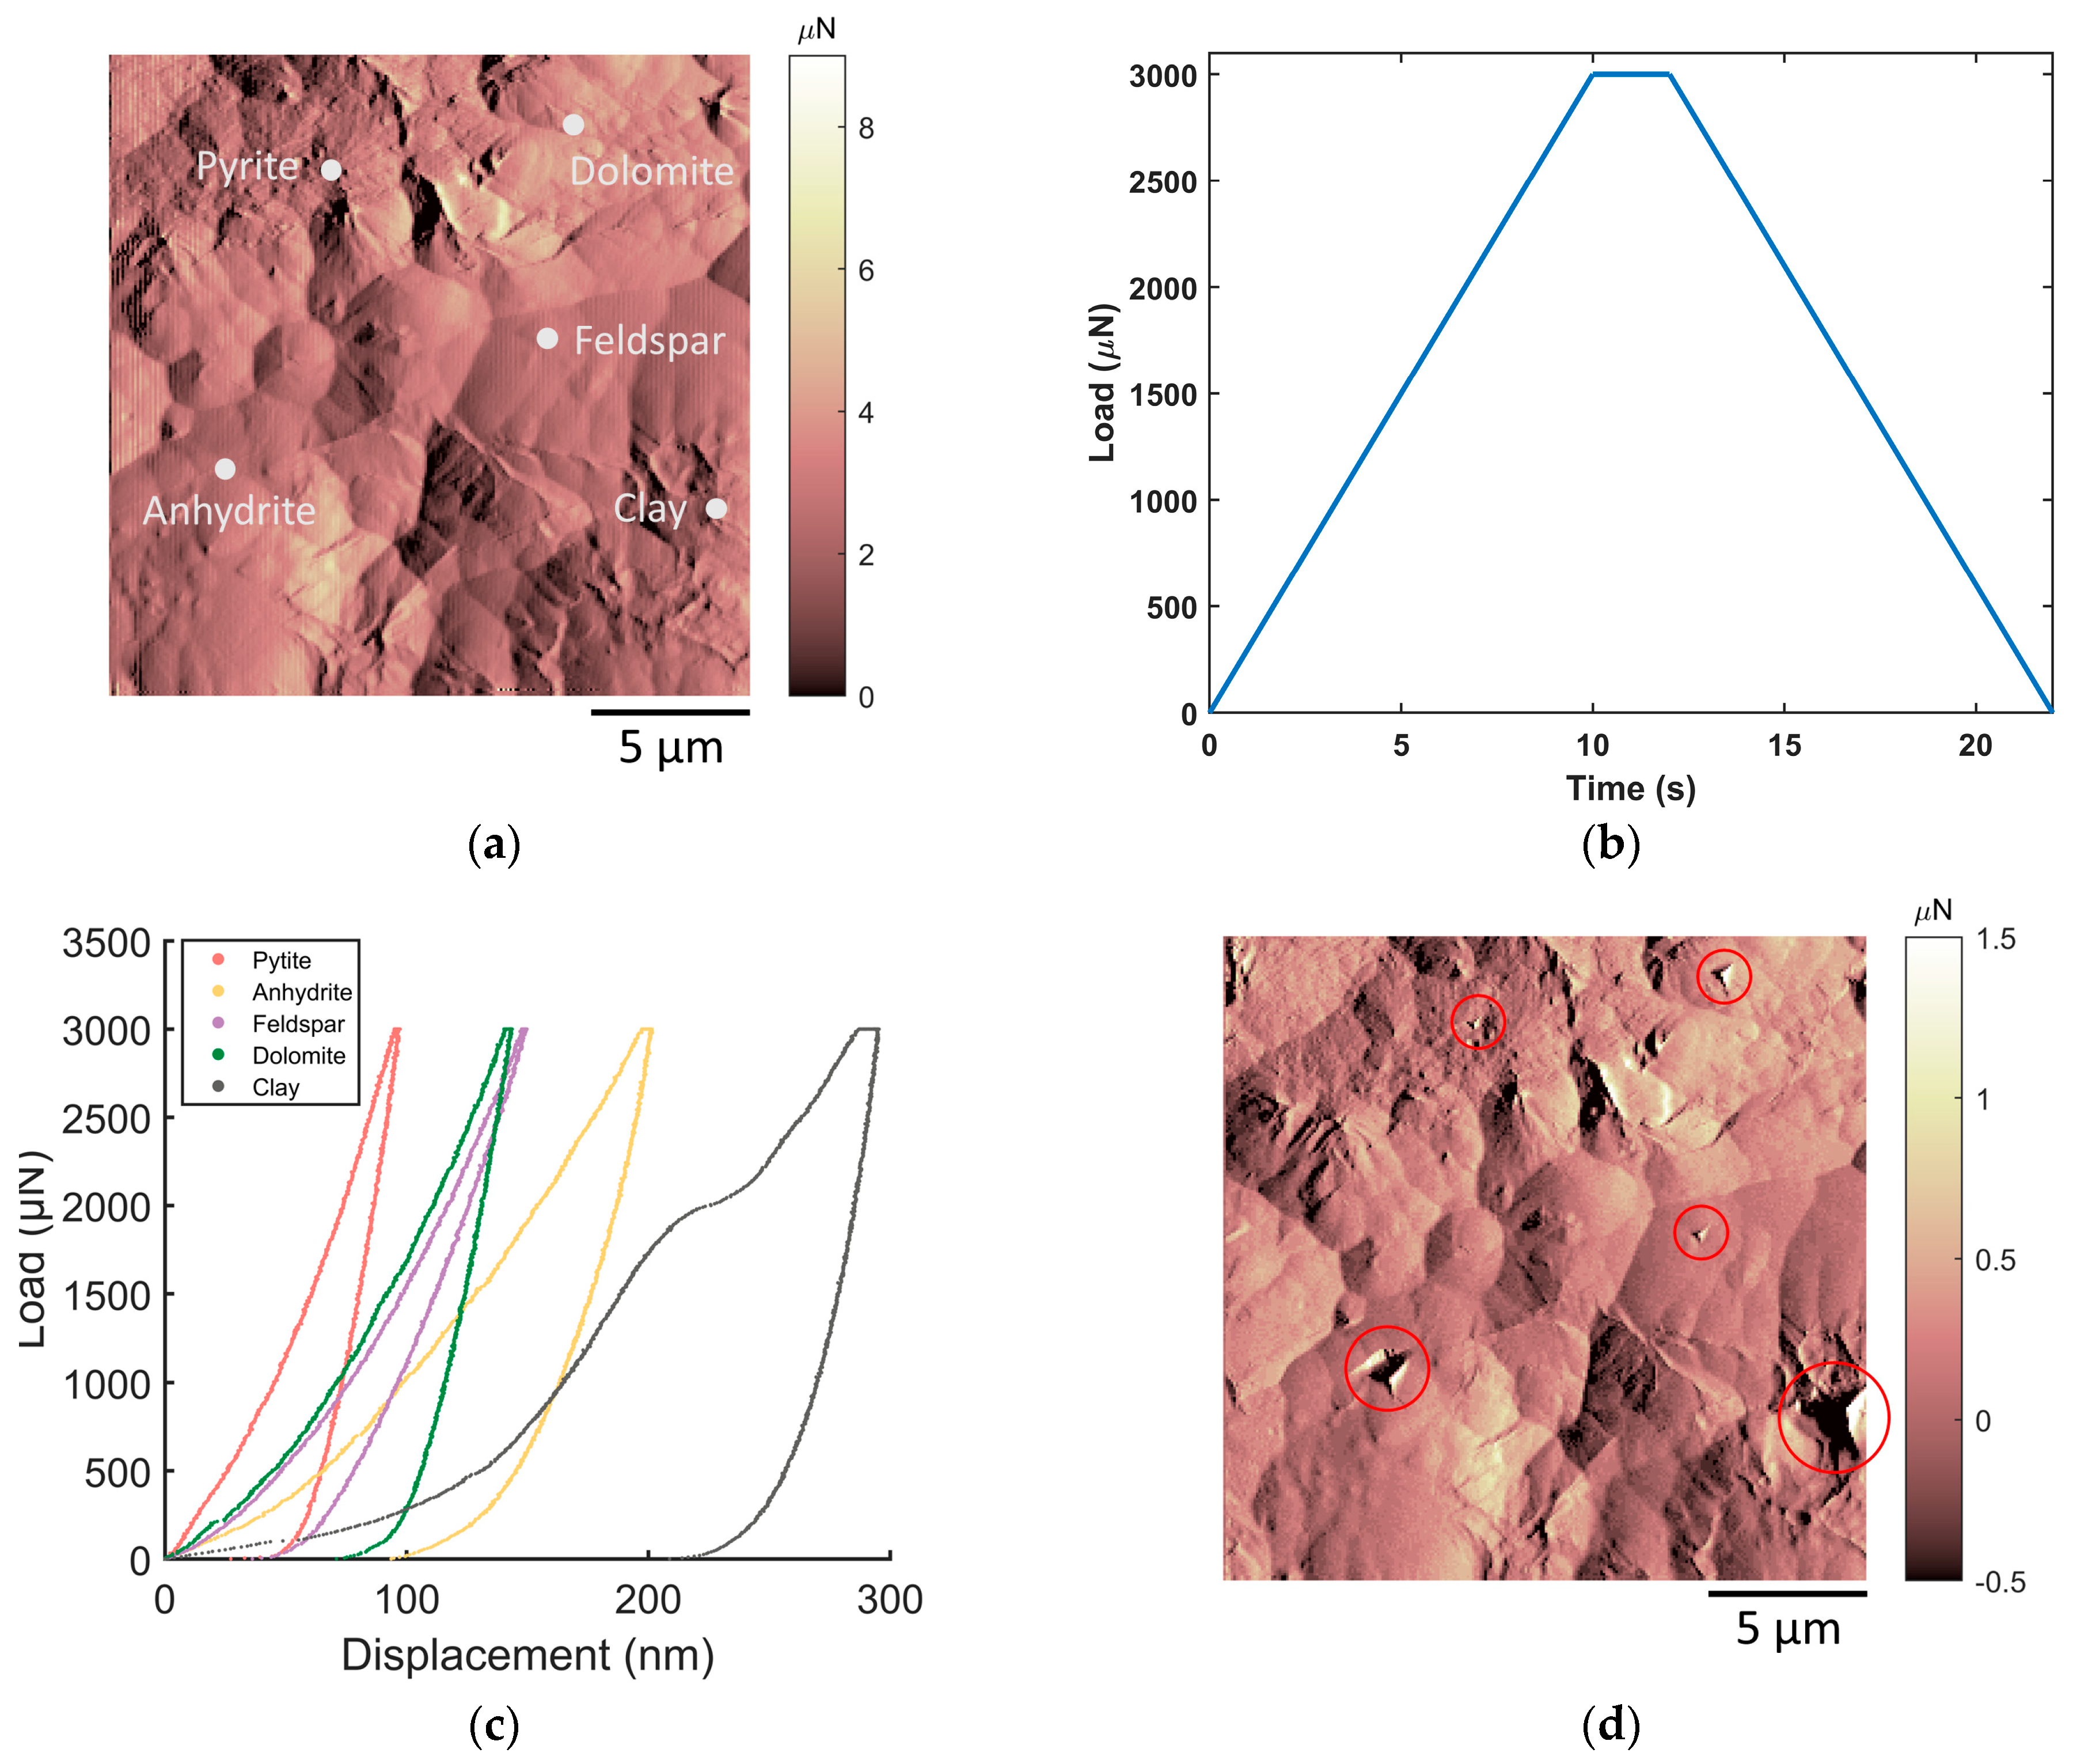
Indentation points were set on the surface of different minerals according to the SPM image (denoted by white dots in Figure 5a), and the mechanical properties of each mineral were measured by using nanoindentation. For a single nanoindentation measurement, the maximum load was 3000 μN, and the loading, holding, and unloading times were 10 s, 2 s, and 10 s, respectively (Figure 5b). Thus, the loading speed was 300 μN/s. The load was applied, and the displacement was measured by a three-plate capacitive transducer. The Young’s modulus and the nanoindentation hardness of each mineral in the test area were obtained through the analysis of the load and displacement curves (Figure 5c). Then, SPM was performed again at a load setpoint of 2 μN and a load amplitude of 1 μN. The scanning rate was set to be 0.5 Hz. Figure 4d is the SPM image after nanoindentation measurement, and the red circles indicate the residual indentation.
A Berkovich diamond indenter was used for the characterization. The Young’s modulus and Poisson’s ratio of the indenter tip were 1141 GPa and 0.07, respectively. The Berkovich diamond indenter is widely used for instrumented nanoindentation. The initial Oliver–Pharr method was developed by using this indenter type [35]. In addition, the Berkovich indenter is usually preferable for hardness determination because the indenter tip is sharp, has no major flaws, and is easy to calibrate, which allows the reliable calculation of the contact area at relatively low loads [38]. An ideal Berkovich indenter is a three-sided pyramid, which includes a half angle of 65.27° (Figure 6a), and the projection of contact area is an equilateral triangle (Figure 6b). However, fabricating a perfectly sharp tip end of the diamond Berkovich indenter remains a challenge. Figure 6c,d are the helium ion microscope images of the real diamond Berkovich indenter and the corresponding magnified indenter tip, respectively. A near-round shape is observed at the very tip of the indenter, which was also found using SEM and AFM in previous research [39,40]. Moreover, the indenter tip will become blunt because of repeated measurements [41,42]. The area function (Equation (4)) has already considered the bluntness of the indenter tip by adding extra terms to the lead term [35].
For the calibration of the area function, an 8 × 8 nanoindentation matrix was set in a clean region on the surface of the fused silica standard sample. The maximum load of these nanoindentation points was gradually increased from 50 μN to 10,000 μN to obtain the load-displacement curves at various contact depths. The corrected area function of the Berkovich indenter was as follows:
A = 24.5 h c 2 + 1.4487 × 10 3 h c 1 + 1.2839 × 10 5 h c 1 / 2 1.6569 × 10 6 h c 1 / 4 + 4.5107 × 10 6 h c 1 / 8 2.9881 × 10 6 h c 1 / 16

3. Results and Discussion

3.1. Micromechanical Features of Minerals in Carbonate Rock

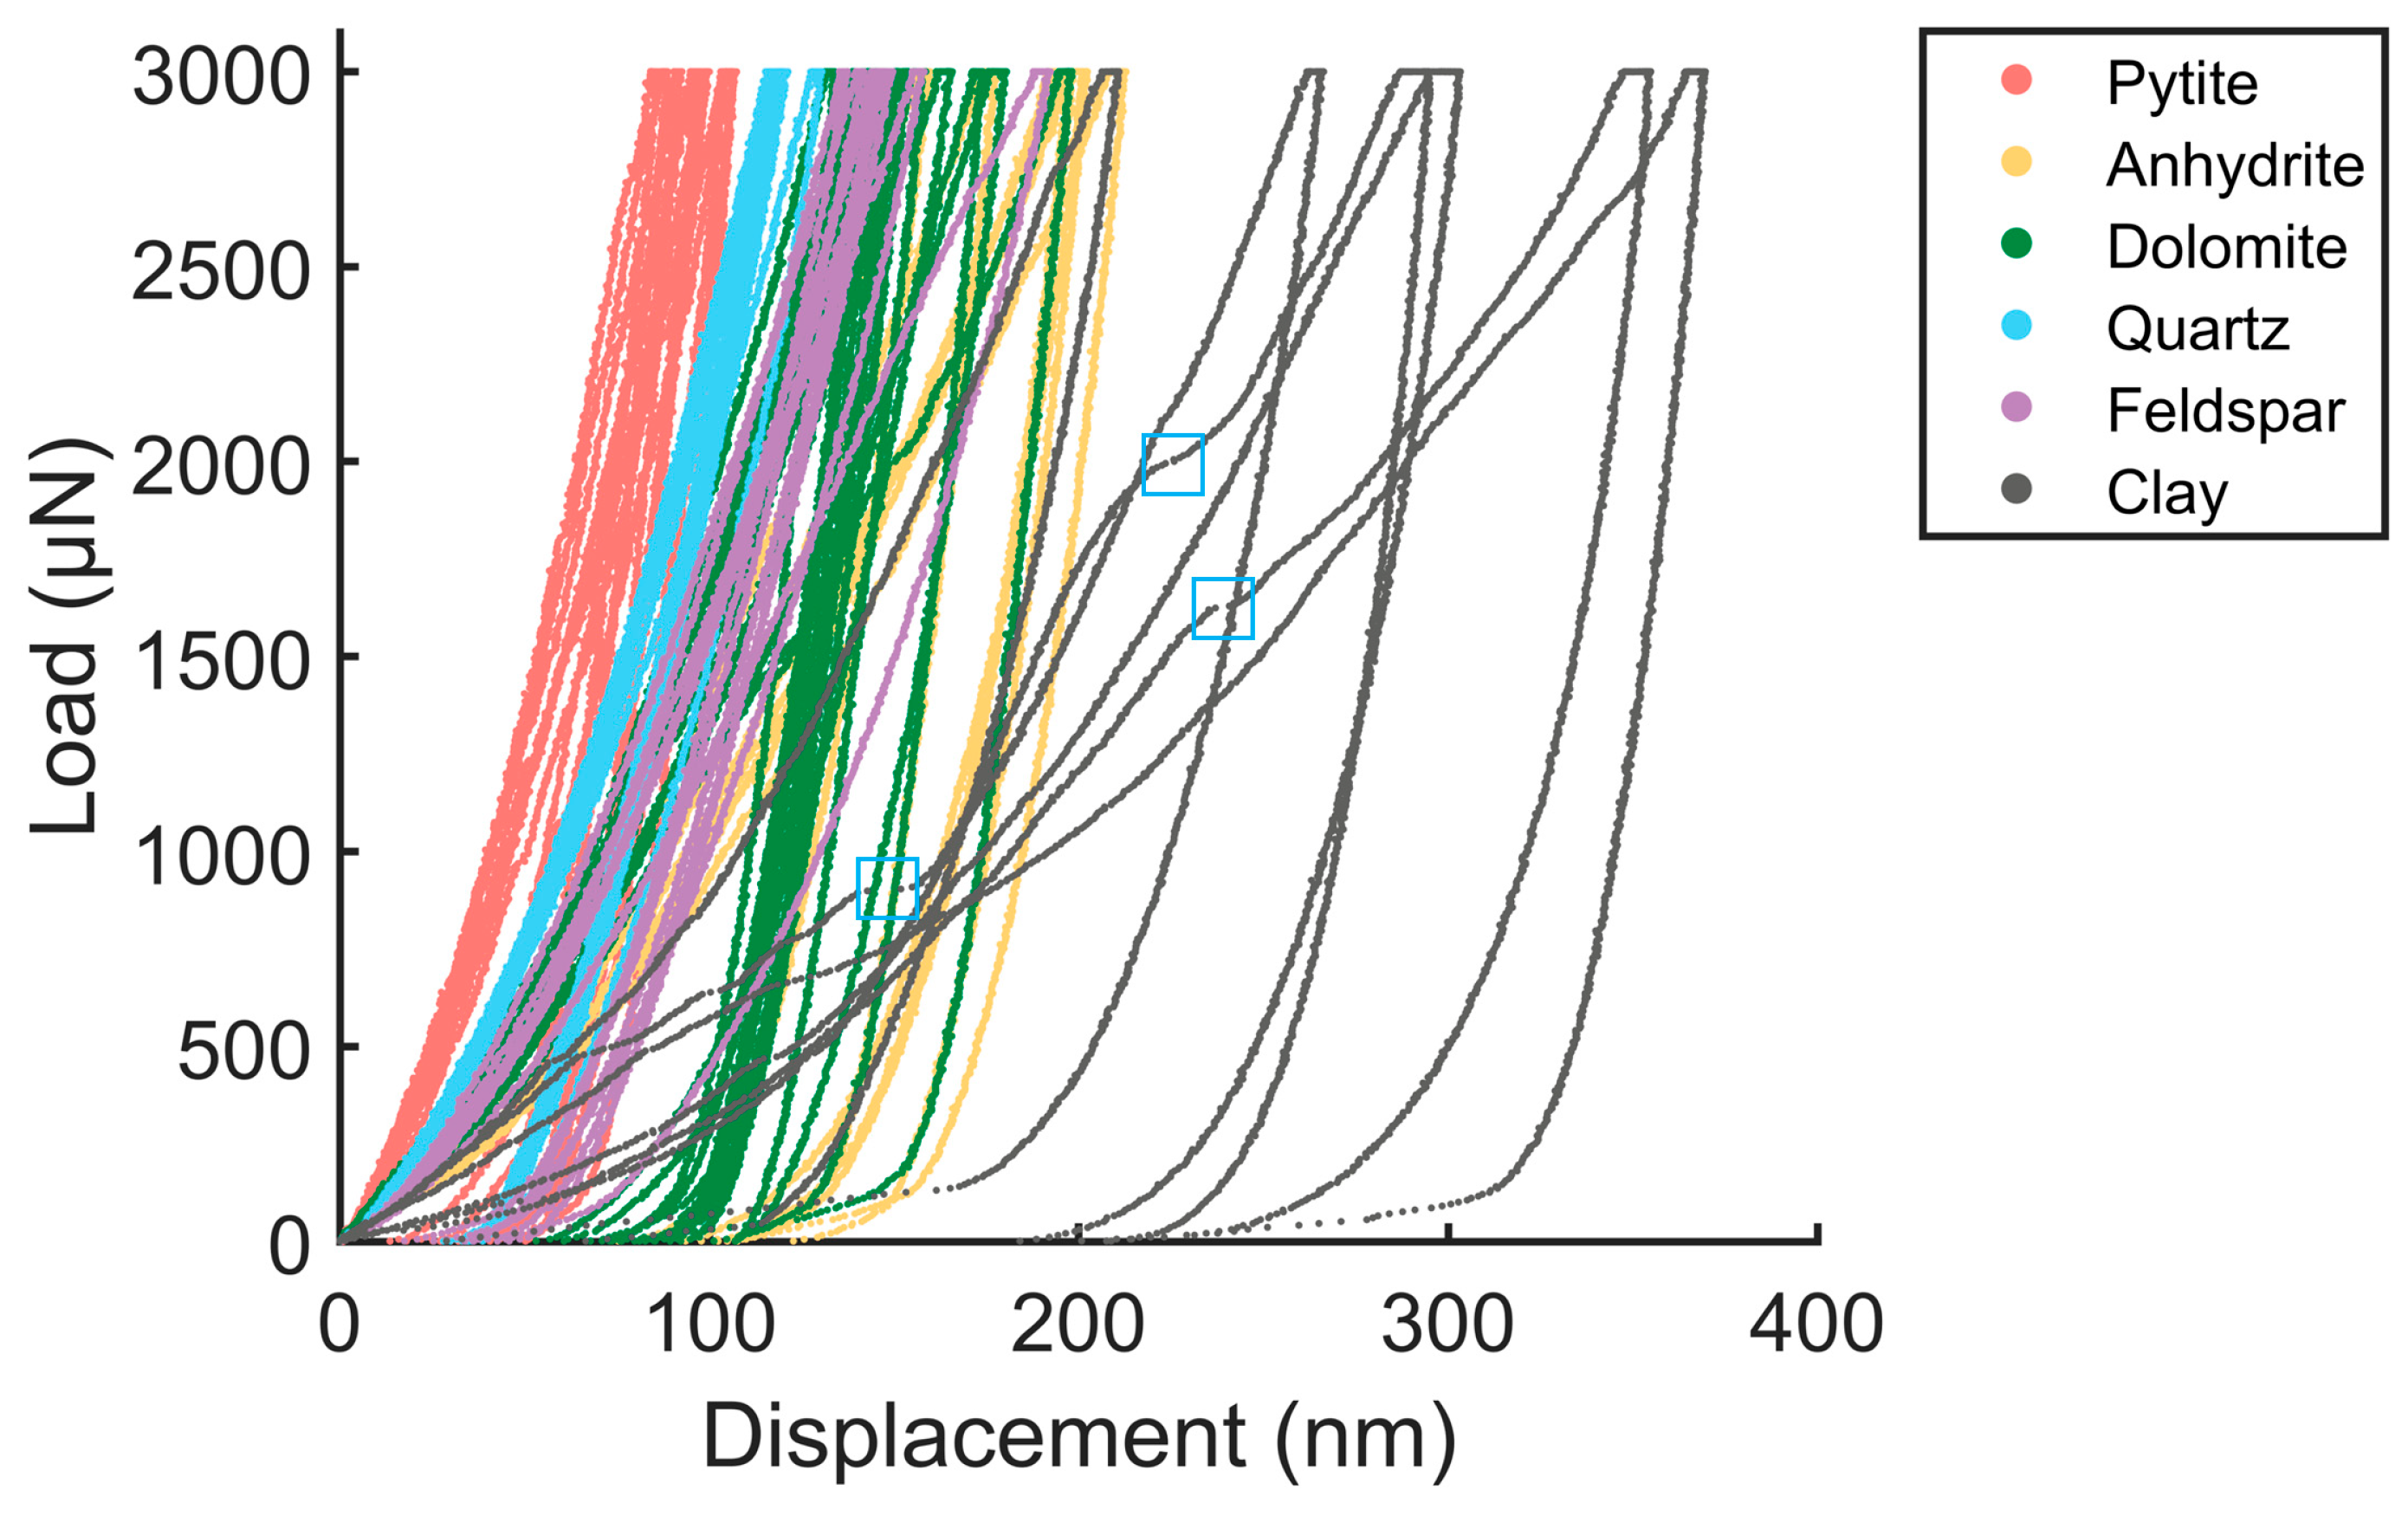
A total of 56 nanoindentation measurements was performed in 11 test areas on the sample surface. Figure 7 assembles the load-displacement curves of all of the nanoindentation measurements. Significant variations in maximum displacement exist among different minerals. Table 1 exhibits the maximum displacement of each mineral. With the same peak load setup, the diamond indenter generates the highest displacement of approximately 300 nm on the surface of clay. In contrast, the displacement on the surface of pyrite is generally lower than 100 nm. Similar load-displacement characteristics were also found in the nanoindentation measurements of minerals from shale and granite rock samples [29,43].
From Figure 7, one can also see that there are sudden displacement increases marked by open blue squares at the loading curves of clay. This kind of displacement-burst phenomenon observed during load-controlled nanoindentation is termed “pop-in” [44], which has been proved to be a sign of dislocation nucleation in metallic materials [45] and the mark of the transition from elastic to elastic–plastic behavior of the crystalline semiconductor [46]. There are many causes for pop-ins in the nanoindentation measurements of rock samples, such as cracking of a brittle mineral, the transition from a hard constituent to a soft constituent in the loading direction, and the pores and cracks in the rock. Here, the pop-in in the load-displacement curve is possibly due to the interlamellar or interparticle pores in clay minerals.
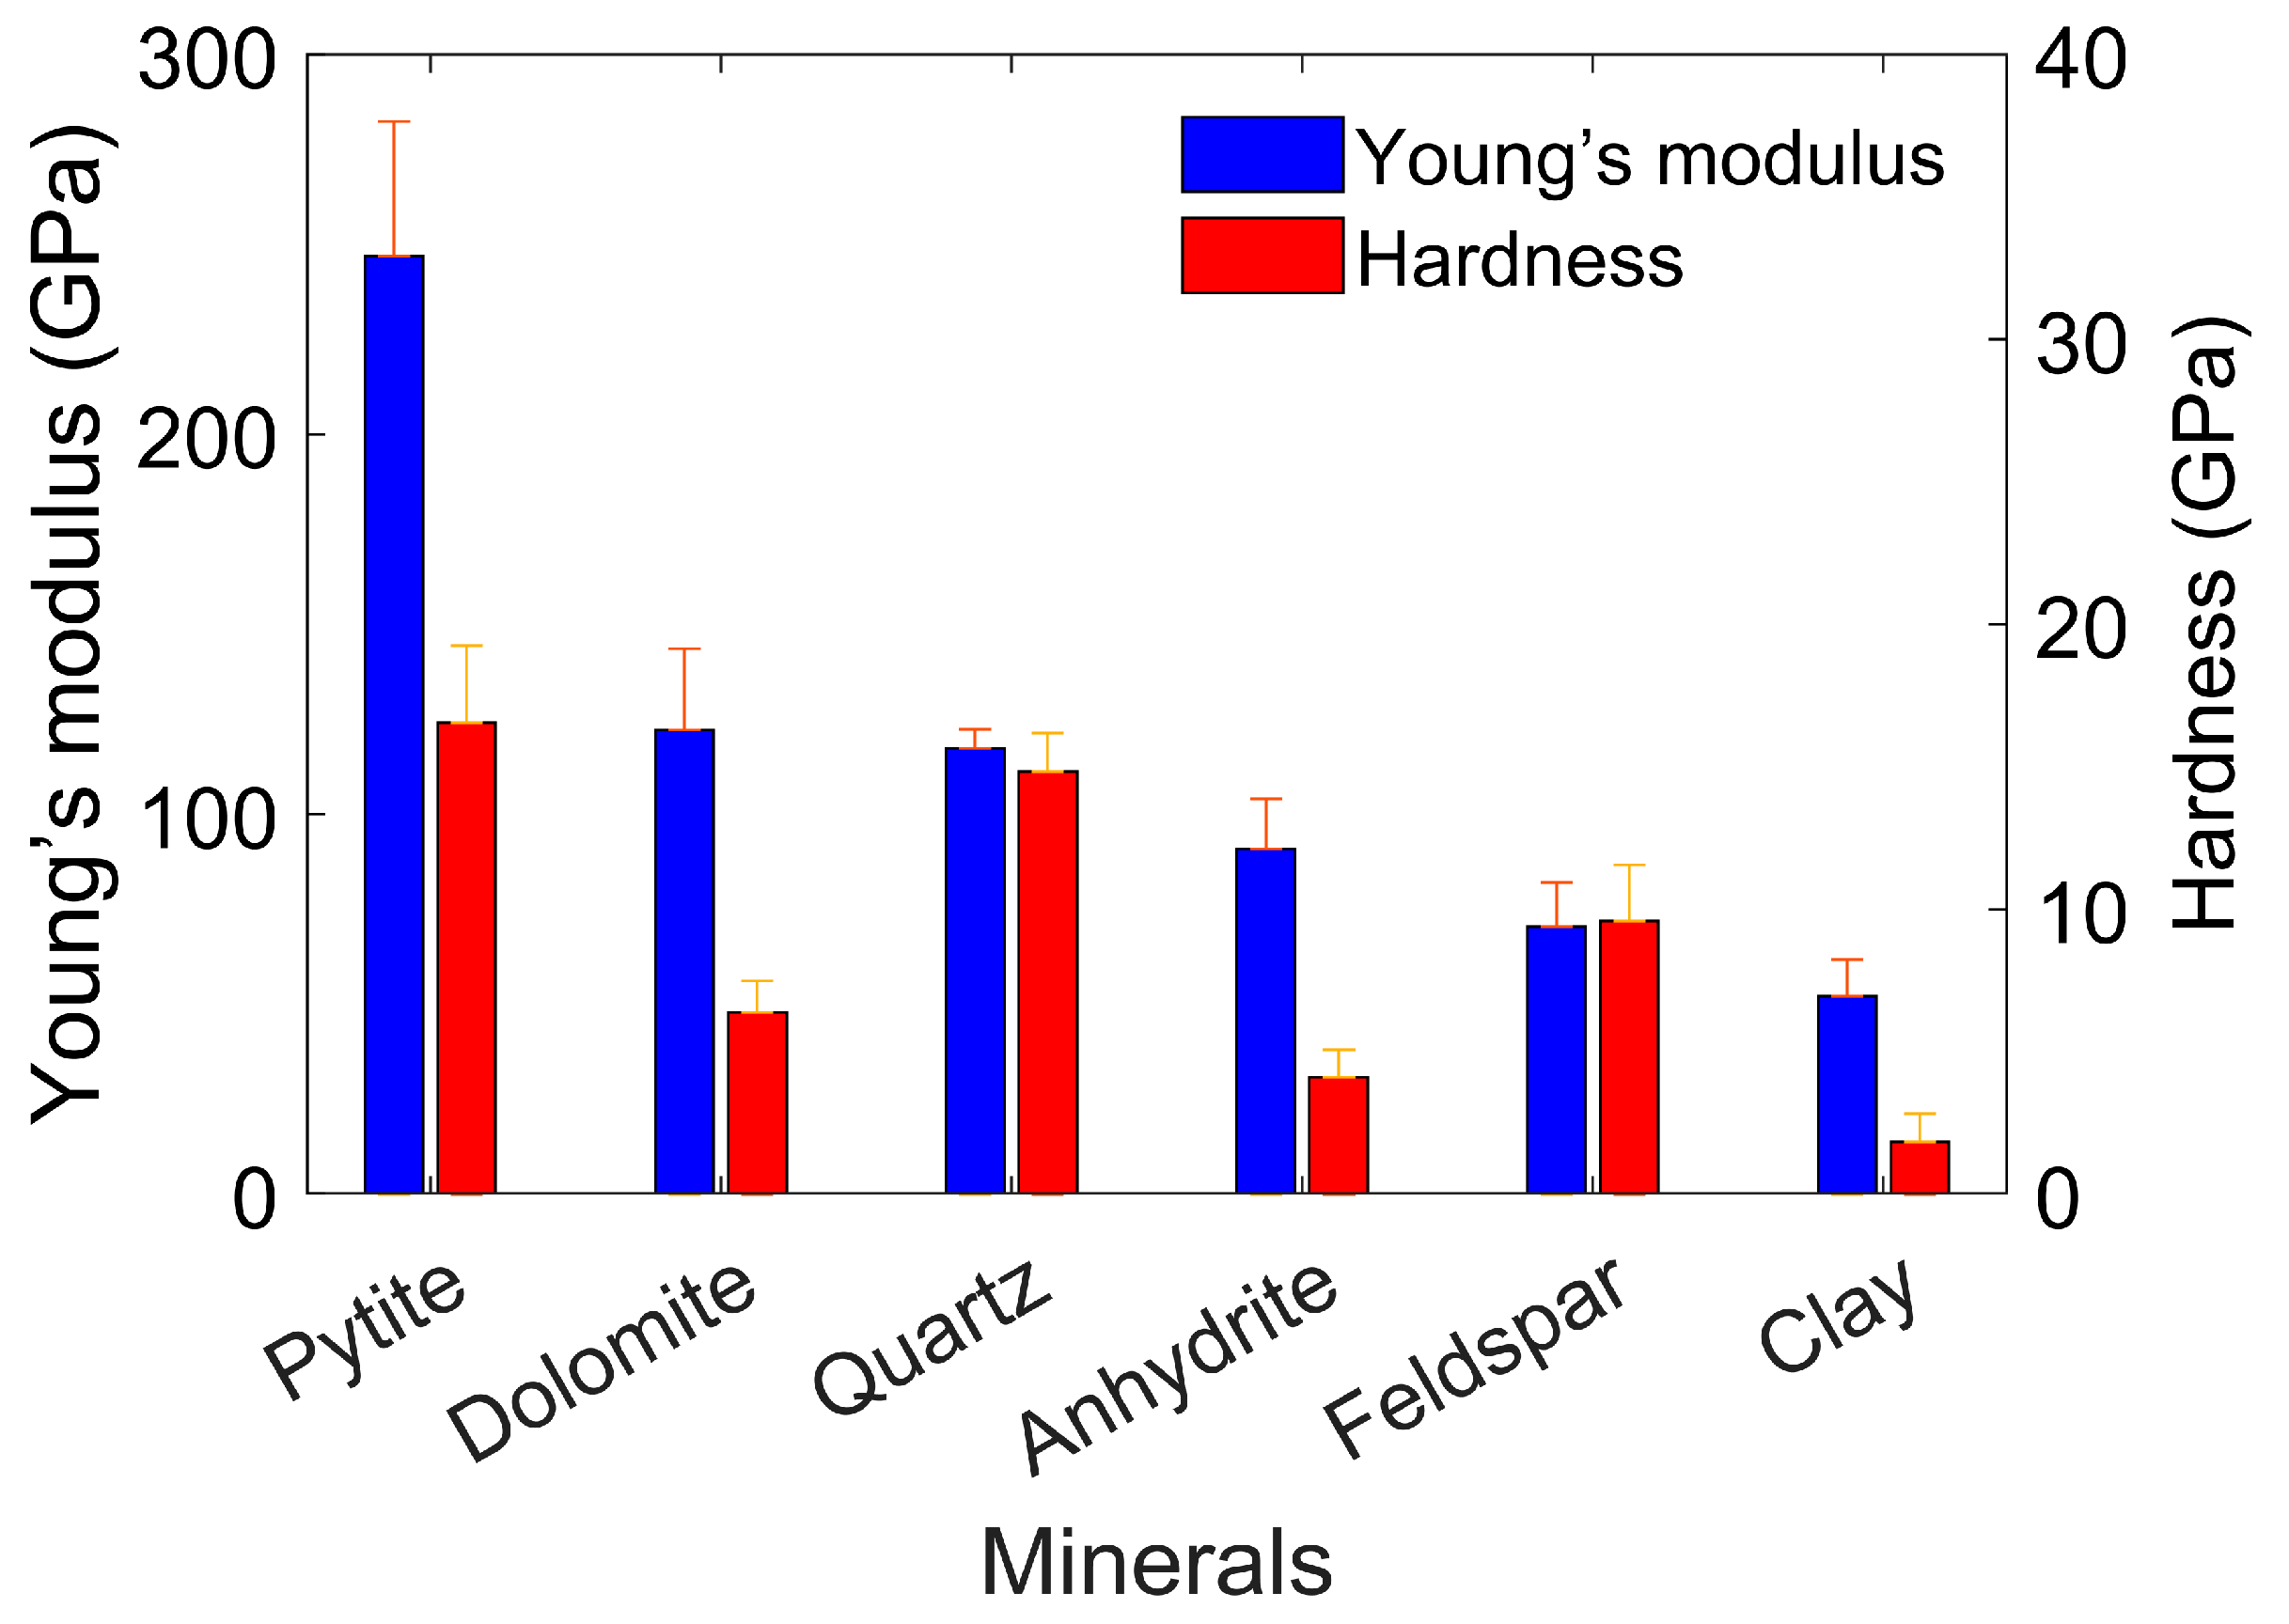
In this work, the unloading stiffness S was determined by fitting the unloading curve between 20% and 95% of the maximum load to Equation (3), and the Young’s modulus and nanoindentation hardness were obtained by using Equations (1), (2), and (6) with the calibrated area function (Equation (7)). Figure 8 illustrates the micromechanical characterization results of the main minerals in the carbonate rock sample. The results indicate the strong mechanical heterogeneity of carbonate rock at the micro scale. Among the main minerals in the rock sample, the Young’s modulus of pyrite is over 200 GPa, and that of dolomite is between 100 GPa and 150 GPa. However, the Young’s modulus of clay is only approximately 50 GPa. Moreover, the Young’s modulus and the nanoindentation hardnesses of different minerals do not strictly share the same trends. For example, the Young’s modulus of dolomite is higher than quartz, but the nanoindentation hardness is lower, which is similar to the relationship between anhydrite and feldspar. By observing Table 1 and Figure 8, one can find that the mineral with a higher nanoindentation hardness generally generates lower maximum displacement. The microscale characterization results in this study can be used to explain the mechanical variations among different carbonate rocks and to build an upscaling model for the prediction of macroscopic mechanical properties [47,48,49].

3.2. Influence of Poisson’s Ratio Values and Comparison with Reported Mineral Data

As previously mentioned, the reduced modulus directly measured by nanoindentation reflects the mechanical properties of both the diamond indenter and the minerals. Thus, the influence of the indenter needs to be eliminated according to Equation (5). The Poisson’s ratio values of the different minerals are required for the conversion from the reduced modulus to Young’s modulus. Table 2 lists the Poisson’s ratio values used in this study, which is mainly from Mineral Physics and Crystallography: A Handbook of Physical Constants [50]. For unknown minerals like anhydrite and clay, the values are assumed to be 0.25. Sensitivity analysis is conducted to evaluate the uncertainty introduced by the Poisson’s ratio assumption. The reduced moduli values were put into Equation (6), and the Poisson’s ratio of the mineral was increased from 0.05 to 0.45 by 0.01. Then, the mean value of the calculated Young’s modulus corresponding to each Poisson’s ratio was obtained. Figure 9 presents the sensitivity of the Young’s moduli to the Poisson’s ratio values of anhydrite and clay, respectively. The maximum error can be estimated by comparing the relative error between the middle point (Poisson’s ratio = 0.25) and the two end points. Based on the sensitivity analysis results, it can be found that the maximum error introduced by the assumption is approximately 14.9% for both anhydrite and clay. The discussion here indicates that for the minerals with unknown Poisson’s ratio values, the Young’s modulus obtained by nanoindentation may introduce an error, but the error can be limited and acceptable with an appropriate Poisson’s ratio assumption [27,51].
Table 2 also presents the Young’s moduli of different minerals measured by nanoindentation. The modulus value of anhydrite is from the carbonate rock samples, while the other data are from the shale samples. The results of dolomite, quartz, anhydrite, and feldspar in this work (Figure 7) coincide with previous works. However, the Young’s moduli of pyrite and clay are higher here than the reported data. In shale cores, the small pyrite particles are usually found in the soft constituents, including organic matters and clay matrix [43,52,53]. Therefore, the nanoindentation results of pyrite in shale may be influenced by the soft substrates. The situation of pyrite is complex and will be specifically discussed in the following subsection.

3.3. Characterization Ability Analysis

For classical macroscopic rock mechanical-test methods, such as uniaxial and triaxial compression, the squeeze head size is usually comparable to or slightly larger than the cross-section of the standard test sample. In the test process, the load is applied to the whole sample, and thus the bulk properties of the rock are characterized. In contrast, the size of the indenter tip used for nanoindentation is markedly smaller than that of the test sample, and the load is only applied to a limited region on the sample surface. Therefore, nanoindentation can achieve the mechanical characterization of a single mineral in the rock material. It is necessary to quantitatively analyze the characterization ability of nanoindentation to show the effectiveness of the micromechanical characterization results in this study. The characterization ability here is constituted by the lateral spatial resolution and the elastic response depth in the vertical direction. The contact area of nanoindentation is the projected area of the three-dimensional real contact region on the sample’s surface (Figure 6b). In this study, the side length of the equilateral triangle is treated as the lateral spatial resolution of the nanoindentation measurements. The elastic response depth is estimated as approximately four times the maximum displacement according to the finite-element simulation results in previous research [54]. It is worth noting that the characterization ability is influenced by both the experimental setup and the mineral type. Table 3 summarizes the characterization ability analysis results.
During the micromechanical characterization process, nanoindentation points were set on the relatively flat surface to avoid the influence of surface fluctuation and mineral boundary (Figure 5a). Thus, for most of the tested minerals in the carbonate rock sample, the lateral spatial resolution and elastic response depth were both markedly lower than the characteristic size (Figure 1), and the experimental setup could guarantee the effective measurement of the micromechanical properties. However, the width of clay fibers is generally only 1~2 μm each (Figure 1), which is comparable to the lateral spatial resolution and elastic response depth (Table 2). In addition, the interlaminar pores and micro-cracks, which induce the pop-ins in the load-displacement curves (Figure 7), can also be found in the laminated structures, and the micro particles of granular minerals can fill in the interlaminar pores (Figure 1). Therefore, the micromechanical characterization of clay is easily influenced by other kinds of minerals in the carbonate rock sample.
According to the comparison of the nanoindentation results presented in Figure 8, it can be speculated that this study may slightly overestimate the mechanical properties of clay minerals. To obtain more reliable characterization results, the maximum load or displacement setup of clay can be appropriately reduced. It is worth noting that the contact depth between the Berkovich indenter and the sample surface should be sufficiently large to guarantee that the contact region is approximately a triangular pyramid. For a super-shallow nanoindentation test, the area function of the Berkovich indenter is invalid, and the spherical contact assumption is usually used [55,56]. Thus, although lower contact depth can reduce the influence of the surroundings, unlimited reduction of the maximum load or displacement is not allowed. Additionally, the mechanical behavior of clay minerals is complicated. Different clay types, including illite, kaolinite, chlorite, and montmorillonite, may exhibit different properties [57]. Mechanical anisotropy can also be found in clay [58]. In the future, the mechanical characterization of clay minerals can be refined by applying suitable load and by considering the influence of clay type and loading direction.

4. Conclusions

(1)
This study focuses on a typical carbonate rock sample from the Huangcaoxia gas storage and explores the application of quasi-static nanoindentation to the study of the mechanical properties of carbonate rock. A complete workflow, including sample preparation, test area selection and positioning, mechanical testing, and data processing and analysis for the micromechanical characterization of a carbonate rock sample, is developed and presented.
(2)
The mechanical properties of the main minerals in the carbonate rock sample are characterized. The experimental results indicate strong micromechanical heterogeneity. The Young’s modulus of pyrite is over 200 GPa, and that of dolomite is between 100 GPa and 150 GPa. However, the Young’s modulus of clay is only approximately 50 GPa. In addition, the minerals with higher Young’s moduli do not uniformly possess higher nanoindentation hardness. These quantitative data at the micro scale can be used for the interpretation of the macroscopic mechanical features of carbonate rock, for the parameter input and validation of mineral related simulation, and for the construction of a mechanical upscaling model.
(3)
The Young’s moduli of different minerals obtained from nanoindentation measurements can be influenced by the corresponding Poisson’s ratio values. For the minerals with unknown Poisson’s ratio values, the value is assumed to be 0.25. Sensitivity analysis results suggest that the maximum possible error introduced by this assumption is below 15%.
(4)
To discuss the effectiveness of the micromechanical characterization in this study, the characterization ability, which is constituted by lateral spatial resolution and elastic response depth in the vertical direction, is quantitatively analyzed based on the experimental results. For most of the minerals in the carbonate rock sample, the lateral spatial resolution is better than 1.5 μm, and the elastic response depth is lower than 1 μm, which guarantees a relatively stable and accurate mechanical measurement of a single mineral particle. However, the mechanical characterization of clay minerals can be more easily influenced by the surroundings as compared to other kinds of minerals, and the mechanical properties of clay may be slightly overestimated with the current experimental setup. In the future, the experimental scheme can be further refined to achieve a more accurate characterization of clay minerals in carbonate rock.

Author Contributions

Conceptualization, T.D. and J.Z.; methodology, T.D., J.Z., H.Y., Q.X. and L.G.; investigation, J.Z. and H.Y.; data curation, T.D., Q.X. and L.G.; writing—original draft preparation, T.D. and J.Z.; writing—review and editing, H.Y., Q.X. and L.G. All authors have read and agreed to the published version of the manuscript.

Funding

This research received no external funding.

Data Availability Statement

The data that support the findings of this study are available from the corresponding author upon reasonable request.

Conflicts of Interest

The authors Ting Deng, Hongchuan Yin, Qiang Xie and Ling Gou were employed by the Chongqing Gas Mine, Petro China Southwest Oil and Gasfield Company. The remaining author declare that the research was conducted in the absence of any commercial or financial relationships that could be construed as a potential conflict of interest.

References

  1. Palharini Schwalbert, M.; Aljawad, M.S.; Hill, A.D.; Zhu, D. Decision criterion for acid-stimulation method in carbonate reservoirs: Matrix acidizing or acid fracturing? SPE J. 2020, 25, 2296–2318. [Google Scholar] [CrossRef]
  2. Li, N.; Dai, J.; Liu, C.; Liu, P.; Zhang, Y.; Luo, Z.; Zhao, L. Feasibility study on application of volume acid fracturing technology to tight gas carbonate reservoir development. Petroleum 2015, 1, 206–216. [Google Scholar] [CrossRef]
  3. Al-Ameri, W.A.; Abdulraheem, A.; Mahmoud, M. Long-term effects of CO2 sequestration on rock mechanical properties. J. Energy Resour. 2016, 138, 012201. [Google Scholar] [CrossRef]
  4. Raza, A.; Gholami, R.; Sarmadivaleh, M. Feasibility of limestone reservoirs as a carbon dioxide storage site: An experimental study. AAPG Bull. 2020, 104, 83–96. [Google Scholar] [CrossRef]
  5. Tang, H.; Zheng, X.; Wang, X.; Zhao, Z.; Chen, Y.; Zhao, Y.; Zhang, L. Mechanical stability analysis of fracture-cavity carbonate gas storage. In Proceedings of the ARMA US Rock Mechanics/Geomechanics Symposium, Golden, CO, USA, 23–26 June 2024; ARMA: Arma, KS, USA, 2024. [Google Scholar] [CrossRef]
  6. Shao, J.; You, L.; Kang, Y.; Gao, X.; Chen, M.; Meng, S.; Zhang, N. Experimental study on stress sensitivity of underground gas storage. J. Pet. Sci. Eng. 2020, 195, 107577. [Google Scholar] [CrossRef]
  7. Skrzypkowski, K.; Zagórski, K.; Zagórska, A. Determination of the extent of the rock destruction zones around a gasification channel on the basis of strength tests of sandstone and claystone samples heated at high temperatures up to 1200 C and exposed to water. Energies 2021, 14, 6464. [Google Scholar] [CrossRef]
  8. Sheshde, E.A.; Cheshomi, A.; Gharechelou, S. Estimation of mode I static fracture toughness of carbonate rock using small rock fragments. J. Pet. Sci. Eng. 2022, 218, 110980. [Google Scholar] [CrossRef]
  9. Palchik, V. On the ratios between elastic modulus and uniaxial compressive strength of heterogeneous carbonate rocks. Rock Mech. Rock Eng. 2011, 44, 121–128. [Google Scholar] [CrossRef]
  10. Yasar, E.; Erdogan, Y. Correlating sound velocity with the density, compressive strength and Young’s modulus of carbonate rocks. Int. J. Rock Mech. Min. Sci. 2004, 41, 871–875. [Google Scholar] [CrossRef]
  11. Baud, P.; Exner, U.; Lommatzsch, M.; Reuschlé, T.; Wong, T.f. Mechanical behavior, failure mode, and transport properties in a porous carbonate. J. Geophys. Res. Solid Earth 2017, 122, 7363–7387. [Google Scholar] [CrossRef]
  12. Vajdova, V.; Baud, P.; Wong, T.F. Compaction, dilatancy, and failure in porous carbonate rocks. J. Geophys. Res. Solid Earth 2004, 109, B05204. [Google Scholar] [CrossRef]
  13. Nardini, L.; Rybacki, E.; Krause, M.; Morales, L.F.; Dresen, G. Control of the geometric arrangement of material heterogeneities on strain localization at the brittle-to-ductile transition in experimentally deformed carbonate rocks. J. Struct. Geol. 2020, 135, 104038. [Google Scholar] [CrossRef]
  14. Tsikrikis, A.; Papaliangas, T.; Marinos, V. Brittle-ductile transition and Hoek–Brown mi constant of low-porosity carbonate rocks. Geotech. Geol. Eng. 2022, 40, 1833–1849. [Google Scholar] [CrossRef]
  15. Rohmer, J.; Pluymakers, A.; Renard, F. Mechano-chemical interactions in sedimentary rocks in the context of CO2 storage: Weak acid, weak effects? Earth-Sci. Rev. 2016, 157, 86–110. [Google Scholar] [CrossRef]
  16. Hugman Iii, R.; Friedman, M. Effects of texture and composition on mechanical behavior of experimentally deformed carbonate rocks. AAPG Bull. 1979, 63, 1478–1489. [Google Scholar] [CrossRef]
  17. Abdullah, G.M.; El Aal, A.A.; Radwan, A.E.; Qadri, T.; Aly, N. The influence of carbonate textures and rock composition on durability cycles and geomechanical aspects of carbonate rocks. Acta Geotech. 2023, 18, 105–125. [Google Scholar] [CrossRef]
  18. Verwer, K.; Braaksma, H.; Kenter, J.A. Acoustic properties of carbonates: Effects of rock texture and implications for fluid substitution. Geophysics 2008, 73, B51–B65. [Google Scholar] [CrossRef]
  19. Zhao, J.; Zhang, W.; Zhang, D. Elastic characterization of shale at microscale: A comparison between modulus mapping, PeakForce quantitative nanomechanical mapping, and contact resonance method. SPE J. 2022, 27, 3136–3157. [Google Scholar] [CrossRef]
  20. Hoffler, C.E.; Guo, X.E.; Zysset, P.K.; Goldstein, S.A. An application of nanoindentation technique to measure bone tissue lamellae properties. J. Biomech. Eng. 2005, 127, 1046–1053. [Google Scholar] [CrossRef]
  21. Gindl, W.; Gupta, H.; Schöberl, T.; Lichtenegger, H.; Fratzl, P. Mechanical properties of spruce wood cell walls by nanoindentation. Appl. Phys. A 2004, 79, 2069–2073. [Google Scholar] [CrossRef]
  22. Killgore, J.P.; DelRio, F.W. Contact resonance force microscopy for viscoelastic property measurements: From fundamentals to state-of-the-art applications. Macromolecules 2018, 51, 6977–6996. [Google Scholar] [CrossRef]
  23. Fischer, H.; Stadler, H.; Erina, N. Quantitative temperature-depending mapping of mechanical properties of bitumen at the nanoscale using the AFM operated with PeakForce TappingTM mode. J. Microsc. 2013, 250, 210–217. [Google Scholar] [CrossRef]
  24. Rabe, U. Applied Scanning Probe Methods II; Springer: Berlin/Heidelberg, Germany, 2006. [Google Scholar]
  25. Bennett, K.C.; Berla, L.A.; Nix, W.D.; Borja, R.I. Instrumented nanoindentation and 3D mechanistic modeling of a shale at multiple scales. Acta Geotech. 2015, 10, 1–14. [Google Scholar] [CrossRef]
  26. Yang, C.; Xiong, Y.; Wang, J.; Li, Y.; Jiang, W. Mechanical characterization of shale matrix minerals using phase-positioned nanoindentation and nano-dynamic mechanical analysis. Int. J. Coal. Geol. 2020, 229, 103571. [Google Scholar] [CrossRef]
  27. Zhao, J.; Zhang, W.; Zhang, D.; Wei, R.; Wang, Y. Influence of geochemical features on the mechanical properties of organic matter in shale. J. Geophys. Res. Solid Earth 2020, 125, e2020JB019809. [Google Scholar] [CrossRef]
  28. Liu, Y.; Liu, S.; Kang, Y. Probing nanomechanical properties of a shale with nanoindentation: Heterogeneity and the effect of water–shale interactions. Energy Fuels 2021, 35, 11930–11946. [Google Scholar] [CrossRef]
  29. Mo, C.; Zhao, J.; Zhang, D. Real-time measurement of mechanical behavior of granite during heating–cooling cycle: A mineralogical perspective. Rock Mech. Rock Eng. 2022, 55, 4403–4422. [Google Scholar] [CrossRef]
  30. Li, M.; Sun, H.; Peng, L.; Zuo, J.; Wang, Z. Laboratory investigation on physical and mechanical behaviors of granite after heating and different cooling rates. Energy 2024, 302, 131718. [Google Scholar] [CrossRef]
  31. Liu, X.-Y.; Xu, D.-P.; Li, S.-J.; Qiu, S.-L.; Jiang, Q. An insight into the mechanical and fracture characterization of minerals and mineral interfaces in granite using nanoindentation and micro X-ray computed tomography. Rock Mech. Rock Eng. 2023, 56, 3359–3375. [Google Scholar] [CrossRef]
  32. Li, Y.; Luo, S.; Lu, M.; Wu, Y.; Zhou, N.; Wang, D.; Lu, Y.; Zhang, G. Cross-scale characterization of sandstones via statistical nanoindentation: Evaluation of data analytics and upscaling models. Int. J. Rock Mech. Min. Sci. 2021, 142, 104738. [Google Scholar] [CrossRef]
  33. Zhang, P.; Zhang, D.; Zhao, J. Control of fracture toughness of kerogen on artificially-matured shale samples: An energy-based nanoindentation analysis. Gas Sci. Eng. 2024, 124, 205266. [Google Scholar] [CrossRef]
  34. Oliver, W.C.; Pharr, G.M. Measurement of hardness and elastic modulus by instrumented indentation: Advances in understanding and refinements to methodology. J. Mater. Res. 2004, 19, 3–20. [Google Scholar] [CrossRef]
  35. Oliver, W.C.; Pharr, G.M. An improved technique for determining hardness and elastic modulus using load and displacement sensing indentation experiments. J. Mater. Res. 1992, 7, 1564–1583. [Google Scholar] [CrossRef]
  36. Pharr, G.; Oliver, W.; Brotzen, F. On the generality of the relationship among contact stiffness, contact area, and elastic modulus during indentation. J. Mater. Res. 1992, 7, 613–617. [Google Scholar] [CrossRef]
  37. Johnson, K.L. Contact Mechanics; Cambridge University Press: Cambridge, UK, 1987. [Google Scholar]
  38. Riester, L.; Bridge, R.; Breder, K. Characterization of vickers, berkovich, spherical and cube cornered diamond indenters by nanoindentation and SFM. MRS Online Proc. Libr. 1998, 522, 45. [Google Scholar] [CrossRef]
  39. Shikimaka, O.; Grabco, D. Deformation created by Berkovich and Vickers indenters and its influence on surface morphology of indentations for LiF and CaF2 single crystals. J. Phys. D Appl. Phys. 2008, 41, 074012. [Google Scholar] [CrossRef]
  40. Zong, W.; Wu, D.; He, C. Radius and angle determination of diamond Berkovich indenter. Measurement 2017, 104, 243–252. [Google Scholar] [CrossRef]
  41. Čech, J.; Haušild, P.; Kovářík, O.; Materna, A. Examination of Berkovich indenter tip bluntness. Mater. Des. 2016, 109, 347–353. [Google Scholar] [CrossRef]
  42. Nohava, J.; Čech, J.; Havlíček, M.; Consiglio, R. Indenter wear study and proposal of a simple method for evaluation of indenter blunting. J. Mater. Res. 2021, 36, 4449–4459. [Google Scholar] [CrossRef]
  43. Zhao, J.; Zhang, D.; Wu, T.; Tang, H.; Xuan, Q.; Jiang, Z.; Dai, C. Multiscale approach for mechanical characterization of organic-rich shale and its application. Int. J. Geomech. 2019, 19, 04018180. [Google Scholar] [CrossRef]
  44. Page, T.F.; Oliver, W.C.; McHargue, C.J. The deformation behavior of ceramic crystals subjected to very low load (nano) indentations. J. Mater. Res. 1992, 7, 450–473. [Google Scholar] [CrossRef]
  45. Sato, Y.; Shinzato, S.; Ohmura, T.; Hatano, T.; Ogata, S. Unique universal scaling in nanoindentation pop-ins. Nat. Commun. 2020, 11, 4177. [Google Scholar] [CrossRef]
  46. Bradby, J.; Williams, J.; Swain, M.V. Pop-in events induced by spherical indentation in compound semiconductors. J. Mater. Res. 2004, 19, 380–386. [Google Scholar] [CrossRef]
  47. Abdallah, Y.; Vandamme, M.; Chateau, C.; Garnier, D.; Jolivet, I.; Onaisi, A.; Richard, D.; Zandi, S. Linking elastic properties of various carbonate rocks to their microstructure by coupling nanoindentation and SEM-EDS. Int. J. Rock Mech. Min. Sci. 2023, 170, 105456. [Google Scholar] [CrossRef]
  48. Faisal, T.F.; Islam, A.; Jouini, M.S.; Devarapalli, R.S.; Jouiad, M.; Sassi, M. Numerical prediction of carbonate elastic properties based on multi-scale imaging. Geomech. Energy Environ. 2019, 20, 100125. [Google Scholar] [CrossRef]
  49. Tandon, R.S.; Gupta, V. The control of mineral constituents and textural characteristics on the petrophysical & mechanical (PM) properties of different rocks of the Himalaya. Eng. Geol. 2013, 153, 125–143. [Google Scholar] [CrossRef]
  50. Ahrens, T.J. Mineral Physics and Crystallography: A Handbook of Physical Constants; American Geophysical Union: Washington, DC, USA, 1995. [Google Scholar]
  51. Eliyahu, M.; Emmanuel, S.; Day-Stirrat, R.J.; Macaulay, C.I. Mechanical properties of organic matter in shales mapped at the nanometer scale. Mar. Pet. Geol. 2015, 59, 294–304. [Google Scholar] [CrossRef]
  52. Jiang, K.; Zhou, W.; Deng, N.; Song, W. Statistical analysis and significance of pyrite in the Wufeng-Lower Longmaxi Shale Formation in South China. Arab. J. Geosci. 2020, 13, 1181. [Google Scholar] [CrossRef]
  53. Zhou, Q.; Liu, J.; Ma, B.; Li, C.; Xiao, Y.; Chen, G.; Lyu, C. Pyrite Characteristics in Lacustrine Shale and Implications for Organic Matter Enrichment and Shale Oil: A Case Study from the Triassic Yanchang Formation in the Ordos Basin, NW China. ACS Omega 2024, 9, 16519–16535. [Google Scholar] [CrossRef]
  54. Deirieh, A.; Ortega, J.; Ulm, F.-J.; Abousleiman, Y. Nanochemomechanical assessment of shale: A coupled WDS-indentation analysis. Acta Geotech. 2012, 7, 271–295. [Google Scholar] [CrossRef]
  55. Wilkinson, T.M.; Zargari, S.; Prasad, M.; Packard, C.E. Optimizing nano-dynamic mechanical analysis for high-resolution, elastic modulus mapping in organic-rich shales. J. Mater. Sci. 2015, 50, 1041–1049. [Google Scholar] [CrossRef]
  56. Wei, Y.; Liang, S.; Gao, X. Phase quantification in cementitious materials by dynamic modulus mapping. Mater. Charact. 2017, 127, 348–356. [Google Scholar] [CrossRef]
  57. Wang, C.Y.; Mao, N.H.; Wu, F.T. Mechanical properties of clays at high pressure. J. Geophys. Res. Solid Earth 1980, 85, 1462–1468. [Google Scholar] [CrossRef]
  58. Goodarzi, M.; Rouainia, M.; Aplin, A.; Cubillas, P.; de Block, M. Predicting the elastic response of organic-rich shale using nanoscale measurements and homogenisation methods. Geophys. Prospect. 2017, 65, 1597–1614. [Google Scholar] [CrossRef]
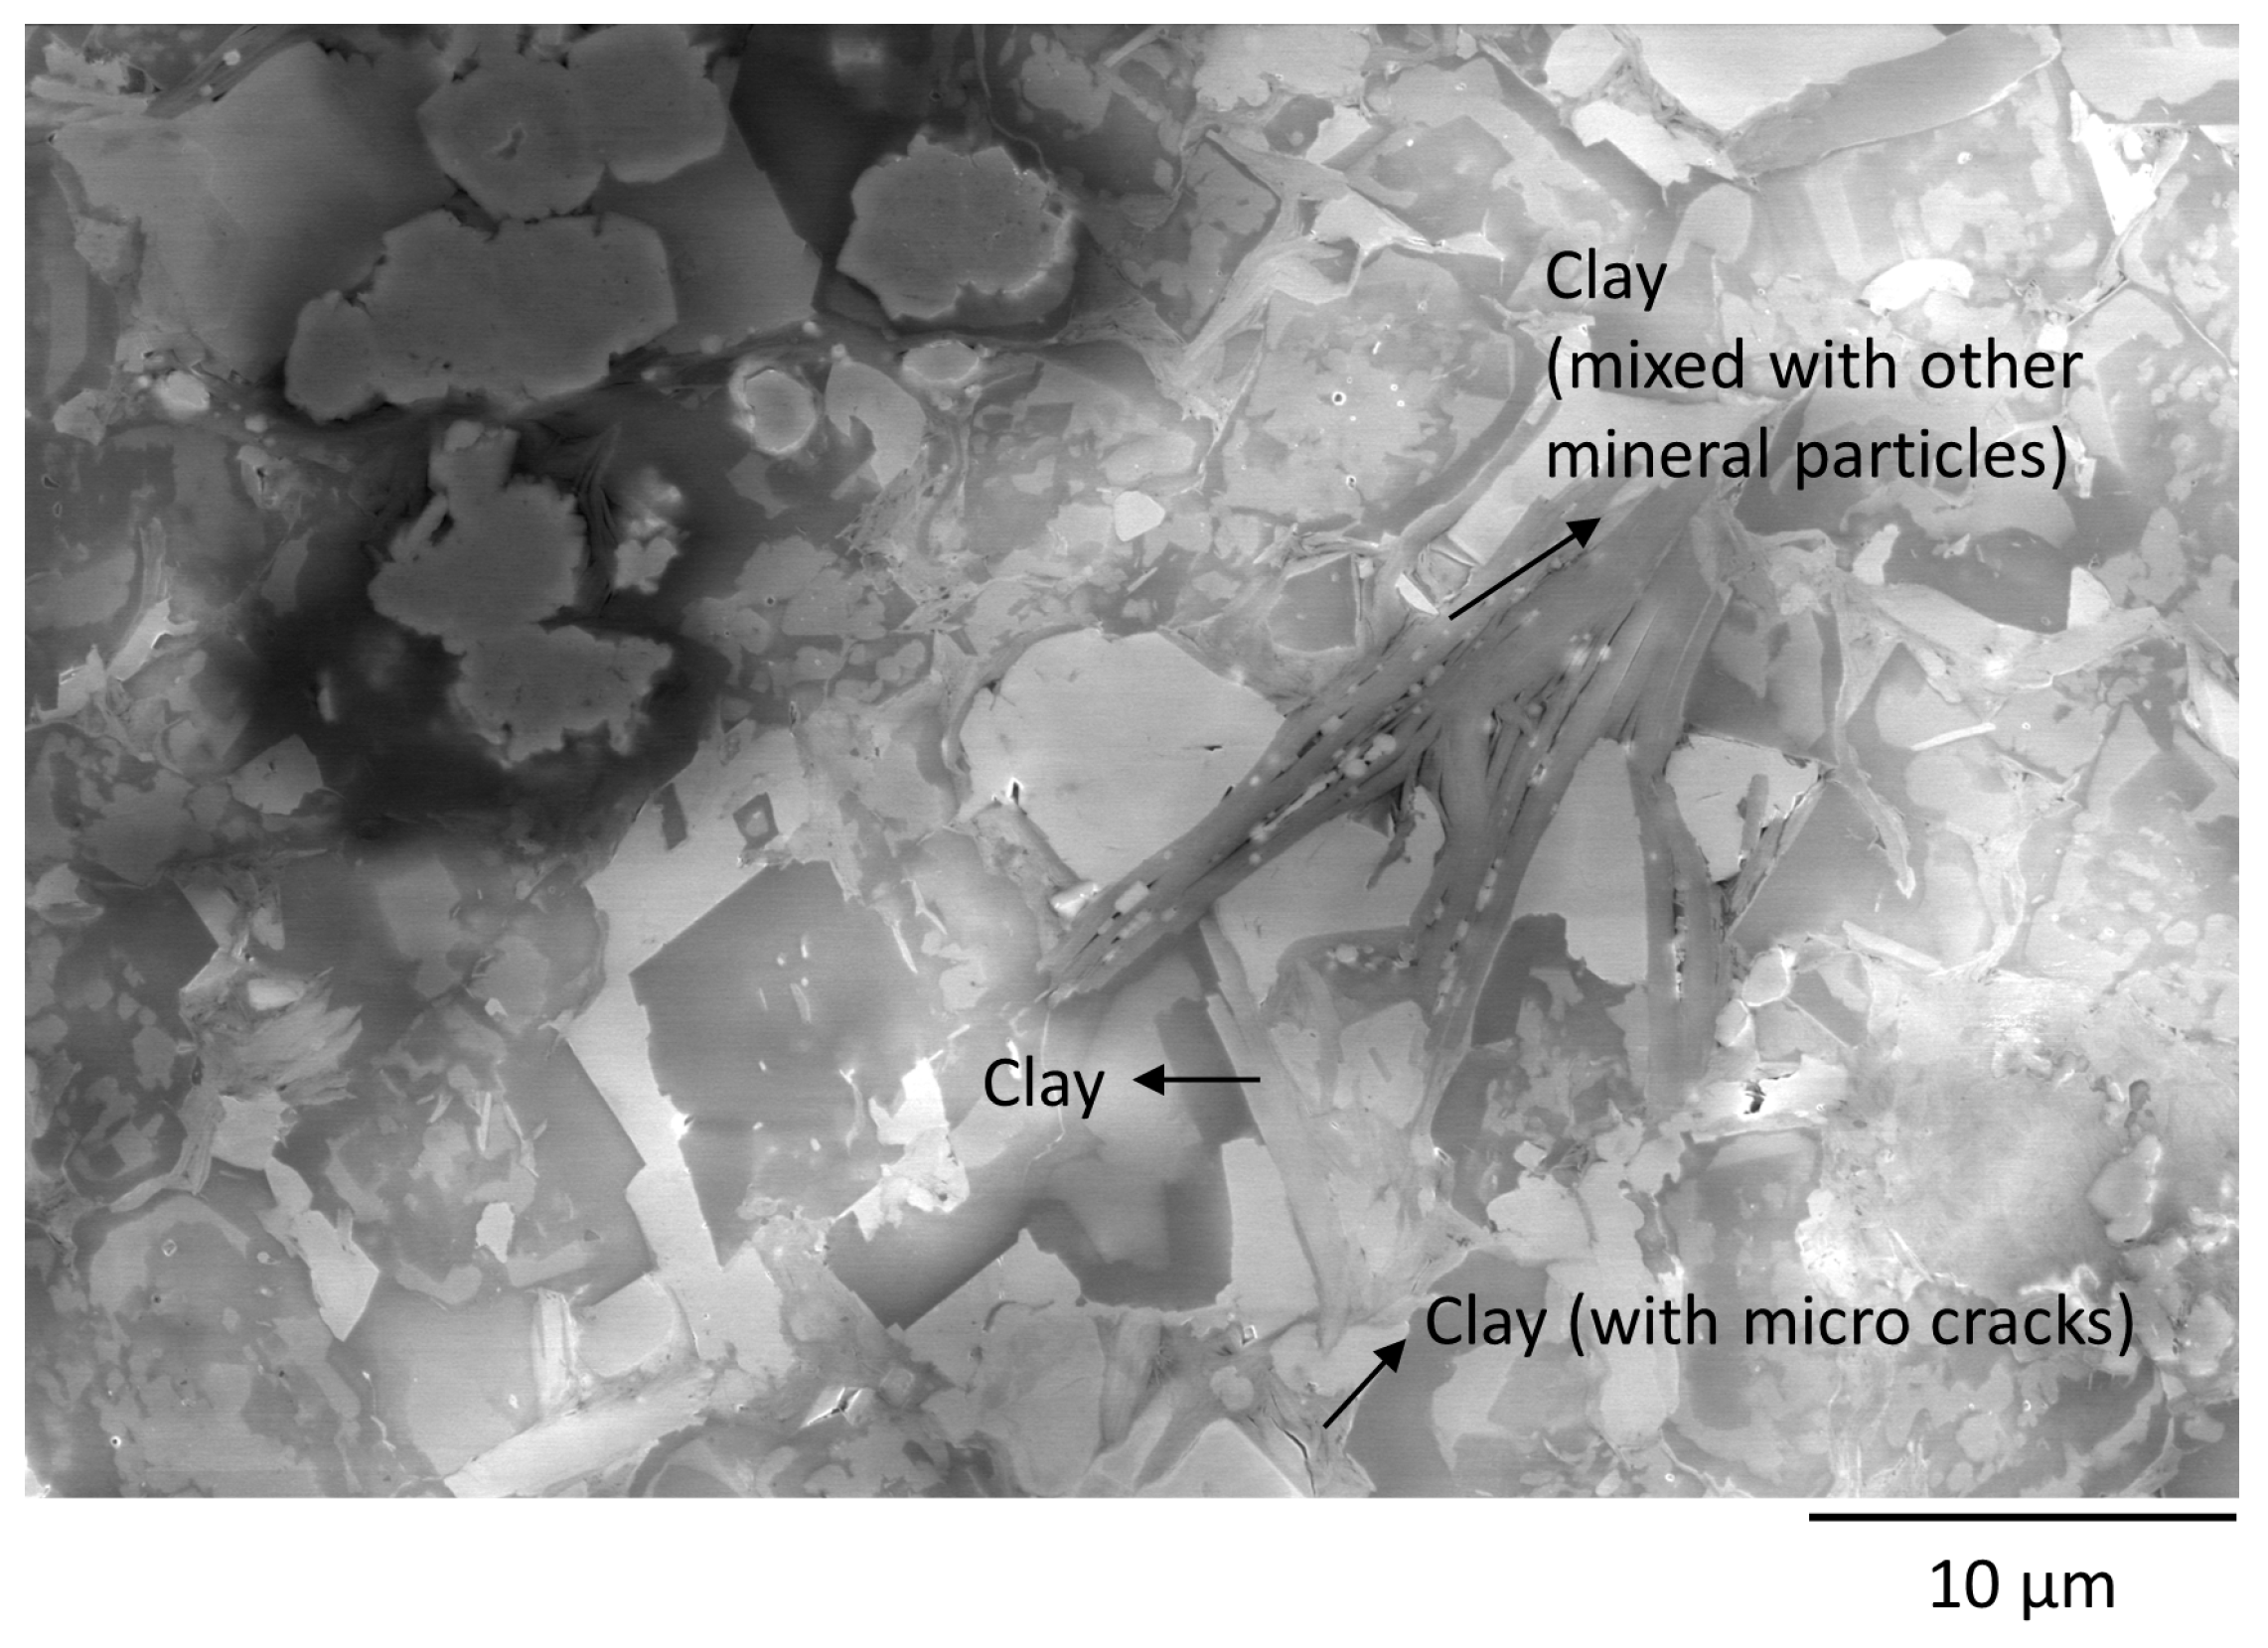
Figure 1. SEM image of the carbonate rock sample.
Processes 12 02727 g001
Figure 2. Schematic diagram of load-displacement curve from the nanoindentation measurement (modified from Oliver and Pharr [35]).
Processes 12 02727 g002
Figure 3. SEM observation and EDS analysis of the test area. The chemical element content is denoted by the corresponding colorful point con-centration on the black background.
Processes 12 02727 g003
Figure 4. Positioning of the test area: (a) optical microscope image from the nanoindentation instrument, (b) corresponding low-magnification SEM image, (c) high-magnification SEM image of the test area, and (d) corresponding SPM image.
Processes 12 02727 g004
Figure 5. Experimental procedures of the nanoindentation test: (a) indentation points arrangement according to the SPM image; (b) setup of the loading, holding, and unloading segment; (c) record of the load and displacement data; and (d) SPM scan after nanoindentation measurement. Red circles denote the residual indentations after mechanical test.
Processes 12 02727 g005
Figure 6. Berkovich indenter and the geometry of contact region: (a) schematic model of ideal Berkovich indenter, (b) corresponding triangular pyramid contact region, (c) real diamond Berkovich indenter, and (d) near-round shape at the very tip of the real indenter.
Processes 12 02727 g006
Figure 7. Load-displacement curves for all nanoindentation points. Blue boxes denote pop-ins in the curves.
Processes 12 02727 g007
Figure 8. Nanoindentation results of the main minerals in the carbonate rock sample.
Processes 12 02727 g008
Figure 9. Sensitivity analysis of the Poisson’s ratio values of anhydrite and clay, respectively.
Processes 12 02727 g009
Table 1. Maximum displacement of different minerals.
Mineral TypeMaximum Displacement (nm)
Pyrite97.61 ± 7.38
Dolomite155.19 ± 16.13
Quartz120.25 ± 4.09
Anhydrite192.89 ± 18.04
Feldspar153.22 ± 18.43
Clay300.01 ± 58.22
Table 2. Poisson’s ratio values and reported Young’s moduli of different minerals.
Mineral TypePoisson’s Ratio [50]Reported Young’s Modulus (GPa)
Pyrite0.16129 [43]
Dolomite0.292115~120 [26]
Quartz0.079105~110 [26]
Anhydrite0.2591.3~108.5 [47]
Feldspar0.28575~85 [26]
Clay0.2530 [26]
Table 3. Characterization ability analysis results of nanoindentation with the experimental setup in this study.
Mineral TypeLateral Spatial Resolution (μm)Elastic Response Depth (μm)
Pyrite0.65 ± 0.050.39 ± 0.03
Dolomite1.06 ± 0.110.62 ± 0.06
Quartz0.69 ± 0.040.48 ± 0.02
Anhydrite1.32 ± 0.140.77 ± 0.07
Feldspar0.87 ± 0.130.62 ± 0.08
Clay2.08 ± 0.461.20 ± 0.23
Disclaimer/Publisher’s Note: The statements, opinions and data contained in all publications are solely those of the individual author(s) and contributor(s) and not of MDPI and/or the editor(s). MDPI and/or the editor(s) disclaim responsibility for any injury to people or property resulting from any ideas, methods, instructions or products referred to in the content.