Article

Effect of Froth on the Interaction Between Coal Particles and Cake Structures in the Dewatering Process of Clean Coal

1
College of Mining Engineering, Taiyuan University of Technology, Taiyuan 030024, China
2
College of Safety and Emergency Management Engineering, Taiyuan University of Technology, Taiyuan 030024, China
3
Shanxi Research Institute for Clean Energy, Tsinghua University, Taiyuan 030032, China
4
State Key Laboratory of Mineral Processing, Beijing 100160, China
*
Authors to whom correspondence should be addressed.
Processes 2024, 12(12), 2738; https://doi.org/10.3390/pr12122738
Submission received: 14 November 2024 / Revised: 25 November 2024 / Accepted: 29 November 2024 / Published: 3 December 2024
(This article belongs to the Topic Energy Extraction and Processing Science)

Abstract

Effective coal slurry water solid–liquid separation is indispensable for the recycling and sustainable development of coal resources. The interaction between bubble and coal particles plays a critical role in the process of dewatering for clean coal. In this study, we firstly conducted a comprehensive investigation of the impact of froth on the interactions between coal particles by rheological measurement and particle aggregation behavior. Furthermore, the macroscopic dewatering performance of coal slurry in the presence of froth and its microscopic cake structure were investigated using the filtration test and X-ray microtomography (CT). It was found that the interaction between coal particles in the presence of froth was enhanced as a result of the dynamic shear value, combined with the large floc size and compact structure, which led to a higher cake moisture and higher filtration velocity. The CT results indicated that the enhanced interaction of particles in the presence of froth also led to a dense microstructure of the filter cake. The porosity of the filter cake decreased to 2.05% when the aeration time increased from 0 s to 90 s, the throat radius in the filter cake was reduced to 1.32 μm, and the number of throat passages was reduced to one third. Multiple blind pores and low coordination numbers led to a poor connectivity of the pore network and high moisture content.

1. Introduction

Coal slurry water is a common intermediate product in the process of coal resource processing and utilization. Effective treatment of coal slurry water is not only beneficial for the recycling and utilization of coal and water resources, but also can effectively protect the environment, which is of great significance for the sustainable development of a green ecology and carbon neutrality [1]. Froth flotation is widely recognized as the most accepted technology for recovering fine coal from slime water in coal preparation plants [2,3]. Flotation is a water-based separation process, which means that the froth product obtained after separation contains a large amount of water [4,5,6,7]. The presence of water will extremely limit the utilization of coal, not only wasting a large amount of transportation resources, but also consuming a large amount of energy during the utilization process [8,9]. Additionally, moisture is an important indicator of the quality of coke produced from coal. An increase of 1% in the moisture content of coking coal leads to a lengthening of the coking time by 5–10 min. Therefore, clean coal must go through a dewatering process before it can be sold as a marketable product. Given the large sales volume of coal products, even a slight reduction in moisture content can effectively improve its economic benefits.
Filtration is one of the most commonly used processes for dewatering fine coal, which separates coal particles from water by applying external pressure to achieve the purpose of dewatering [10,11,12]. Usually, mechanical dewatering techniques such as centrifugation and pressure filtration are used for the dewatering of fine coal. In addition, dry stacking combined with chemical agents and plasma pretreatment are also employed to improve dewatering efficiency [13]. The dewatering performance of clean coal is often affected by several factors such as its particle properties, solution properties, and the type of added filter aids [14,15,16,17,18]. The addition of chemical agents, which typically include flocculants and surfactants, can alter the dewatering effect [19,20,21]. In addition, skeleton builders are also a dewatering agent used to improve the permeability of filter cakes [22]. The main reason why surfactants improve the dewatering performance of a mineral slurry include increasing the hydrophobicity of particles and reducing the surface tension of the filtrate [23]. According to the Young–Laplace equation, reducing surface tension can effectively decrease capillary forces and make it easier for capillary water to be removed, thereby reducing the moisture content in a filter cake. However, the use of surfactants during the flotation process, such as various frothing agents and collectors that enhance the surface activity of a coal slurry, also results in the generation of a large amount of froth in clean coal [24,25,26]. Froth is a substance consisting of gas, solid, and liquid phases. During the flotation process, hydrophobic coal particles adhere to bubbles and form a froth. The size and shape of the bubbles, its particle properties, and its solution properties are crucial factors determining the structure of froth, which in turn affects its stability [27]. Generally, smaller and more regular-shaped bubbles result in a better froth stability. In terms of its particles, its hydrophobicity affects their adhesion force with bubbles, leading to different froth stabilities [28]. When coarse particles adhere to bubbles, froth is more prone to rupture during the rising process. Additionally, clay minerals carried in clean coal can also alter the structure of froth. Taking kaolinite as an example, a mineral composed of a layer of aluminum oxide octahedra and a layer of silicon tetrahedra, it can form a three-dimensional card-house structure during the flotation process, enhancing froth’s stability.
The detrimental impact of froth on the dewatering efficiency of clean coal has been confirmed [29]. Previous studies showed that the stronger stability of froth will impact the dewatering efficiency of slurry significantly. A highly stable froth can decrease the formation time of the filter cake and increase the final moisture of the cake [30]. The dewatering efficiency of froth is closely related to its interfacial characteristics. Compared to coal slurry, froth is more elastic and rigid [31]. Research conducted by Zhang et al. found that salt ions in flotation slurry enhanced the interaction between particles by compressing the double layer on the surfaces of particles and bubbles. This led to an increased value of G’ in oscillatory rheology, which could increase the stability of the froth while reducing the capillary radii, and resulted in a poor dewatering efficiency [32]. In addition, a large number of scholars used machine learning to study flotation froth. They collected froth images and extracted characteristic parameters to predict its ash content, which provided the idea for this study to investigate the interaction between particles [33,34].
However, the filtration process often involves the formation of a filter cake. Therefore, it is necessary to not only consider factors such as particle properties and suspension rheology but also pay attention to the changes in the filter cake structure. Some researchers have recognized the importance of the filter cake structure and have found that because of the reduction in filter cake porosity, entrapped air bubbles in filter cakes significantly impede the flow of the water phase through the filter cake [35,36]. Additionally, trapped air bubbles can transform an incompressible filter cake into a compressible one and then lead to a severe filter cake blockage [37]. At present, there are still some shortcomings in the studies of filter cake structures. Firstly, the measurement of a filter cake structure often relies on slice sampling, using only a portion of the sliced sample results for the analysis, which cannot represent the overall microstructural characteristics of the filter cake. Secondly, when studying the parameters of a filter cake structure, the focus is usually limited to changes in porosity, failing to fully reveal the influence of froth on the microstructure of the filter cake. Previous studies have recognized the importance of filter cake structure in dehydration, but there has been no quantitative analysis on how the presence of bubbles affects the three-dimensional microstructure of a filter cake, resulting in insufficient clarity on the mechanism of bubble effects on filtration.
This paper aims to investigate the effect of froth on the dewatering of clean coal from a multiscale perspective. The macroscopic dewatering behavior of clean coal with various aeration times was evaluated, and the bubble size in the froth was investigated by a camera. Furthermore, we conducted a comprehensive analysis of a pore’s microstructural property using CT techniques. Moreover, the interaction between coal particles in the froth was determined through rheological measurement, Focused Beam Reflectance Measurement (FBRM), and scanning electron microscopy (SEM). This study is expected to provide a theoretical reference for improving the solid–liquid separation efficiency of clean coal.

2. Materials and Methods

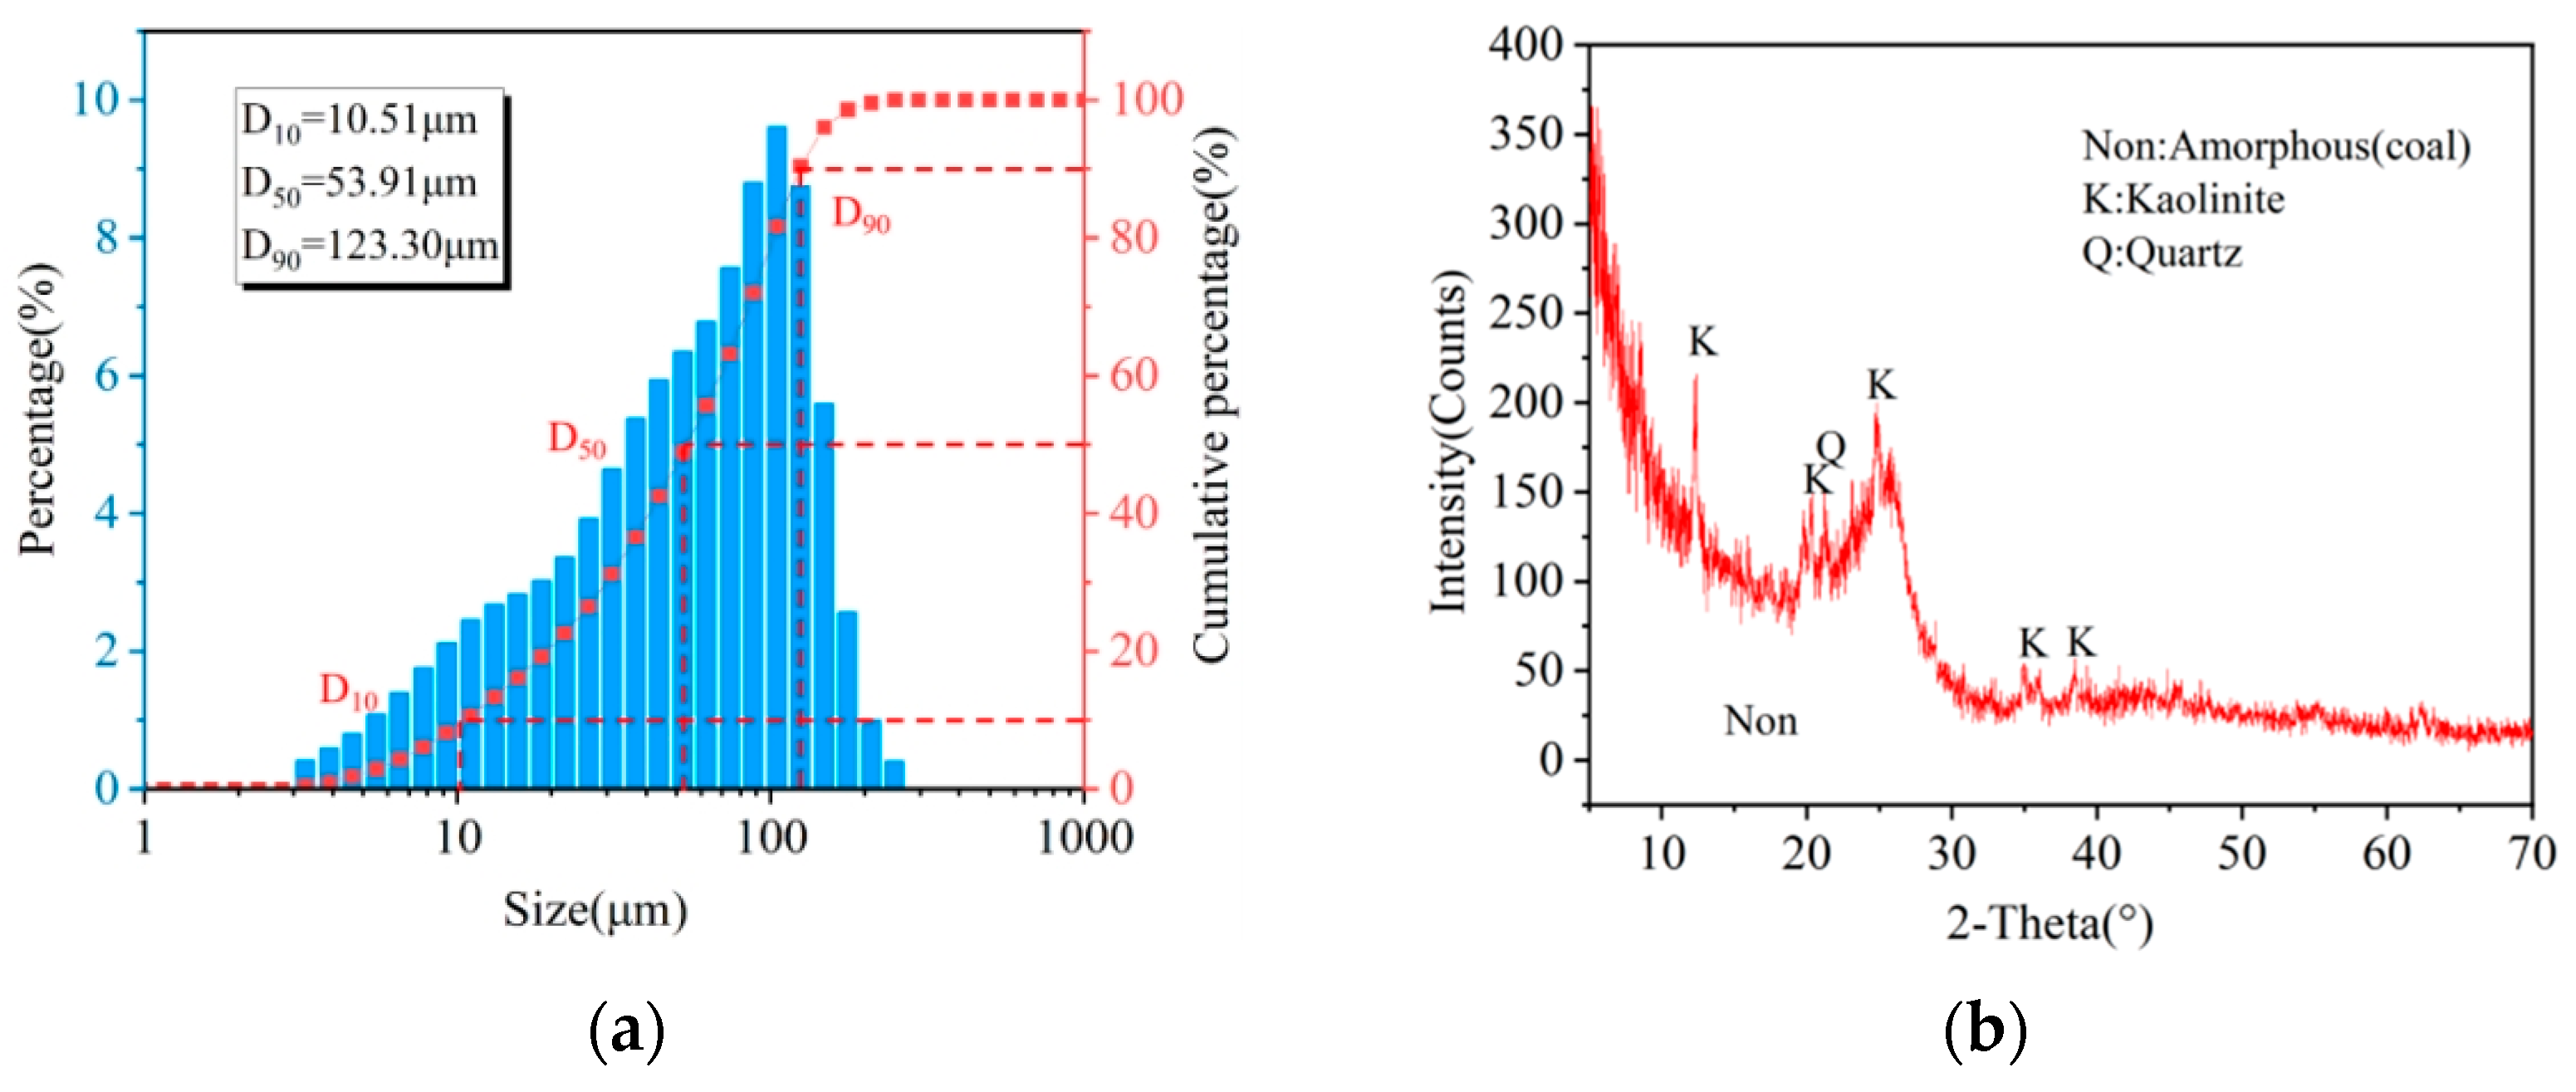
2.1. Materials and Reagents

In this study, the clean coal was collected from a Xiqu coal preparation plant in Gujiao, Shanxi Province, China, with an ash content of 11.23%. The particle size distribution of the clean coal was measured using a Mastersizer 3000 laser particle size analyzer. The results of the particle size measurements are presented in Figure 1a, in which the blue bar represents the percentage of particle size, and the red dotted and dashed line represents the cumulative percentage The D10, D50, and D90 values of the sample were approximately 10.51, 53.91, and 123.30 μm, respectively. The mineral composition of the sample is depicted in Figure 1b. The X-ray diffraction (XRD) analysis indicated that the mineral impurities were kaolinite and quartz. Tween 80 [38], a non-ionic surfactant, was used to produce stable froth, and the dosage was 100 g/t. Tween 80 (analytical-grade) was received from Shanghai Aladdin Biochemical Technology Co., Ltd., Shanghai, China. The conductivity of the Milli-Q water in this study was 18.2 MΩ/cm at 25 °C.

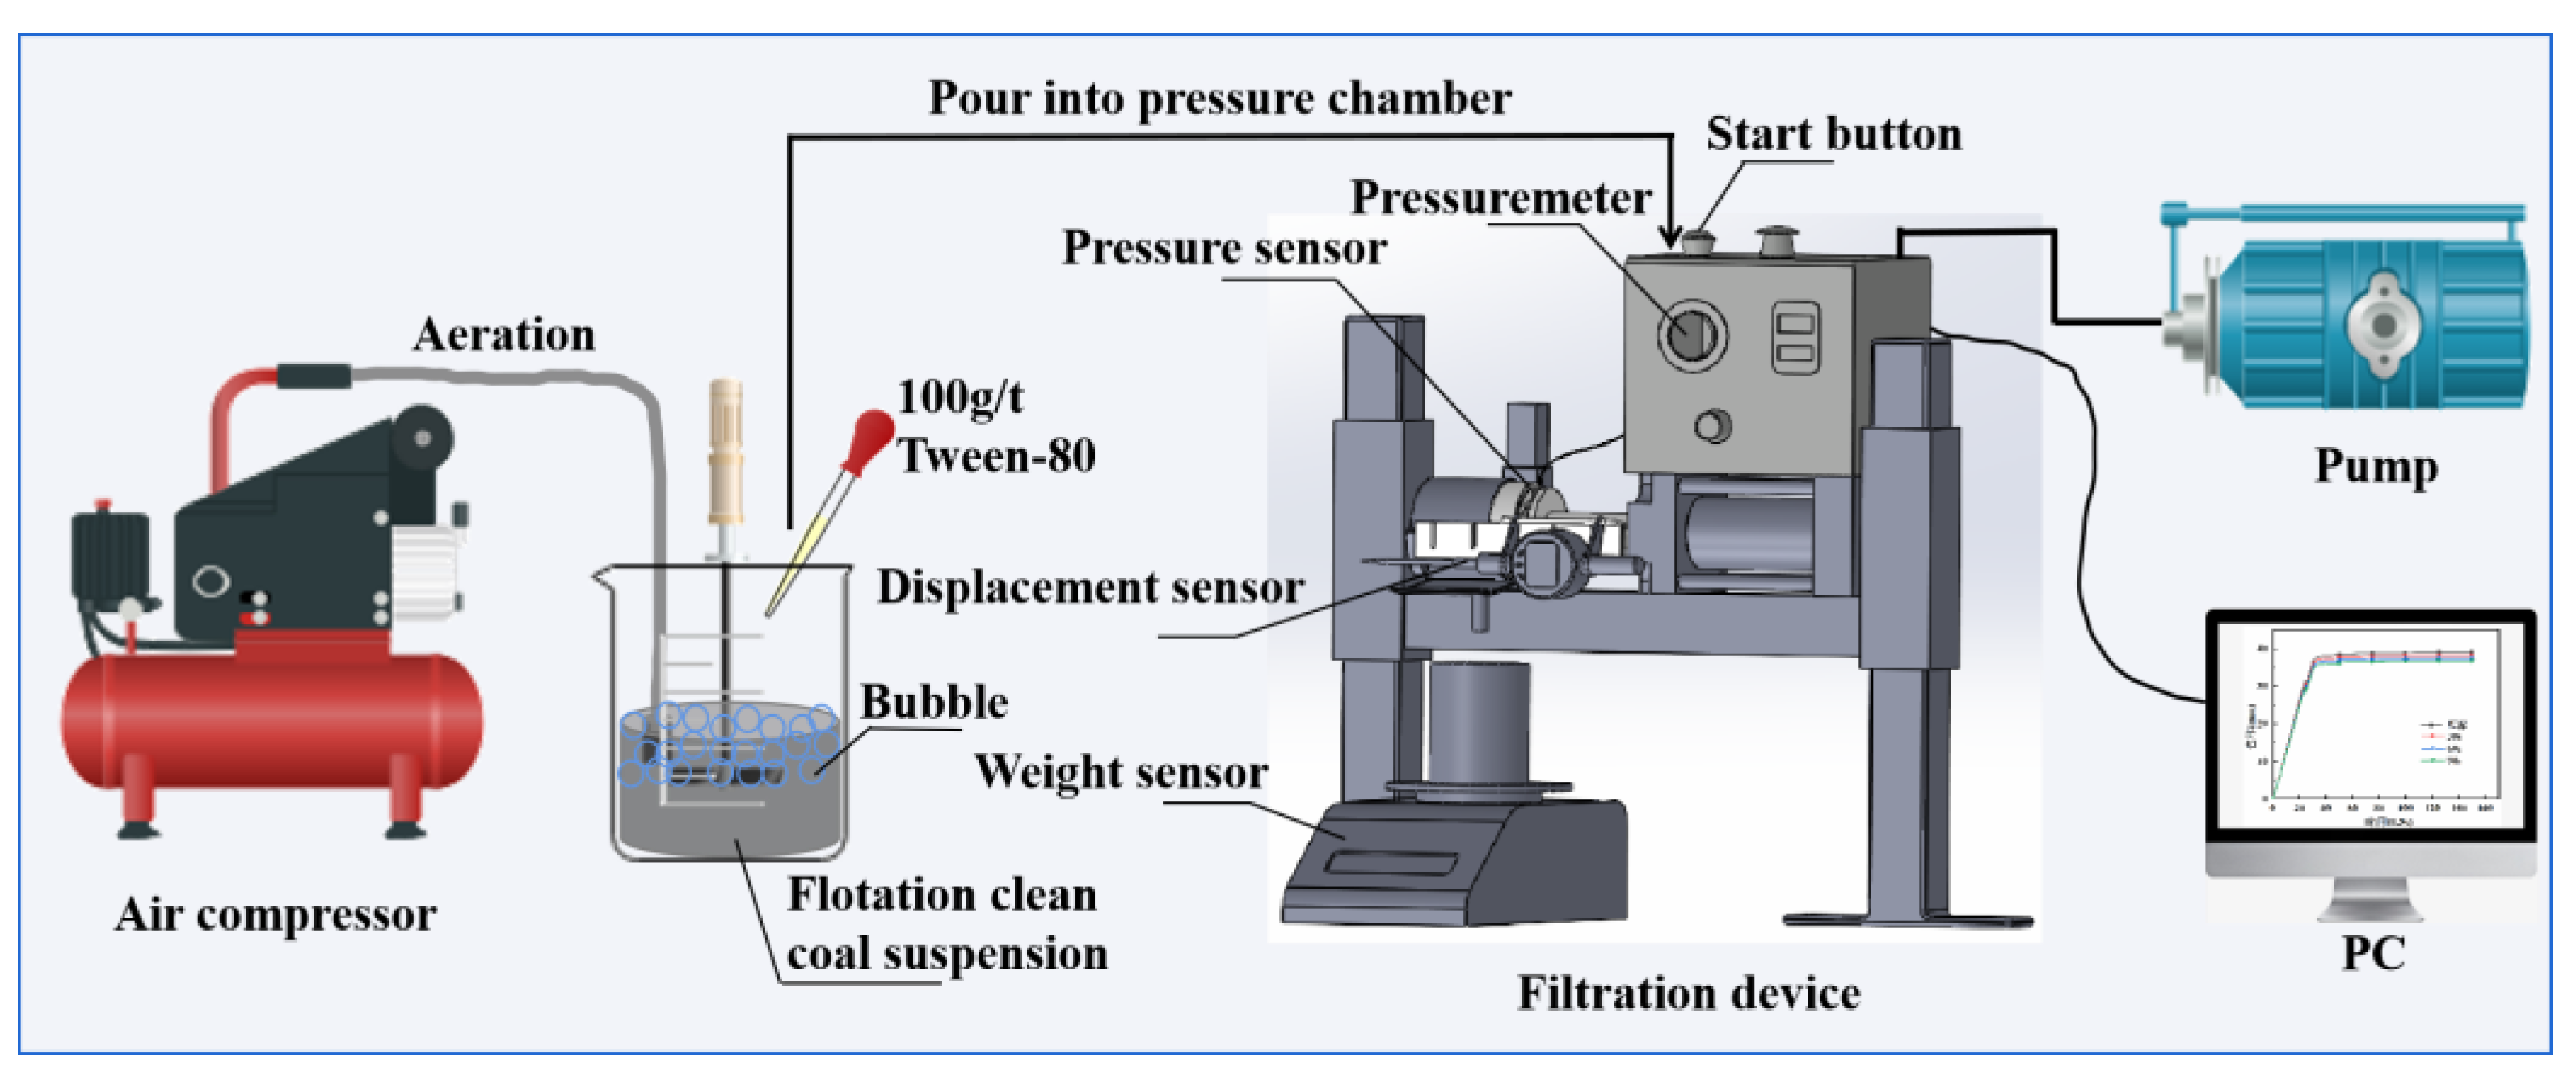
2.2. Filtration Tests

Figure 2 illustrates the schematic flow diagram of the clean coal filtration system. The sample for the filtration experiment consisted of 10 g of coal and 100 mL of deionized water. Firstly, the sample was stirred at a speed of 400 r/min for 15 min to fully mix with water. Secondly, 100 g/t Tween 80 was added to the suspension and stirred for 2 min. Then, an air compression pump was used to inflate the coal slurry to obtain clean coal with bubbles.
Next, a filtration test was conducted. The air compression pump of the filtration device was started and the pressure was adjusted to 0.6 Mpa. Then, the prepared sample was poured into the sample pool of the filtration device, and the sample pool was securely fixed in the dewatering device. Before the switch of the filtration device was turned on, data acquisition software was activated. During the filtration process, the thickness of the filter cake and the mass of the filtrate were recorded separately using a displacement sensor and weight sensor. After filtration, the filter cake was collected, and the moisture content and structure of the filter cake were further measured.

2.3. Rheological Measurement

The rheological property of the froth was conducted using a Rotary Rheometer (NDJ-9S, Shanghai Pingxuan Scientific Instrument Co., Ltd., Shanghai, China), with a measurement temperature of 25 °C. Due to the high solid content of the clean coal in this experiment, it was approximated as a non-Newtonian fluid [39]. The interaction between the coal particles in the froth and the interaction between the particles and the water made it necessary to overcome a certain initial stress (i.e., yield stress) before it started to flow when subjected to an external force, just as described by the Bingham equation. Before reaching the yield stress, coal slurry is more like a semi-solid with a certain structure. When the applied shear stress exceeds the yield stress, the coal slurry begins to flow, and the difficulty of Its flow (flow resistance) Is reflected by its plastic viscosity.
Shear stress τ was calculated according to Formula (1), and the rheological curve of clean coal was fitted using the Bingham equation (Equation (2)). The magnitude of the dynamic shear force reflects the strength of the interaction force between coal particles in a froth. The value of τ 0 reflects the shear dilution ability of the froth, i.e., the degree to which the apparent viscosity value decreases with an increasing shear rate. The larger the dynamic shear force value, the stronger the directional rearrangement effect of dispersed particles with an increasing shear rate, therefore the greater the interaction force between particles.
η ω γ = τ γ
τ = τ 0 + η p d u d y
where ηω(γ) is the viscosity, Pa·s; γ is the shear rate, s−1; τ 0 is the ultimate dynamic shear stress, Pa; ηp is the structural strength (plastic viscosity), mPa·s; and du/dy is the velocity gradient, s−1.

2.4. Flocculation Particle Size Measurement

The particle size of the clean coal was measured by Focused Beam Reflectance Measurement (FBRM S400, Mettler–Toledo Group, Zurich, Switzerland). FBRM is a technology that can monitor and track the changes in particles and droplets in real time. For testing, 1 g/L clean coal was prepared in a beaker and stirred at 400 r/min for 5 min. Subsequently, 100 g/t of Tween 80 was added and the aeration tube connected to the air pump was inserted below the liquid level. The particle size distributions at different aeration times were obtained by controlling the valve switch.

2.5. SEM Measurement

After the clean coal filtration was completed, a portion of the filter cake was collected carefully and dried naturally to avoid damaging its structure. The sample was placed on conductive tape, and the surface of the sample was swept with clean compressed gas to ensure that it was flat. Then, the sample was placed in a gold spray chamber, and the power was turned on for vacuuming. When the vacuum pressure reached a stable level, the current was adjusted to about 10 mA, and gold spraying was carried out for 40 s. After the gold spraying was completed, the micromorphology of the filter cake was tested using scanning electron microscopy (TESCAN MIRA LMS, TISKEN (China) Co., Ltd., Shanghai, China).

2.6. Analysis of Filter Cake Structure

The microstructure of the filter cake was measured using the NanoVoxel-3000 series X-ray microscope, which was independently developed by Sanying Precision Instrument Co., Ltd., Tianjin, China. Before scanning the samples, we sampled and cured the filter cake samples by the method presented in our previous research. A dual-detector design scheme was adopted, in which the optocoupler detector was based on the principle of secondary optical amplification to improve the magnification of the imaging [40]. The testing accuracy of the microscope was 500 nm, with a resolution of 6 μm. The working voltage was 60 kV and the current was 25 μA.

3. Results

3.1. Dewatering Tests

Figure 3 shows the changing trend of cake moisture with different aeration times. It can be seen from Figure 3a that with increasing in filtration time, the mass of filtrate gradually increased during the filtration process. In addition, as the aeration time increased, the final mass of the filtrate decreased. For the unaerated sample, the final filtrate mass was 91 g. When the aeration time was increased to 90 s, the filtrate mass was reduced to 83 g. The time for the dehydration of the clean coal to reach equilibrium varied with the aeration time. When the aeration time increased from 0 s to 90 s, the dehydration equilibrium time decreased from 45.5 s to 36 s. The dehydration time was measured by the change In the mass of the filtrate. When the mass of the filtrate no longer increased, it was considered that the filtration had reached equilibrium. Therefore, the possible reason for the decrease in time was that the filter cake containing bubbles included more water that could not be removed by mechanical pressure. It can be seen from Figure 3b that as the aeration time increased, the moisture content of the filter cake increased. When the time was 90 s, the moisture content of the filter cake increased to 25.3%, an increase of 9.8% compared to the original value. The final filter cake moisture was consistent with the mass change in filtrate. The filtrate was the water flowing out from the filter cake. Therefore, when the moisture content in the original clean coal was constant, the larger the filtrate mass, the more water could be discharged, leading to a decrease in the moisture content of the filter cake.
According to Darcy’s law, during the filtration process, the thickness of the filter cake increased due to the continuous deposition of solid particles on the surface of the filter cake, and the flow rate of the filtrate and pressure drop also varied with filtration time. Therefore, the dehydration process was divided into three stages (Figure 4): the filter cake formation stage, the compression dehydration stage, and the filter cake compression stage. As the filtration proceeded, the filter cake gradually formed and was compressed and dehydrated under pressure. When most of the free water and part of the capillary water in the filter cake were removed, the filter cake would only be compressed under pressure and no more water would be discharged. Then, the remaining moisture in the filter cake included part of the free water, capillary water, and all of the bound water. As the aeration time increased, the amount of froth in the suspension increased, and the thickness of the filter cake formed after dehydration increased. When the aeration time increased to 90 s, the thickness of the filter cake increased from the original 4.3 mm to 6.6 mm, resulting in the filter cake having a higher moisture.

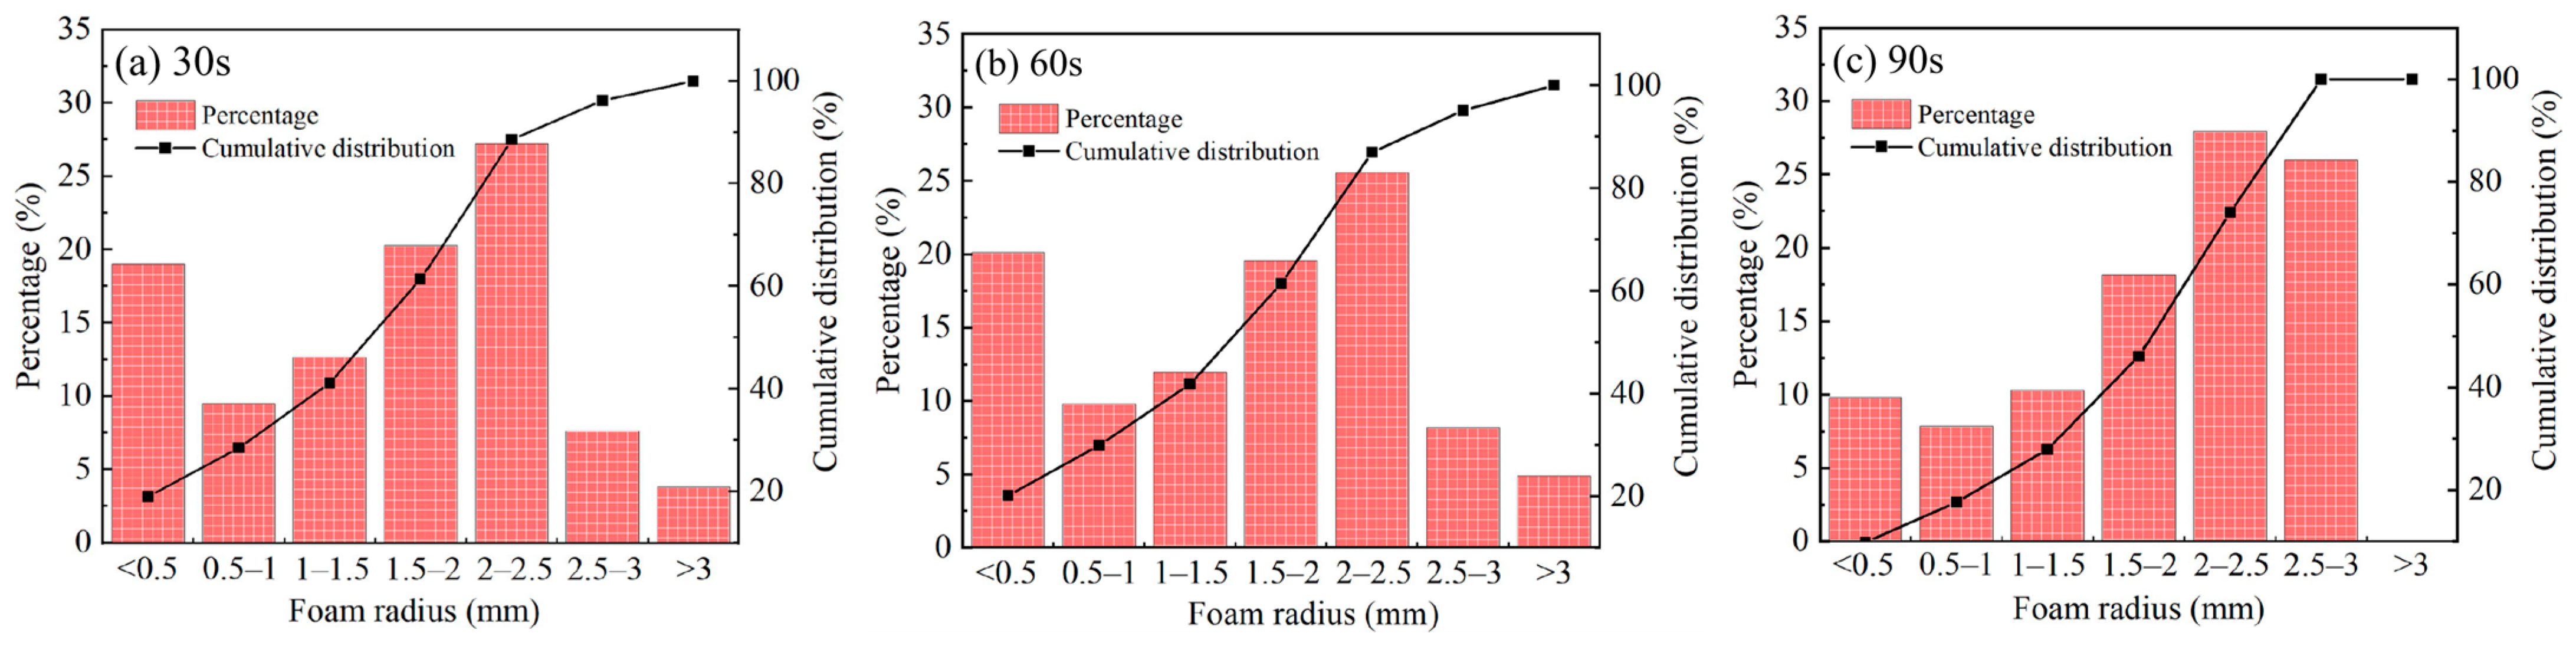
3.2. Bubble Size Measurement

In this study, a camera was used to capture images of clean coal under different aeration times (30 s, 60 s, 90 s). The bubble images were analyzed by ImageJ v1.8.0 software (Figure 5), and their size distributions were calculated (Figure 6).
Figure 5 shows that as the aeration time increased, the sizes of the bubbles showed a decreasing trend. When the aeration time was 30 s, there are obvious large bubbles in Figure 5a. When the aeration time increased to 60 s, the large bubbles disappeared. The bubble size became more uniform at 90 s. In addition, the aeration also made the shape of the bubbles tend to be circular and more regular.
It can be seen from Figure 6 that as the aeration time increased, the number of bubbles gradually increased. The corresponding bubble numbers when the aeration times were 30 s, 60 s, and 90 s were 158, 184, and 204, respectively. When the aeration time reached 90 s, the bubbles with a radius of <0.5 mm were significantly reduced, the bubbles with a radius of >3 mm burst, and the bubble size in the froth distribution was more concentrated and more uniform. The bubbles with high uniformity had better stability and were less likely to break during the dehydration process. The moisture entrained in the froth was difficult to remove, thus affecting the final moisture content of the filter cake.

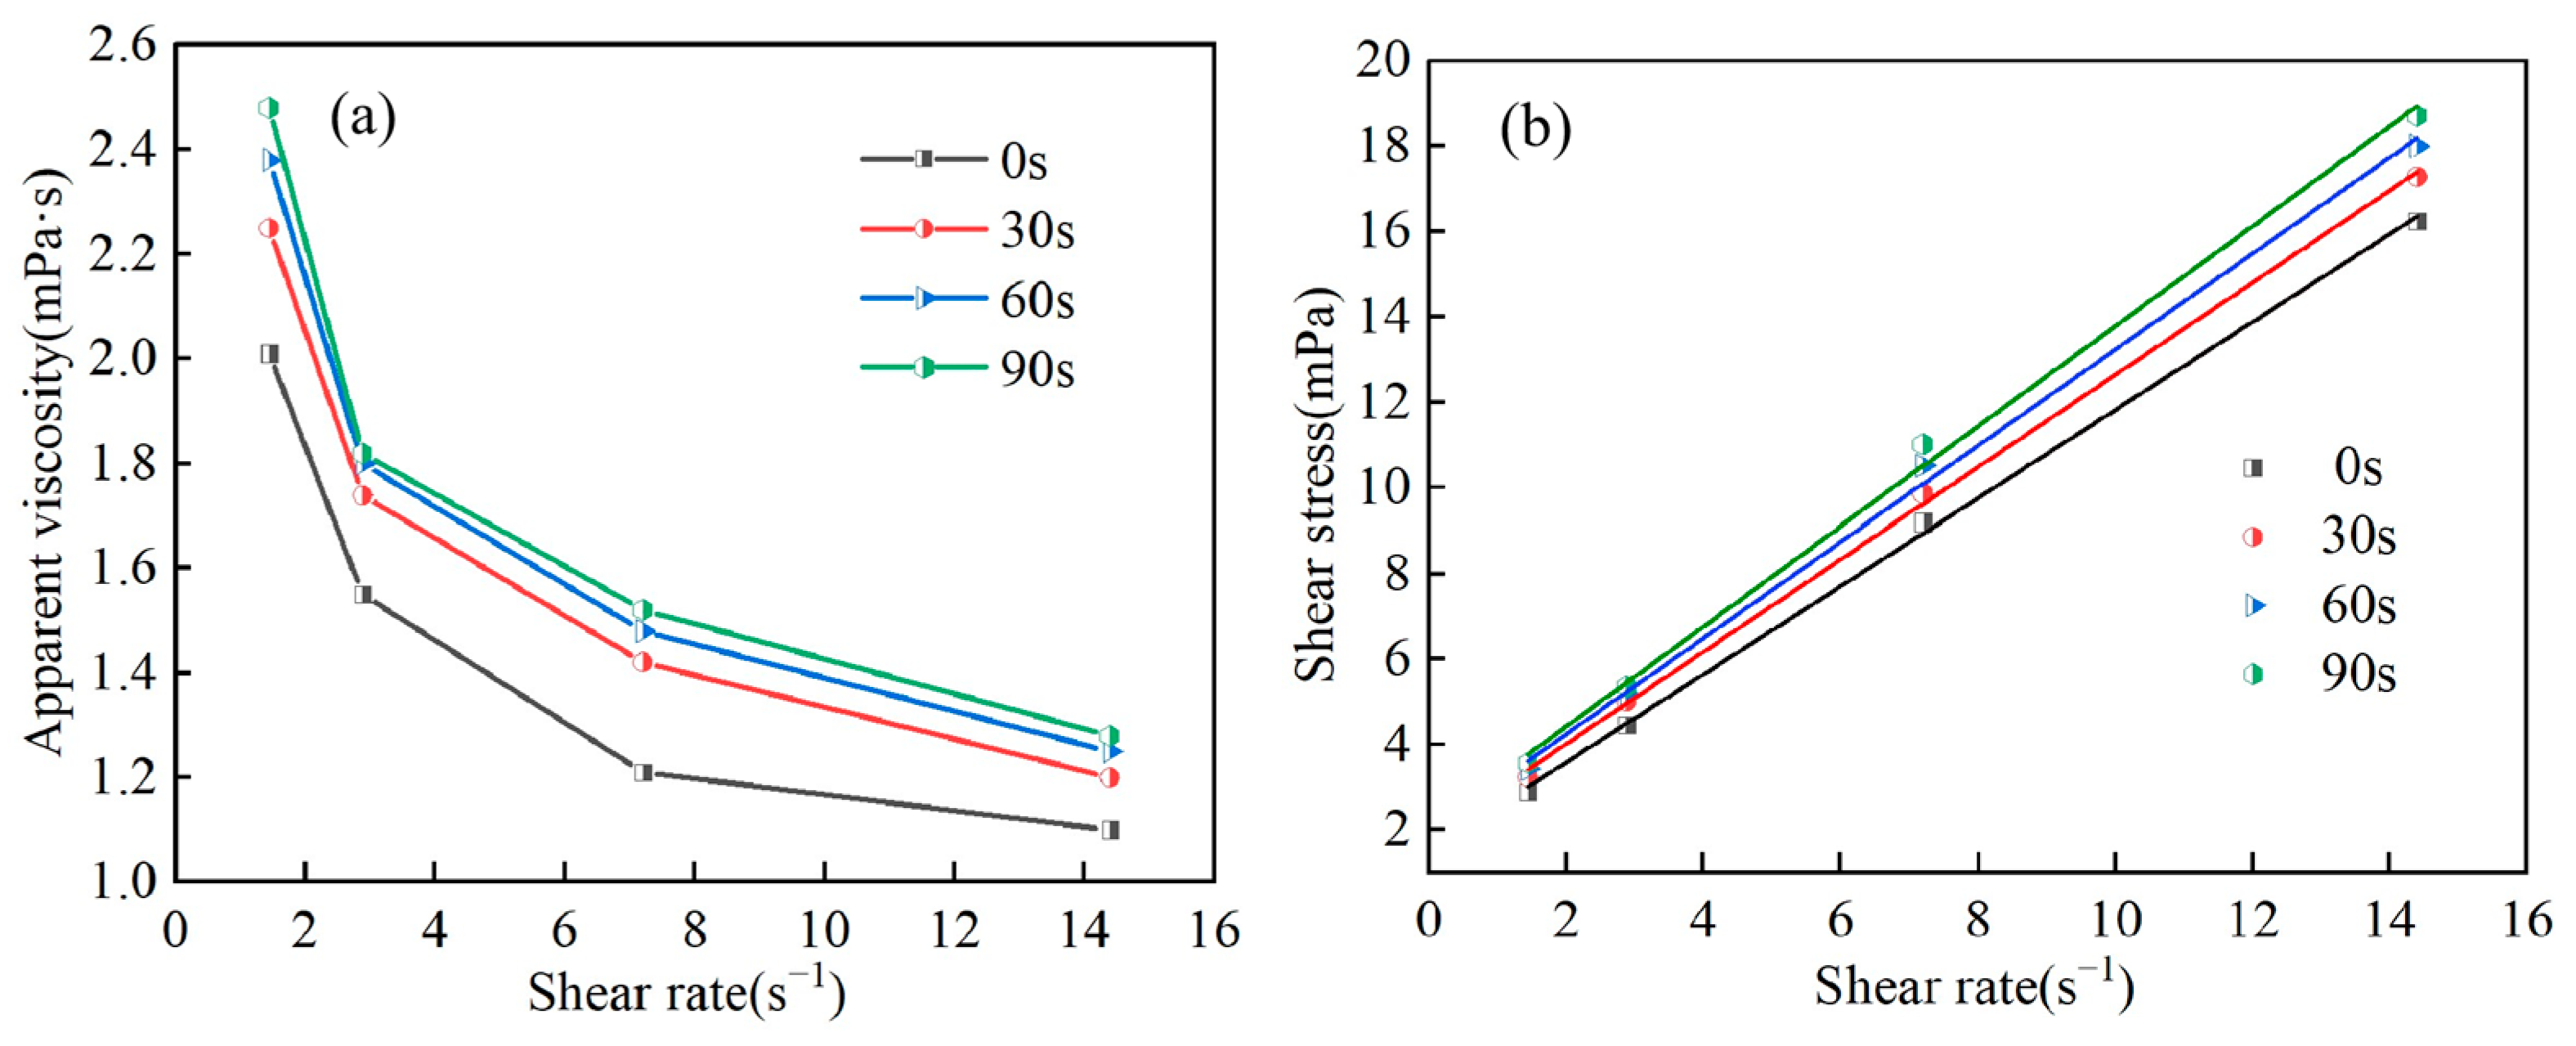
3.3. Rheological Properties

The rheological property of froth can reflect the strength of the interaction between coal particles. The shear rate–apparent viscosity and shear rate–shear stress curves of froth under different aeration times were measured, and the Bingham model was used to fit the latter [41]. The results are shown in Figure 7 and Table 1.
It can be seen from Figure 7 that the apparent viscosity of the froth decreased with an increase in the shear rate, and the shear stress increased as the shear rate increased. As the aeration time increased, the apparent viscosity of the froth gradually increased, and the flow performance of the froth became worse, thus affecting the dehydration performance. From the shear rate–shear stress curve it can be seen that the froth had typical non-Newtonian mechanical properties. As the aeration time increases, the shear rate–shear stress curve gradually moves upward, indicating that the aeration time had a certain impact on the rheology of the froth.
As can be seen from Table 1, the Bingham equation was used to fit the rheological curves of the froth at different aeration times. The final fitted correlation coefficient R2 was above 0.9975, indicating that the curve fitted by the Bingham equation was in good agreement with the experimental results. As the aeration time increased, the dynamic shear force value of the froth increased from 1.5295 mPa to 2.0824 mPa, indicating that as the aeration time increased, shear dilution ability increased, resulting in an increase in the interaction force and directional rearrangement between coal particles.

3.4. Floc Size Measurement

The size of a floc has a significant impact on the dehydration effect. Therefore, we analyzed the size of the particles in the froth under different aeration times, as shown in Figure 8. It can be seen from Figure 8 that when the aeration time was 30 s, the floc size reached a peak at 201 μm. As the aeration time increased, the peak particle size of the floc gradually shifted to the right. When the aeration time reached 90 s, the peak value shifted to 321 μm, indicating that the number of flocs with a particle size near 321 μm was the largest in the froth. It can be seen that the tiny particles in the froth gradually aggregated, leading to the emergence of large-sized flocs. As the aeration time increased, the amount of the froth increased. Those bubbles enhanced the interaction between the clean coal particles, resulting in a reduction in small flocs and an increase in large flocs. This increase in floc size reduced the time for dewatering to reach equilibrium. However, the larger flocs contained more water, which led to an increase in the cake moisture. This is consistent with the results of the filtration test.

3.5. Particle Aggregation Morphology

In order to further prove the influence of air bubbles on the interaction between particles, SEM tests were carried out on the filter cake, and the results are shown in Figure 9. The overall structure of the original filter cake was loose, and the coal particles were relatively independent. When the aeration time was 30 s, the medium-sized clean coal particles began to aggregate, and the small-sized particles had slight adhesion. As the aeration time increased, the particles became closer together. When the aeration time was 90 s, the coal particles were closely connected to each other, forming a certain network “wall” structure. These findings demonstrate that bubbles enhance the interaction forces between coal particles, causing the particles to gather together.

3.6. Microstructural Analysis of Filter Cake

3.6.1. CT Scanning and Image Threshold Segmentation

Previous studies confirmed that the presence of bubbles increases the interaction between particles, making them more aggregated. In order to further investigate the effect of bubbles on the microstructure of filter cakes, this study used X-ray CT technology to conduct three-dimensional scans of filter cakes with aeration times of 0 s and 90 s. The following steps were performed. Firstly, filter and segment the scanned grayscale slice image. Secondly, perform three-dimensional reconstruction of the filter cake, and calculate the pore size characteristics and porosity. Then, establish a corresponding filter cake pore network model to further analyze the relevant configuration relationship between pores and throats [42,43,44].
Figure 10a,b show the cross-sectional images of filter cakes obtained from CT scans at different aeration times. Both of them had similar grayscale characteristics and obvious multimodal distributions. The pixels with lower grayscale values are pores, while the areas with higher grayscale values are different particle components. Due to the non-uniformity of the target and background, as well as the difficulty in identifying voxel points below resolution, this paper proposes a method of combining the Interactive Thresholding module with the Interactive Top Hat module using logical OR Image operation to solve this problem, in order to better perform threshold segmentation on the grayscale image of the filter cake, the results are shown in Figure 10c,d. Comparing Figure 10c,d, it can be seen that when the aeration time was 90 s, the pores in the filter cake were significantly reduced, and they changed from large pores to small ones.

3.6.2. Porosity and Pore Size Distribution

To provide a more comprehensive analysis of the filter cake structure, this study used the Volume Rendering module in Avizo 9.4 software to perform 3D reconstruction of the pretreated 2D CT scan slices to obtain the 3D reconstructed image data to analyze their pore structure characteristics (Figure 11). The different colors represent the individual pore spaces separated from the whole pore space and have no other meanings. Generally, pore structure characteristics include size and topology characteristics. In this section, the size characteristics were deeply analyzed through the pore volume, porosity, pore number, and pore size calculation. The topology characteristic was investigated in Section 3.6.3.
The porosity of the filter cake was calculated by the ratio of the pore phase volume to the total sample volume, as shown in Table 2. When the suspension was not aerated, the pores formed in the filter cake were more developed, with a porosity of 4.02%. When the aeration time was 90 s, the porosity of the filter cake decreased to 2.05%. This result showed that in the dewatering process of the flotation froth, coal particles were subject to the strong capillary force at the gas–liquid interface, which was not conducive to the discharge of water and resulted in a high cake moisture [45]. Quantitative analysis was performed on each segmented pore object to obtain the pore size distribution results, as shown in Figure 12. As displayed in the histogram, the pore size distribution of the filter cake exhibited a similar pattern under different aeration times. More than 50% of pores consisted of a diameter between 0 μm and 10 μm, and very few pores had a diameter greater than 50 μm. When the aeration time increased from 0 s to 90 s, the total number of pores decreased from 10030 to 7833, and the number of pores with a diameter of 0–10 μm decreased from 5818 to 4356. This decrease in the number of pores meant that part of the water in the filter cake could not be discharged smoothly.

3.6.3. Quantitative Characterization of Pore–Throat Networks

In this part, the maximum ball algorithm was used to extract and establish a pore network model (PNM), which could more vividly and intuitively reflect the topological structure and geometric features of the original pore space [46,47,48]. We divided the individual pore spaces into pores and throats and described their connections, as shown in Figure 13. The red sphere represents the pore space where water flows, and the gray stick represents the channel connecting two pore spaces. Moreover, the pore-throat structure parameters were generated using Avizo 9.4 software (Table 3).
As presented in Table 3, the relevant parameters of the pore radius were very close, indicating that different aeration times had a slight effect on the radii of pores in the filter cakes. However, when the aeration time was 90 s, the throat radius of the filter cake significantly decreased, and higher pressure was required for water to pass through the narrow throat. This means that the presence of bubbles reduced the throat radius of the filter cake, increasing the difficulty of water discharge. In addition, in terms of quantity, the number of pores in filter cakes with different aeration times was relatively similar, while the number of throats in non-aerated filter cakes was approximately three times that of filter cakes with an aeration time of 90 s. As a connecting channel between two pore spaces, the reduction in the number of throats seriously affected the fluidity of water.
Furthermore, in order to better describe the connectivity of the pore networks, the coordination numbers of the pore network model are given in Table 4, which define how many throats a given pore will connect [49]. The pores with a coordination number of 0 in Table 4 indicated that the pores were blind end pores, and both types of filter cakes contained the majority of blind end pores. When the aeration time was 90 s, the content of blind pores in the filter cake was higher, and the maximum coordination number in the filter cake was 6. For non-aerated filter cakes, the pore coordination number significantly increased. Although the number of pores with high coordination numbers was not large, they could form a well-developed and connected network throughout the entire space, creating more pathways for water migration during the filtration process.

4. Discussion

Based on the experimental results obtained from different characterization methods, we can conclude that the deterioration of dewatering performance with the presence of bubbles contributed to the dense and poor connective microstructure of the pore space in the filter cake at the mesoscopic level (CT scanning test). Furthermore, the changes in the filter cake structure were a result of the enhancement in interaction between coal particles at the microscopic level, specifically manifested as the increase in the dynamic shear value of the suspension, increase in the floc size, and formation of a network “wall” structure.
At the macro level, with the increase in aeration time, a large number of uniform and stable froths were generated in the suspension, and the existence of froth significantly affected the rheological properties of the clean coal. With the increase in aeration time, the apparent viscosity of the froth gradually increased, and the flow performance became worse, thus affecting the dehydration performance. The increase in the dynamic shear force further enhanced the particle rearrangement ability, resulting in the compactness of the filter cake. In addition, the increase in floc size reduced the filtration time due to the aggregation of fine particles, which was caused by avoiding clogging of the filter medium.

5. Conclusions

The effect of froth on the dewatering of clean coal was analyzed comprehensively and in-depth from the perspectives of macroscopic dewatering performance, microscopic pore structure, and microscopic interactions. The main conclusions of this study are the following:
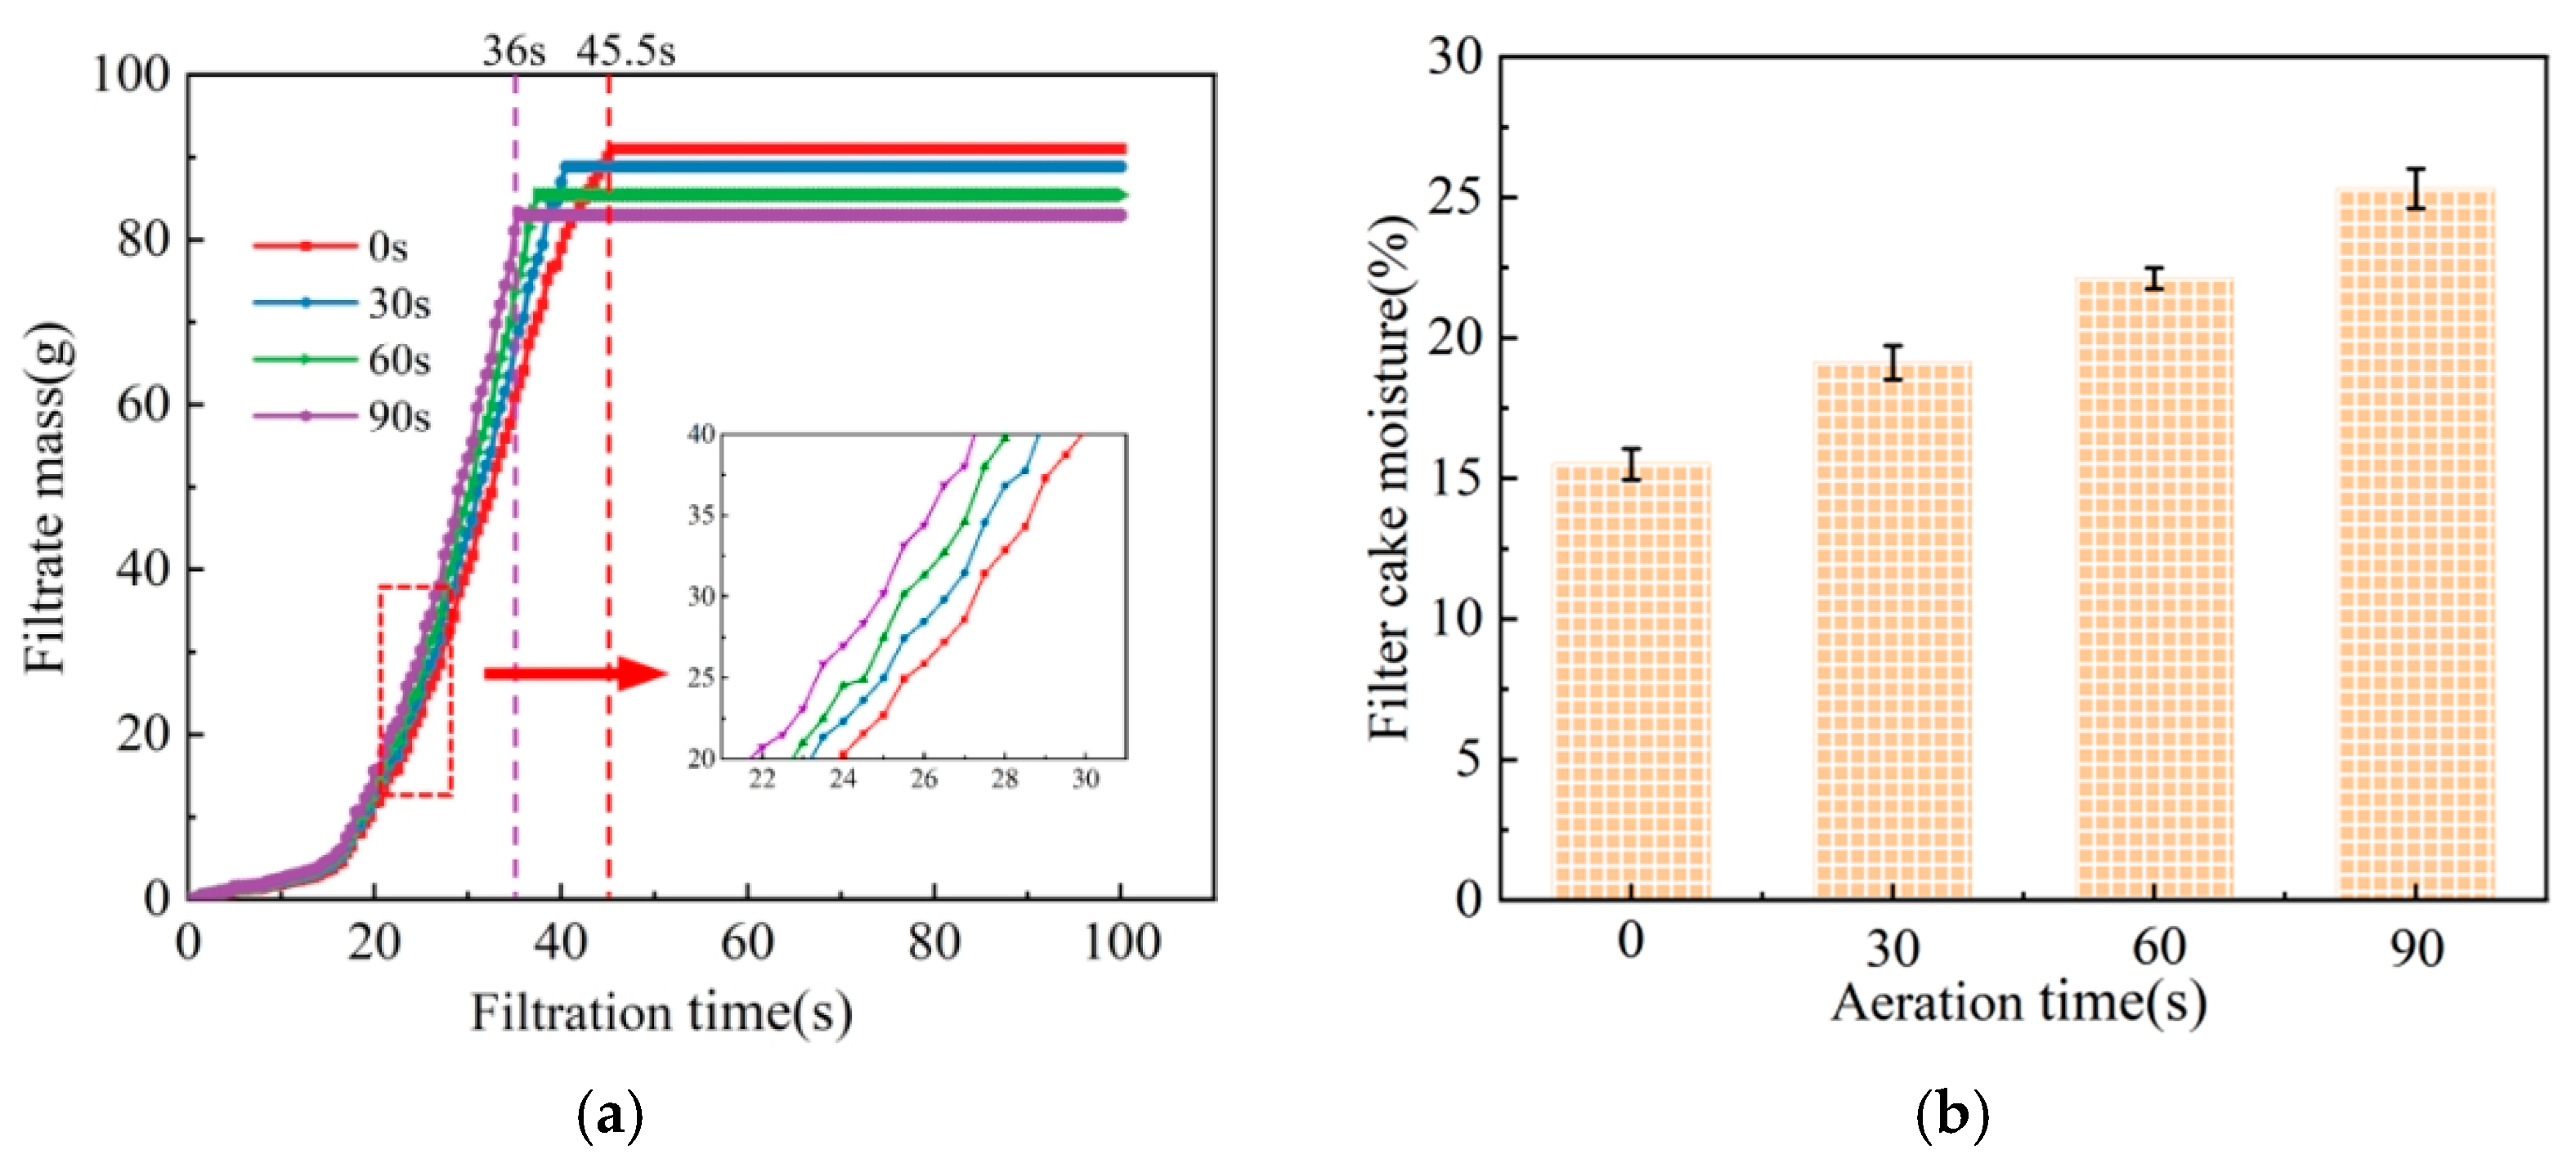
  • The number of bubbles gradually increased with the increase in aeration time. When the aeration times were 30 s, 60 s, and 90 s, the corresponding numbers of bubbles were 158, 184, and 204, respectively. The longer the aeration time was, the more uniform the bubble size distribution. In the pressure filtration test, the presence of froth led to the increase in the moisture in the filter cake and a reduction in the dewatering time. When the aeration time reached 90 s, the moisture content of the filter cake reached 25.3%. This demonstrates that the interaction between coal particles in the froth was enhanced as a result of the dynamic shear value of the suspension, combined with an increased floc size and network “wall” structure, which led to a dense microstructure of the filter cake.
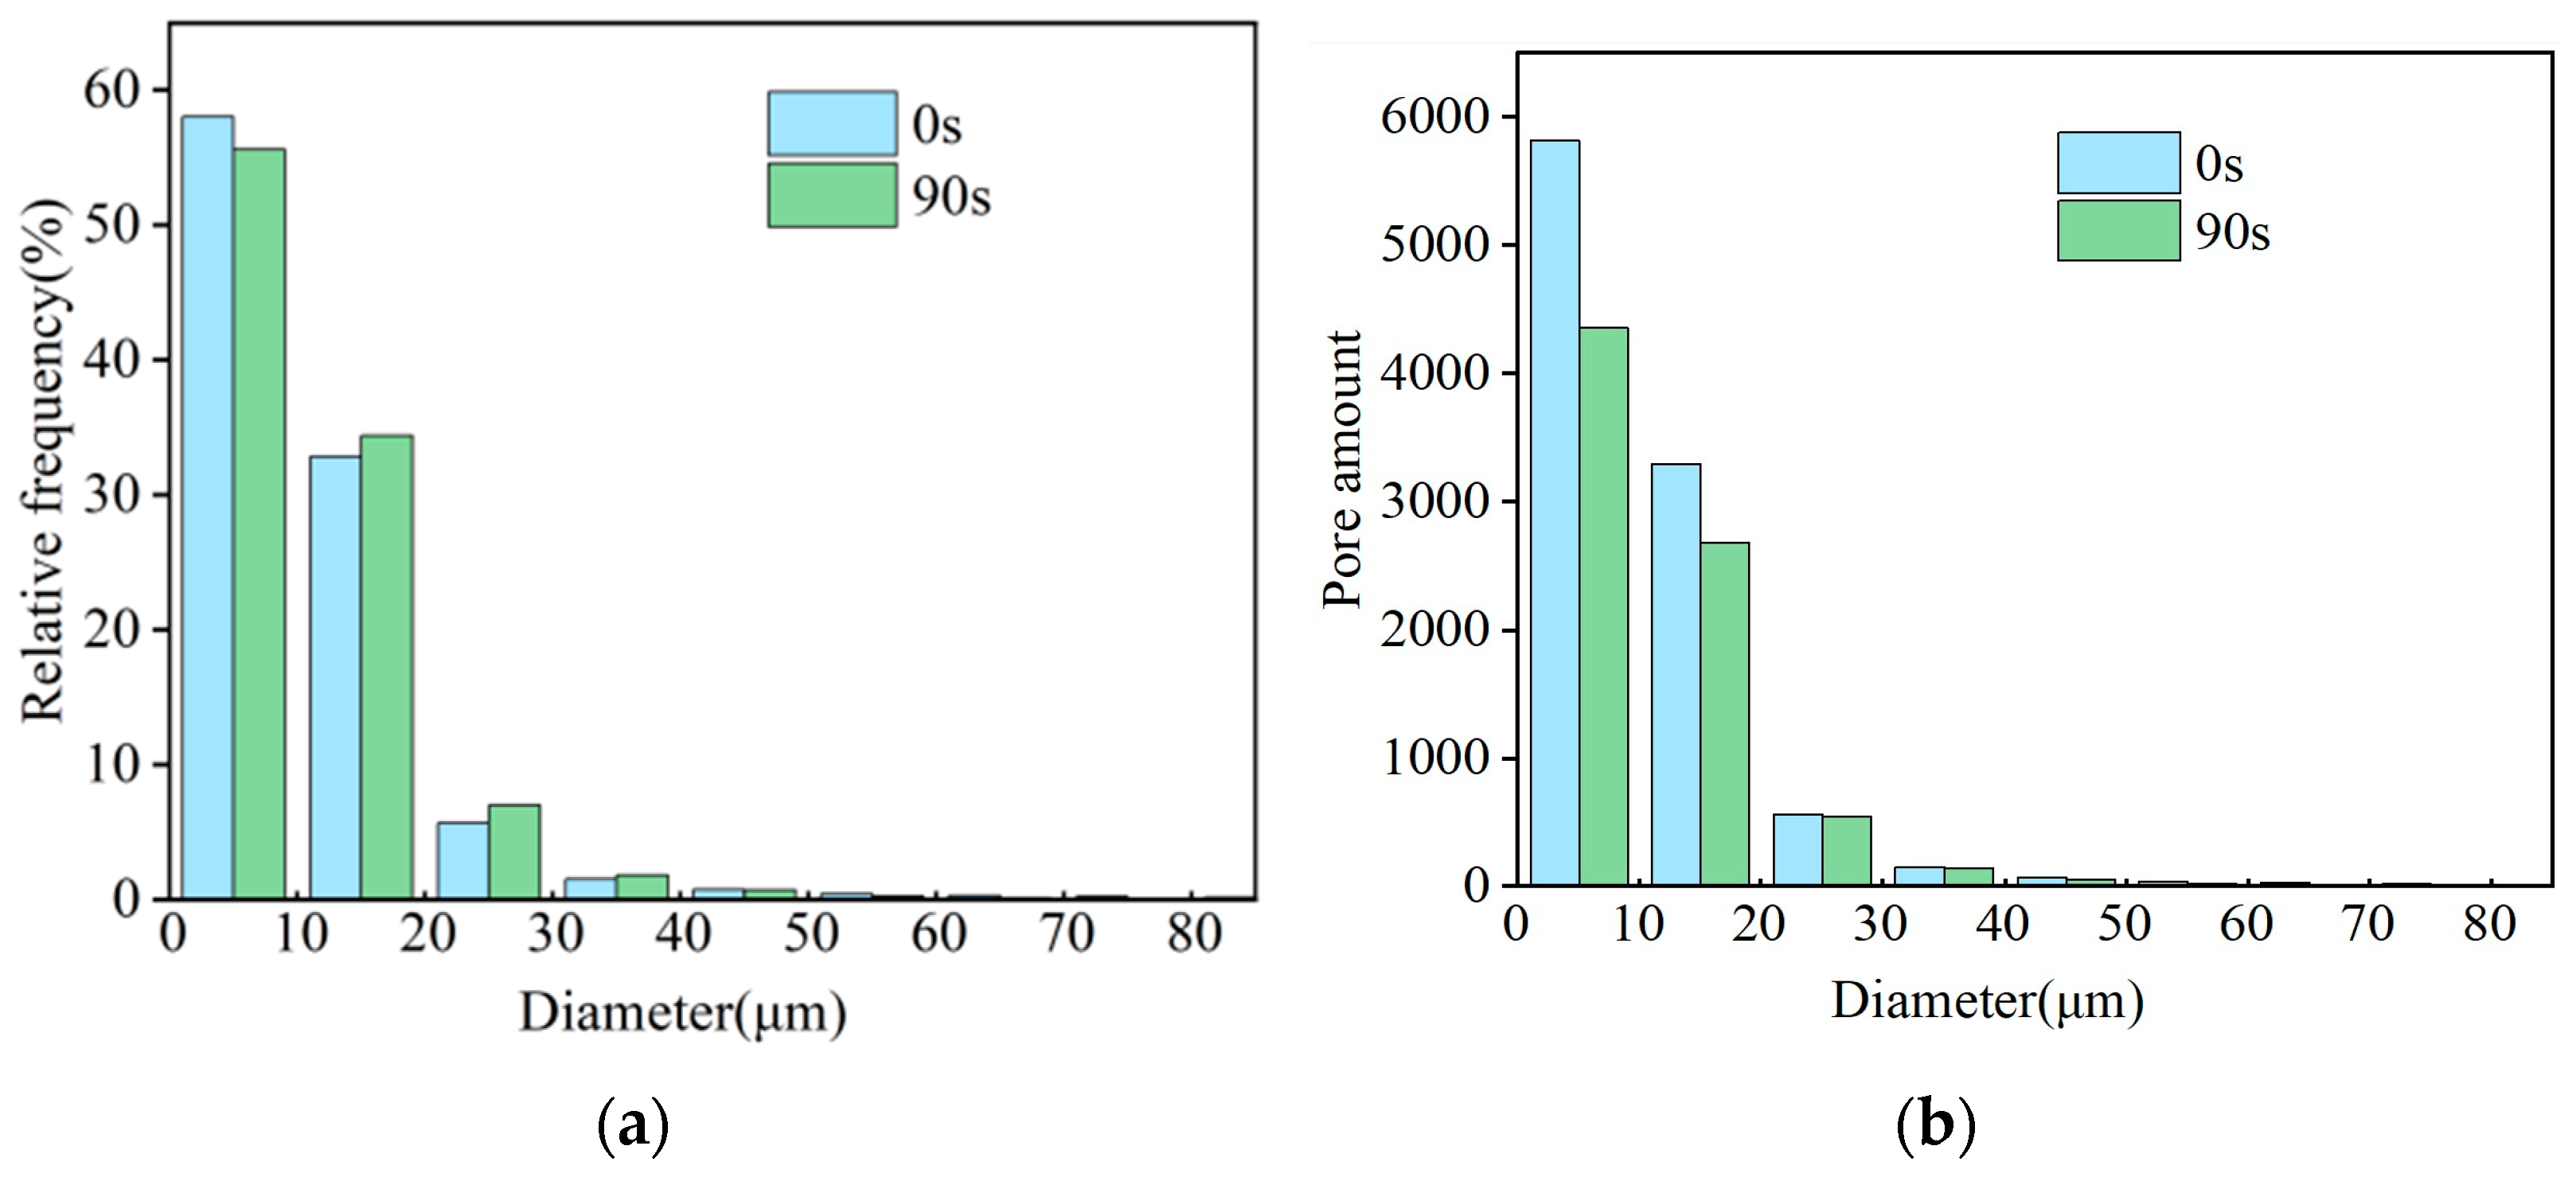
  • The characterization result of the pore structure for the filter cake showed that when the aeration time was 90 s, the porosity of the filter cake decreased to 2.05% due to the particles aggregating under the strong capillary force at the gas–liquid interface. With the increase in aeration time, the total number of pores decreased from 10030 to 7833, which reduced the path for water discharge significantly. The presence of bubbles reduced the throat radius in the filter cake to 1.32 μm, and the number of throat passages was reduced to one third of the original. The content of blind holes in the clean coal filter cake with froth was higher, and the maximum value of the coordination number in the filter cake was only 6, resulting in poor connectivity of the pore network, thus limiting the discharge of water.

Author Contributions

Conceptualization, R.C.; methodology, R.C. and Z.F.; software, R.C.; validation, X.D. and Z.F.; writing—original draft preparation, R.C.; writing—review and editing, R.C.; supervision, Y.F. and X.M.; funding acquisition, R.C., X.D. and Z.F. All authors have read and agreed to the published version of the manuscript.

Funding

This research was funded by the National Natural Science Foundation of China (Grant No. 51820105006, 52404291, 52104260, and 52004178). This study was also sponsored by the Fundamental Research Program of Shanxi Province (Grant No. 202103021223081 and 202203021212198) and the Science Foundation for Young Scholars of Taiyuan University of Technology (Grant No. 2022QN063). This paper was finally funded by the Open Foundation of State Key Laboratory of Mineral Processing (Grant No. BGRIMM-KJSKL-2024-13).

Data Availability Statement

The data presented in this study are available in the results section in this article.

Conflicts of Interest

The authors declare no conflicts of interest.

References

  1. Zhu, Z.; Zhang, Y.; Wang, S.; Zhao, B. Effect of plasma-activated water on the settling characteristics of ultrafine kaolinite. Process Saf. Environ. Prot. 2024, 192, 613–620. [Google Scholar] [CrossRef]
  2. Xia, Y.; Xing, Y.; Gui, X.; Cao, Y. Interaction between hydrocarbon oil and hydrophilic mineral surfaces: A chemical force microscopy and molecular dynamics simulation study. Fuel 2022, 323, 124402. [Google Scholar] [CrossRef]
  3. Guo, F.; Chen, L.; Li, Y.; Zhu, Y.; Jia, W.; Guo, Y.; Guo, S.; Zhang, Y.; Wu, J. Review on the attribute cognition and carbon-ash-water separation of coal gasification fine slag. Sep. Purif. Technol. 2023, 320, 124121. [Google Scholar] [CrossRef]
  4. Doi, A.; Nguyen, T.A.H.; Nguyen, N.N.; Nguyen, C.V.; Raji, F.; Nguyen, A.V. Enhancing shear strength and handleability of dewatered clay-rich coal tailings for dry-stacking. J. Environ. Manag. 2023, 344, 118488. [Google Scholar] [CrossRef] [PubMed]
  5. Zhang, F.; Xing, Y.; Chang, G.; Yang, Z.; Gui, X. Enhanced lignite flotation using interfacial nanobubbles based on temperature difference method. Fuel 2021, 293, 120313. [Google Scholar] [CrossRef]
  6. Liu, D.; Wang, W.; Tu, Y.; Ren, G.; Yan, S.; Liu, H.; He, H. Flotation specificity of coal gasification fine slag based on release analysis. J. Clean. Prod. 2022, 363, 132426. [Google Scholar] [CrossRef]
  7. Niu, C.; Xia, W.; Li, Y.; Bu, X.; Wang, Y.; Xie, G. Insight into the low-rank coal flotation using amino acid surfactant as a promoter. Fuel 2022, 307, 121810. [Google Scholar] [CrossRef]
  8. Ping, A.; Peng, Y.; Xie, G.; Wang, M.; Xia, W. Enhancement of dewatering performance of vitrinite-rich and inertinite-rich coals by surfactants: Experiment and simulation. Fuel 2022, 318, 123571. [Google Scholar] [CrossRef]
  9. Zhang, Z.; Liu, J. Settling characteristics analysis of coal slime water based on original hardness. J. China Coal Soc. 2014, 39, 757–763. [Google Scholar]
  10. Ejtemaei, M.; Ramli, S.; Osborne, D.; Nguyen, A.V. Synergistic effects of surfactant-flocculant mixtures on ultrafine coal dewatering and their linkage with interfacial chemistry. J. Clean. Prod. 2019, 232, 953–965. [Google Scholar] [CrossRef]
  11. Chen, R.; Fan, Y.; Dong, X.; Ma, X.; Feng, Z.; Chang, M.; Li, N. Impact of pH on interaction between the polymeric flocculant and ultrafine coal with atomic force microscopy (AFM). Colloids Surf. A Physicochem. Eng. Asp. 2021, 622, 126698. [Google Scholar] [CrossRef]
  12. Guo, F.; Liu, H.; Zhao, X.; Guo, Y.; Guo, Z.; Miao, Z.; Zhang, Y.; Li, J.; Wu, J. Insights on water temporal-spatial migration laws of coal gasification fine slag filter cake during water removal process and its enlightenment for efficient dewatering. Fuel 2021, 292, 120274. [Google Scholar] [CrossRef]
  13. Zhu, Z.; Zhao, B.; Tian, C.; Zhang, Y.; Sheng, Q.; Cheng, M.; Zhang, N.; Li, Z.; Liu, D. Plasma pretreatment to enhance the sedimentation of ultrafine kaolinite particles: Experiments and mechanisms. J. Water Process Eng. 2024, 59, 105012. [Google Scholar] [CrossRef]
  14. You, X.; He, M.; Zhu, X.; Wei, H.; Cao, X.; Wang, P.; Li, L. Influence of surfactant for improving dewatering of brown coal: A comparative experimental and MD simulation study. Sep. Purif. Technol. 2019, 210, 473–478. [Google Scholar] [CrossRef]
  15. Zhang, S.; Shao, X.; Ding, J.; Zhao, K. Synergistic improvement of the fine size coal dewatering performance by using binary surfactant mixtures. Fuel 2024, 357, 130044. [Google Scholar] [CrossRef]
  16. Hennemann, M.; Gastl, M.; Becker, T. Influence of particle size uniformity on the filter cake resistance of physically and chemically modified fine particles. Sep. Purif. Technol. 2021, 272, 118966. [Google Scholar] [CrossRef]
  17. Kinnarinen, T.; Tuunila, R.; Häkkinen, A. Reduction of the width of particle size distribution to improve pressure filtration properties of slurries. Miner. Eng. 2017, 102, 68–74. [Google Scholar] [CrossRef]
  18. Ma, X.; Fan, Y.; Dong, X.; Chen, R.; Li, H.; Sun, D.; Yao, S. Impact of clay minerals on the dewatering of coal slurry: An experimental and molecular-simulation study. Minerals 2018, 8, 400. [Google Scholar] [CrossRef]
  19. Lee, C.S.; Robinson, J.; Chong, M.F. A review on application of flocculants in wastewater treatment. Process Saf. Environ. Prot. 2014, 92, 489–508. [Google Scholar] [CrossRef]
  20. Dao, V.H.; Cameron, N.R.; Saito, K. Synthesis, properties and performance of organic polymers employed in flocculation applications. Polym. Chem. 2016, 7, 11–25. [Google Scholar] [CrossRef]
  21. Reis, L.G.; Oliveira, R.S.; Palhares, T.N.; Spinelli, L.S.; Lucas, E.F.; Vedoy, D.R.; Asare, E.; Soares, J.B. Using acrylamide/propylene oxide copolymers to dewater and densify mature fine tailings. Miner. Eng. 2016, 95, 29–39. [Google Scholar] [CrossRef]
  22. Sun, X.; Ma, X.; Fan, Y.; Dong, X.; Chang, M.; Feng, Z.; Peng, D. Insight into filter cake characteristics of fine coal tailings assisted by CPAM and α-HH during pressure filtration. Sep. Purif. Technol. 2023, 326, 124822. [Google Scholar] [CrossRef]
  23. Zeng, H.; Tang, H.; Sun, W.; Wang, L. Deep dewatering of bauxite residue via the synergy of surfactant, coagulant, and flocculant: Effect of surfactants on dewatering and settling properties. Sep. Purif. Technol. 2022, 302, 122110. [Google Scholar] [CrossRef]
  24. Liu, S.; Chen, X.; Peng, Y. Deaeration of stable coal froth by surfactants to modify the interfacial properties. Fuel 2021, 298, 120839. [Google Scholar] [CrossRef]
  25. Cheng, Y.; Min, F.; Li, H.; Chen, J.; Fu, X. Effect of reagent interaction on froth stability of coal flotation. Fuel 2022, 318, 123417. [Google Scholar] [CrossRef]
  26. Xu, M.; Xing, Y.; Jin, W.; Li, M.; Cao, Y.; Gui, X. Effect of diesel on the froth stability and its antifoam mechanism in fine coal flotation used MIBC as the frother. Powder Technol. 2020, 364, 183–188. [Google Scholar] [CrossRef]
  27. Ata, S. Phenomena in the froth phase of flotation—A review. Int. J. Miner. Process. 2012, 102–103, 1–12. [Google Scholar] [CrossRef]
  28. Arriagada, S.; Acuña, C.; Vera, M. New technology to improve the recovery of fine particles in froth flotation based on using hydrophobized glass bubbles. Miner. Eng. 2020, 156, 106364. [Google Scholar] [CrossRef]
  29. Zhang, N.; Chen, X.; Peng, Y. Effects of froth properties on dewatering of flotation products—A critical review. Miner. Eng. 2020, 155, 106477. [Google Scholar] [CrossRef]
  30. Wei, Y.C.; Peng, Y. Effect of froth stability on dewatering of coal flotation concentrates. Miner. Process. Extr. Metall. 2015, 124, 167–174. [Google Scholar] [CrossRef]
  31. Zhang, N.; Chen, X.; Nicholson, T.; Peng, Y. The effect of froth on the dewatering of coals—An oscillatory rheology study. Fuel 2018, 222, 362–369. [Google Scholar] [CrossRef]
  32. Zhang, N.; Chen, X.; Nicholson, T.; Peng, Y. The effect of saline water on the settling of coal slurry and coal froth. Powder Technol. 2019, 344, 161–168. [Google Scholar] [CrossRef]
  33. Yang, X.; Zhang, K.; Ni, C.; Cao, H.; Jesse, T.; Xie, G.; Tan, Z.; Yu, H. Ash determination of coal flotation concentrate by analyzing froth image using a novel hybrid model based on deep learning algorithms and attention mechanism. Energy 2022, 260, 125027. [Google Scholar] [CrossRef]
  34. Wen, Z.; Zhou, C.; Pan, J.; Nie, T.; Jia, R.; Yang, F. Froth image feature engineering-based prediction method for concentrate ash content of coal flotation. Miner. Eng. 2021, 170, 107023. [Google Scholar] [CrossRef]
  35. Kakwani, R.M.; Gala, H.B.; Chiang, S.H.; Klinzing, G.E.; Tierney, J.W. Dewatering of Fine Coal-Micrographic Analysis of Filter Cake Structure. Powder Technol. 1985, 41, 239–250. [Google Scholar] [CrossRef]
  36. Chi, S.-M.; Klinzing, G.E.; Chang, S.-H.; Wen, W.W. Effect of Entrapped Air Bubbles on Fine Coal Dewatering via Filtration. Powder Technol. 1985, 45, 25–34. [Google Scholar] [CrossRef]
  37. Chase, G.G.; Willis, M.S. Flow Resistance in Filter Cakes Due to Air. Sep. Sci. Technol. 1991, 26, 117–126. [Google Scholar] [CrossRef]
  38. Xu, G.; Fan, M.; Liu, A.; Yang, H. Role of Tweens in improved centrifuging of coarse clean coal. J. China Coal Soc. 2018, 43, 284–289. [Google Scholar]
  39. Lu, H.; Bian, Y.; Wang, Z.; Guo, X.; Liu, H.; Cao, J.; Qu, K. Characterization of non-Newtonian rheological behaviors of powders. Powder Technol. 2023, 417, 118281. [Google Scholar] [CrossRef]
  40. Feng, Z.; Dong, X.; Fan, Y.; Li, H.; Dong, Y.; Ma, X.; Chen, R. Use of X-ray microtomography to quantitatively characterize the pore structure of three-dimensional filter cakes. Miner. Eng. 2020, 152, 106275. [Google Scholar] [CrossRef]
  41. Férec, J.; Bertevas, E.; Khoo, B.C.; Ausias, G.; Phan-Thien, N. A rheological constitutive model for semiconcentrated rod suspensions in Bingham fluids. Phys. Fluids 2017, 29, 073103. [Google Scholar] [CrossRef]
  42. Chen, G.; Li, C.; Ruan, Z.; Bürger, R.; Gao, Y.; Hou, H. Structural evolution of bed drainage channels under the shear effect of the whole process of tailings thickening. Miner. Eng. 2023, 203, 108364. [Google Scholar] [CrossRef]
  43. Zhou, M.; Xu, J.; Zhou, H. Evaluating the permeability properties of green bed in iron ore sintering using high resolution X-Ray computed tomography and orthogonal array tests. Powder Technol. 2020, 375, 360–368. [Google Scholar] [CrossRef]
  44. Dao, Q.D.; Nguyen, T.V.; Nguyen, D.M.A.T.; Nguyen, N.N.; Nguyen, C.V.; Nguyen, A.V. Application of X-ray computed tomography scanning in describing partition curves of dense medium cyclones. Miner. Eng. 2023, 201, 108164. [Google Scholar] [CrossRef]
  45. Yang, A.; Liao, Y.; An, M.; Cao, Y.; Yang, Z.; Ren, H.; Su, H.; Zou, Q.; Chen, L. Effect of surfactant and flocculant on low-rank coal slime filtration: From filter cake characteristics point of view. Fuel 2022, 327, 125136. [Google Scholar] [CrossRef]
  46. Blunt, M.J.; Bijeljic, B.; Dong, H.; Gharbi, O.; Iglauer, S.; Mostaghimi, P.; Paluszny, A.; Pentland, C. Pore-scale imaging and modelling. Adv. Water Resour. 2013, 51, 197–216. [Google Scholar] [CrossRef]
  47. Xiong, Q.; Baychev, T.G.; Jivkov, A.P. Review of pore network modelling of porous media: Experimental characterisations, network constructions and applications to reactive transport. J. Contam. Hydrol. 2016, 192, 101–117. [Google Scholar]
  48. Feng, Z.; Fan, Y.; Dong, X.; Ma, X.; Chen, R. Permeability estimation in filter cake based on X-ray microtomography and Lattice Boltzmann method. Sep. Purif. Technol. 2021, 275, 119114. [Google Scholar] [CrossRef]
  49. Shi, Z.; Liu, L. Synergistic mechanism of CTAB and nonionic polyacrylamide on pore structure of kaolinite filter cake. Sep. Purif. Technol. 2023, 324, 124575. [Google Scholar] [CrossRef]
Figure 1. (a) Particle size distribution and (b) XRD of the clean coal.
Processes 12 02738 g001
Figure 2. Schematic flow diagram of the filtration system.
Processes 12 02738 g002
Figure 3. Moisture changes in filter cakes under different aeration times: (a) Filtrate mass; (b) Final filter cake moisture.
Processes 12 02738 g003
Figure 4. Change in filter cake thickness with filtration time.
Processes 12 02738 g004
Figure 5. Bubble images of clean coal after different aeration times.
Processes 12 02738 g005
Figure 6. Size distributions of bubbles under different aeration times.
Processes 12 02738 g006
Figure 7. Rheological curves of the froth with different aeration times: (a) Shear rate–apparent viscosity curve; (b) Rheological curve.
Processes 12 02738 g007
Figure 8. Floc size distribution of flotation clean coal.
Processes 12 02738 g008
Figure 9. SEM morphology of clean coal filter cakes with different aeration times.
Processes 12 02738 g009
Figure 10. Two-dimensional grayscale slices of the micron-CT: (a) 0 s; (b) 90 s. Image threshold segmentation results: (c) 0 s; (d) 90 s, where the blue represents the pores in the filter cake.
Processes 12 02738 g010
Figure 11. Extraction of the three-dimensional pore space in the filter cake: (a) 0 s; (b) 90 s. Segmentation: (c) 0 s; (d) 90 s.
Processes 12 02738 g011
Figure 12. Results of pore size distribution: (a) Relative frequency; (b) Pore amount.
Processes 12 02738 g012
Figure 13. Construction of pore network models: (a) 0 s; (b) 90 s.
Processes 12 02738 g013
Table 1. Bingham model fitting equation and related parameters for the rheological curve.
Time (s)Bingham Model Fitting EquationR2τ0 (mPa)Hp (mPa·s)
0τ = 1.5295 + 1.0293γ0.99991.52951.0293
30τ = 1.8597 + 1.0785γ0.99891.85971.0785
60τ = 1.9981 + 1.1238γ0.99751.99811.1238
90τ = 2.0824 + 1.1703γ0.99912.08241.1703
Table 2. The effect of aeration time on the porosity of the filter cake.
SamplePore Volume (μm3)Total Volume (μm3)Porosity (%)
0 s4.64 × 1071.16 × 1094.02
90 s2.33 × 1071.14 × 1092.05
Table 3. Pore-throat configuration relationship.
SamplePore Radii (μm)Throat Radii (μm)Number
MaxMinAveMaxMinAvePoreThroat
0 s78.502.605.8334.931.4413.5710030171
90 s77.512.595.7627.631.3212.761113554
Max represents the maximum value of pore radius/throat radius. Min represents the minimum value of pore radius/throat radius. Ave represents the average value of pore radius/throat radius.
Table 4. The effect of aeration time on the pore coordination number of coal slime filter cake.
Coordination Number0 s (%)90 s (%)
098.78499.623
10.3380.126
20.3610.089
30.2380.063
40.1500.036
50.0390.055
60.0120.008
70.029
80
90.019
≥100.030
Disclaimer/Publisher’s Note: The statements, opinions and data contained in all publications are solely those of the individual author(s) and contributor(s) and not of MDPI and/or the editor(s). MDPI and/or the editor(s) disclaim responsibility for any injury to people or property resulting from any ideas, methods, instructions or products referred to in the content.

