Article

Methane Adsorption Energy Variation Affected by Industrial Components in Deep and Thick Coal Reservoirs

1
Orion Energy International Inc., Beijing 100080, China
2
PetroChina Coalbed Methane Company Limited, Beijing 100028, China
3
School of Resources and Safety Engineering, Wuhan Institute of Technology, Wuhan 430073, China
4
School of Safety Science and Engineering, Anhui University of Science and Technology, Huainan 232001, China
5
Department of Materials Engineering, Campus Bruges, KU Leuven, 8000 Bruges, Belgium
*
Authors to whom correspondence should be addressed.
Processes 2024, 12(12), 2780; https://doi.org/10.3390/pr12122780
Submission received: 7 November 2024 / Revised: 20 November 2024 / Accepted: 2 December 2024 / Published: 6 December 2024

Abstract

:
The relevant literature indicates that coal facies have a significant impact on the pore structure and adsorption properties of deep coal reservoirs. The content of submicroscopic components is used to calculate the parameters of coal facies. Based on traditional coal phase parameters and ash content, the coal phases of the coal samples in the study area were divided. Based on the adsorption potential theory, the differences in methane adsorption energy changes between different coal phases were compared. The results are as follows. The wet herbaceous swamp facies (type A) could be divided into two subtypes by using the ash yield: subtype A-1 (with an ash yield lower than 20% and a gel index (GI) lower than 5), and subtype A-2 (with an ash yield larger than 20% and a GI lower than 5). With the increase in micro-pore volume shown in A-1 samples, cumulative surface free energy increases linearly and the maximum rate of decline decreases linearly. Coal facies have an important effect on adsorption parameters: VL increases and PL decreases with higher structural preservation index (TPI). The effect of a low ash yield and different Ro,max on methane adsorption energy parameters is stronger.

1. Introduction

The early-stage high gas production of deep coalbed methane (CBM) is affected by the free gas content [1,2]. However, achieving stable high-yield gas production in the later stages depends crucially on the adsorption gas content [3,4].
Currently, methane adsorption is studied through methane isothermal adsorption experiments [5,6,7,8,9,10]. The methane isotherm adsorption curve satisfies a good Langmuir equation. The Langmuir volume (VL) and Langmuir pressure (PL) in this curve have become the most widely used classical adsorption parameters in the field of coalbed methane [11,12,13,14]. The previous literature has extensively discussed the effects of coal composition (moisture, ash, vitrinite content, coal rank and so on) and temperature–pressure on methane adsorption capacity. Adsorption capacity decreases with higher temperature and with lower pressure. Beyond a critical temperature and pressure threshold, adsorption capacity tends to stabilize [7,11,15]. Moreover, excessive moisture and ash yield occupy nano-pore volume space, resulting in a reduction in the methane adsorption potential and adsorption capacity [16,17,18]. Some studies have demonstrated that the specific surface area (SSA) percentage of nano-pores can exceed 90%, with the SSA of nano-pores being the main factor affecting methane adsorption capacity [14,19,20,21,22].
Moreover, kinetic energy and potential energy variations in adsorbent molecules result in exothermic and endothermic heat during the adsorption process [10,23,24]. Therefore, adsorption energy variations in coal can elucidate various adsorption phenomena. Zhang et al. [25] showed that the surface tension parameter decreases with higher temperature, with the decrease being less pronounced during adsorption than desorption, explaining the adsorption process of CO2 at high temperature. Lu et al. (2019) [26] studied the adsorption characteristics of coal with different structural deformation, and concluded that methane molecules preferentially occupy positions with strong surface adsorption potential, causing a sharp increase in the adsorption capacity and capacity of methane in the early stage of adsorption. Zhang et al. [27] indicated that the variation in gas adsorption energy affects the change in sample adsorption capacity, with energy variation being affected by the micro-pore structure and internal chemical structure of the coal sample. Moreover, Zhang et al. [28] demonstrated that the isosteric heat gradually decreased with increasing methane adsorption, with water molecules having a limited effect on the isosteric heat.
Several studies have been carried out on methane adsorption, and surface free energy (SFE) varies during the adsorption process in coal reservoirs. Within the same coal seam of deep CBM, where the difference in the buried depth of the coal seam is small, resulting in minimal variation in maximum vitrinite reflectance (Ro,max), the effect of Ro,max on nano-pore structure is weaker [29,30].

2. Sample Collection and Experimental Methods

2.1. Experimental Methods

Following a specific procedure for the collection and packaging of the samples, the samples were transported to the laboratory for experimental testing according to the Chinese national standard GB/T 19222-2003 (2003) [31]. Then, a microscopic maceral analysis of 3 × 3 cm2 polished samples was carried out, examining 500 points on each sample, in accordance with the Chinese national standard GB/T 6948-1998(1998) [32]. Moreover, an industrial analysis was conducted on the samples, following the Chinese national standard GB/T 212-2001(2001) [33]. The basic information of all samples is presented in Table 1.
-
Low-temperature carbon dioxide adsorption test (LTCO2 GA)
The test was performed upon grinding 10 g of each sample to a 46–60 mesh size, followed by drying in the oven and a degassing treatment. The interval used between balancing points was 10 s for the BSD-PM1 analysis. The pore volume (PV) and SSA of the micro-pores was calculated using the density functional theory model (DFT) [27,34,35].
-
High-temperature and high-pressure isothermal adsorption test (HTHP)
This test was conducted in accordance with the standard ‘Experimental Method for High pressure isothermal adsorption of Coal’ (GB/19560-2008 [36]) [37,38]. The test was performed by grinding 100 g of each sample to a 200 mesh size, followed by drying in the oven and a degassing treatment. The coal sample was placed in a water tank at a controlled temperature of 30 °C for 12 h. Then, a vacuum was introduced to the system. High-purity He (volume fraction 99.99%) was utilized to measure the free space volume in the sample tank, followed by evacuating the He to achieve a vacuum again in the experimental device. According to the pressure–equilibrium–pressure process, high-purity methane (volume fraction of 99.99%) was used as the adsorption substance to increase the gas pressure step by step for adsorption until the maximum experimental pressure of 30 MPa was reached. Gas pressure and adsorption data were collected in real time during the adsorption process [7].

2.2. Calculation of SFE

According to the principle of thermodynamics, adsorption potential is the energy involved in the transfer of adsorbate from the non-adsorbed phase to the adsorbed phase for each unit mass of adsorbate [10,39].
ε = P i P 0 R T P d P = R T ln ( P 0 P i )
where ε is the adsorption potential, J·mol−1; Pi is the equilibrium pressure obtained from the sample adsorption isotherm curve, MPa; R is the gas constant, 8.314 J·(mol·K)−1; T is the experimental temperature, 303 K; and P0 is the saturated vapor pressure, MPa.
Adsorption space is a characteristic parameter reflecting micro-pore structure, and represents the space occupied by the adsorbed gas in the coal pores.
ω = V M ρ ad
where ω is the adsorption space volume, cm3/g; M is the relative molecular weight of methane, 16 g·mol−1; V is the methane adsorption capacity, mol·g−1; ρad is the adsorption phase density, g/cm3.
The SFE is the increment of the system free energy when the unit area of the adsorbent is increased at a constant temperature and constant pressure [29,40,41,42].
Δ γ = V L R T V 0 S ln ( 1 + P P L )
Δ γ P = V L R T P L V 0 S ( P L + P )
where VL is the Langmuir volume, reflecting the maximum adsorption capacity of coal, cm3/g; PL is the Langmuir pressure, which refers to the corresponding pressure when methane adsorption reaches half of the Langmuir volume (MPa); P is the equilibrium pressure, MPa; and ∆γ is the drop value of the SFE, indicating the difference between the SFE in the non-adsorbed gas state and the SFE after the gas is adsorbed, J/m2.

3. Results and Discussion

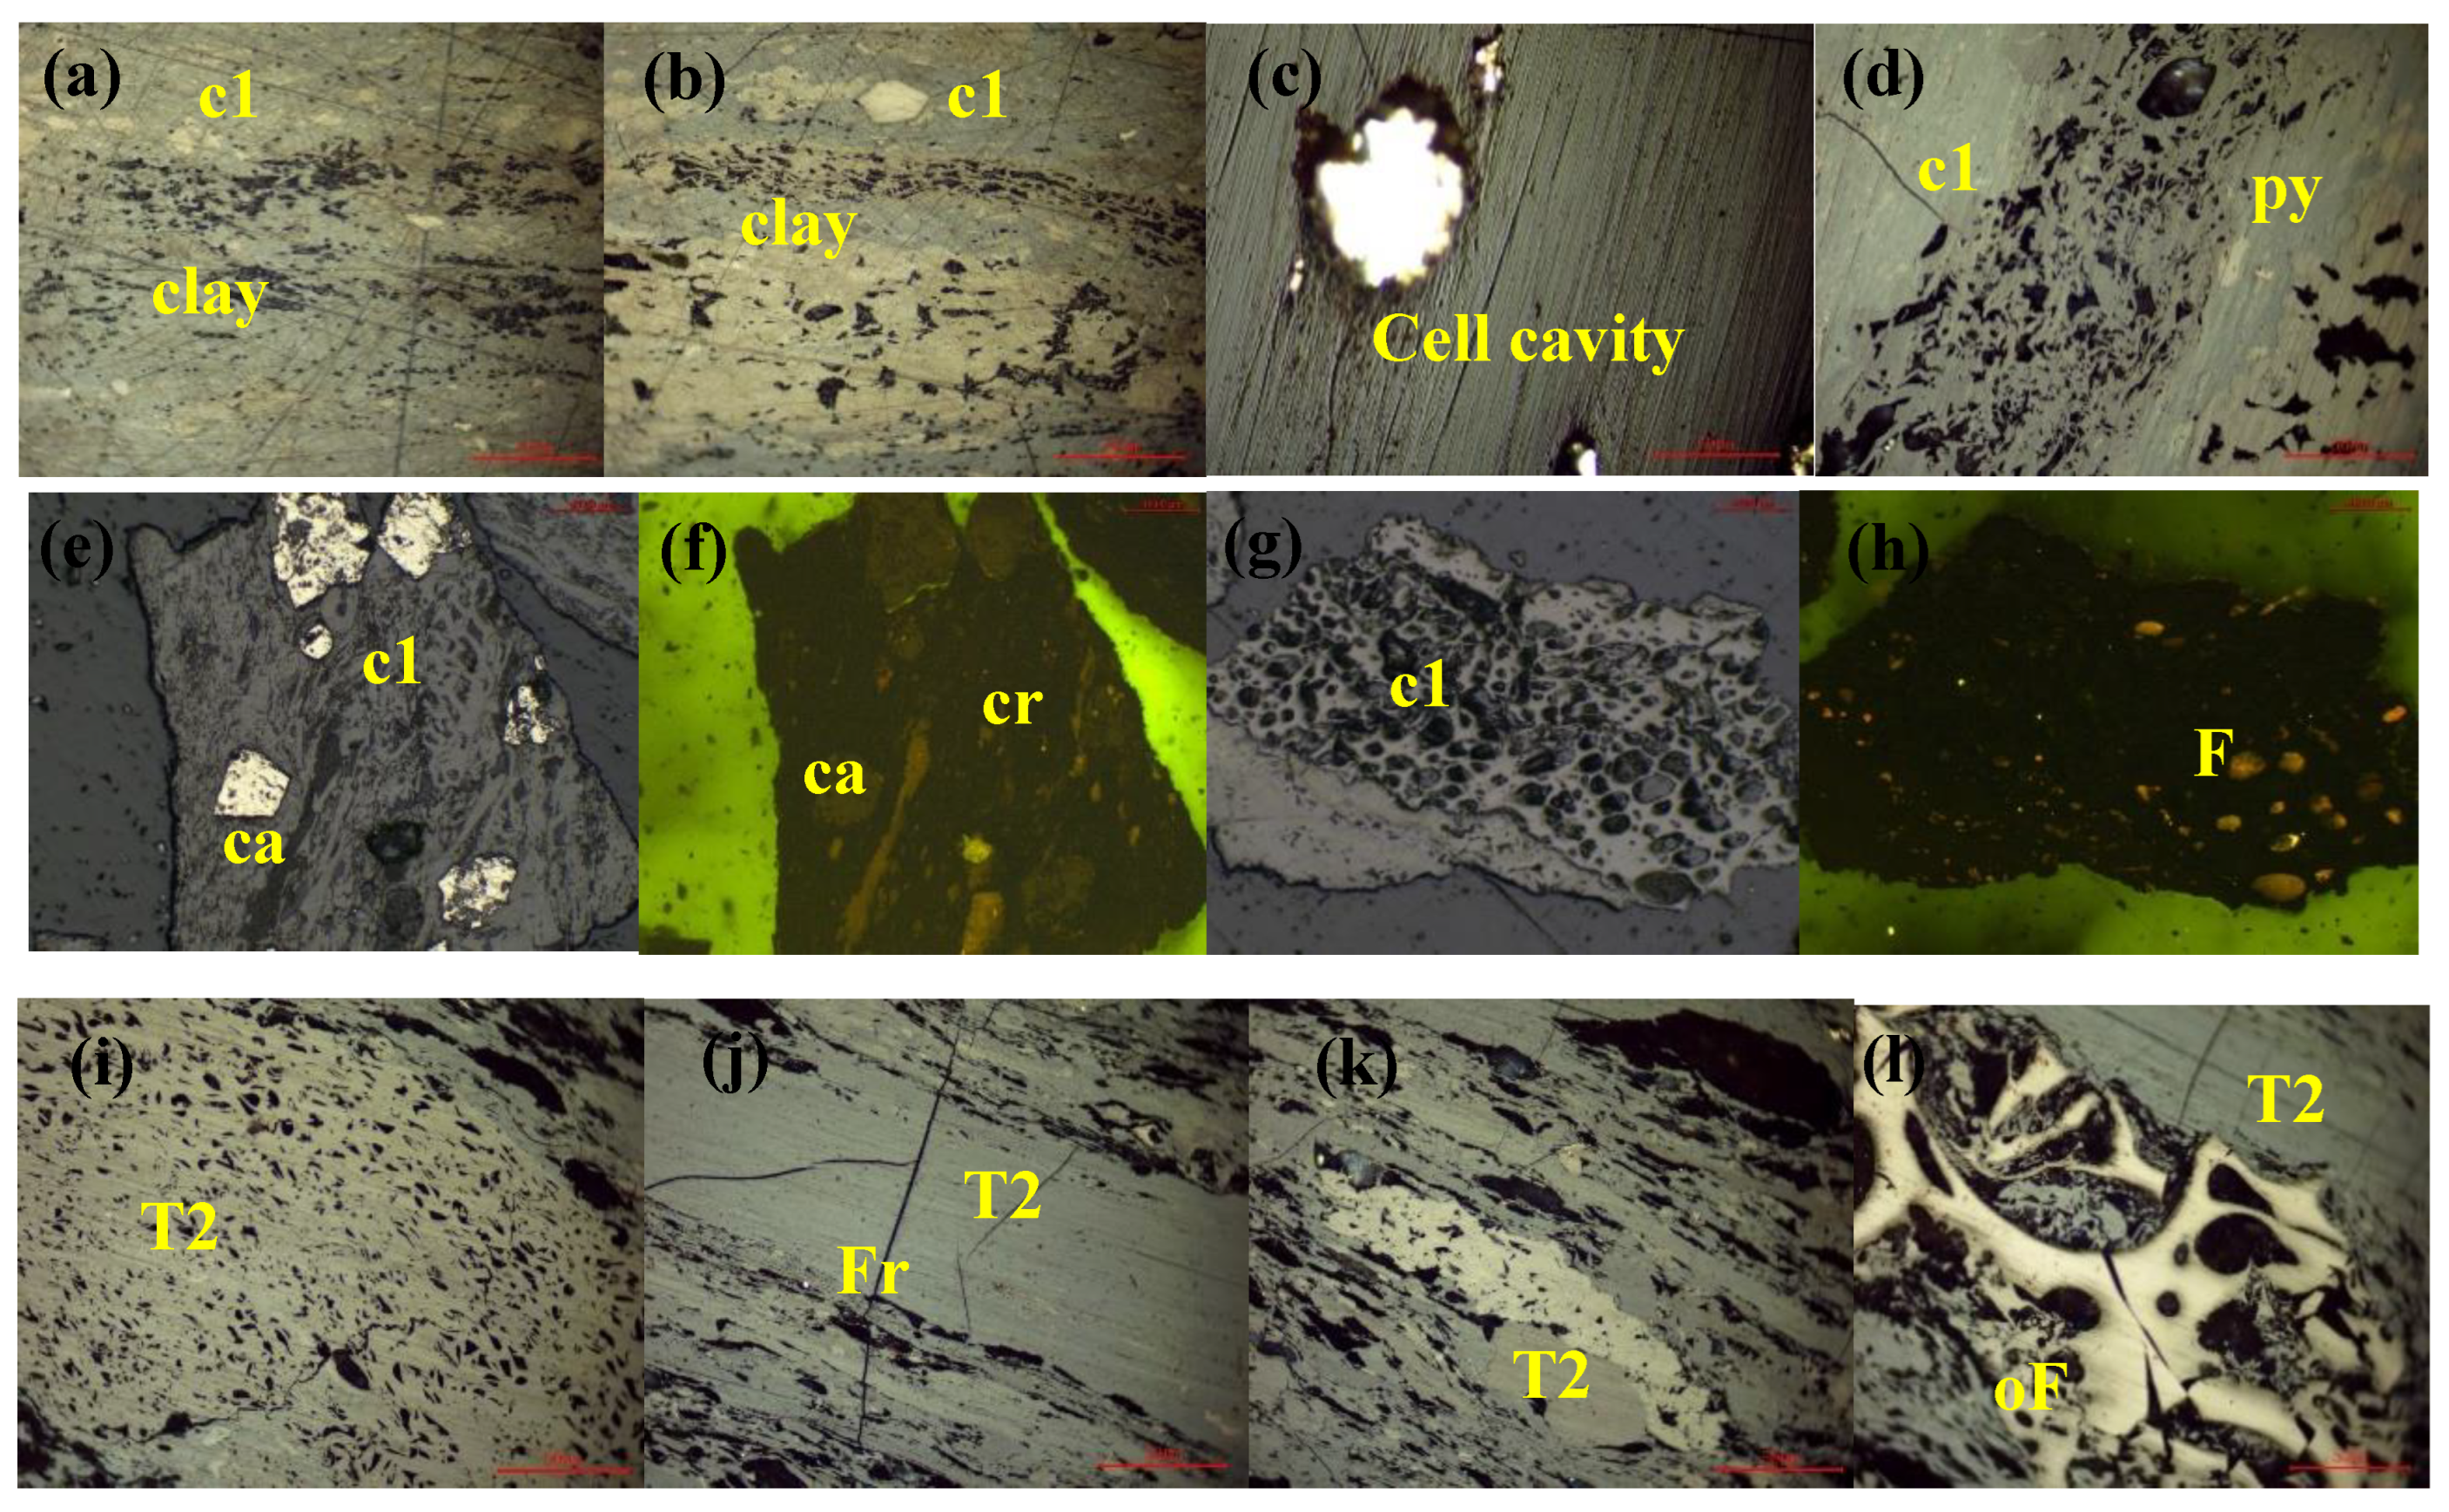
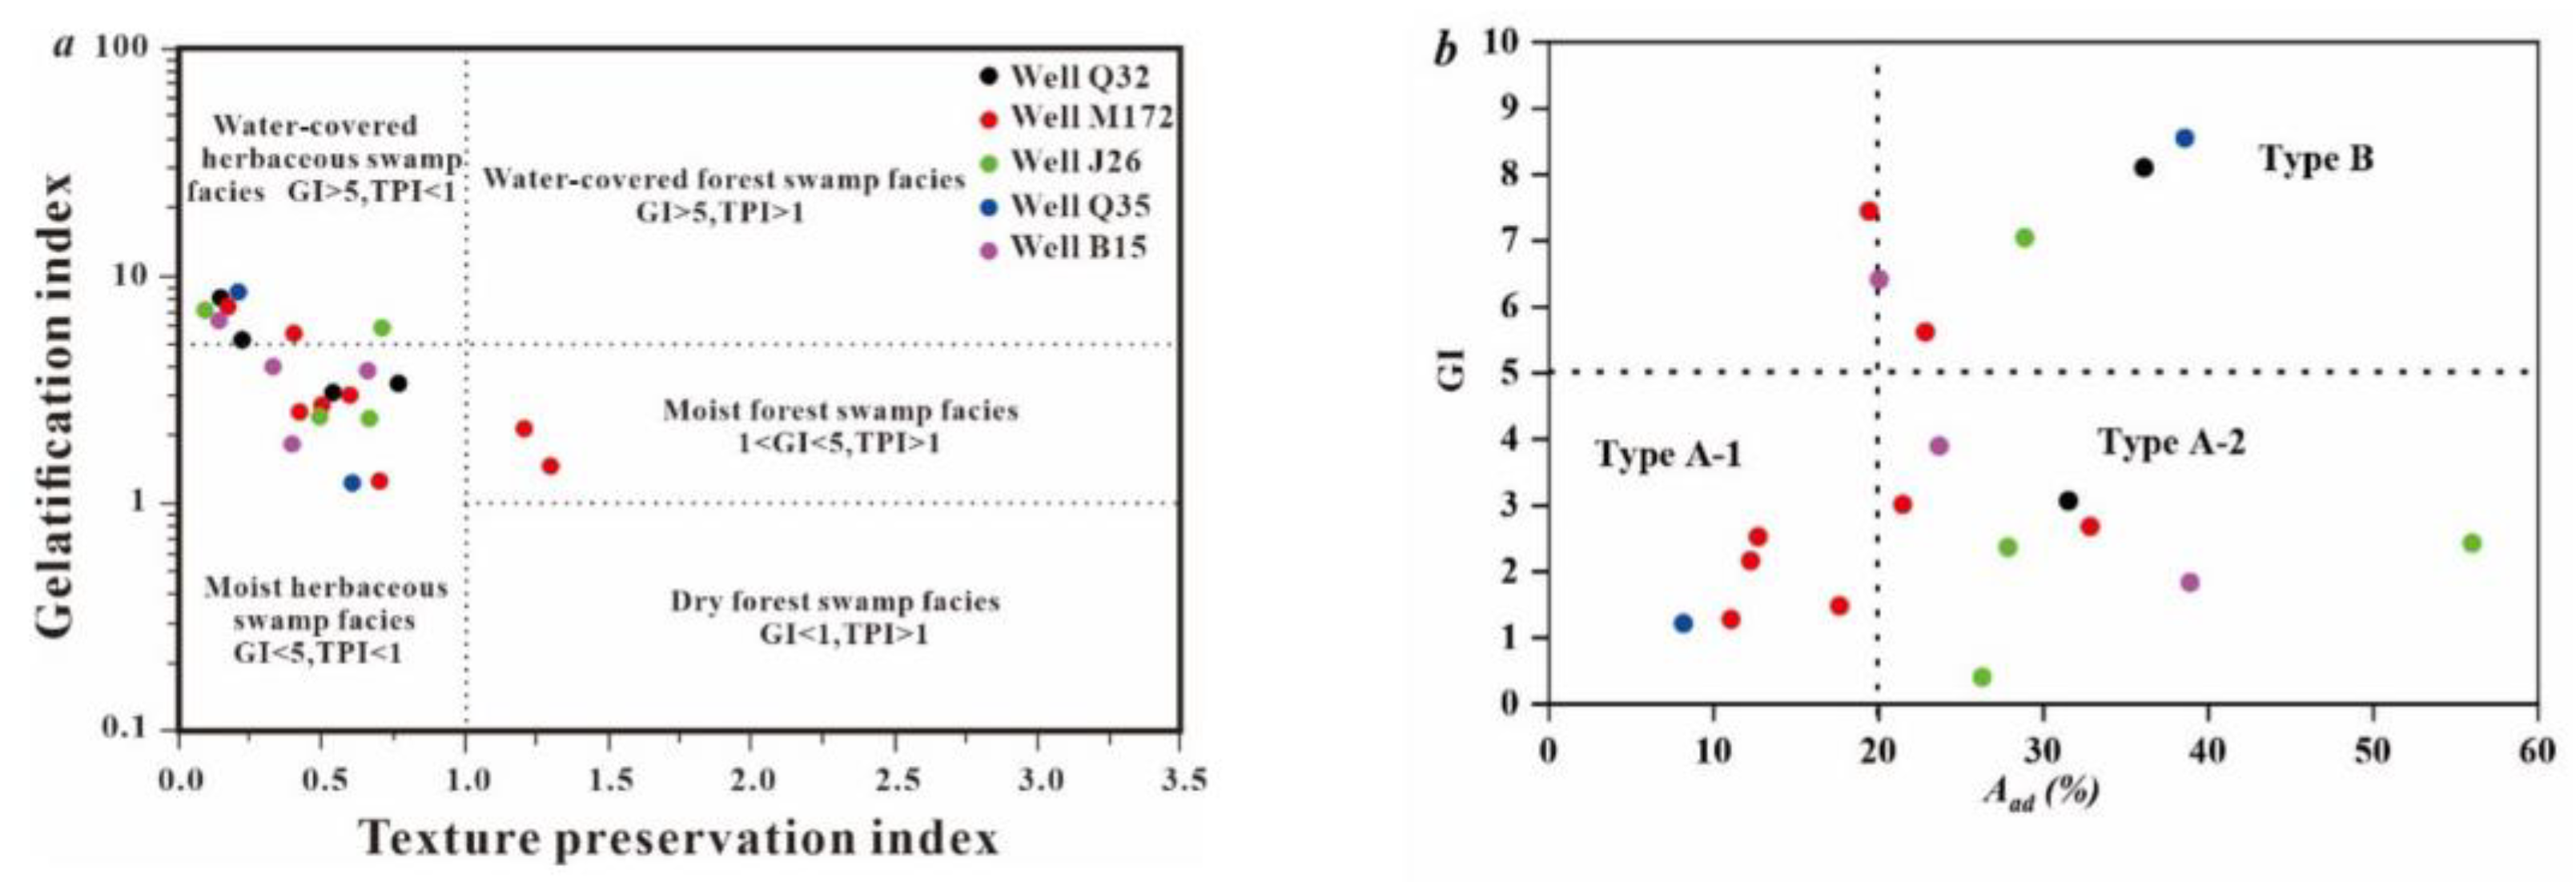
3.1. Coal Quality and Coal Facies Classification

The microscopic observations (Figure 1) indicate that the organic macerals of coal seam 8 are mainly composed of vitrinite, followed by inertinite, whereas the exinite content is the lowest. Vitrinite consists mainly of matrix vitrinite, followed by homogeneous vitrinite (Figure 1a–d,i–l). The inertinite is mainly composed of fusinite and semi-fusinite (Figure 1). The exinite mainly comprises spore powder and resin body. The homogeneous vitrinite content from wells Q32 and M172 is higher than that of wells Q35 and B 15, but the former has a lower content of matrix vitrinite. A high content of matrix vitrinite is beneficial for hydrocarbon generation, indicating that coal samples from wells Q35 and B 15 have high hydrocarbon generation potential. Moreover, the coal samples from wells Q35 and B15 have developed micro-fractures, which is consistent with their semi-bright coal nature (Figure 1).
Based on these results [6,7,8,9,10], TPI, GI, and GWI are independent coal facies parameters, and these were selected to identify coal facies [43]. Based on TPI~GI, three coal facies were determined, including wet forest swamp facies (TPI > 1 and 1 < GI < 5), wet herbaceous swamp facies (TPI < 1 and 1 < GI < 5), and cover grass swamp facies (TPI < 1 and GI > 5). The wet herbaceous swamp facies (type A) and the cover grass swamp facies (type B) are studied in this paper. As illustrated in Figure 2a, Aad~GI is used to distinguish coal facies. Figure 2b shows that the wet herbaceous swamp facies (type A) can be divided into two subtypes by using the ash yield: subtype A-1 (with an ash yield lower than 20% and a GI lower than 5), and subtype A-2 (with an ash yield larger than 20% and a GI lower than 5).

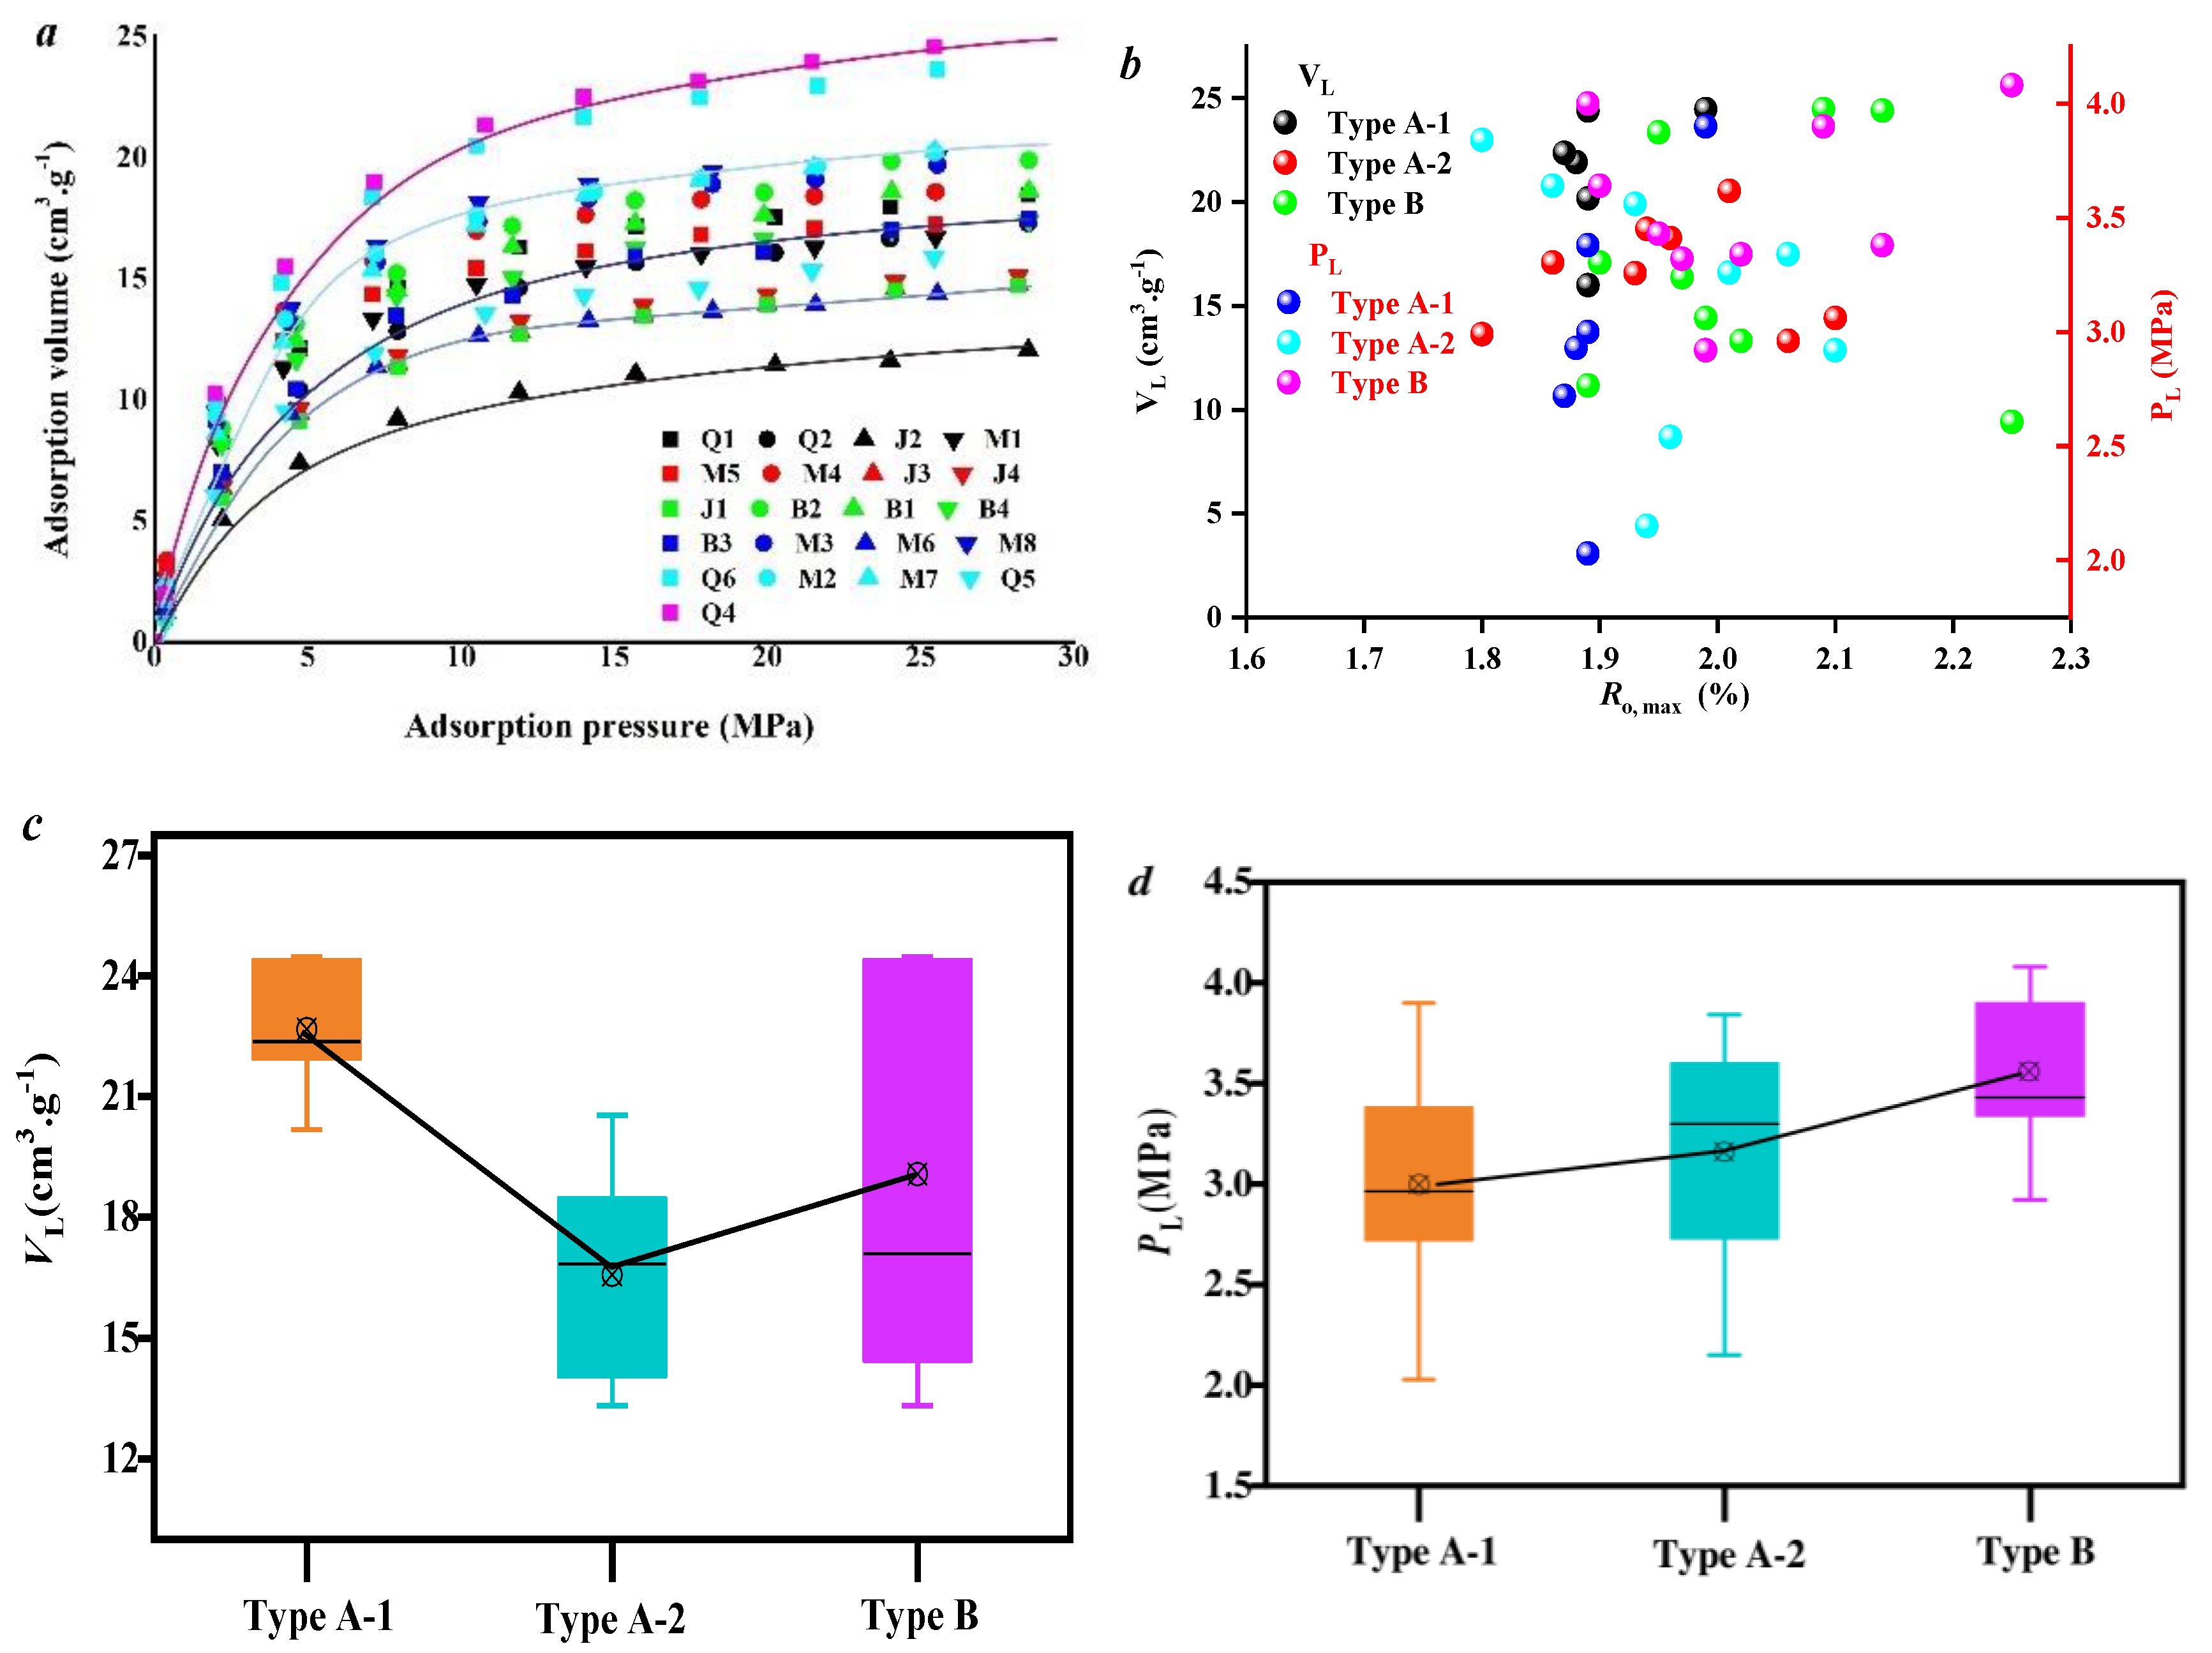
3.2. Effect of Coal Facies and Coal Quality on Methane Adsorption Ability

Figure 3 shows that the isothermal adsorption curves of all samples satisfy the Langmuir equation. The Langmuir volume (VL) varies between 12 and 24 cm3.g−1, and the Langmuir pressure (PL) varies from 2.5 to 4.0 MPa (Figure 3a,b). There is no clear variation in VL and PL for samples with different coal ranks. There is a relatively weak linear relationship between VL, PL, and Ro,max, because the variation in Ro,max is very small among samples, and PL is mainly related to meso-pores [44]. Figure 3c shows that the VL of type A-1 is larger than that of type A-2 and type B. The ash yield of types A-2 and B is higher than that of type A-1, and a high ash yield clogs the micro-pore space, resulting in a lower PV and SSA. Figure 3d illustrates that the PL of type B is larger than that of type A-1 and type A-2, which is related to the meso-pore volume and proximate analysis.
The correlation between micro-pore volume and adsorption parameters is strong (Figure 4a). VL increases linearly and PL decreases with a higher micro-pore volume, with VL showing a stronger correlation with micro-pore volume than PL. The PV of 0.3~0.6 nm and 0.6~0.8 nm is only linearly correlated with VL, and the correlation between the PV of 0.3~0.8 nm with PL is weak (Figure 4b,c). Differing from Figure 4b,c, VL increases linearly and PL decreases with the higher volume of 0.8~1.5 nm pores (Figure 4d).
The relationship between coal facies parameters, industrial components, and adsorption parameters is also studied (Figure 5). The correlation between the ash yield and adsorption parameters is weak (Figure 5a), but VL decreases linearly with as the ash yield of type B samples increases. This can be explained because the variation in Ro,max among type B samples is small compared with the other types of samples (Figure 5d). For samples of the same coal rank, a higher ash yield correlates with a lower adsorption capacity. Figure 5b,c show that coal facies have an important effect on the adsorption parameter, and VL increases and PL decreases with higher TPI. A higher TPI indicates that the degradation degree of coal-forming materials is smaller, the preservation degree of organic matter is high in woody plants, and organic primary pores are developed, resulting in a large number of micro-pores. A higher SSA increases the adsorption capacity of coal samples.
The relationship between single- and multi-fractal dimensions and adsorption parameters is also studied (Figure 6). VL increases gradually with a higher single fractal dimension (D2). D2 represents the heterogeneity of 0.8~1.5 nm micro-pore distribution. A higher D2 value indicates a larger heterogeneity in pore distribution. This implies that the pore structure is more complex, providing a higher micro-pore volume and SSA, resulting in an enhanced adsorption capacity (Figure 6a). There is no obvious relationship between VL and the multi-fractal dimension (Figure 6b–d). However, PL increases linearly with higher type A-2 D−10D0 and D−10D10, because type A-2 meso-pores are larger than those of type A-1, and a higher meso-pore volume leads to higher PL. This has also been explained by Zhang et al. [45] (2024).

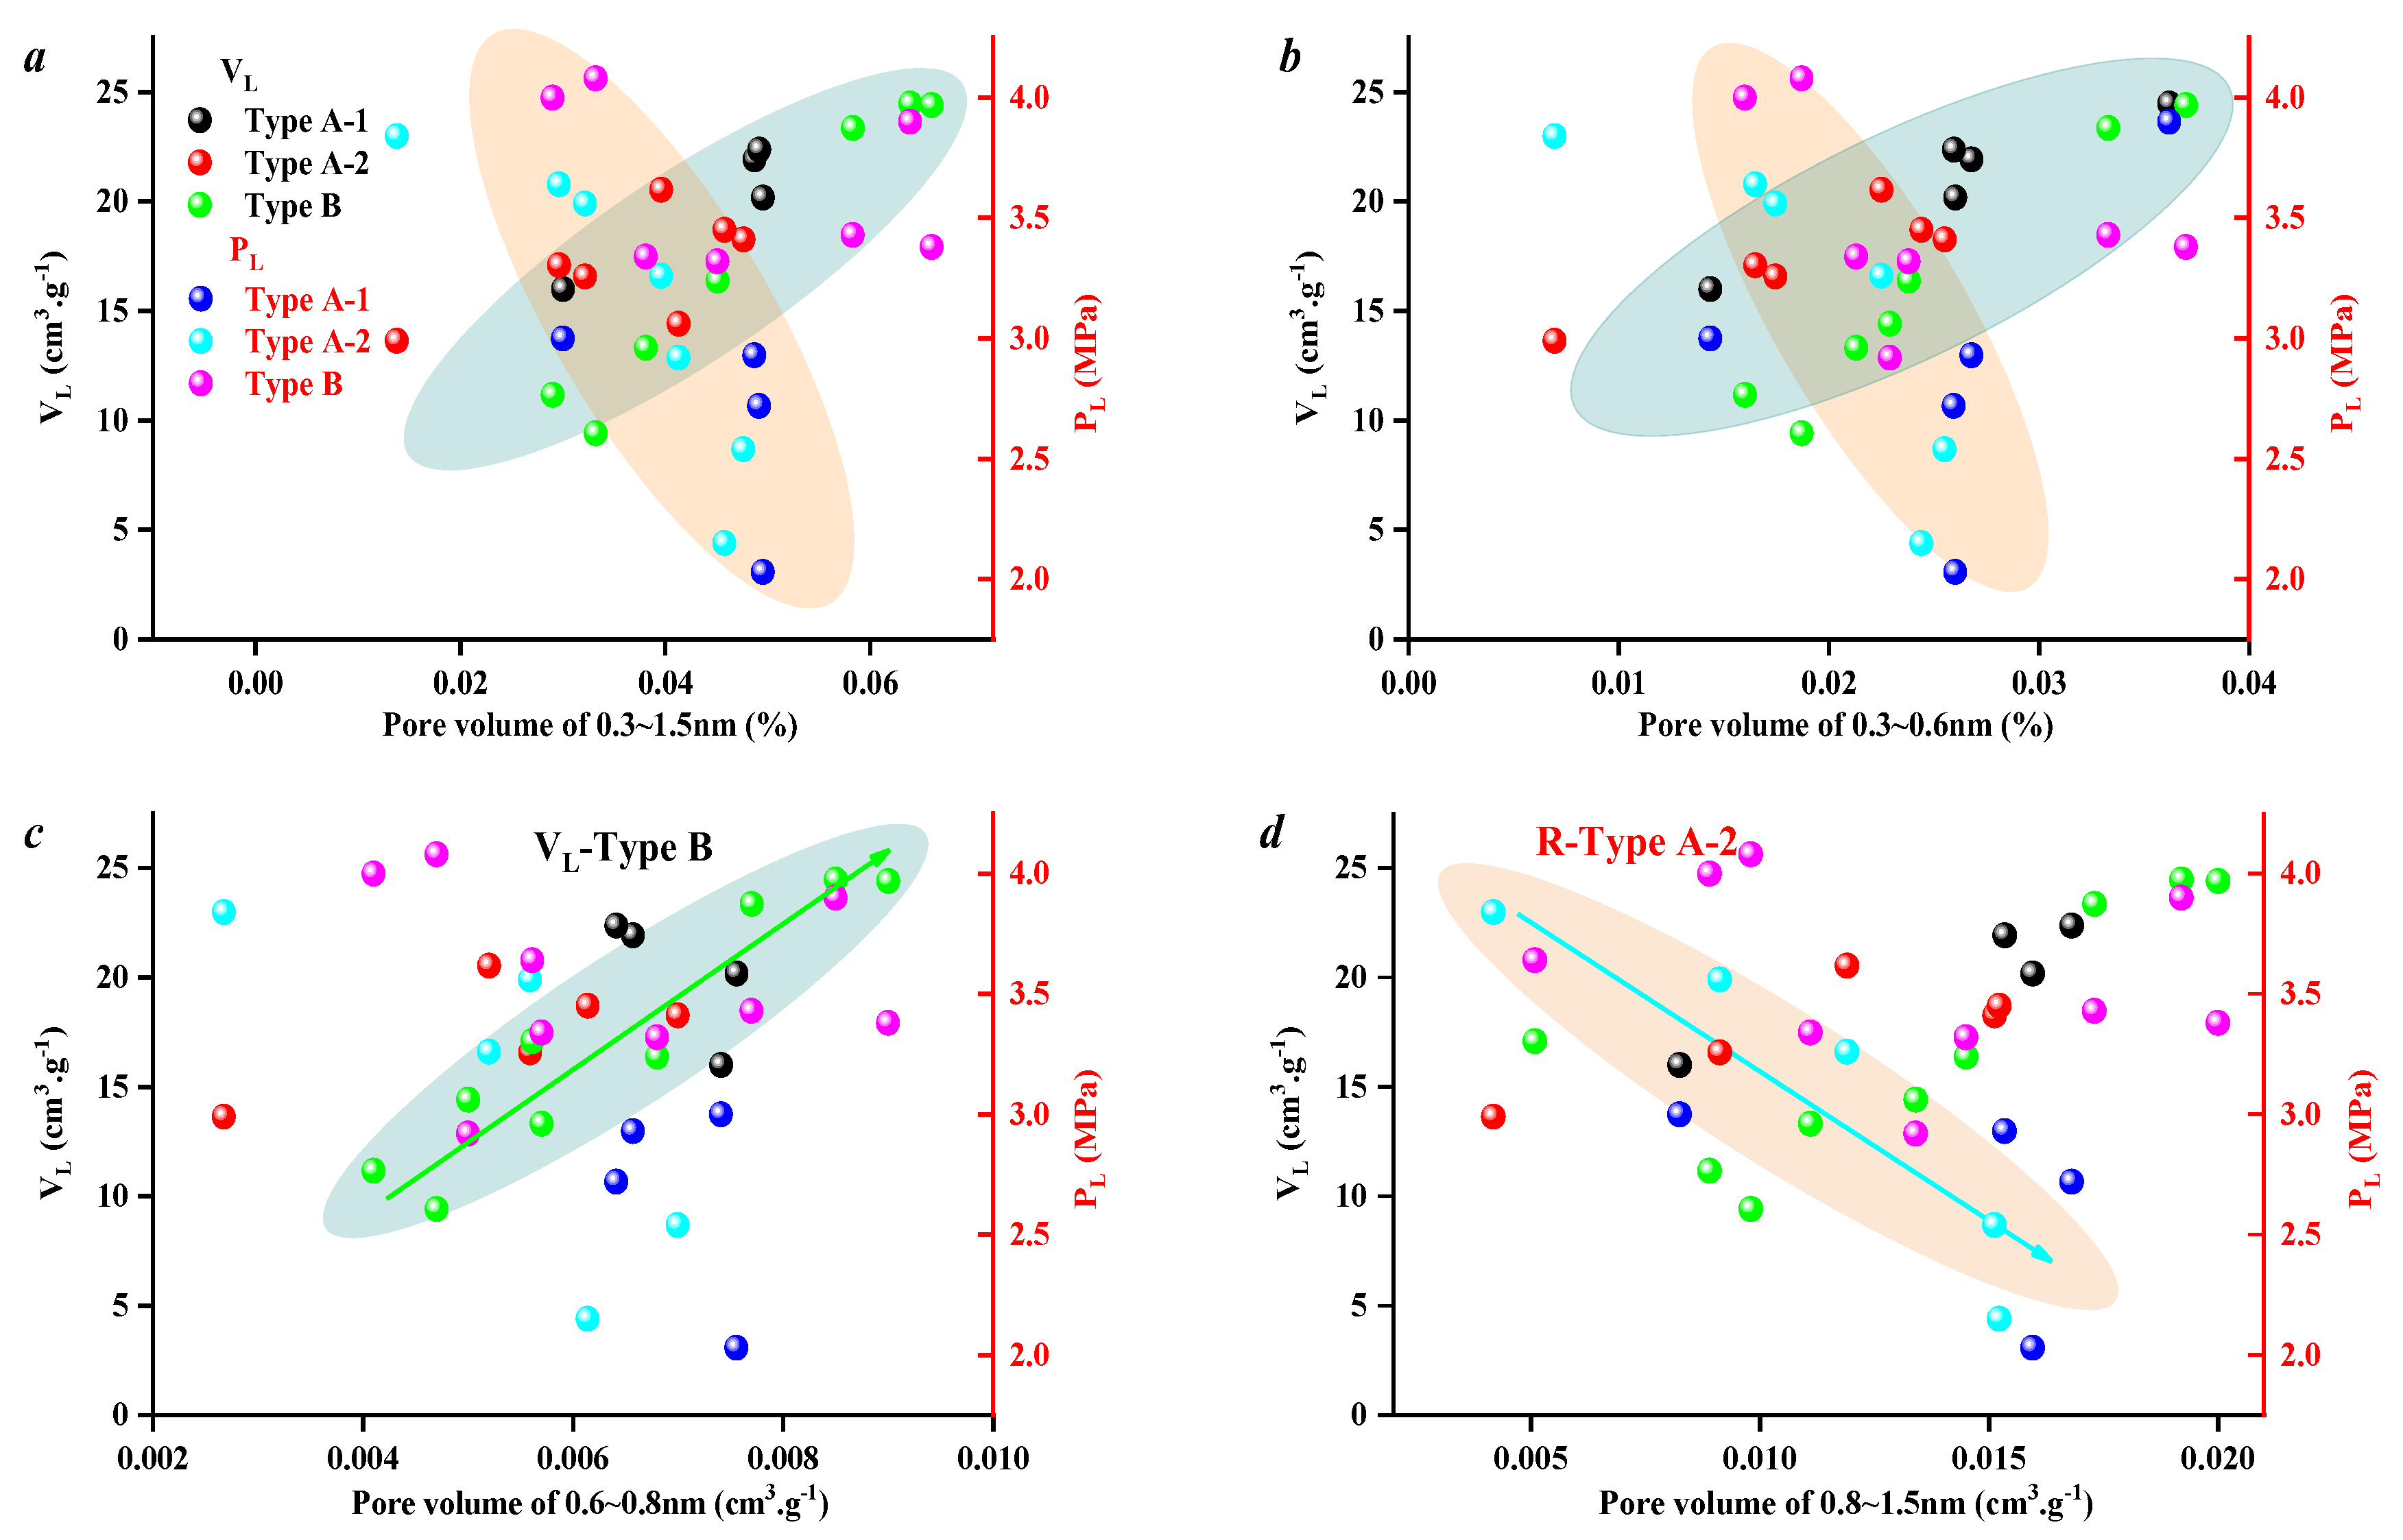
3.3. Effect of Coal Facies and Coal Quality on SFE Parameters

ε-ω adsorption characteristic curves were obtained using Equations (1)–(4) (Figure 7). The results show that adsorption space decreases as a logarithmic function with higher adsorption potential. As the adsorption pressure increases, the adsorption potential decreases and the adsorption space increases, respectively. The maximum adsorption space of type A-1 is 0.12~0.14 cm3.g−1, followed by type A-2 (0.11~0.12 cm3.g−1), while type B is the lowest (0.09~0.12 cm3.g−1).
Figure 8a shows the SFE as a function of adsorption pressure at a constant temperature. For a pressure below 20 MPa, the SFE increases gradually with higher adsorption pressure. For an adsorption pressure of more than 20 MPa, the SFE tends to be stable with higher adsorption pressure. These results show that adsorption pressure promotes the adsorption of gas on the coal surface, and that free energy on the coal surface leads to a low-energy state. In the initial stage of adsorption, the effect of adsorption pressure on the adsorption ability is obvious. As adsorption proceeds, gas molecules that are already adsorbed on the coal surface will have a repulsive effect on the molecules that still need to be adsorbed, thus reducing the favorable effect of pressure.
Figure 8b shows that the rate at which the SFE decreases also decreases with higher adsorption pressure, which indicates that the adsorption capacity of methane on the coal sample decreases with a longer adsorption time. For an adsorption pressure of less than 20 MPa, the rate at which SFE decreases is the largest, resulting in a rapid decrease in SFE. For an experimental pressure exceeding 20 MPa, the adsorption of methane molecules becomes more difficult, and the rate at which the SFE decreases also gradually decreases, resulting in a slow decrease in SFE. Figure 8c,d show that the maximum SFE of type A-1 and A-2 samples is larger than that of type B samples; the phenomena are consistent with those shown in Figure 3.
The relationship between micro-pore structure and energy parameters was also studied (Figure 9). The correlation between micro-pore volume and energy parameters is weak; there is no significant correlation between the micro-pore structure parameters of type A-2 and type B samples and the adsorption energy parameters (cumulative surface free energy (CSFE) and maximum surface free energy (MSFE) decline rate). However, with the increase in micro-pore volume in type A-1 samples, the cumulative surface free energy increases linearly and the maximum rate of decline decreases linearly (Figure 9). The reason for this is that the type A-1 samples belong to the low-ash wet herbaceous bog phase, and the Ro,max of all samples is 1.88~1.99. The ash yields and Ro,max lead to a large difference in micro-pore volume among the same type of samples, so the correlation between the micro-pore volume and adsorption energy parameters is stronger.
The relationship between coal facies parameters, industrial components, and adsorption energy parameters is studied (Figure 10). Figure 10b,d show that the coal facies and Ro,max have an important effect on the energy parameter; the rate of MSFE decline in type B samples increases with the increase in TPI. Moreover, the cumulative SFE of type A-2 samples increases and the MSFE decline rate of type A-2 samples decreases with the increase in Ro,max, indicating that the degree of coal thermal evolution has an important effect on the adsorption energy parameters. As mentioned above, the Ro,max of type A-2 samples is the most different, resulting in the most obvious control effect of Ro,max on micro-pore structure.
The relationship between the single- and multi-fractal dimension and energy parameter is studied (Figure 11). There is a linear relationship between the single-fractal dimension (D2), D0-D10, and adsorption energy parameter of type A-2 samples. This is because the Ro,max of type A-2 samples is the most different, resulting in the most obvious control effect of Ro,max on micro-pore structure. Differing from Figure 11a,b, the cumulative SFE of type A-1 samples decreases and the MSFE decline rate of type A-1 samples increases with the increase in D-10-D0 and D-10-D10, indicating that multi-fractal dimension variation has an important effect on adsorption energy parameters (Figure 11c,d).
Above all, the three coal facies can be divided by using Aad~GI, including low-ash moist herbaceous bog facies (Type A-1), high-ash moist herbaceous bog facies (Type A-2), and cover grass swamp facies (Type B). Ro,max, ash yield, and fixed carbon content affect micro-pore structure and methane adsorption ability. Coal facies and micro-pore structure affect methane adsorption capacity, and the adsorption energy parameters of different coal facies are obviously different. The effects of low ash yield and different Ro,max values on methane adsorption energy parameters are stronger.

4. Conclusions

With the increase in micro-pore volume seen in the type A-1 sample, the cumulative surface free energy increases linearly and the maximum rate of decline decreases linearly. The reason is that type A-1 samples belong to the low-ash wet herbaceous bog phase. The ash yields and Ro,max lead to a large difference in micro-pore volume among the same types of samples, so the correlation between the micro-pore volume and adsorption energy parameters is stronger.
For the same coal rank, a higher ash yield correlates with a lower adsorption capacity. Coal facies have an important effect on adsorption parameters: VL increases and PL decreases with higher TPI. The effect of a low ash yield and different Ro,max values on methane adsorption energy parameters is stronger.

Author Contributions

Methodology, X.Z.; software, K.W.; validation, B.Y. and V.V.; formal analysis, Z.Q. and S.H.; investigation, F.Q. All authors have read and agreed to the published version of the manuscript.

Funding

This research was sponsored by Natural Science Foundation of Shandong Province, China (ZR2020QD040).

Data Availability Statement

The original contributions presented in this study are included in the article. Further inquiries can be directed to the corresponding author.

Conflicts of Interest

Authors Xiaogang Zhou, and Baozhen Yan were employed by Orion Energy International Inc. Authors Kai Wang and Shi He were employed by PetroChina Coalbed Methane Company. The remaining authors declare that the research was conducted in the absence of any commercial or financial relationships that could be construed as a potential conflict of interest.

Abbreviations

TermFull name
GIGel index
TPIPlant Structure Preservation Index
GWIGroundwater flow index
VLLangmuir volume
PLLangmuir pressure
CBMCoalbed methane
SSASpecific surface area
AadYield contents
CSFECumulative surface free energy
MSFEMaximum surface free energy

References

  1. Tonnsen, R.R.; Miskimins, J. Simulation of deep-coalbed-methane permeability and production assuming variable pore-volume compressibility. J. Can. Pet. Technol. 2011, 50, 23–31. [Google Scholar] [CrossRef]
  2. Xu, F.; Hou, W.; Xiong, X.; Xu, B.; Wu, P.; Wang, H.; Feng, K.; Yun, J.; Li, S.; Zhang, L.; et al. The status and development strategy of coalbed methane industry in China. Pet. Explor. Dev. 2023, 50, 765–783. [Google Scholar] [CrossRef]
  3. Hao, D.; Zhang, L.; Li, M.; Tu, S.; Zhang, C.; Bai, Q.; Wang, C. Experimental study of the moisture content influence on CH4 adsorption and deformation characteristics of cylindrical bituminous coal core. Adsorpt. Sci. Technol. 2018, 36, 1512–1537. [Google Scholar] [CrossRef]
  4. Huang, R.; Lei, Q.; Chen, J.; Weng, D.; Wang, X.; Liang, H. Gas content prediction model of water-sensitive shale based on gas–water miscible competitive adsorption. Pet. Sci. Technol. 2022, 42, 1841–1863. [Google Scholar] [CrossRef]
  5. Chen, Y.; Ma, D.; Guo, C.; Yang, F.; Mu, T.; Gao, Z. An Experimental Study on the Conductivity Changes in Coal during Methane Adsorption-Desorption and their Influencing Factors. Acta Geol. Sin.-Engl. Ed. 2019, 93, 704–717. [Google Scholar] [CrossRef]
  6. Cheng, Y.; Pan, Z. Reservoir properties of Chinses tectonic coal: A review. Fuel 2020, 260, 116350. [Google Scholar] [CrossRef]
  7. Zhang, J.; Wei, C.; Zhao, C.; Zhang, T.; Lu, G.; Zou, M. Effects of nano-pore and macromolecule structure of coal samples on energy parameters variation during methane adsorption under different temperature and pressure. Fuel 2021, 289, 119804. [Google Scholar] [CrossRef]
  8. Qin, L.; Wang, P.; Li, S.; Lin, H.; Wang, R.; Wang, P.; Ma, C. Gas adsorption capacity changes in coals of different ranks after liquid nitrogen freezing. Fuel 2021, 292, 120404. [Google Scholar] [CrossRef]
  9. Ye, J.; Tao, S.; Zhao, S.; Li, S.; Chen, S.; Cui, Y. Characteristics of methane adsorption/desorption heat and energy with respect to coal rank. J. Nat. Gas Sci. Eng. 2022, 99, 104445. [Google Scholar] [CrossRef]
  10. Sun, F.; Liu, D.; Cai, Y.; Qiu, Y. Coal rank-pressure coupling control mechanism on gas adsorption/desorption in coalbed methane reservoirs. Energy 2023, 270, 126849. [Google Scholar] [CrossRef]
  11. Yang, Y.; Liu, S.; Zhao, W.; Wang, L. Intrinsic relationship between Langmuir sorption volume and pressure for coal: Experimental and thermodynamic modeling study. Fuel 2019, 241, 105–117. [Google Scholar] [CrossRef]
  12. Niu, Q.; Pan, J.; Jin, Y.; Wang, H.; Li, M.; Ji, Z.; Wang, K.; Wang, Z. Fractal study of adsorption-pores in pulverized coals with various metamorphism degrees using N2 adsorption, X-ray scattering and image analysis methods. J. Pet. Sci. Eng. 2019, 176, 584–593. [Google Scholar] [CrossRef]
  13. Xue, Y.; Liu, J.; Liang, X.; Wang, S.; Ma, Z. Ecological risk assessment of soil and water loss by thermal enhanced methane recovery: Numerical study using two-phase flow simulation. J. Clean. Prod. 2022, 334, 130183. [Google Scholar] [CrossRef]
  14. Li, Z.; Ren, T.; Li, X.; Qiao, M.; Yang, X.; Tan, L.; Nie, B. Multi-scale pore fractal characteristics of differently ranked coal and its impact on gas adsorption. Int. J. Min. Sci. Technol. 2023, 33, 389–401. [Google Scholar] [CrossRef]
  15. Li, T.; Wu, C. Coal facies characteristics and its control on methane content in South Yanchuan Block, Southeast Ordos Basin, China. Int. J. Green Energy Coal Geol. 2017, 14, 63–74. [Google Scholar] [CrossRef]
  16. Zou, J.; Rezaee, M.R.; Xie, Q.; You, L.; Liu, K.; Saeedi, A. Investigation of moisture effect on methane adsorption capacity of shale samples. Fuel 2018, 232, 323–332. [Google Scholar] [CrossRef]
  17. Chen, M.-Y.; Cheng, Y.-P.; Li, H.-R.; Wang, L.; Jin, K.; Dong, J. Impact of inherent moisture on the methane adsorption characteristics of coals with various degrees of metamorphism. J. Nat. Gas Sci. Eng. 2018, 55, 312–320. [Google Scholar] [CrossRef]
  18. Yan, J.; Meng, Z.; Li, G. Diffusion characteristics of methane in various rank coals and the control mechanism. Fuel 2021, 283, 118959. [Google Scholar] [CrossRef]
  19. Ocampo-Pérez, R.; Rivera-Utrilla, J.; Gómez-Pacheco, C.; Sánchez-Polo, M.; López-Peñalver, J. Kinetic study of tetracycline adsorption on sludge-derived adsorbents in aqueous phase. Chem. Eng. J. 2012, 213, 88–96. [Google Scholar] [CrossRef]
  20. Zhao, J.; Xu, H.; Tang, D.; Mathews, J.P.; Li, S.; Tao, S. A comparative evaluation of coal specific surface area by CO2 and N2 adsorption and its influence on CH4 adsorption capacity at different pore sizes. Fuel 2016, 183, 420–431. [Google Scholar] [CrossRef]
  21. Fu, H.; Tang, D.; Xu, T.; Xu, H.; Tao, S.; Li, S.; Yin, Z.; Chen, B.; Zhang, C.; Wang, L. Characteristics of pore structure and fractal dimension of low-rank coal: A case study of Lower Jurassic Xishanyao coal in the southern Junggar Basin, NW China. Fuel 2017, 193, 254–264. [Google Scholar] [CrossRef]
  22. Sun, Y.; Zhao, Y.; Yuan, L. Impact of coal composition and pore structure on gas adsorption: A study based on a synchrotron radiation facility. Greenh. Gases Sci. Technol. 2020, 10, 116–129. [Google Scholar] [CrossRef]
  23. Meng, Z.; Liu, S.; Li, G. Adsorption capacity, adsorption potential and surface free energy of different structure high rank coals. J. Pet. Sci. Eng. 2016, 146, 856–865. [Google Scholar] [CrossRef]
  24. Gao, C.; Liu, D.; Vandeginste, V.; Cai, Y.; Sun, F. Thermodynamic energy change and occurrence mechanism of multiple fluids in coal reservoirs. Energy 2023, 283, 129089. [Google Scholar] [CrossRef]
  25. Zhang, L.; Aziz, N.; Ren, T.X.; Wang, Z. Influence of Temperature on Coal Sorption Characteristics and the Theory of Coal Surface Free Energy. Procedia Eng. 2011, 26, 1430–1439. [Google Scholar] [CrossRef]
  26. Lu, G.; Wei, C.; Wang, J.; Zhang, J.; Quan, F.; Tamehe, L.S. Variation of surface free energy in the process of methane adsorption in the nanopores of tectonically deformed coals: A Case Study of Middle-Rank Tectonically Deformed Coals in the Huaibei Coalfield. Energy Fuels 2019, 33, 7155–7165. [Google Scholar] [CrossRef]
  27. Zhang, J.; Wei, C.; Luo, J.; Lu, G.; Quan, F.; Zheng, K.; Peng, Y. Volume and Surface Distribution Heterogeneity of Nano-pore in Coal Samples by CO2 and N2 Adsorption Experiments. Acta Geol. Sin.-Engl. 2020, 94, 1662–1675. [Google Scholar] [CrossRef]
  28. Zhang, J.; Wang, H.; Vandeginste, V.; Miao, H.; Guo, Y.; Ji, Y.; Liu, P.; Peng, Y. Effect of litho-facies on nano-pore structure of continental shale in shuinan formation of Jiaolai Basin. Geoenergy Sci. Eng. 2023, 228, 212020. [Google Scholar] [CrossRef]
  29. Zhang, S.; Tang, S.; Tang, D.; Pan, Z.; Yang, F. The characteristics of coal reservoir pores and coal facies in Liulin district, Hedong coal field of China. Int. J. Coal Geol. 2010, 81, 117–127. [Google Scholar] [CrossRef]
  30. Zhao, W.; Wang, K.; Ju, Y.; Fan, L.; Cao, H.; Yang, Y.; Shu, L.; Feng, Z.; Cui, R.; Guo, X.; et al. Quantification of the asynchronous gas diffusivity in macro-/micropores using a Nelder-Mead simplex algorithm and its application on predicting desorption-based indexes. Fuel 2023, 332, 126149. [Google Scholar] [CrossRef]
  31. GB/T 19222-2003; Sampling of Coal Petrology. Standardization Administration of China: Beijing, China, 2003.
  32. GB/T 6948-1998; Microscopical Determination of the Reflectance of Vitrinite in Coal. Standardization Administration of China: Beijing, China, 1998.
  33. GB/T 212-2001; Proximate Analysis of Coal. Standardization Administration of China: Beijing, China, 2001.
  34. Pan, J.; Wang, K.; Hou, Q.; Niu, Q.; Wang, H.; Ji, Z. Micro-pores and fractures of coals analyzed by field emission scanning electron microscopy and fractal theory. Fuel 2016, 164, 277–285. [Google Scholar] [CrossRef]
  35. Zhao, W.; Liu, H.; Wang, H.; Liu, D.; Liu, X. Research on the controlling effect of coal facies on pore structure—Deeply buried coal seam 8 # in Yulin Area, Ordos Basin for Example. Coal Sci. Technol. 2023, 52, 142–154. (In Chinese) [Google Scholar] [CrossRef]
  36. GB/19560-2008; Experimental Method for High Pressure Isothermal Adsorption of Coal. Standardization Administration of China: Beijing, China, 2008.
  37. Mosher, K.; He, J.; Liu, Y.; Rupp, E.; Wilcox, J. Molecular simulation of methane adsorption in micro- and mesoporous carbons with applications to coal and gas shale systems. Int. J. Coal Geol. 2013, 109–110, 36–44. [Google Scholar] [CrossRef]
  38. Mukherjee, M.; Misra, S. A review of experimental research on Enhanced Coal Bed Methane (ECBM) recovery via CO2 sequestration. Earth-Sci. Rev. 2018, 179, 392–410. [Google Scholar] [CrossRef]
  39. Feng, Z.-C.; Wang, C.; Zhou, D.; Zhao, D. Variation law of adsorption heat of methane and coal with inhomogeneous potential well. Adsorpt. Sci. Technol. 2018, 36, 1538–1549. [Google Scholar] [CrossRef]
  40. Mahmood, N.; Khan, M.; Khan, A. Purification, Surface Modification of Coal Ash Silica and lts Potential Application in Rubber Composites. J. Appl. Polym. Sci. 2010, 117, 1493–1501. [Google Scholar] [CrossRef]
  41. Lopanov, A.N.; Fanina, E.A.; Tikhomirova, K.V. Calculation of the Free Surface Energy of Coals from the Donets Basin and Graphites. Solid Fuel Chem. 2018, 52, 15–20. [Google Scholar] [CrossRef]
  42. Hazrin-Chong, N.H.; Das, T.; Manefield, M. Surface physico-chemistry governing microbial cell attachment and biofilm formation on coal. Int. J. Coal Geol. 2021, 236, 103671. [Google Scholar] [CrossRef]
  43. Pugi, L.; Cocci, M.; Frillici, F.S.; Berzi, L.; Mariottoni, E.; Sacchetto, M. Modeling of an underwater drilling platform for very near shore applications. Proc. Inst. Mech. Eng. Part M J. Eng. Marit. Environ. 2023, 237, 263–272. [Google Scholar] [CrossRef]
  44. Liu, Y.; Wang, D.; Hao, F.; Liu, M.; Mitri, H.S. Constitutive model for methane desorption and diffusion based on pore structure differences between soft and hard coal. Int. J. Min. Sci. Technol. 2017, 27, 937–944. [Google Scholar] [CrossRef]
  45. Zhang, Z.; Liu, G.; Lin, J.; Barakos, G.; Chang, P. Fractal Evolution Characteristics on the Three-Dimensional Fractures in Coal Induced by CO2 Phase Transition Fracturing. Fractal Fract. 2024, 8, 273. [Google Scholar] [CrossRef]
Figure 1. Microscopic identification of coal sub-maceral ((ad), well Q32: matrix vitrinite (c1) by clay; semi-fusinite, clay-filled cell cavity, pyrite (py); (eh), sample M2 of well M172: matrix vitrinite (c1) binds coarse-grained bodies, semi-filamentous bodies, crustaceous bodies (cr), and minerals (ca); sample M2: under the same field of view, minerals exhibit light green fluorescence, while keratinocytes, pollen bodies, and resin bodies exhibit orange-yellow fluorescence, serinite (F); (il), well B15: semi-fusinite, homogeneous vitrinite (T2), matrix vitrinite (c1), oxidized fusinite (oF)).
Processes 12 02780 g001
Figure 2. The correlation between different coal phase parameters ((a,b), parameter correlation analysis; f, GI~TPI).
Processes 12 02780 g002
Figure 3. Isothermal adsorption curves and adsorption parameters of different coal facies ((a), isotherm adsorption curves of different samples; (b), relationship between adsorption constants VL and PL with Ro,max; (c,d), VL and PL of different coal facies).
Processes 12 02780 g003
Figure 4. Relationship between micro-pore structure and adsorption parameters ((a), pore volume of 0.3~1.5 nm vs. PL and VL; (b), pore volume of 0.3~0.6 nm vs. PL and VL; (c), pore volume of 0.6~0.8 nm vs. PL and VL; (d), pore volume of 0.8~1.5 nm vs. PL and VL).
Processes 12 02780 g004
Figure 5. Relationship between coal facies parameters and adsorption parameters ((a), Aad vs. PL and VL; (b), TPI vs. PL and VL; (c), GI vs. PL and VL; (d), Ro,max vs. PL and VL).
Processes 12 02780 g005
Figure 6. Relationship between single- and multi-fractal dimension and adsorption parameters (ad).
Processes 12 02780 g006aProcesses 12 02780 g006b
Figure 7. Relationship between ε and ω (ac).
Processes 12 02780 g007
Figure 8. The amount of and rate of change in surface free energy of different types of samples ((a,b), amount and rate of surface free energy change; (c,d), adsorption energy parameters for different coal facies types).
Processes 12 02780 g008
Figure 9. Relationship between micro-pore structure and adsorption parameters (ad).
Processes 12 02780 g009
Figure 10. Relationship between coal facies parameters and adsorption parameters ((a) Aad vs cumulative reduction and reduction rate; (b) TPI vs cumulative reduction and reduction rate; (c) GI vs cumulative reduction and reduction rate; (d) Ro,max vs cumulative reduction and reduction rate).
Processes 12 02780 g010aProcesses 12 02780 g010b
Figure 11. Relationship between micro-pore structure and adsorption parameters (ad).
Processes 12 02780 g011
Table 1. Basic information of coal samples.
Well No.Sample No.Ro,max
(%)
Vitrinite
(%)
Exinite
(%)
Inertinite
(%)
Mad
(%)
Aad
(%)
Vdaf
(%)
FCdaf
(%)
Q-1Q12.0174.81025.130.631.518.9758.92
Q22.1488.27011.720.5636.099.3354.02
MM11.9659.262.3638.380.4832.8315.5751.12
M21.947.2232.2920.490.6522.8412.7563.76
M31.8850.5217.5331.960.9812.6912.1674.17
M41.8952.862.0245.120.6512.2311.9575.17
M51.9458.111.6940.20.7921.4611.8165.94
M61.8933.4516.7249.831.0911.0411.5476.33
M71.8959.725.5634.720.7919.4311.9667.82
M81.8741.4517.0941.450.7217.6313.1368.52
JJ11.9559.448.7431.820.6528.8612.2158.28
J21.847.7920.3531.860.7255.99//
J31.9328.620.6770.710.7326.2812.760.29
J41.8648.5814.1837.230.6827.8512.5358.94
Q-2Q31.9997.712.2900.8810.398.2180.52
Q42.0291.791.936.280.7415.458.7175.1
Q51.9786.032.7911.170.3538.5721.5939.49
Q61.8947.771.6250.610.768.168.0383.05
BB12.0986.340.0013.730.6320.049.1470.19
B22.0662.570.0037.370.4538.899.6850.98
B32.2596.930.003.190.551.57//
B42.179.210.0020.740.323.6712.163.93
Disclaimer/Publisher’s Note: The statements, opinions and data contained in all publications are solely those of the individual author(s) and contributor(s) and not of MDPI and/or the editor(s). MDPI and/or the editor(s) disclaim responsibility for any injury to people or property resulting from any ideas, methods, instructions or products referred to in the content.

