

Data Digitization in Manufacturing Factory Using Palantir Foundry Solution


Abstract
:1. Introduction
2. Materials and Methods
2.1. Current State
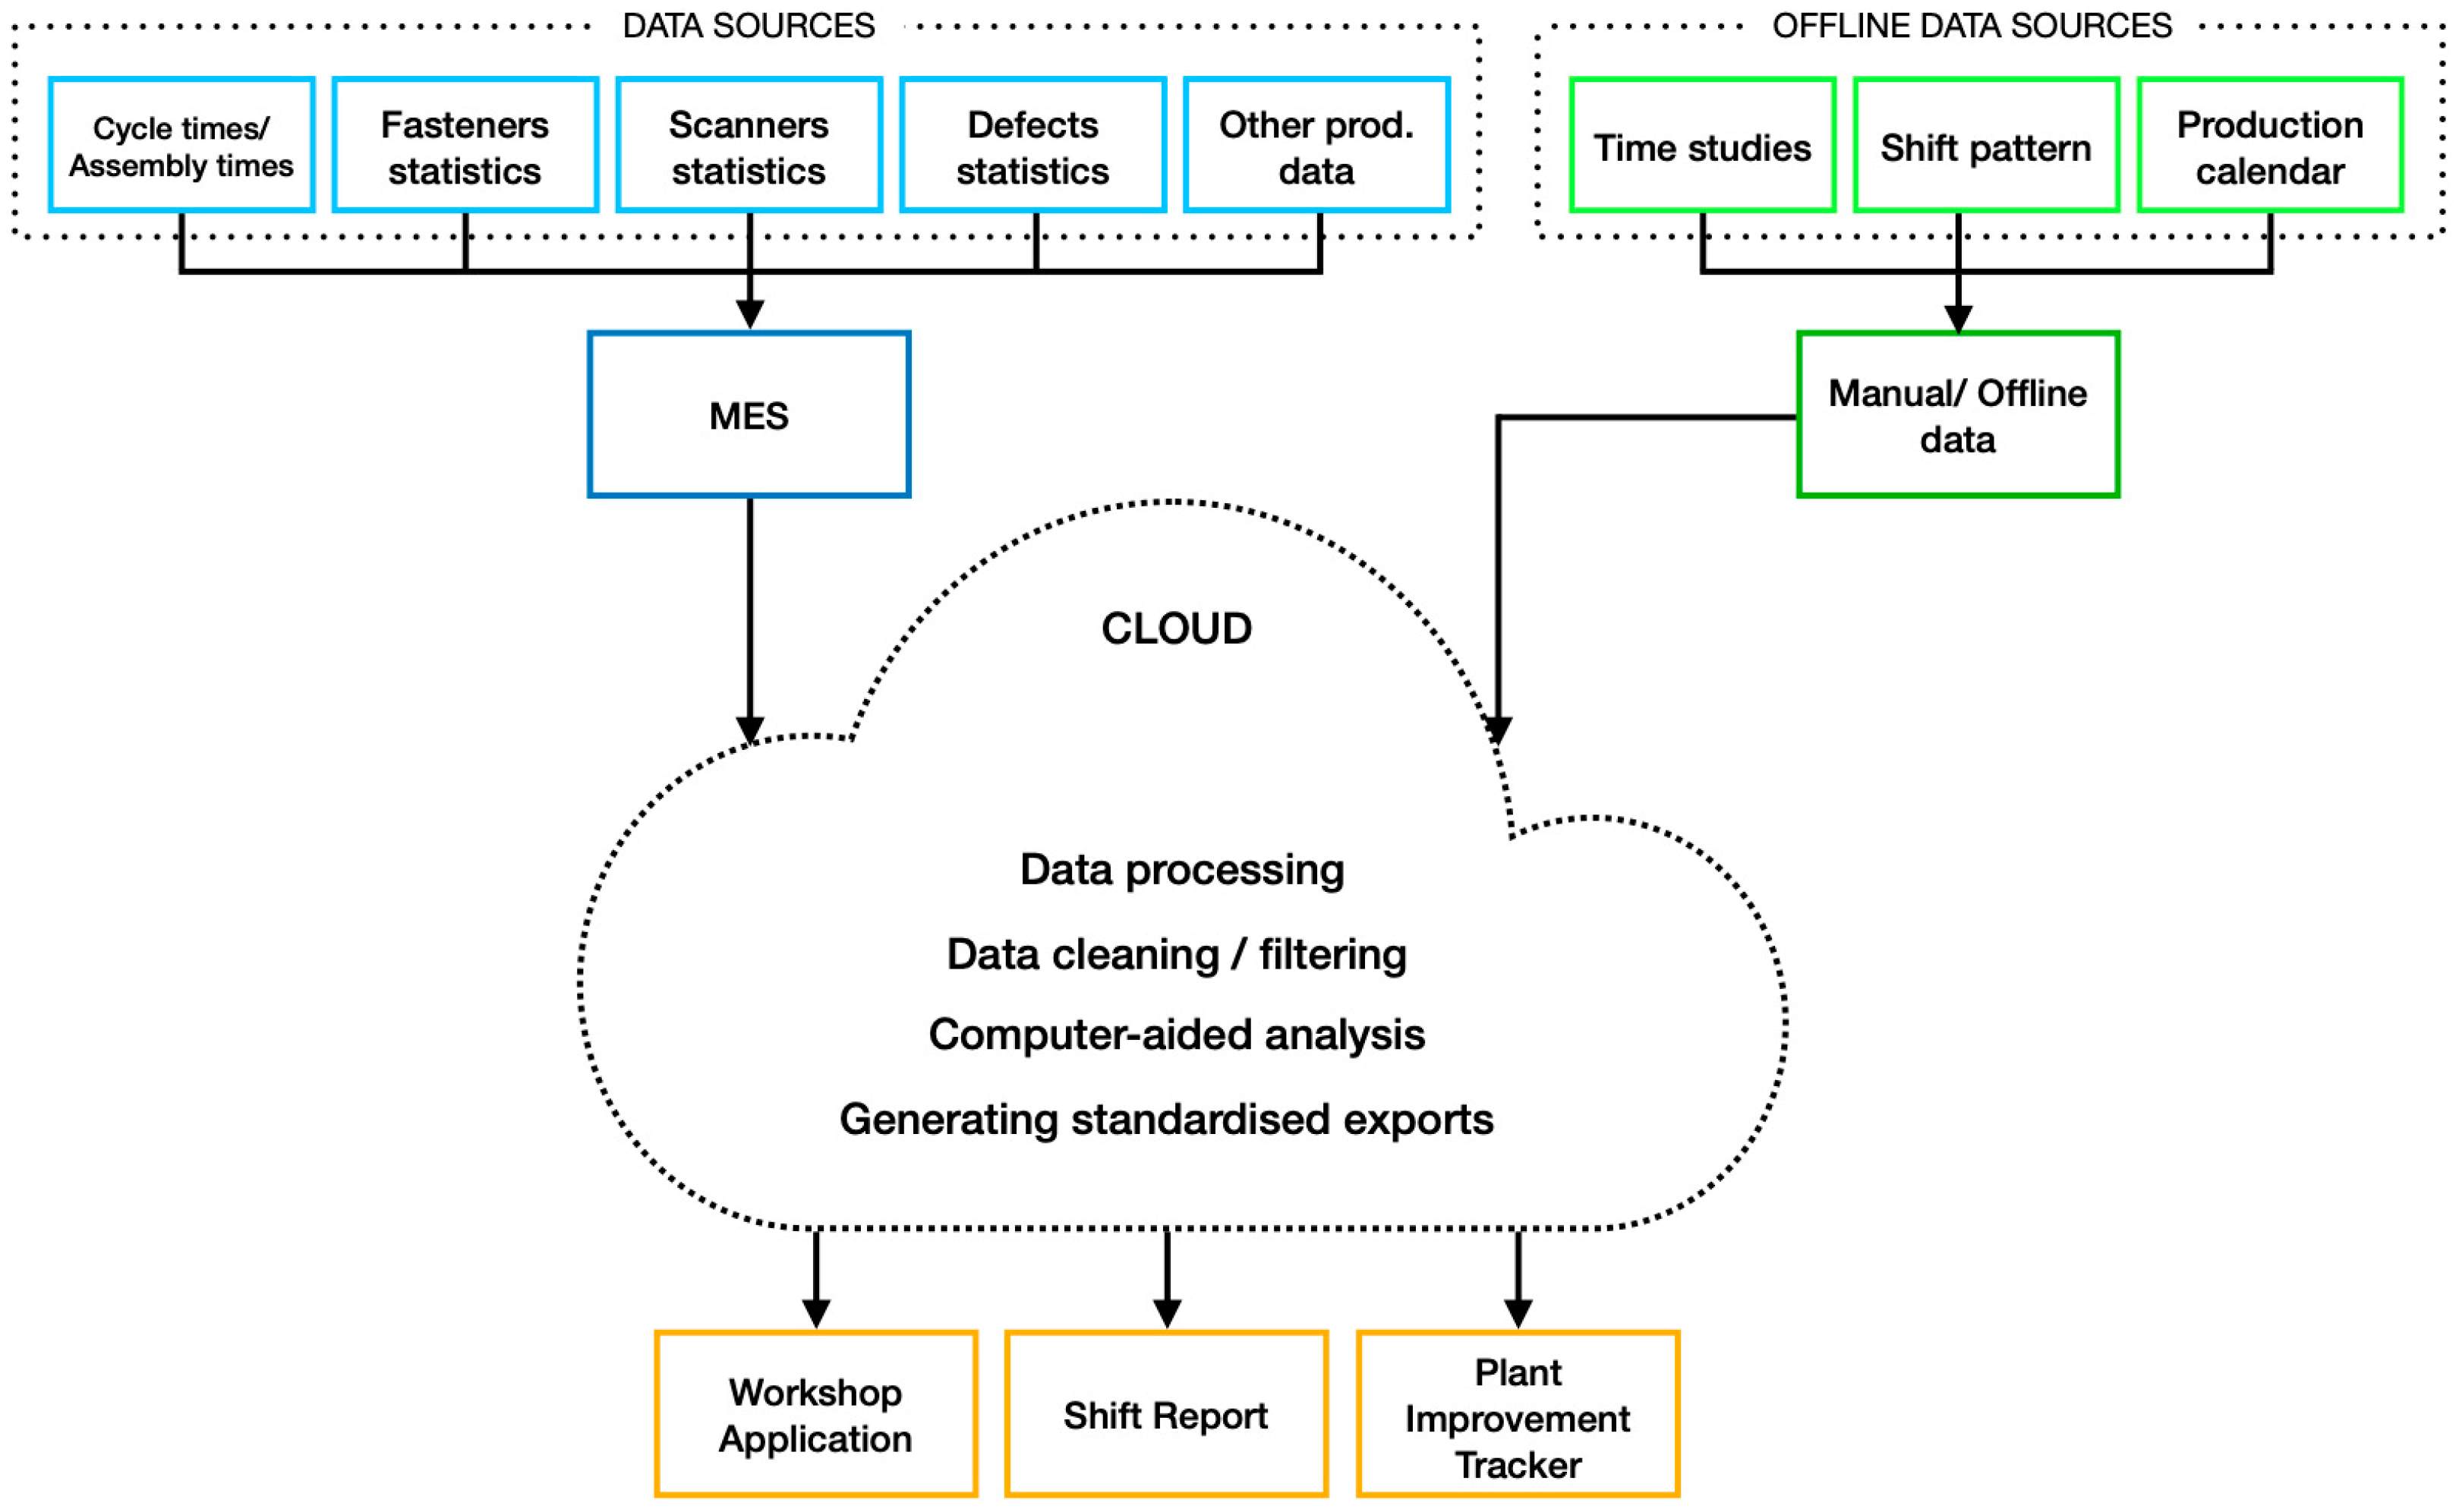
2.2. Solution Proposal
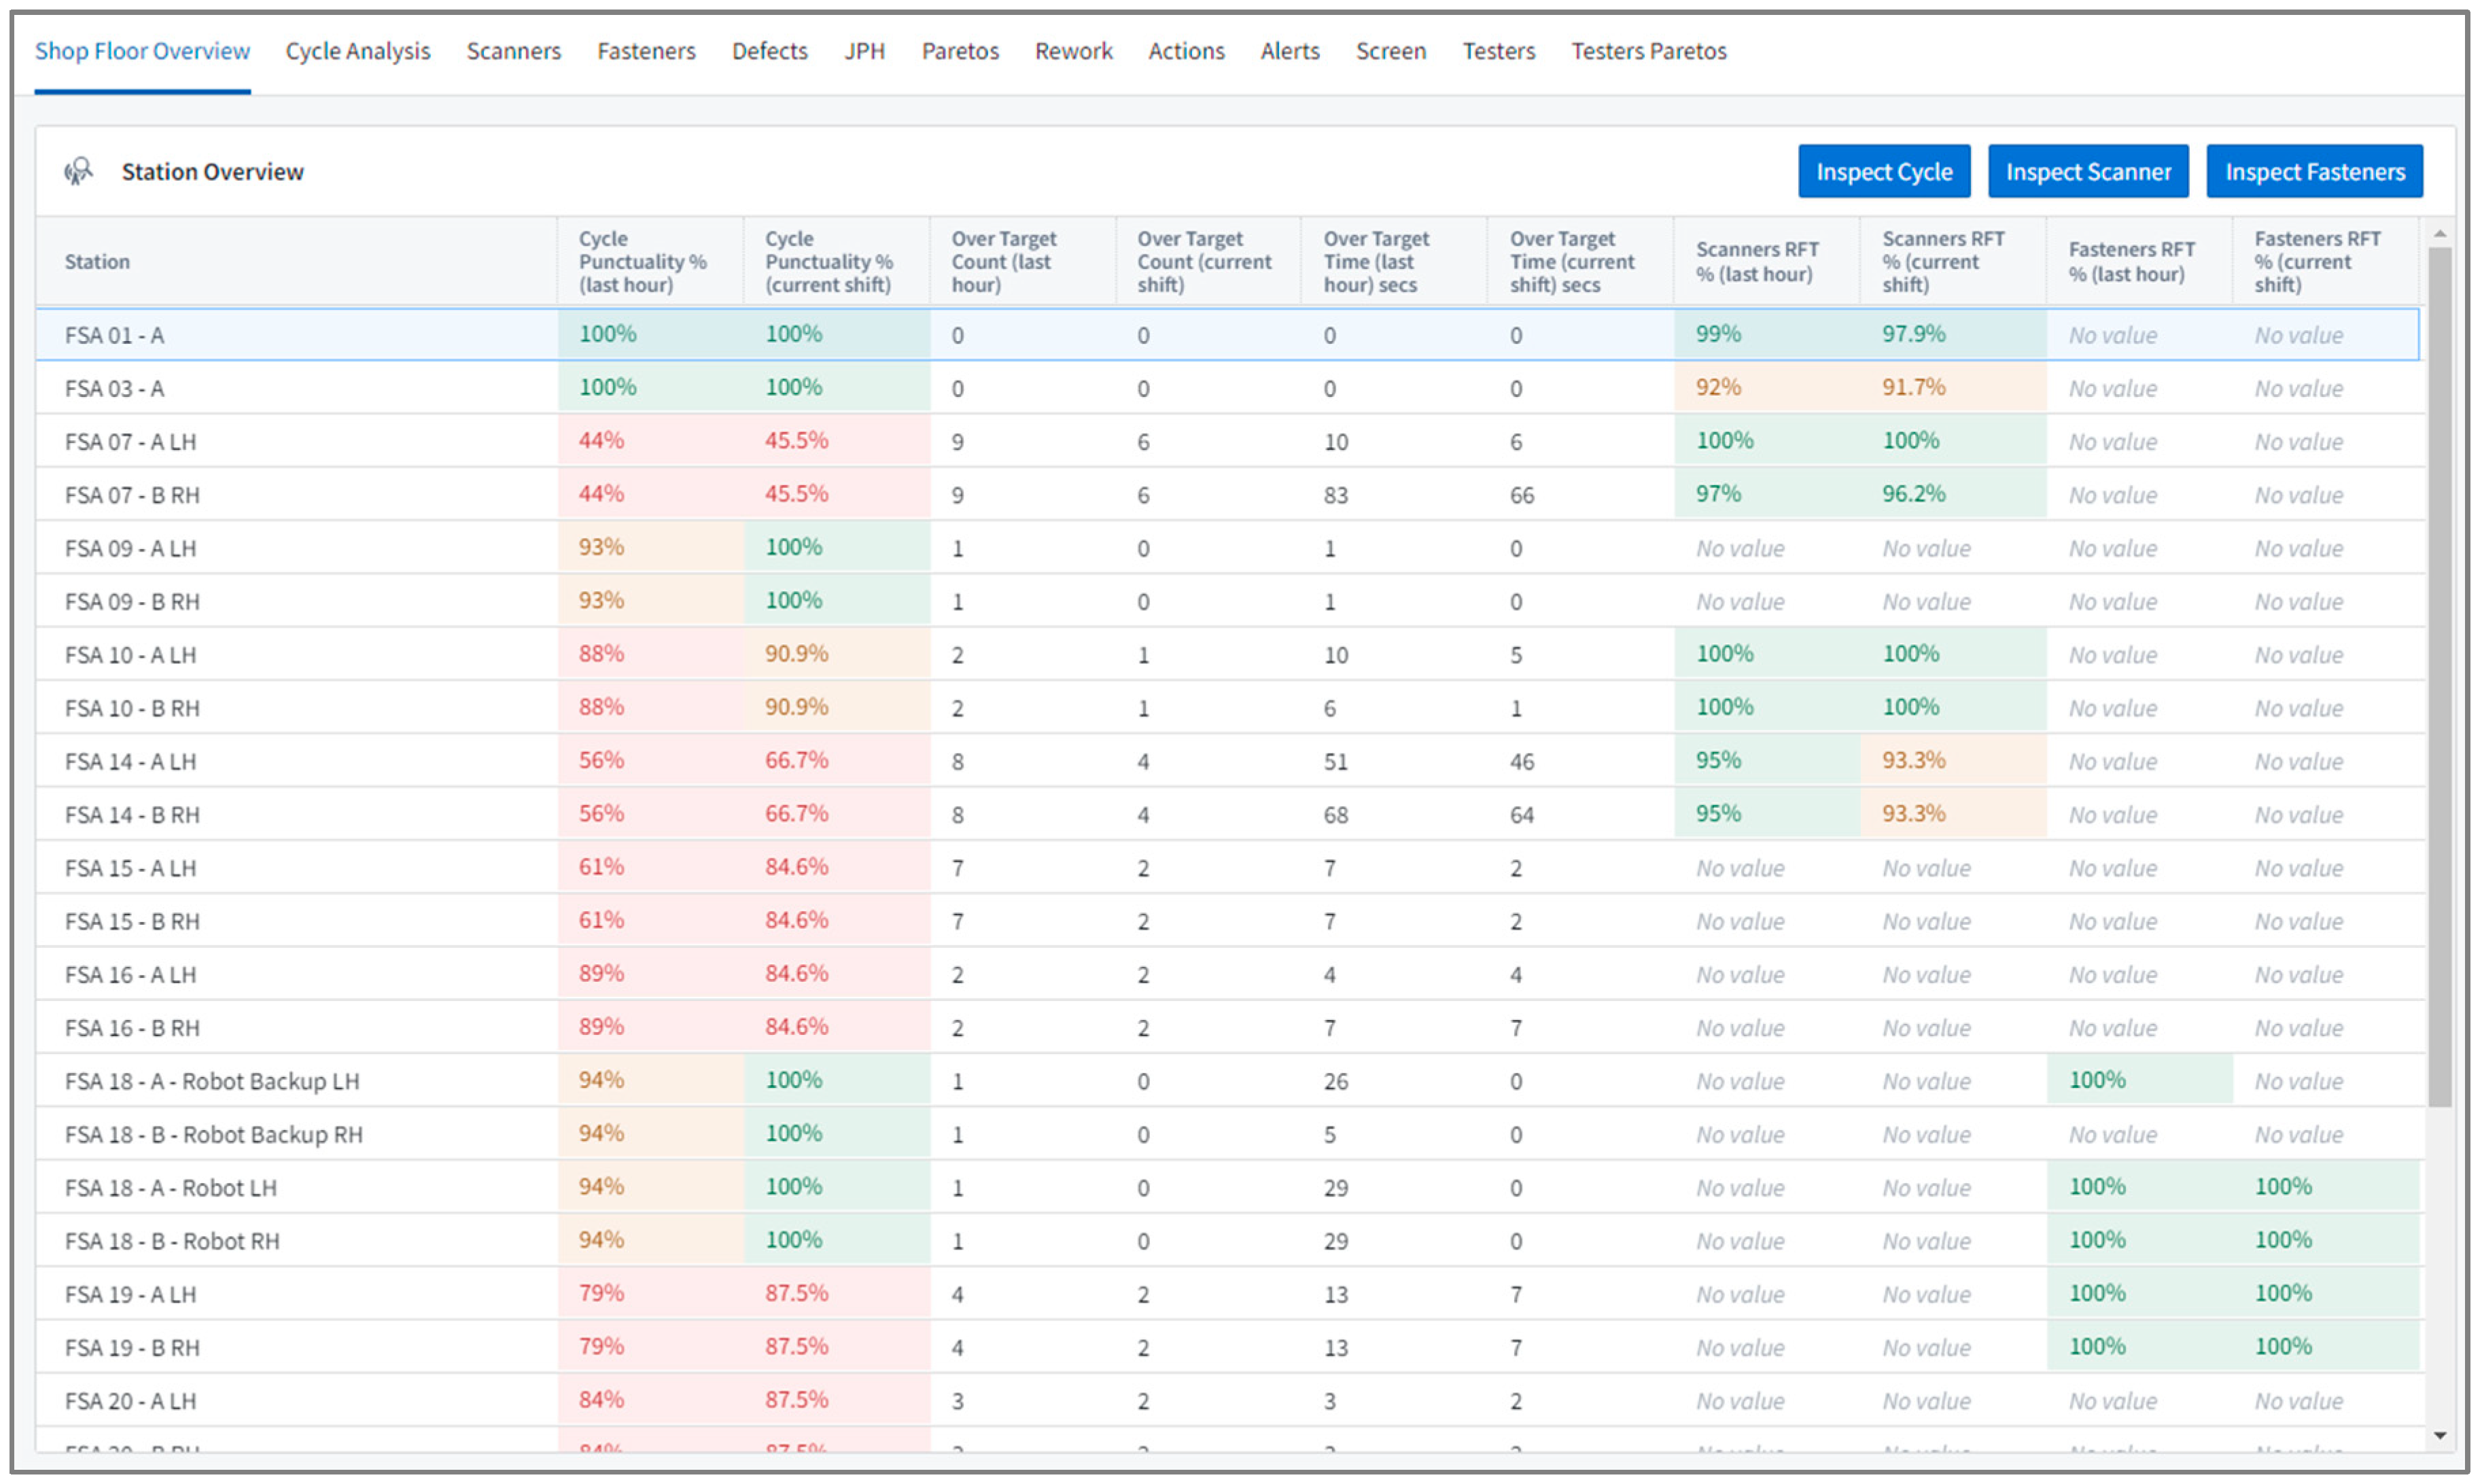
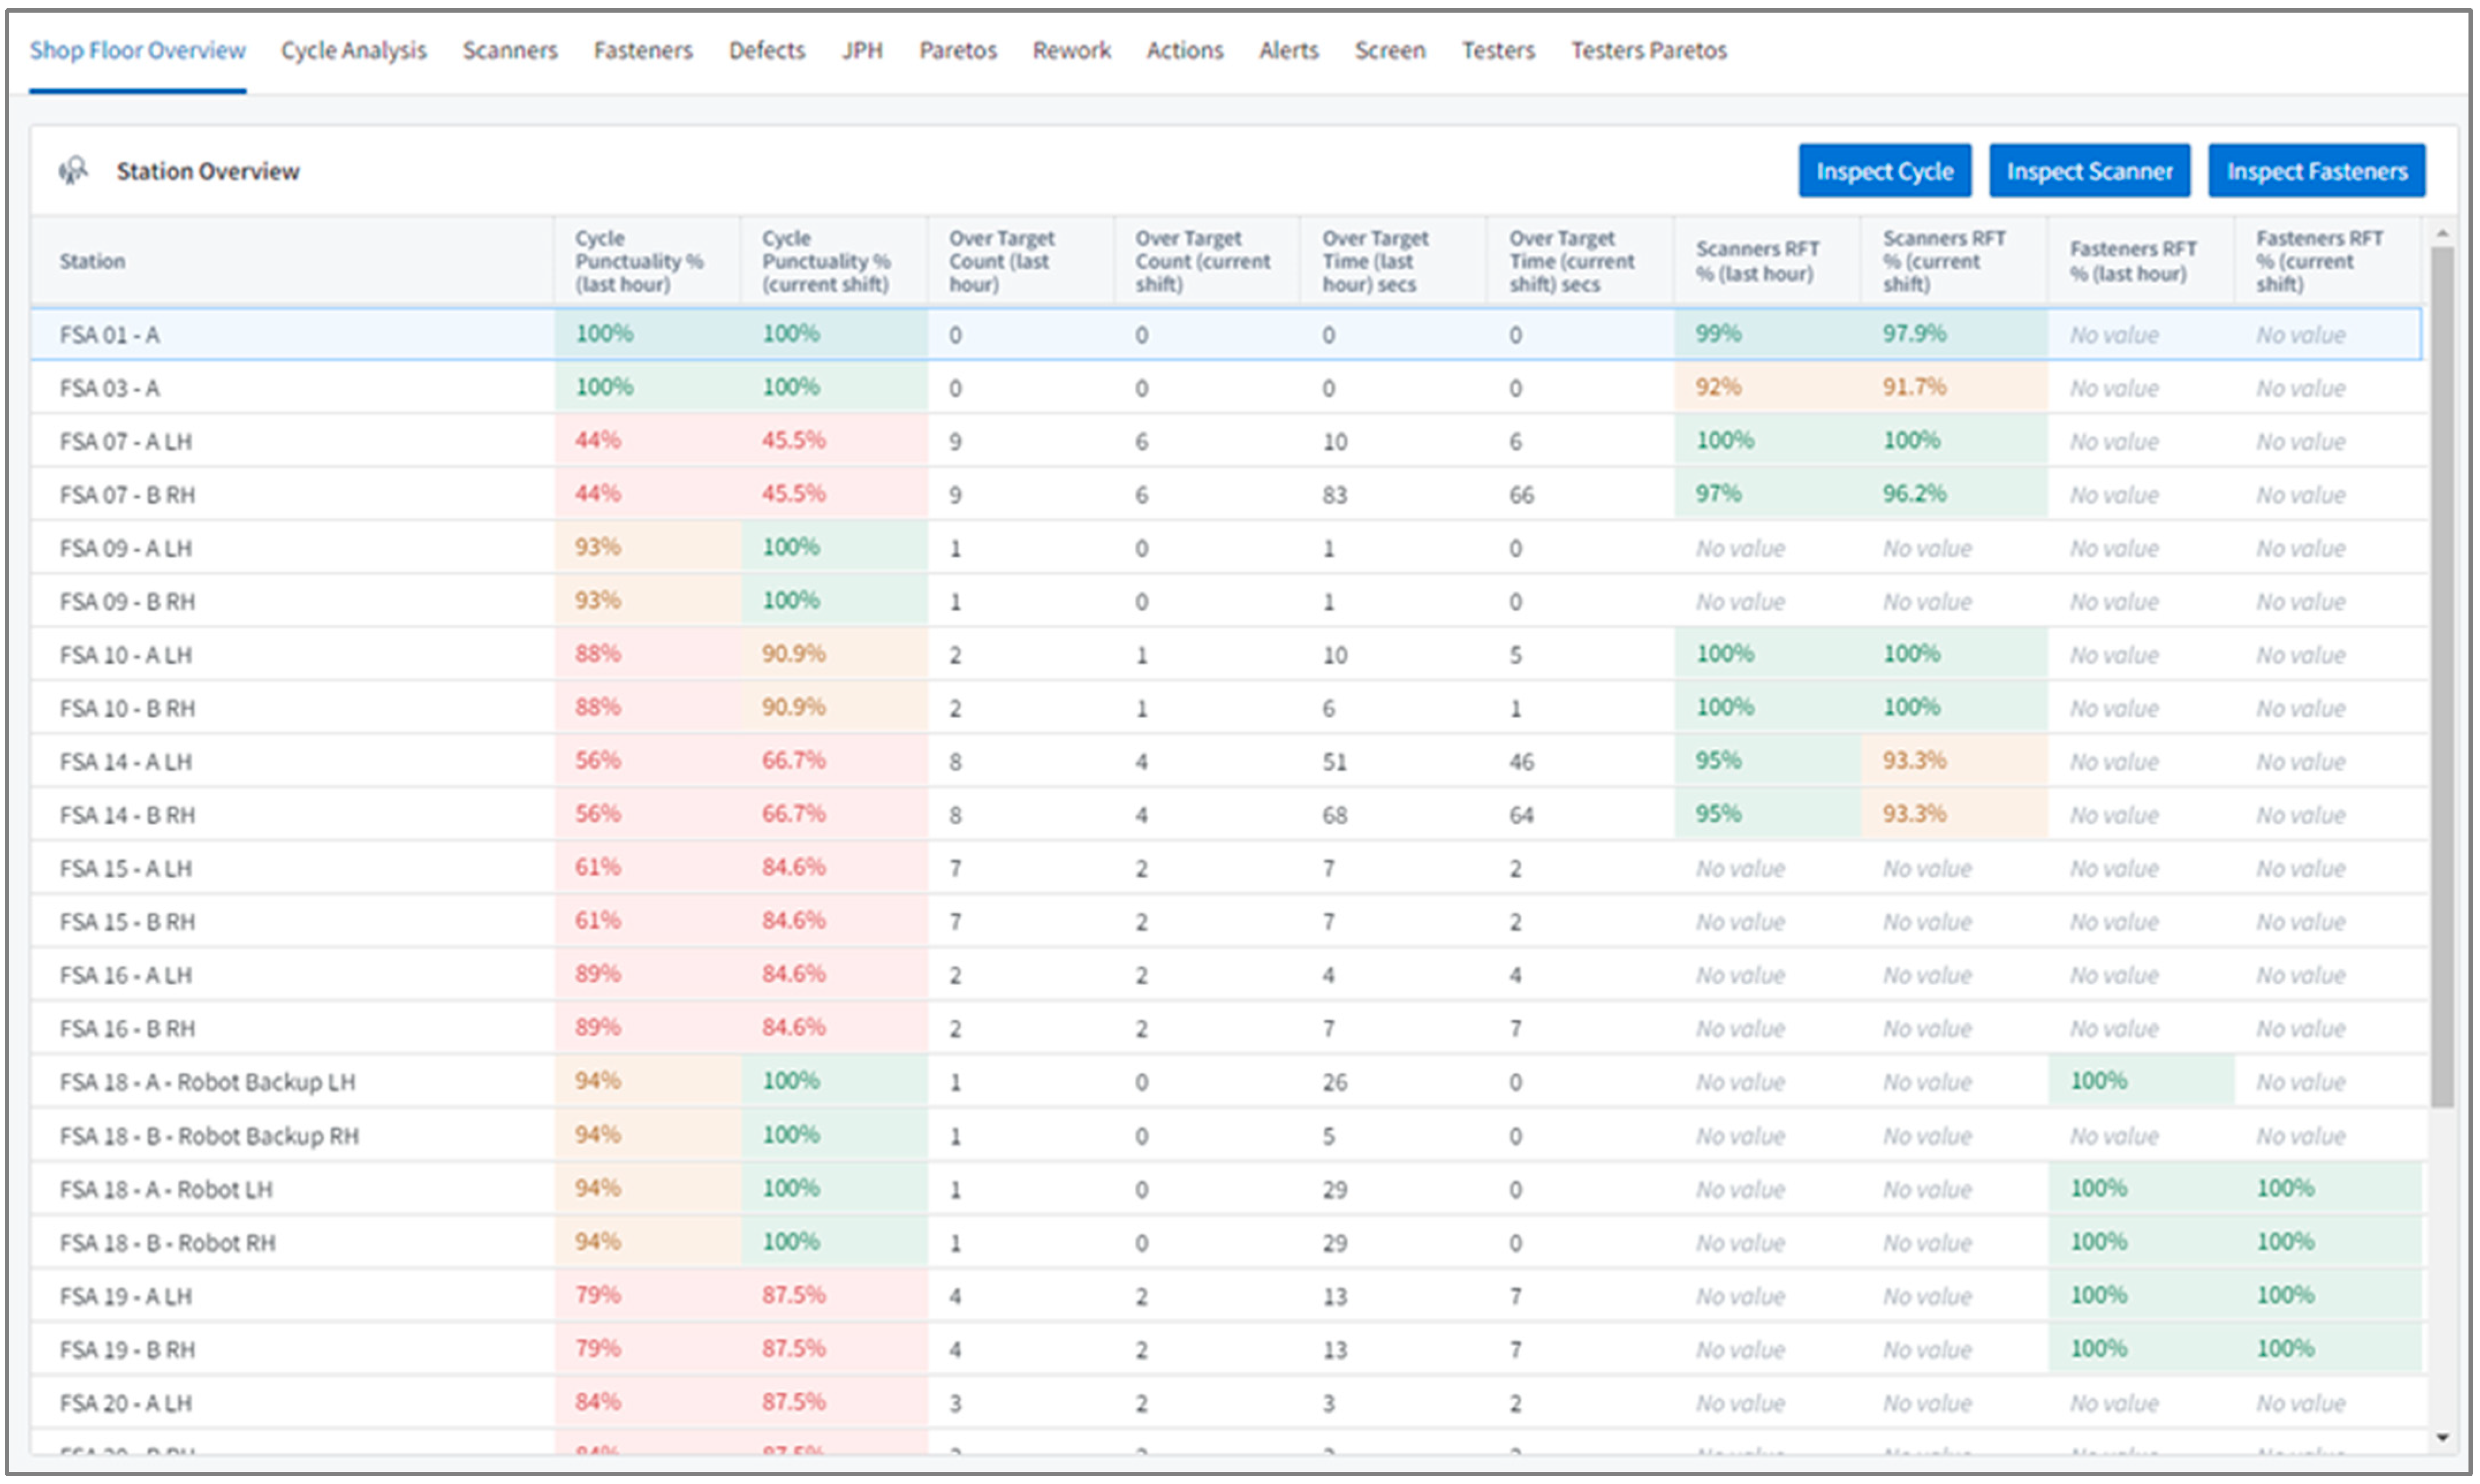
2.2.1. Workshop Application
- Production line and station information;
- Process start and stop triggers—timestamps marking the start and end of a process, which define cycle duration;
- Logs showing which station a manual worker is logged into (active stations);
- Scanner information with statistics (e.g., mismatch, bad scan);
- Fastener information with statistics (e.g., fastening results, tool statuses);
- Defects logged at the station (e.g., defect location, defect quantity);
- Rework information and rework duration;
- Jobs per hour as an output of the production line.
- Non-stop usage is not only intended for line or zone leaders but also for other plant users. The application can be run continuously on production screens, providing a general overview so that all users can directly see the health status of the line. The same screens can be displayed in offices to provide essential information and station performance at a glance.
- Hourly usage is primarily for line or zone leaders, allowing them to quickly identify underperforming stations during the shift. This includes monitoring scanners, fasteners, testers, defects, reworks and other analyses provided by the application. Engineers can also use hourly statistics to assess the impact of changes or modifications on the line and track progress.
- Daily statistics are ideal for reporting at Gemba meetings, where results from the previous day can be discussed and shared.
- Time studies (e.g., Maynard Operation Sequence Technique studies—MOST studies);
- Shift calendars, including definitions of breaks, team assignments and production date information;
- Information about production targets and limits (for system notifications);
- Specifications for system mapping (e.g., mapping station names in the MES to manual data);
- Images of defect zones (for scrap and rework monitoring).
- Palette in Place—PIP signal;
- Scanning—scanning of the barcode on the label;
- End of fastening operation;
- Manual start or stop trigger—touching the screen or pressing the button.
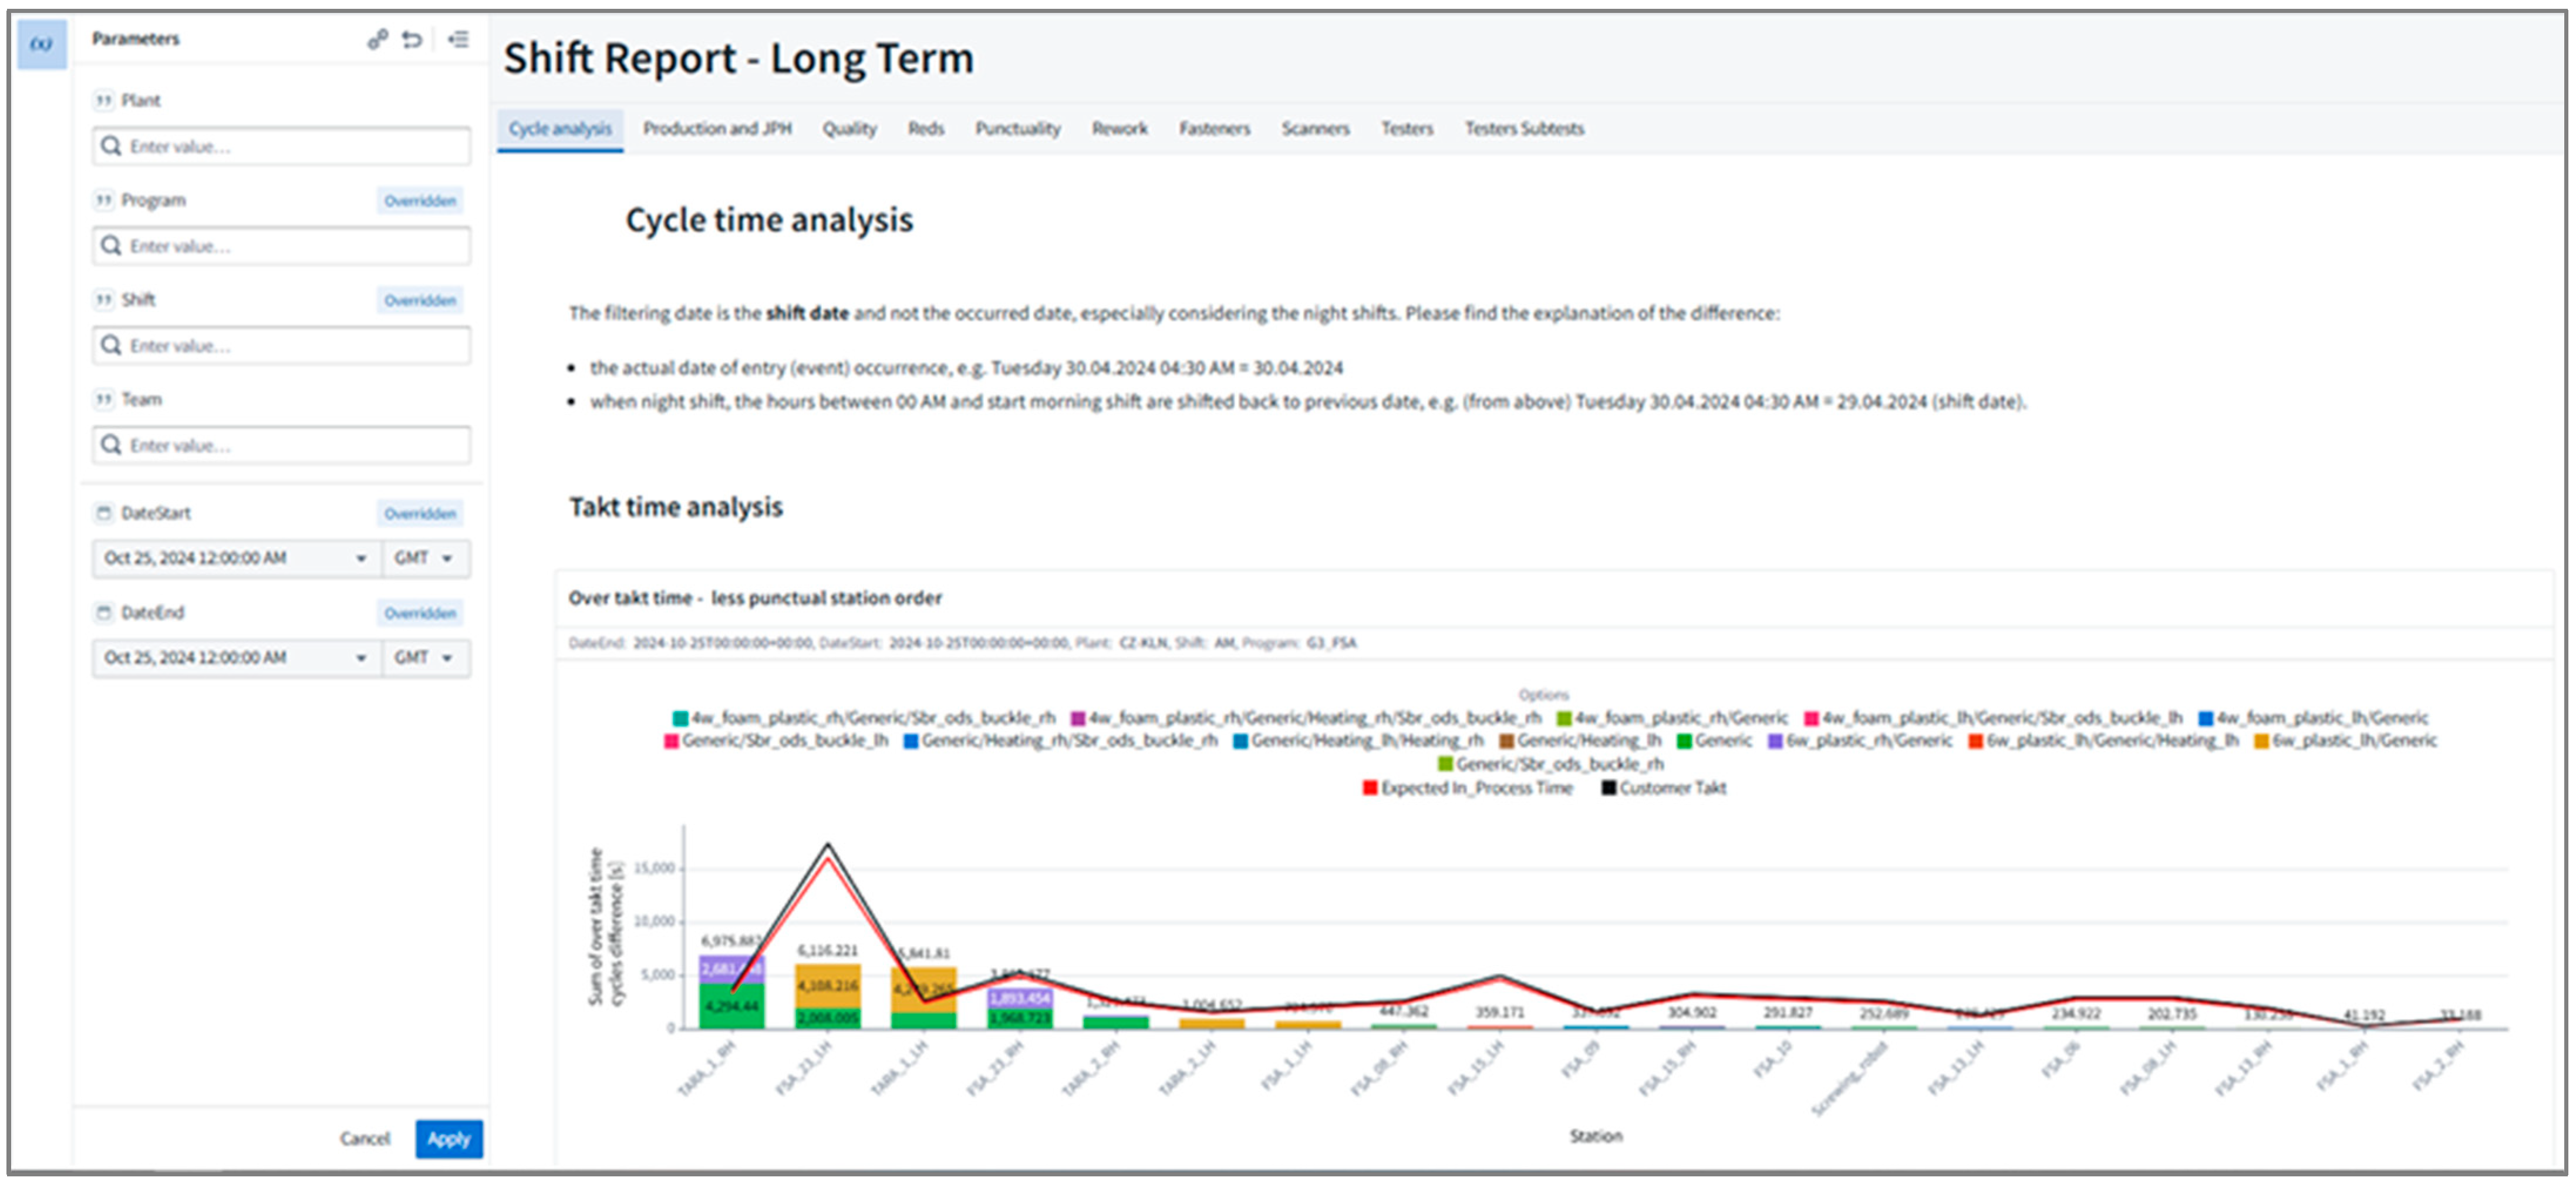
2.2.2. Shift Report
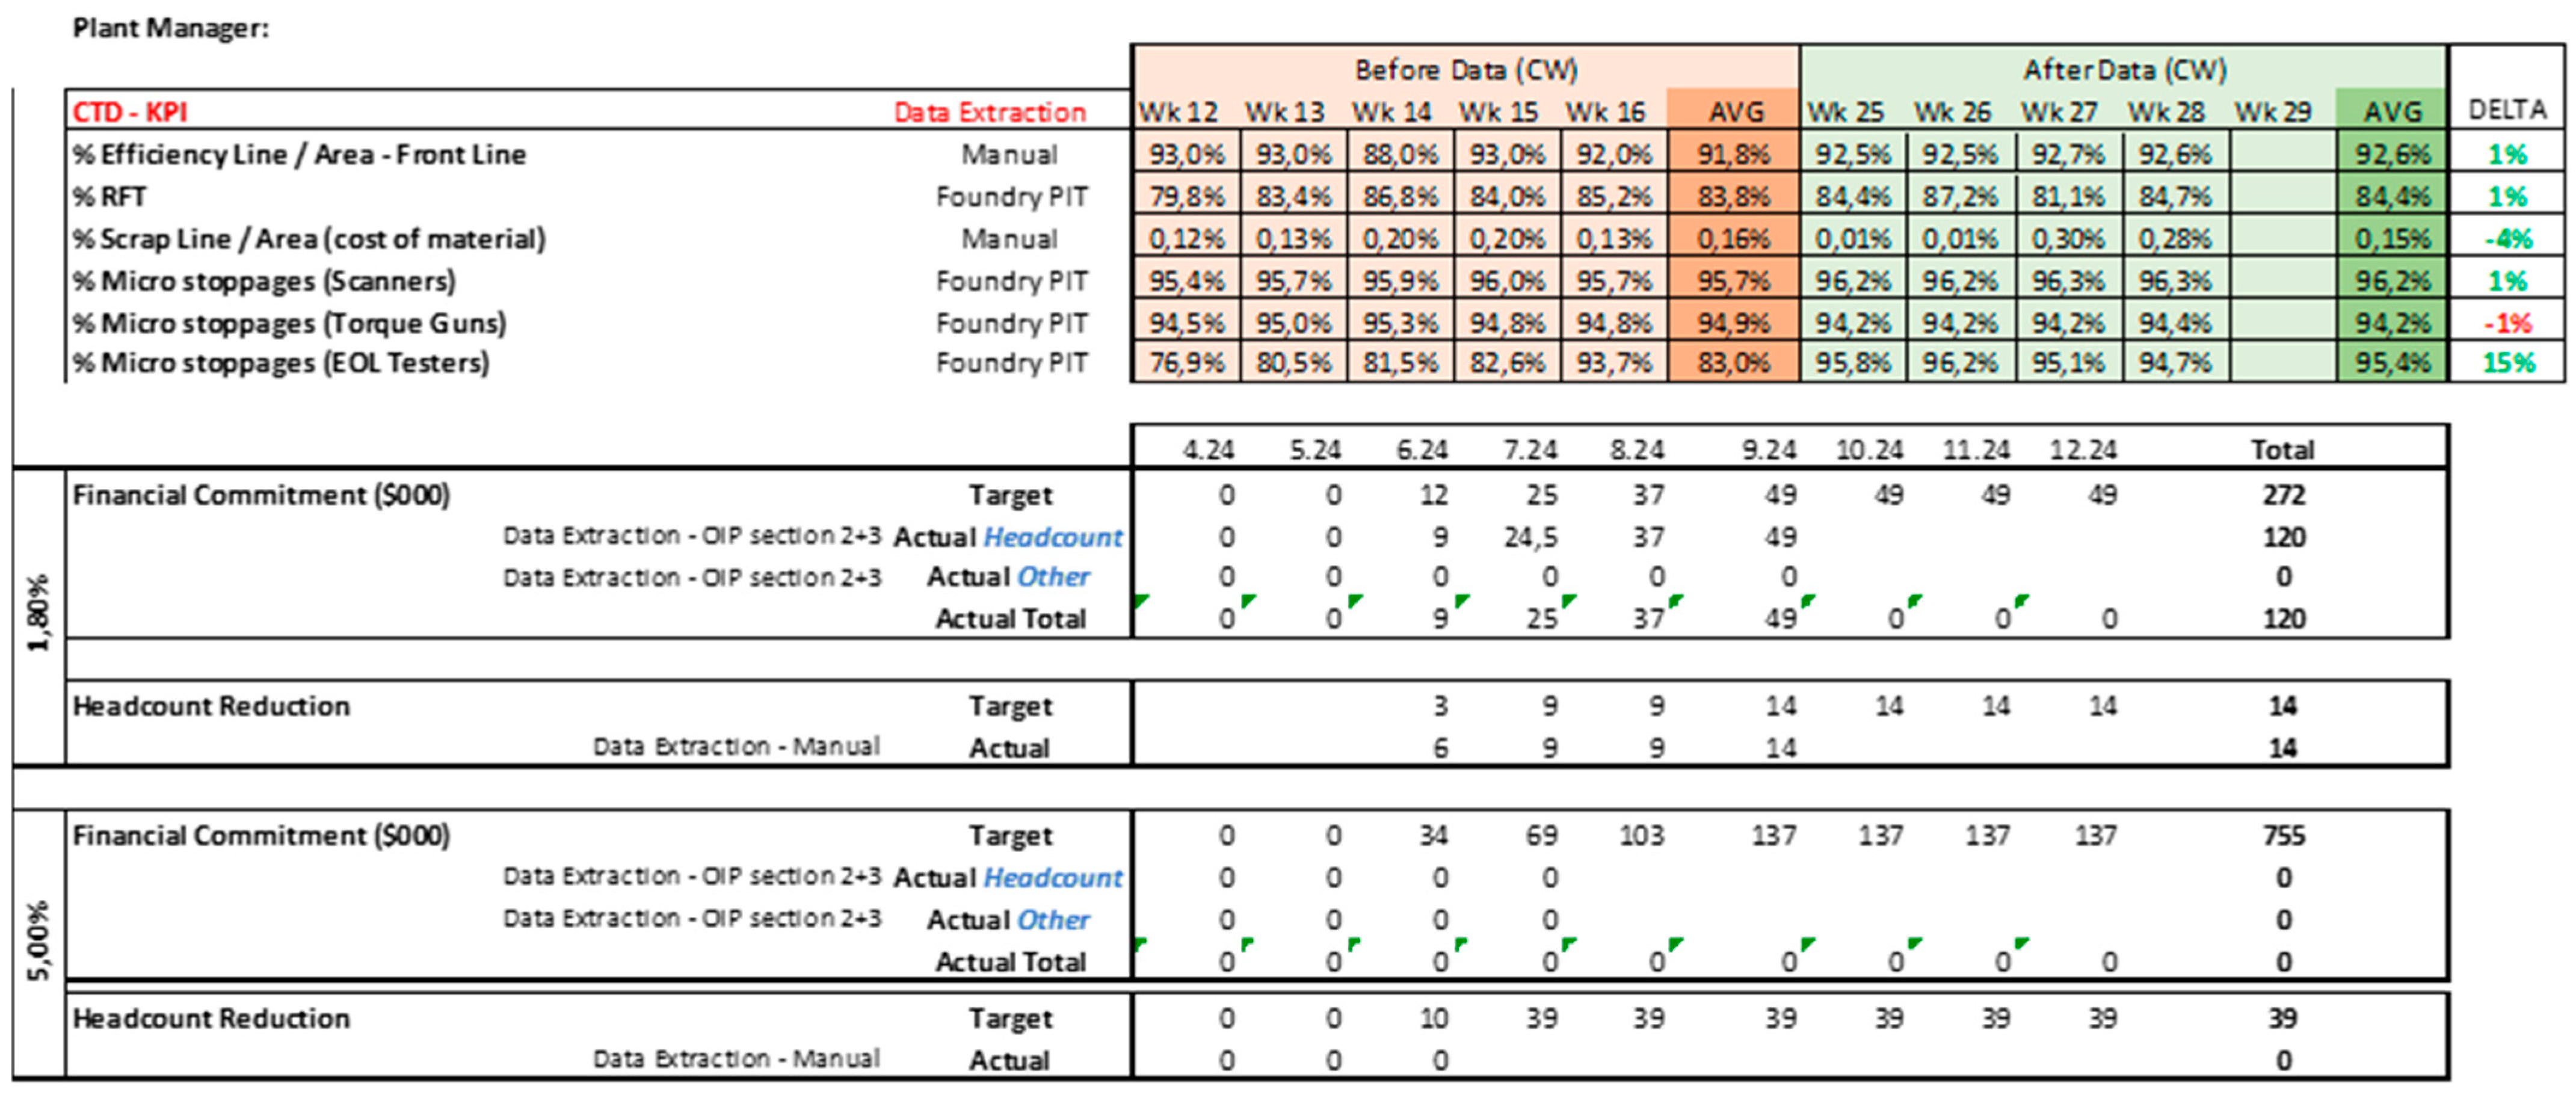
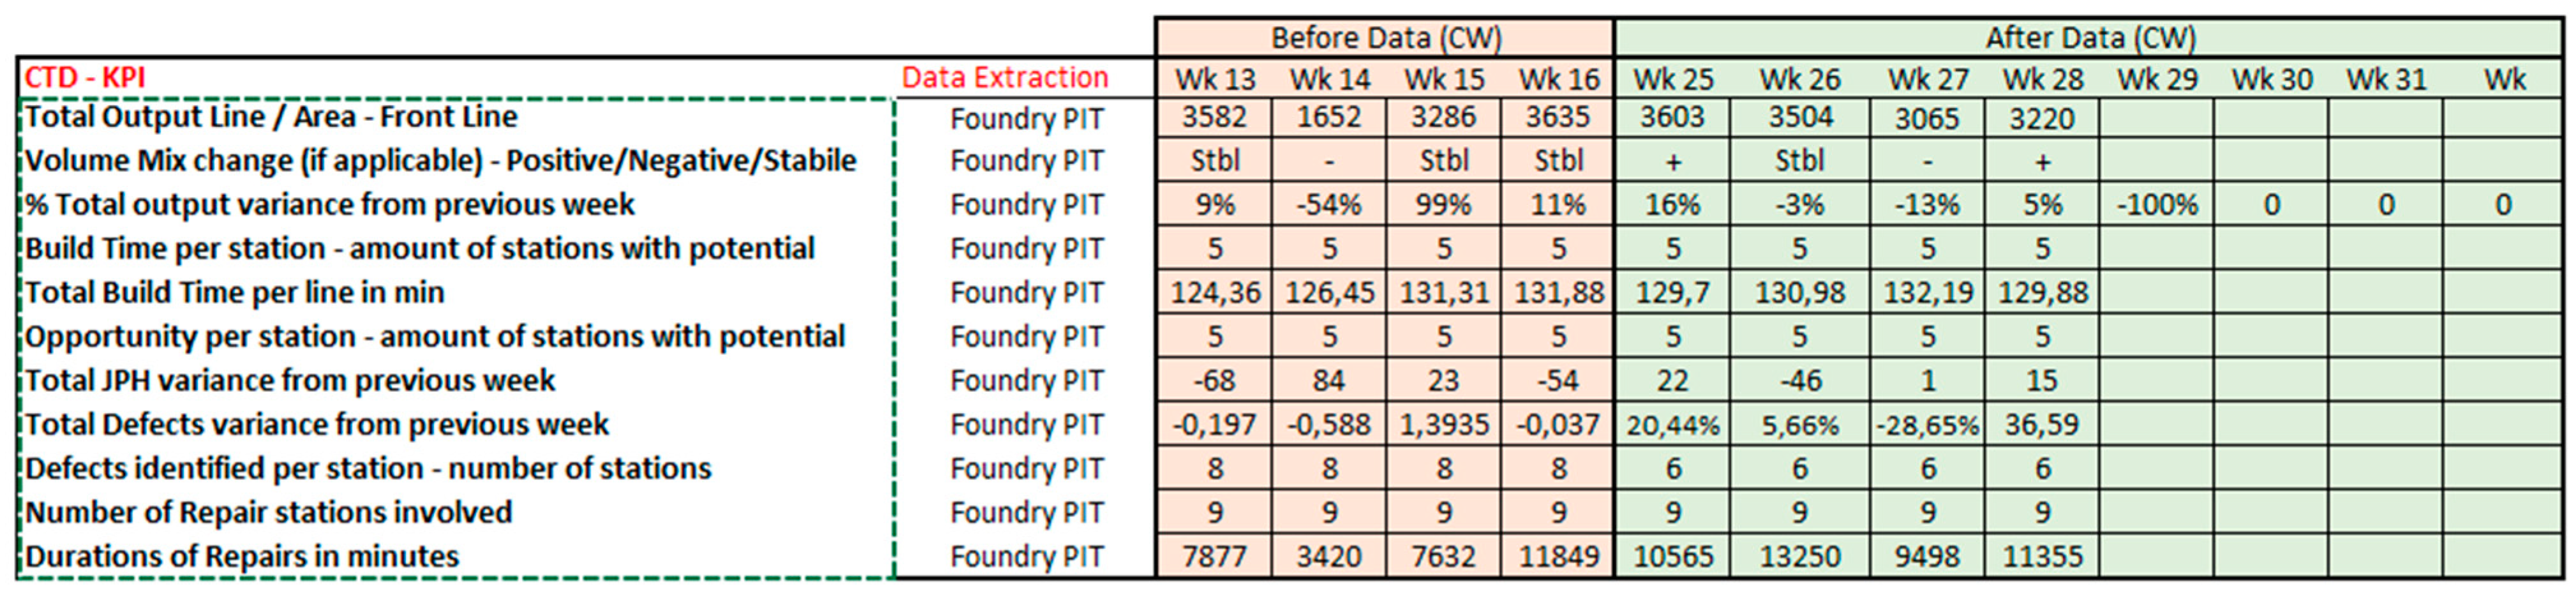
2.2.3. Plant Improvement Tracker
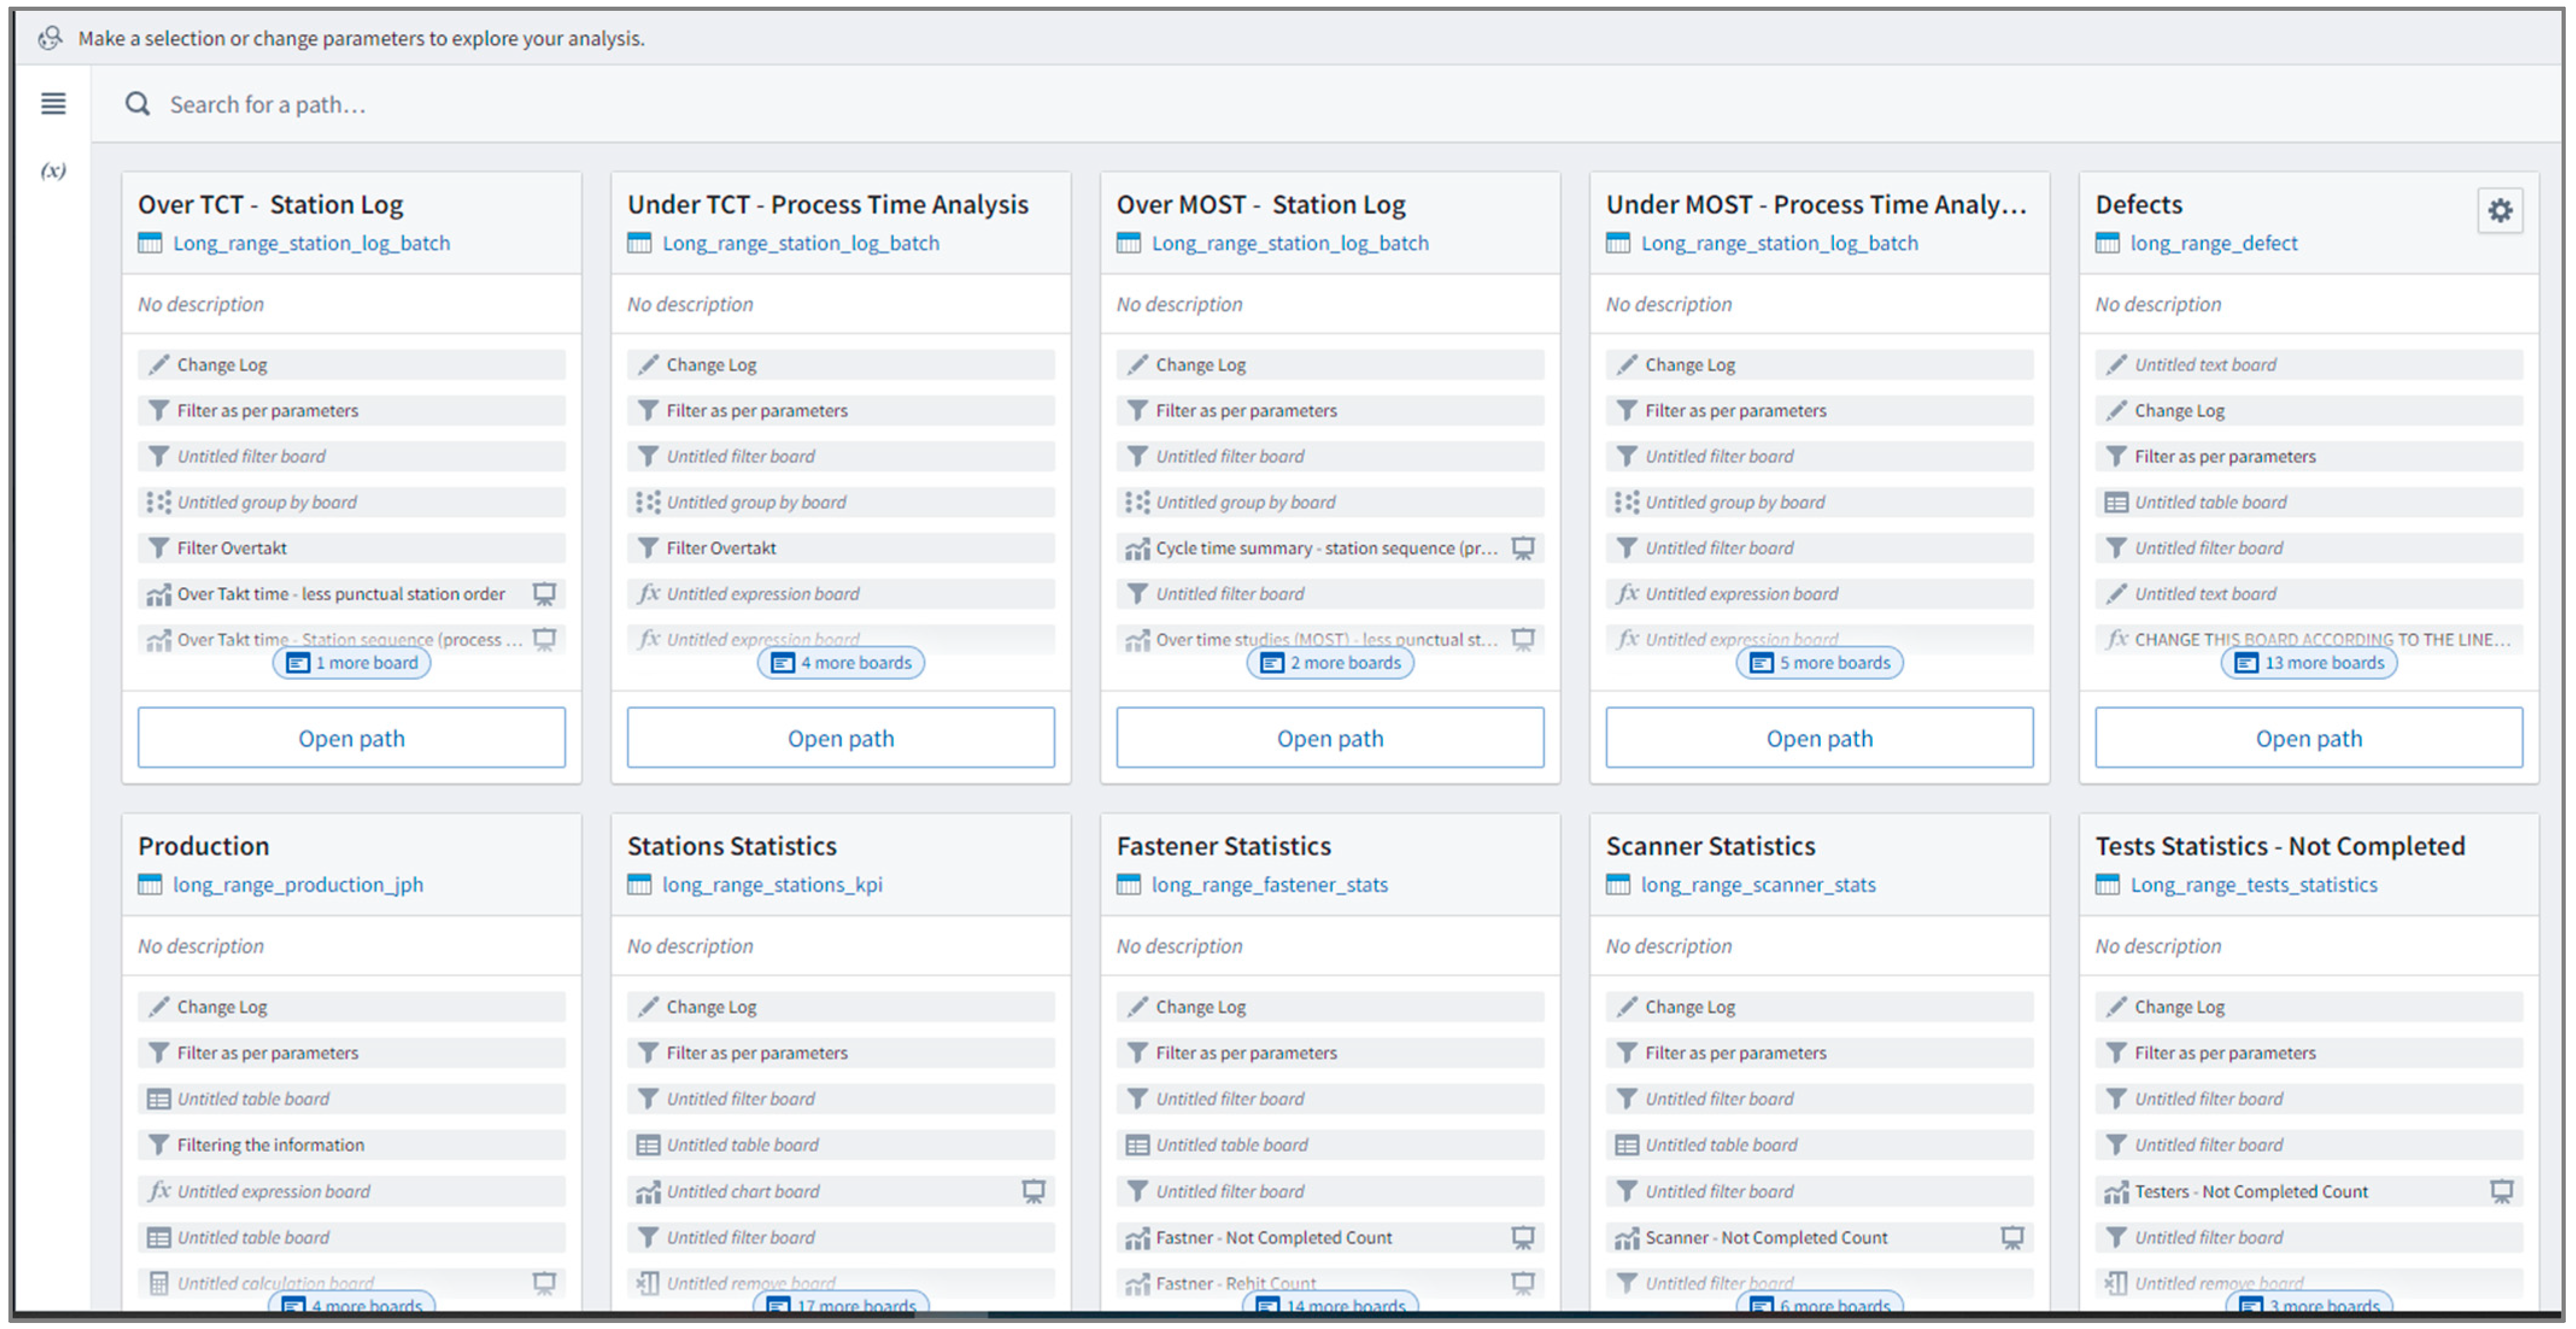
2.2.4. Data Processing and Users Groups
3. Results
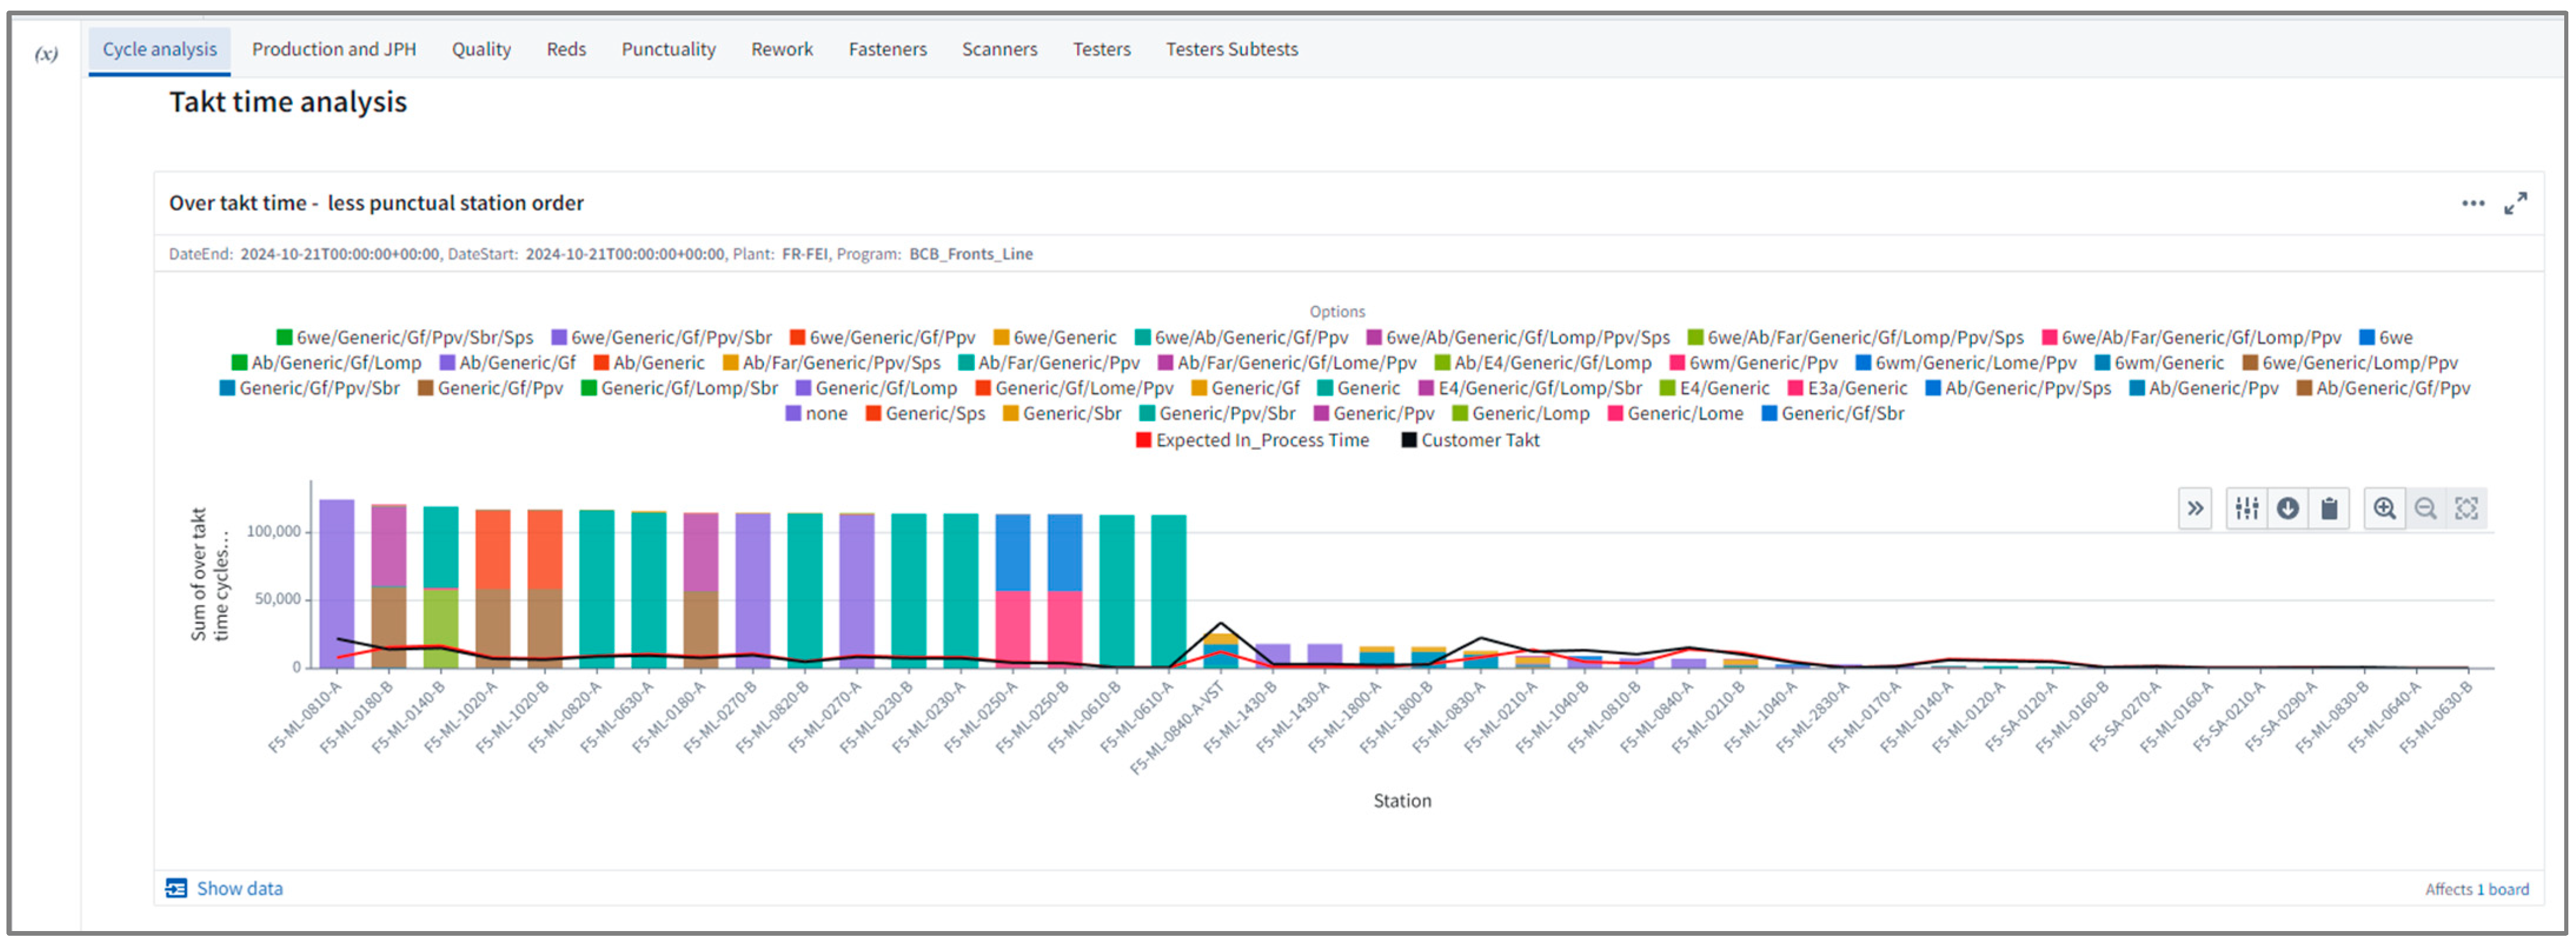
3.1. Workshop Application
3.2. Shift Report
3.3. Plant Improvement Tracker Usage and Example
4. Discussion
5. Conclusions
Author Contributions
Funding
Data Availability Statement
Acknowledgments
Conflicts of Interest
References
- Bartel, A.; Ichniowski, C.; Shaw, K. How does information technology affect productivity? Plant-level comparisons of product innovation, process improvement, and worker skills. Q. J. Econ. 2007, 122, 1721–1758. [Google Scholar] [CrossRef]
- Sarbu, M. The impact of industry 4.0 on innovation performance: Insights from German manufacturing and service firms. Technovation 2021, 113, 102415. [Google Scholar] [CrossRef]
- Denicolai, S.; Zucchella, A.; Magnani, G. Internationalization, digitalization, and sustainability: Are SMEs ready? A survey on synergies and substituting effects among growth paths. Technol. Forecast. Soc. Chang. 2021, 166, 120650. [Google Scholar] [CrossRef]
- Ashouri, S.; Hajikhani, A.; Suominen, A.; Pukelish, L. Measuring digitalization at scale using web scraped data. Technol. Forecast. Soc. Chang. 2024, 207, 123618. [Google Scholar] [CrossRef]
- Rossi, A.H.G.; Marcondes, G.B.; Pontes, J.; Leitão, P.; Treinta, F.T.; De Resende, L.M.M.; Mosconi, E.; Yoshino, R.T. Lean Tools in the Context of Industry 4.0: Literature Review, Implementation and Trends. Sustainability 2022, 14, 12295. [Google Scholar] [CrossRef]
- Folgado, F.J.; Calderón, D.; González, I.; Calderón, A.J. Review of Industry 4.0 from the Perspective of Automation and Supervision Systems: Definitions, Architectures and Recent Trends. Electronics 2024, 13, 782. [Google Scholar] [CrossRef]
- Gobble, M.M. Digitalization, digitization, and innovation. Res. Technol. Manag. 2018, 61, 56–59. [Google Scholar] [CrossRef]
- Buer, S.V.; Strandhagen, J.W.; Semini, M.; Strandhagen, J.O. The Digitalization of Manufacturing: Investigating the Impact of Production Environment and Company Size. J. Manuf. Technol. Manag. 2021, 32, 621–645. [Google Scholar] [CrossRef]
- Gao, D.; Yan, Z.; Zhou, X.; Mo, X. Smarter and Prosperous: Digital Transformation and, Enterprise Performance. Systems 2023, 11, 329. [Google Scholar] [CrossRef]
- Radicic, D.; Petković, S. Impact of Digitalization on Technological Innovations in Small and Medium-Sized Enterprises (SMEs). Technol. Forecast. Soc. Chang. 2023, 191, 122474. [Google Scholar] [CrossRef]
- Maroufkhani, P.; Ismail, W.K.W.; Ghobakhloo, M. Big data analytics and firm performance: A systematic review. Information 2019, 10, 226. [Google Scholar] [CrossRef]
- Storey, V.C.; Woo, C. Data challenges in the digitalization era. In Proceedings of the 28th Workshop on Information Technologies and Systems, Santa Clara, CA, USA, 16–18 December 2018. [Google Scholar]
- Shi, P.; Cui, Y.; Xu, K.; Zhang, M.; Ding, L. Data Consistency Theory and Case Study for Scientific Big Data. Information 2019, 10, 137. [Google Scholar] [CrossRef]
- Gillon, K.; Brynjolfsson, E.; Mithas, S.; Grin, J.; Gupta, M. Business analytics: Radical shift or incremental change? Commun. Assoc. Inf. Syst. 2014, 34, 287–296. [Google Scholar] [CrossRef]
- Krajný, P.; Janeková, J. Data Digitalization in an Industrial Enterprise. In Proceedings of the 21th International Scientific Postgraduate Conference for Faculties of Mechanical Engineering of Technical Universities and Colleges Novus Scientia 2024, Košice, Slovakia, 25 January 2024. [Google Scholar]
- Tabim, V.M.; Ayala, N.F.; Marodin, G.A.; Benitez, G.B.; Frank, A.G. Implementing Manufacturing Execution Systems (MES) for Industry 4.0: Overcoming buyer-provider information asymmetries through knowledge sharing dynamics. Comput. Ind. Eng. 2024, 196, 110483. [Google Scholar] [CrossRef]
- Benitez, G.B.; Ghezzi, A.; Frank, A.G. When technologies become Industry 4.0 platforms: Defining the role of digital technologies through a boundary-spanning perspective. Int. J. Prod. Econ. 2023, 260, 108858. [Google Scholar] [CrossRef]
- Ashrafi, A.; Zare Ravasan, A. How market orientation contributes to innovation and market performance: The roles of business analytics and flexible IT infrastructure. J. Bus. Ind. Mark. 2018, 33, 970–983. [Google Scholar] [CrossRef]
- Papadopoulos, T.; Singh, S.P.; Spanaki, K.; Gunasekaran, A.; Dubey, R. Towards the next generation of Manufacturing: Implications of Big Data and Digitalization in the context of Industry 4.0. Prod. Plan. Con. 2021, 33, 101–104. [Google Scholar] [CrossRef]
- Ji-fan Ren, S.; Wamba, S.F.; Akter, S.; Dubey, R.; Childe, S.J. Modelling quality dynamics, business value and firm performance in a big data analytics environment. Int. J. Prod. Res. 2016, 55, 5011–5026. [Google Scholar] [CrossRef]
- de Oliveira, N.J.; Bruno, L.F.C.; Santiago, S.B.; de Oliveira, M.C.; de Lima, O.P. The Impact of digitalization on the plastic injection production process. Rev. De Ges. E Sec.-Ges. 2023, 14, 332–346. [Google Scholar] [CrossRef]
- Schroeck, M.; Shockley, R.; Smart, J.; Romero-Morales, D.; Tufano, P. Analytics: The real-world use of big data. IBM Glob. Bus. Serv. 2012, 12, 1–20. [Google Scholar]
- Mikalef, P.; Pappas, I.O.; Krogstie, J.; Giannakos, M. Big data analytics capabilities: A systematic literature review and research agenda. Inf. Syst. E Bus. Manag. 2018, 16, 547–578. [Google Scholar] [CrossRef]
- Rialti, R.; Marzi, G.; Ciappei, C.; Busso, D. Big data and dynamic capabilities: A bibliometric analysis and systematic literature review. Manag. Decis. 2018, 57, 2052–2068. [Google Scholar] [CrossRef]
- Ardito, L.; Scuotto, V.; Del Giudice, M.; Petruzzelli, A.M. A bibliometric analysis of research on Big Data analytics for business and management. Manag. Decis. 2019, 57, 1993–2009. [Google Scholar] [CrossRef]
- Wamba, S.F.; Mishra, D. Big data integration with business processes: A literature review. Bus. Process Manag. J. 2017, 23, 477–492. [Google Scholar] [CrossRef]
- Chen, H.Q.; Xin, H.W.; Teng, G.H.; Meng, C.Y.; Du, X.D.; Mao, T.T. Cloud-based data management system for automatic real-time data acquisition from large-scale laying-hen farms. Int. J. Agric. Biolog. Eng. 2016, 9, 106–115. [Google Scholar] [CrossRef]
- Gittler, T.; Plümke, L.; Silani, F.; Moro, P.; Weiss, L.; Wegener, K. People, Process, Master Data, Technology: Data-Centric Engineering of Manufacturing Management Systems. In Proceedings of the 8th International Conference on Competitive Manufacturing, Stellenbosch, South Africa, 9–10 March 2022; pp. 447–462. [Google Scholar] [CrossRef]
- Adrita, M.M.; Brem, A.; O’Sullivan, D.; Allen, E.; Bruton, K. Methodology for Data-Informed Process Improvement to Enable Automated Manufacturing in Current Manual Processes. Appl. Sci. 2021, 11, 3889. [Google Scholar] [CrossRef]
- Locklin, A.; Jazdi, N.; Weyrich, M.; Przybysz-Herz, K.; Libert, R.; Ruppert, T.; Jakab, L. Tailored digitization with real-time locating systems Ultra-wideband RTLS for production and logistics. ATP Mag. 2021, 3, 76–83. [Google Scholar]
- Clancy, R.; O’Sullivan, D.; Bruton, K. Data-driven quality improvement approach to reducing waste in manufacturing. TOM J. 2023, 35, 51–72. [Google Scholar] [CrossRef]
- Pfirrmann, D.; Voit, M.; Eckstein, M. Quality control of a milling process using process data management in the aerospace industry. MM Sci. J. 2019, SI, 3067–3070. [Google Scholar] [CrossRef]
- Li, W.C.; Yang, X.Q.; Yin, X.Q. Digital transformation and labor upgrading. Pac.-Bas. Fin. J. 2024, 83, 102280. [Google Scholar] [CrossRef]
- Beneventano, D.; Vincini, M. Foreword to the Special Issue: Semantics for Big Data Integration. Information 2019, 10, 68. [Google Scholar] [CrossRef]


| Option Code Example | Regular Expression Example | Description | Variant |
|---|---|---|---|
| A1PG041xx5xxxx.RB4MNNN00P10001 | ^.{16}(B4M).+ | ^. starting with 16 random characters then look for “B4M” | Sport |
| A1PG041xx5xxxx.RB4MNNN00P10001 | ^.{25}[1].+ | ^. starting with 25 random characters then look for “1” | Leather |
| Module | Characteristics |
|---|---|
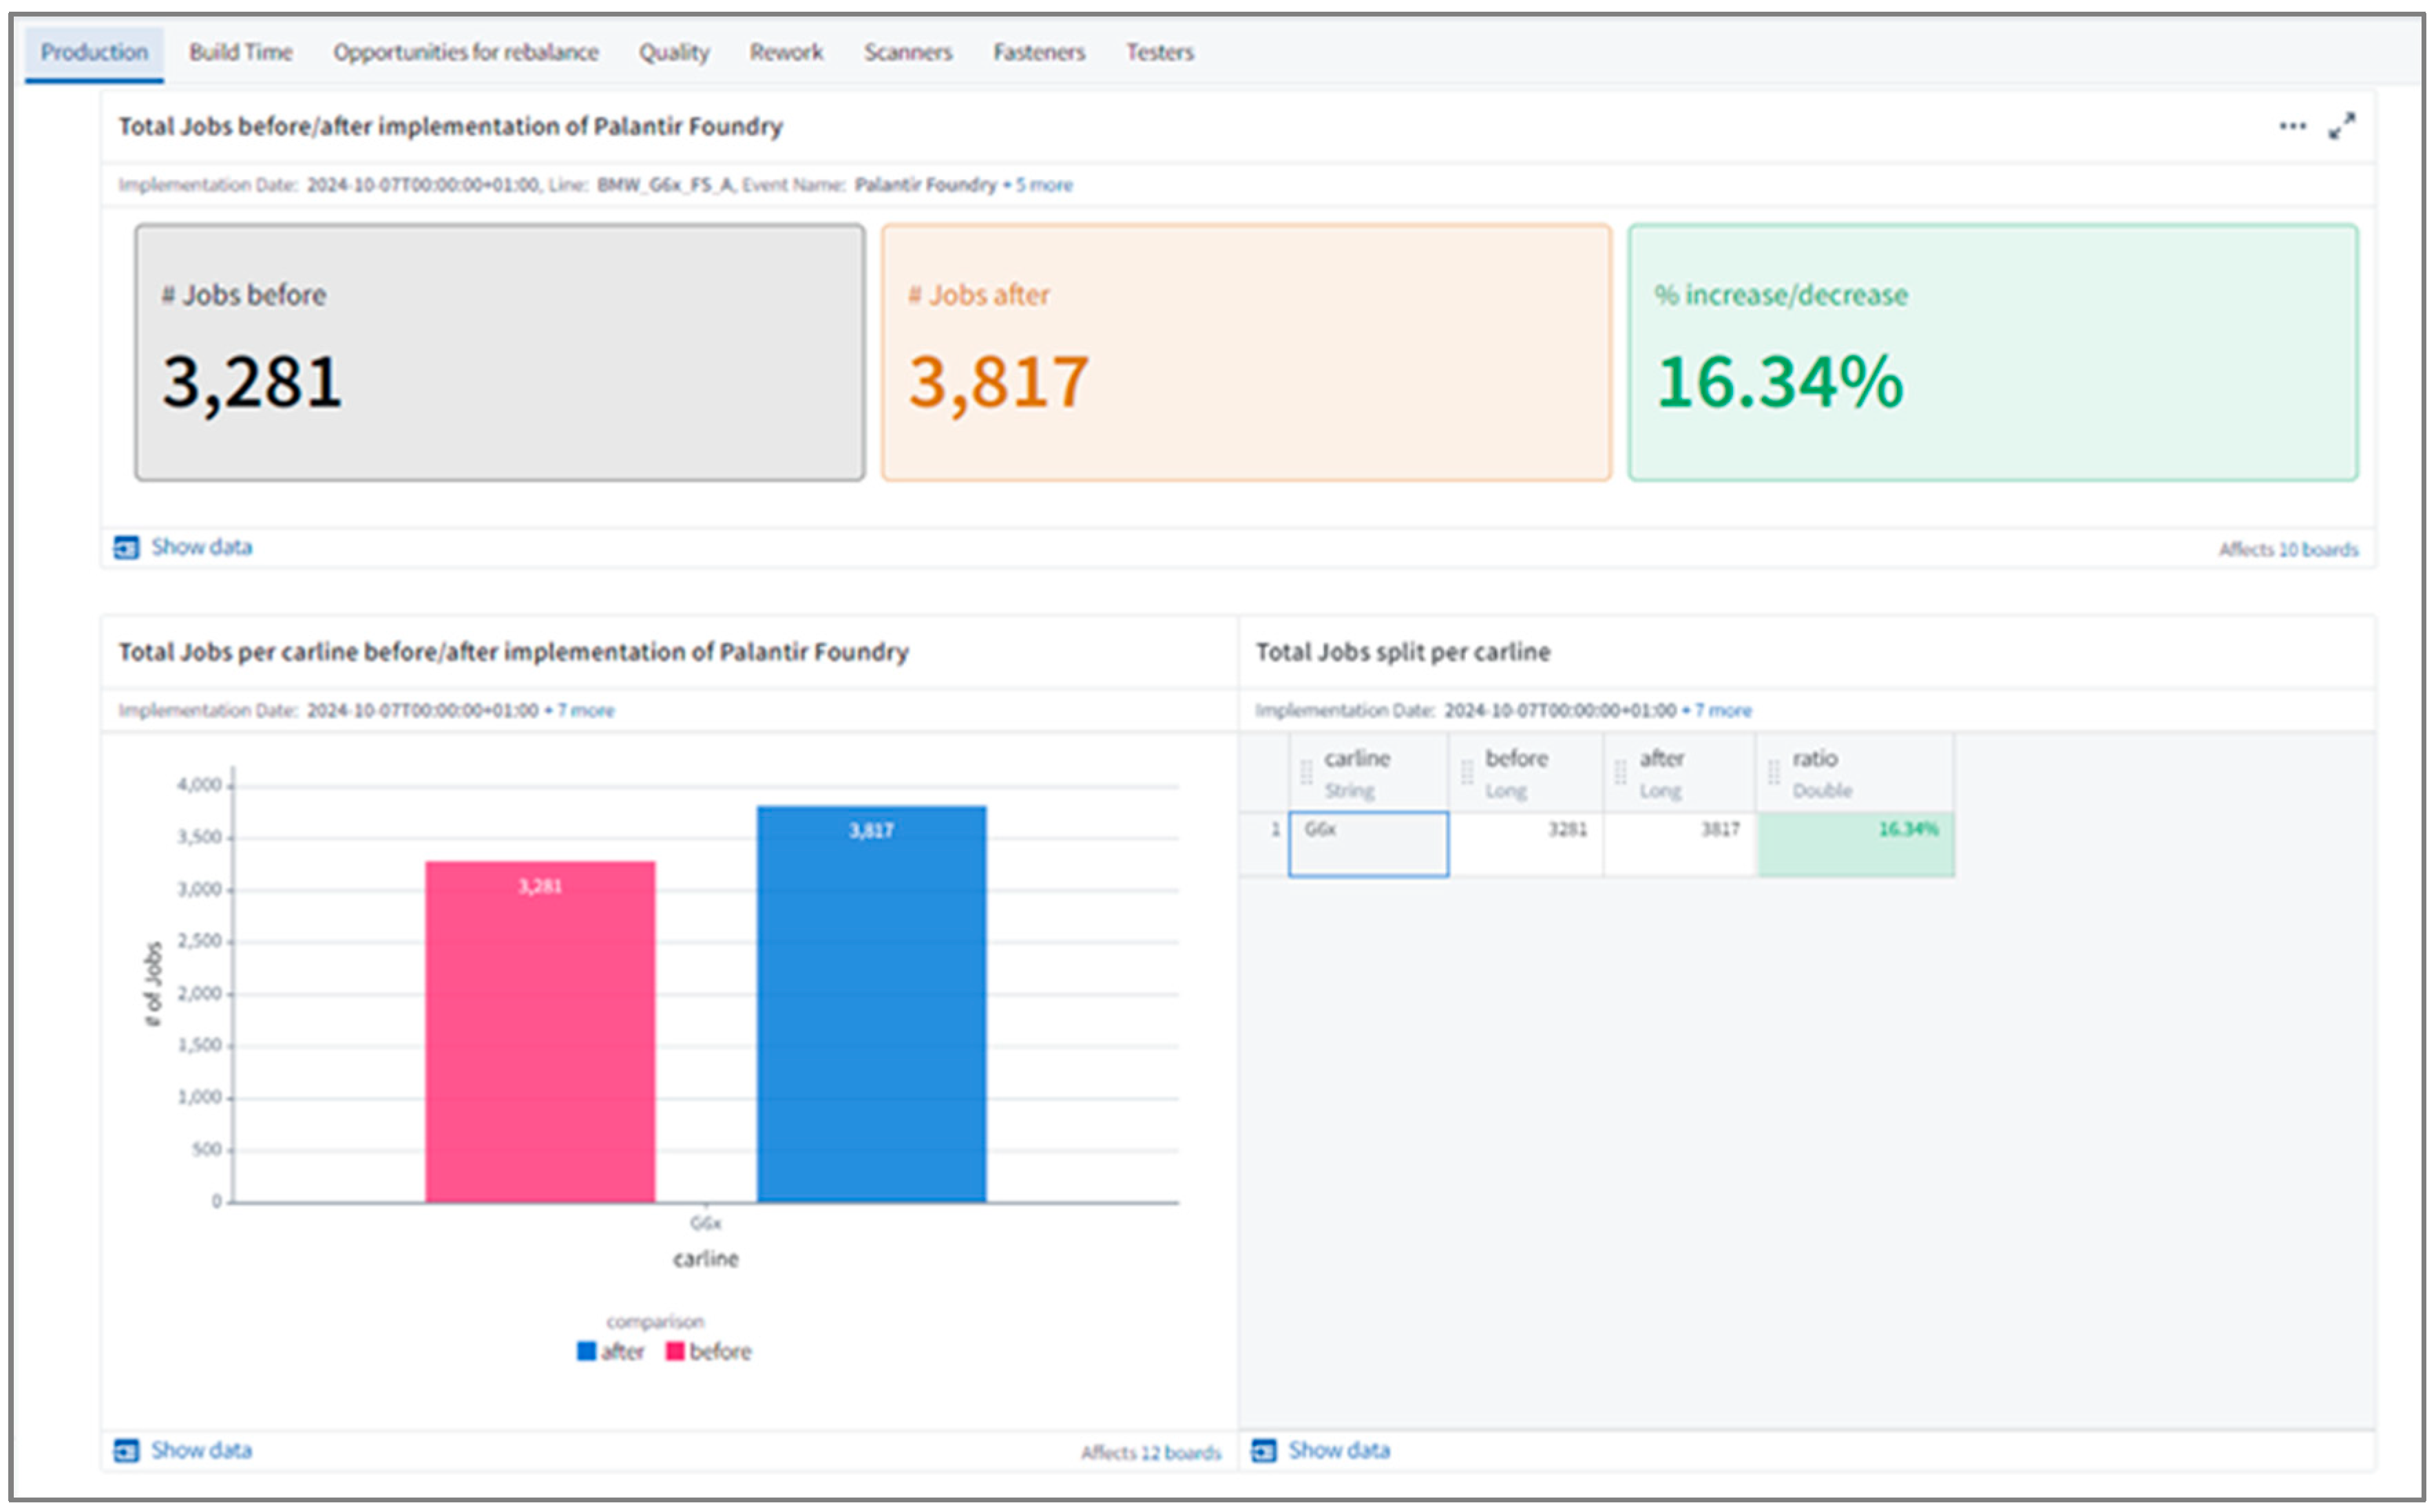
| Production | is focused on job statistics—total output of the station/line and average JHP (Jobs Per Hour) statistics. |
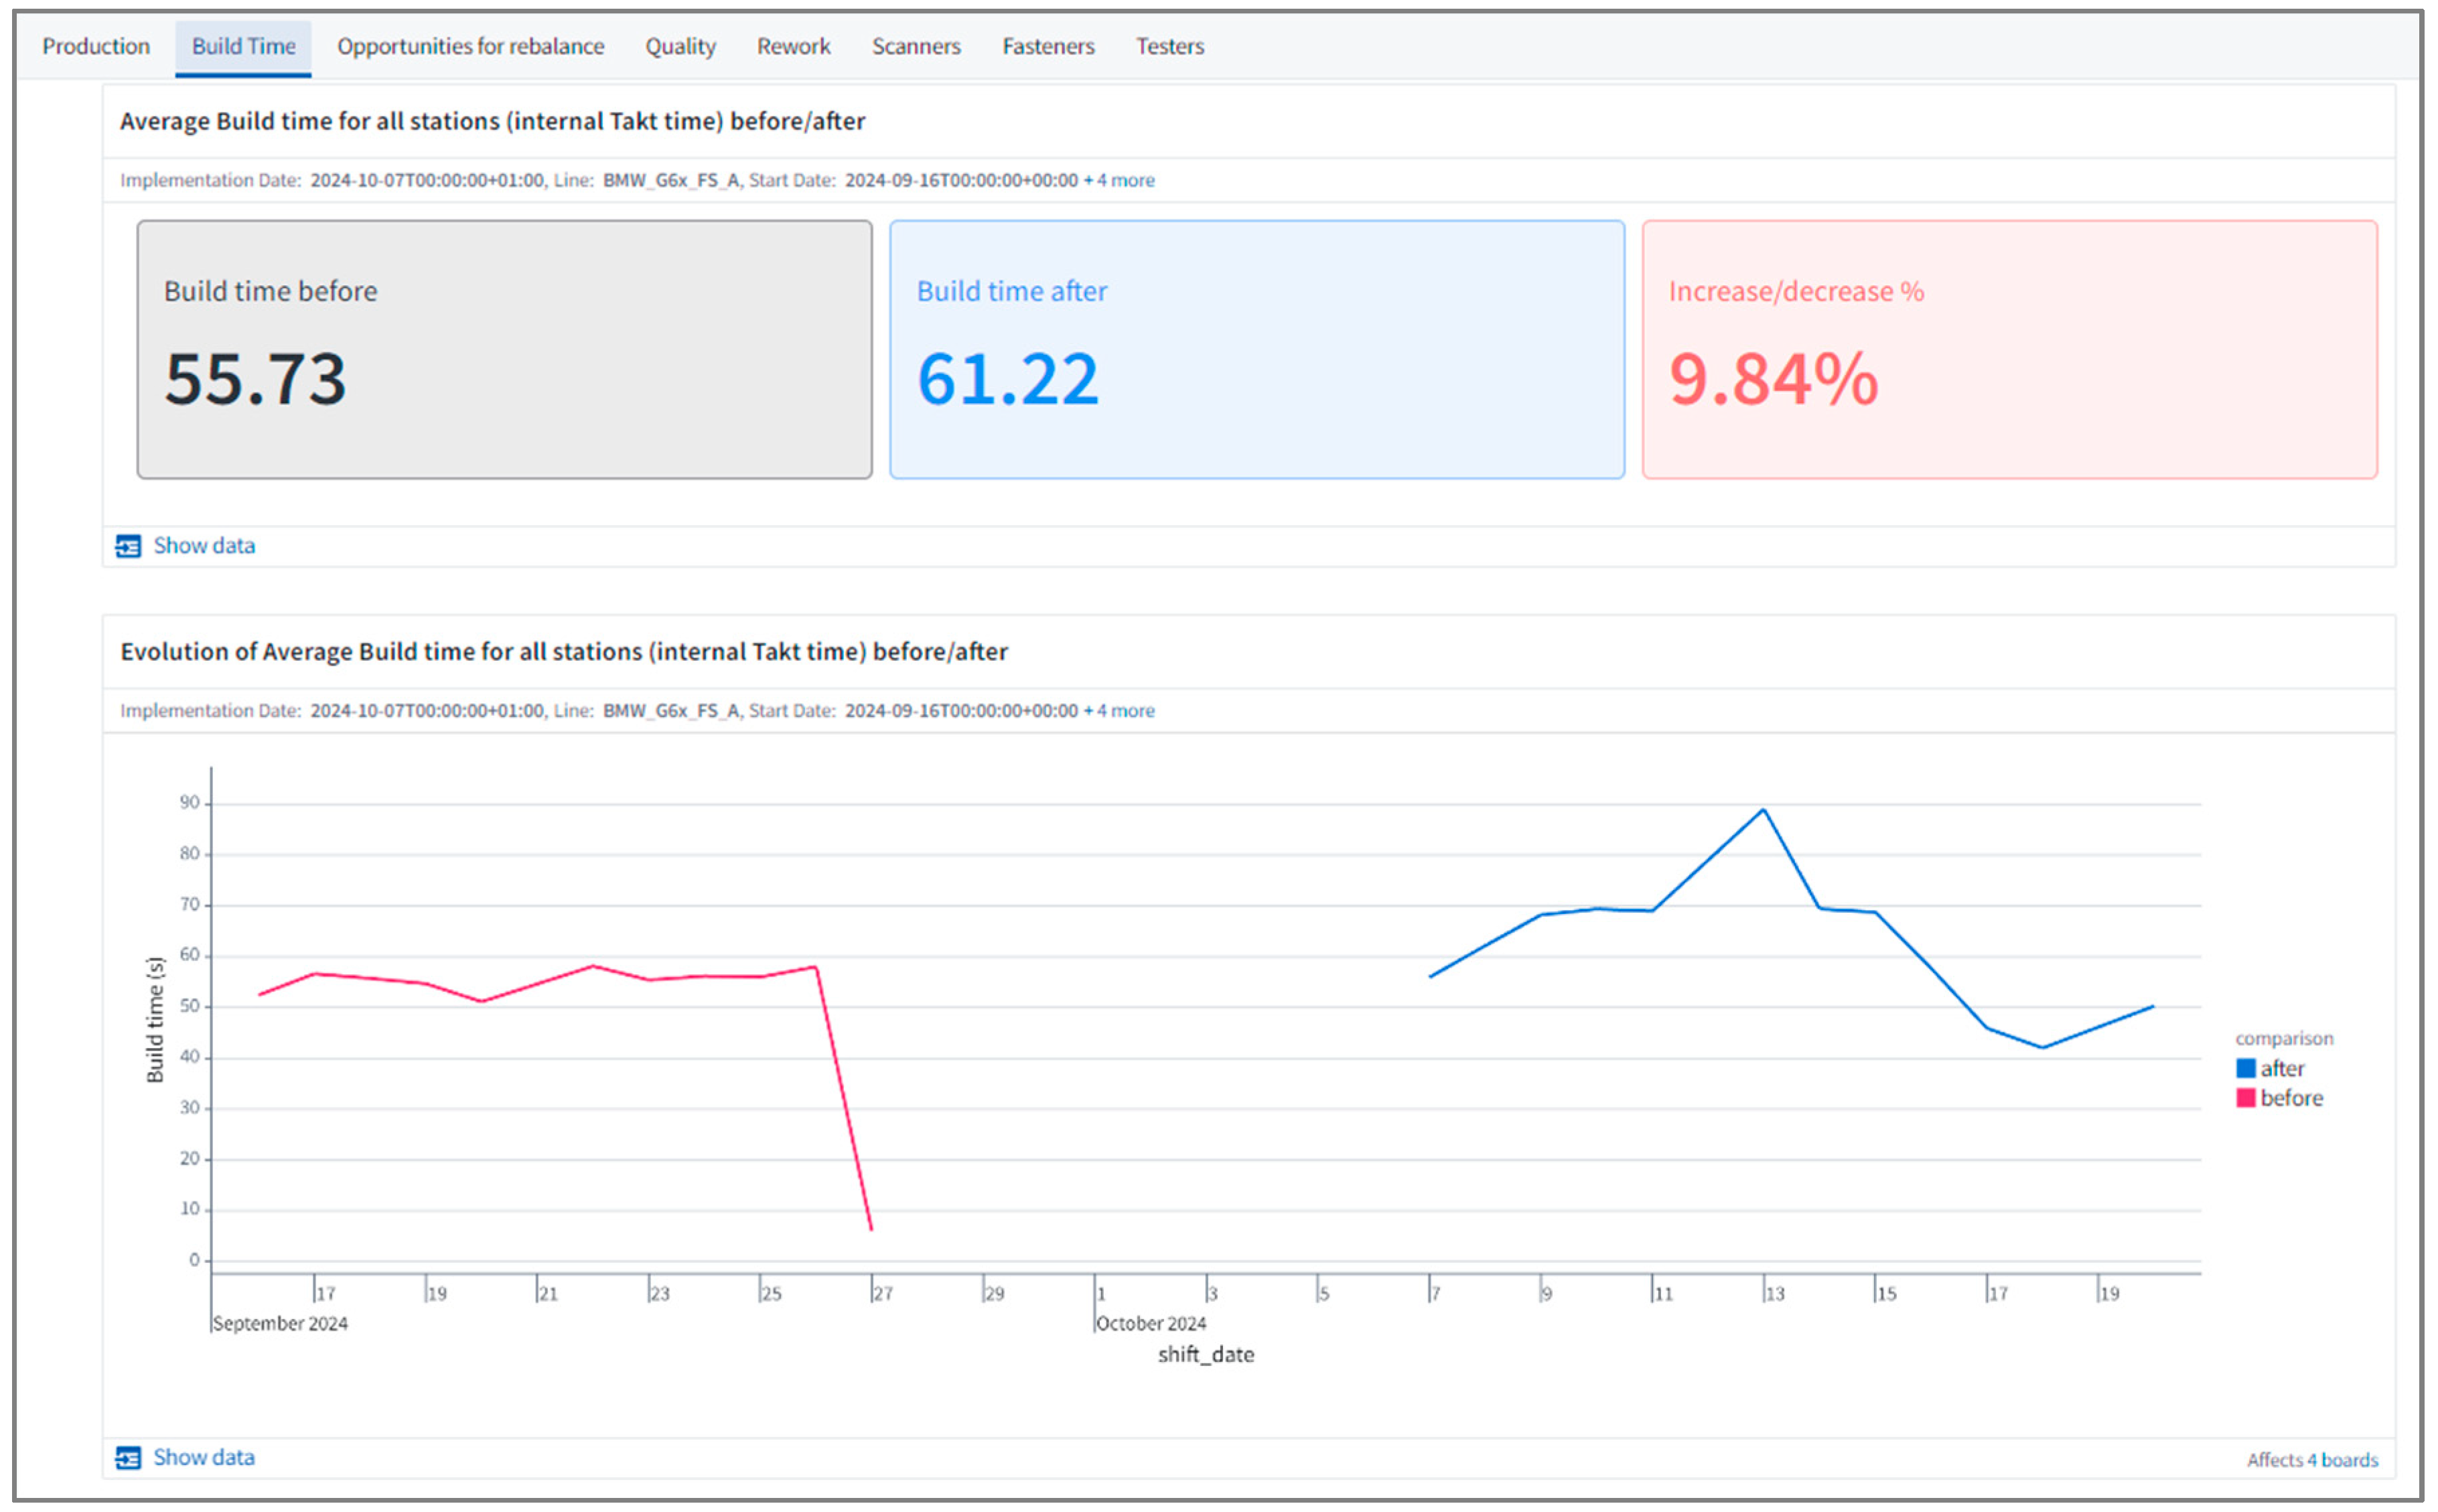
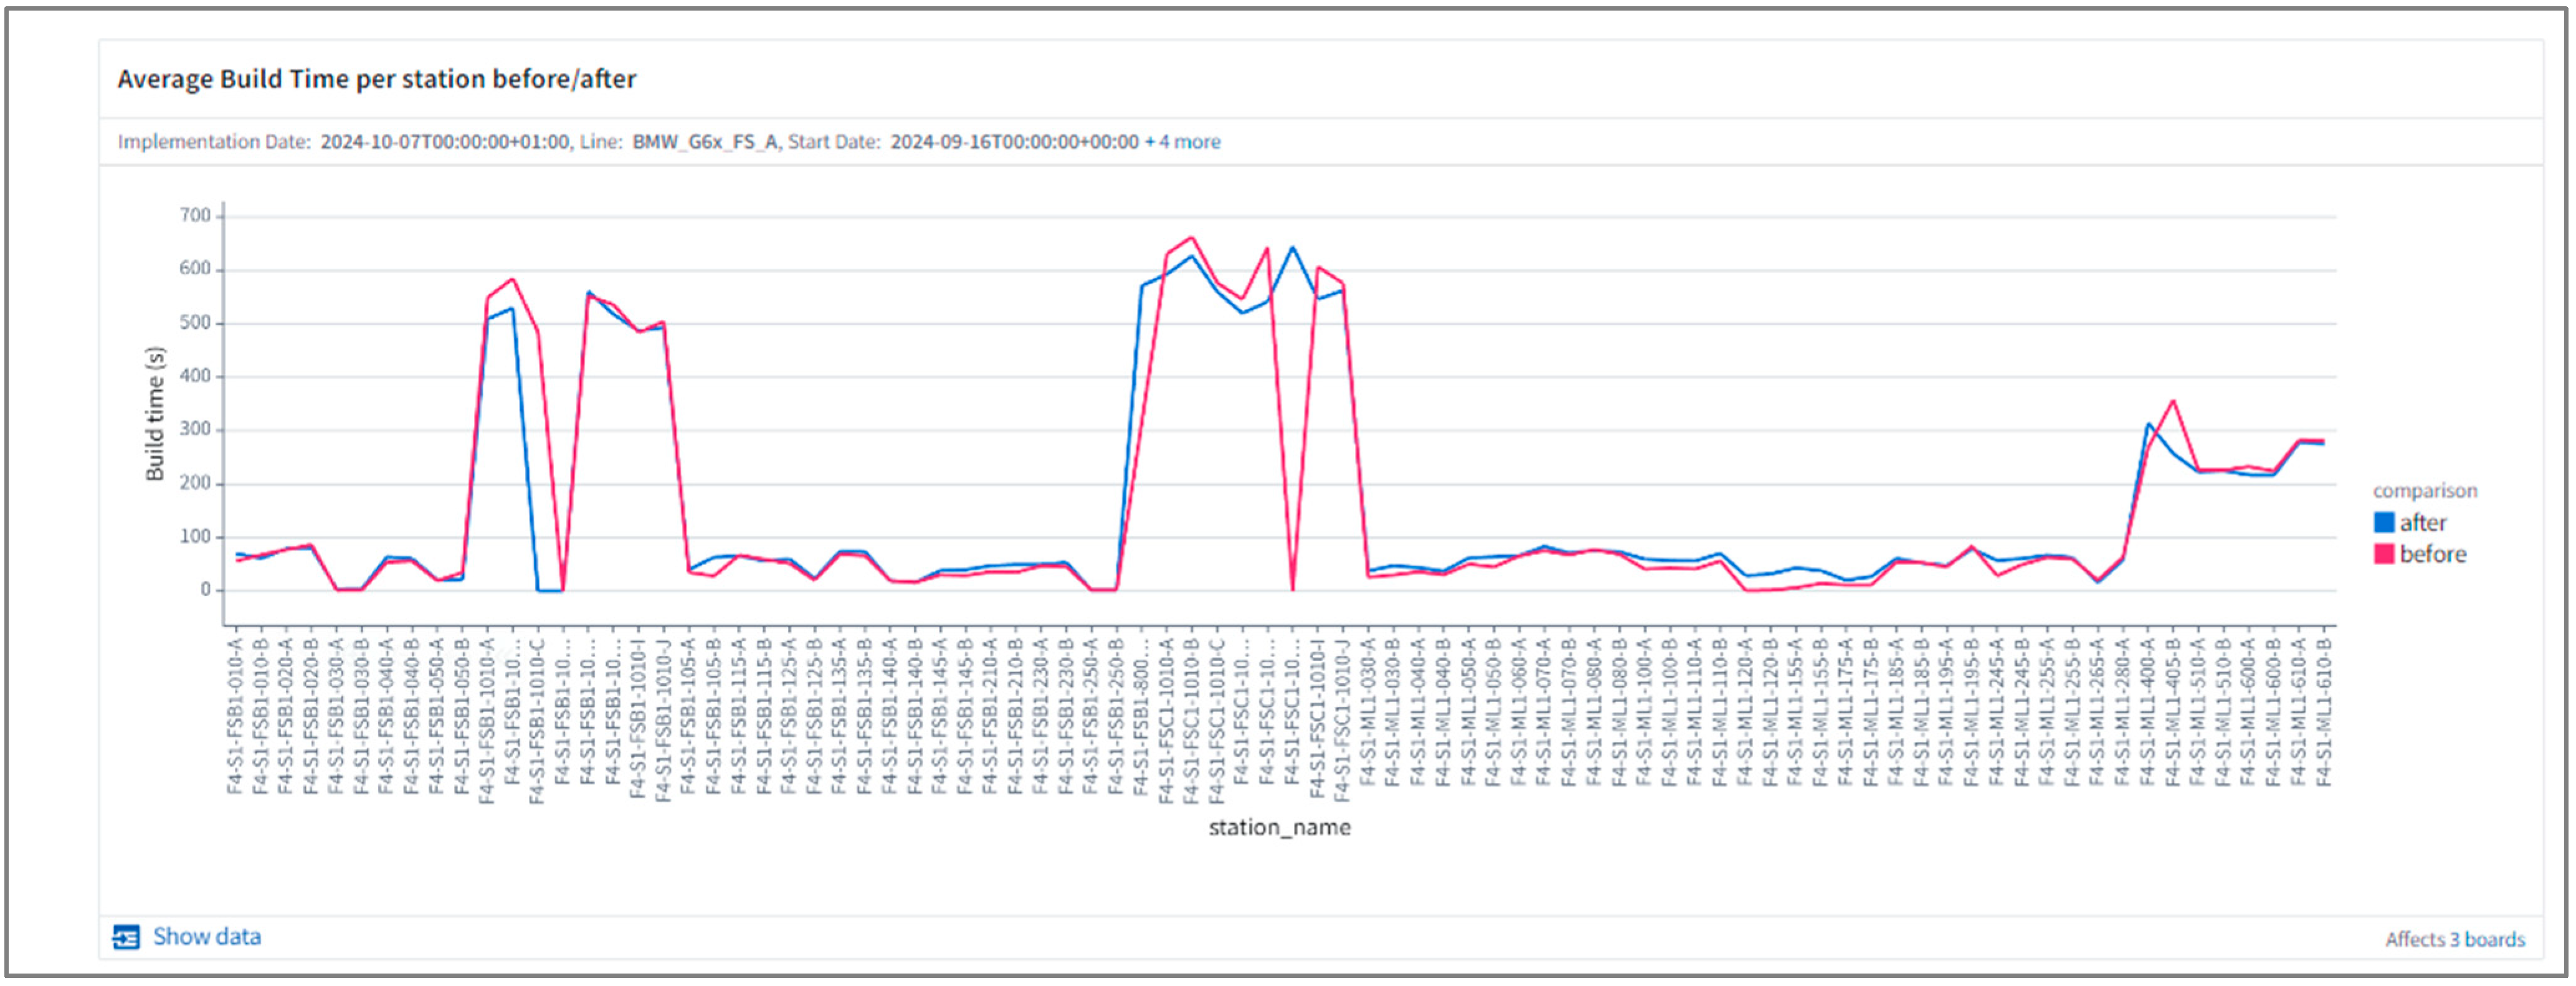
| Build time | is focused on average build time per station and total build time. |
| Opportunities for rebalance | evaluates in-process time per station before and after and shows potential for rebalancing of the process. |
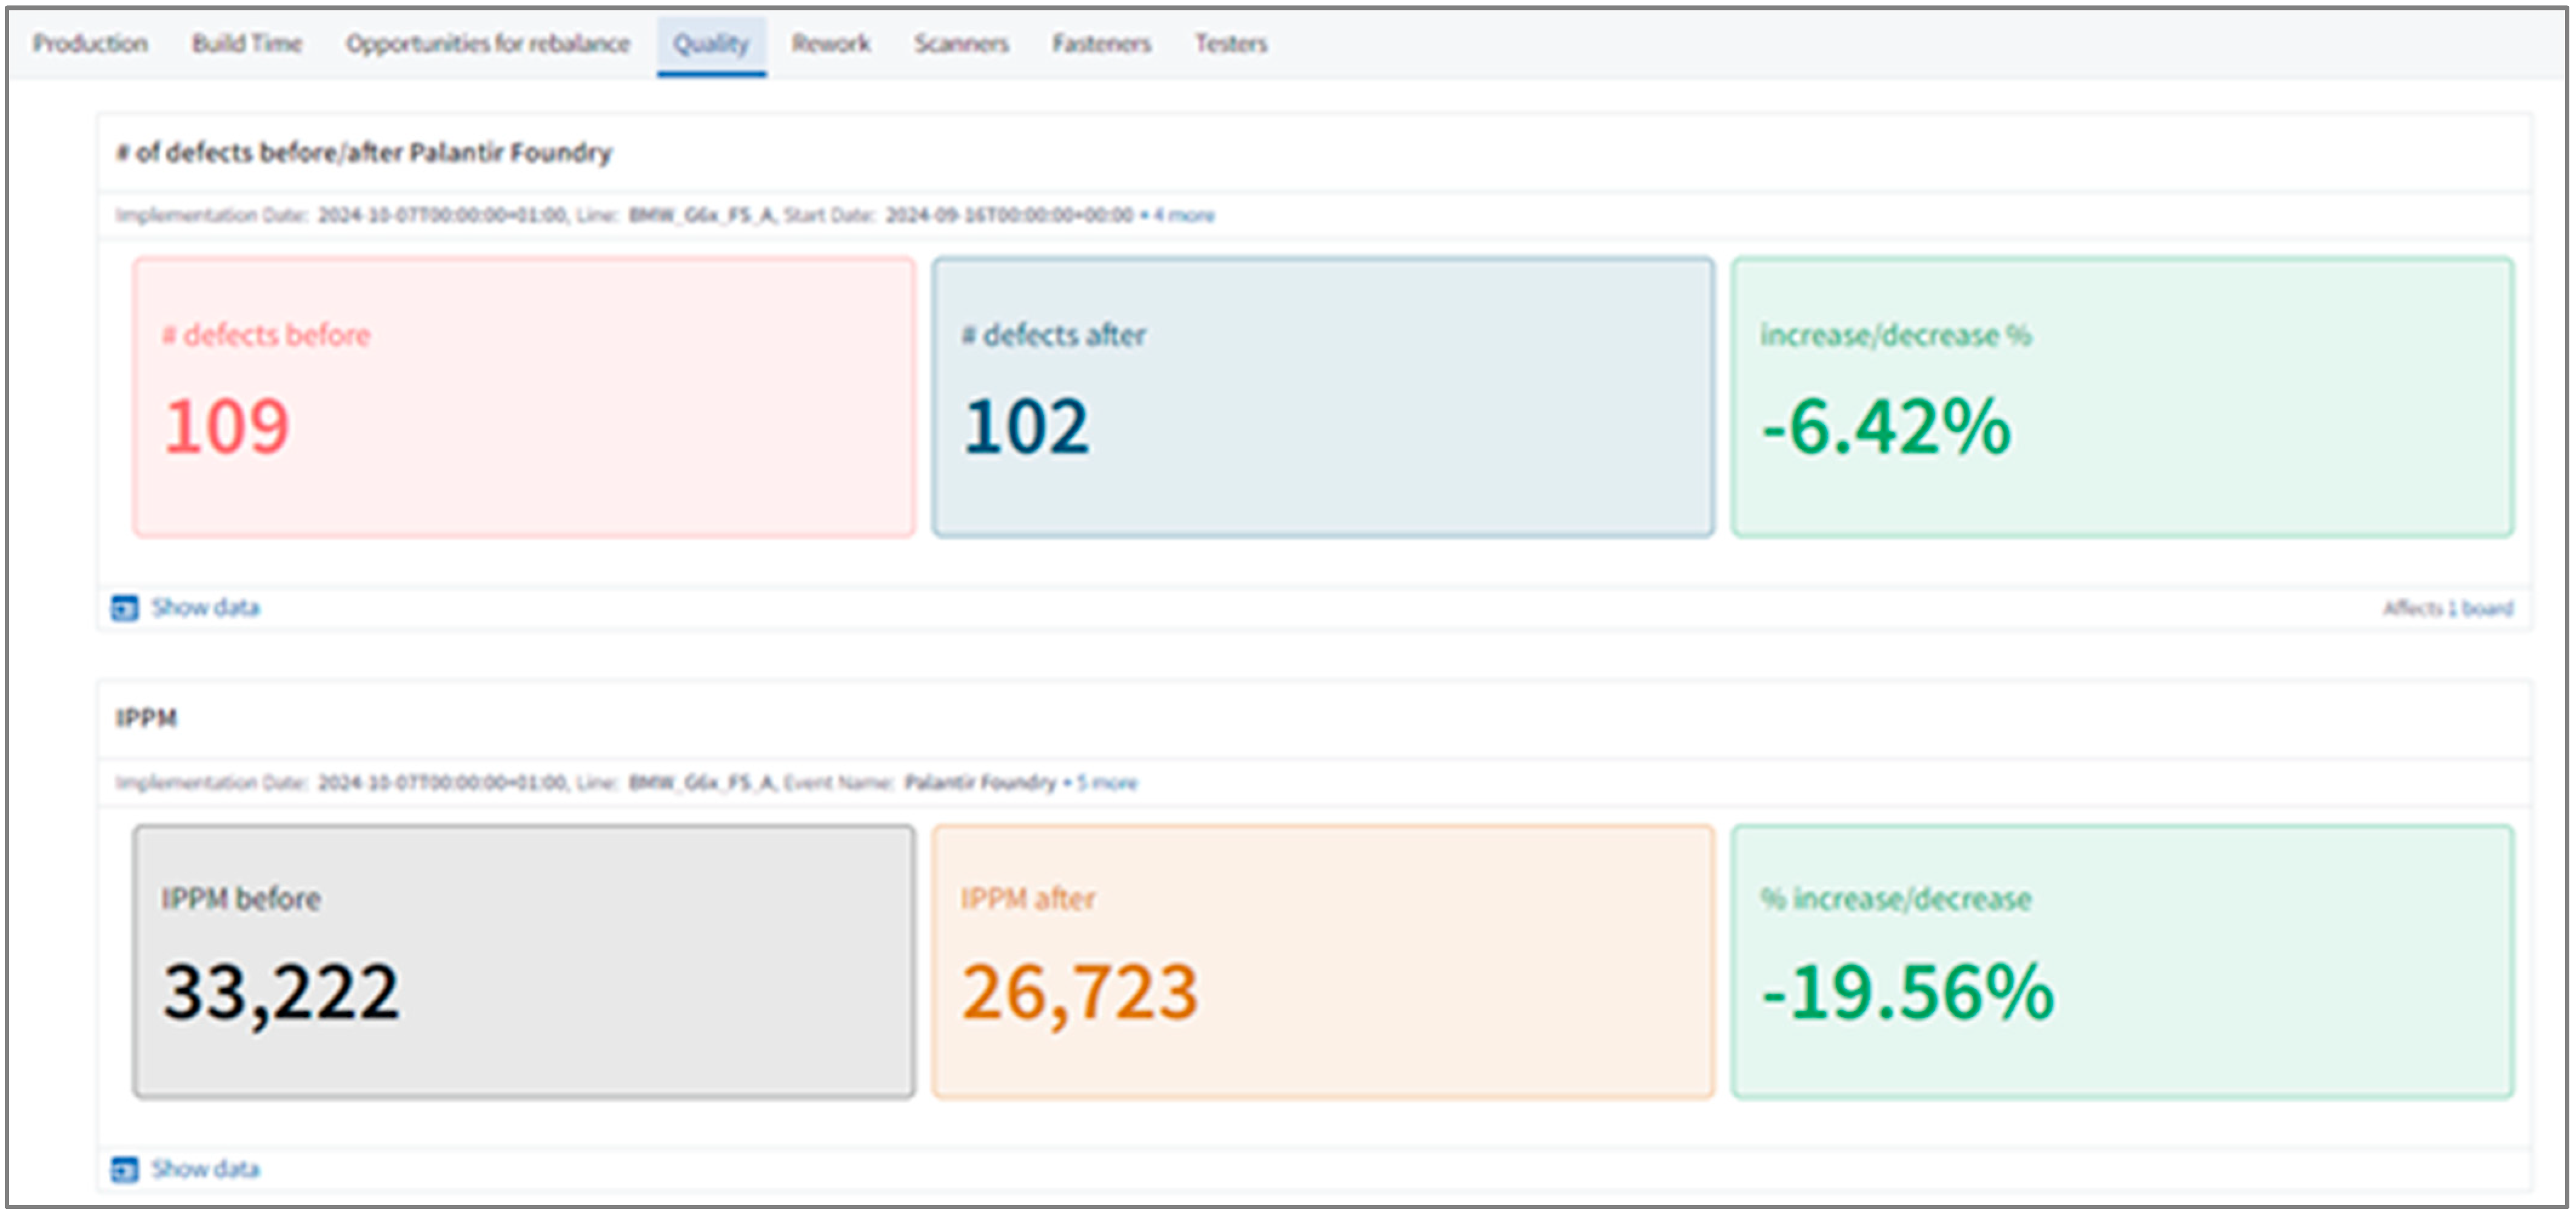
| Quality | is focused on comparison of number of defects before and after in multiple formats like Internal Part Per Million (IPPM), defects per week, defects per weekday and defects per hour. |
| Rework | Rework statistics are divided into multiple groups: rework ration before and after, number of reworks per station duration of repairs per station. |
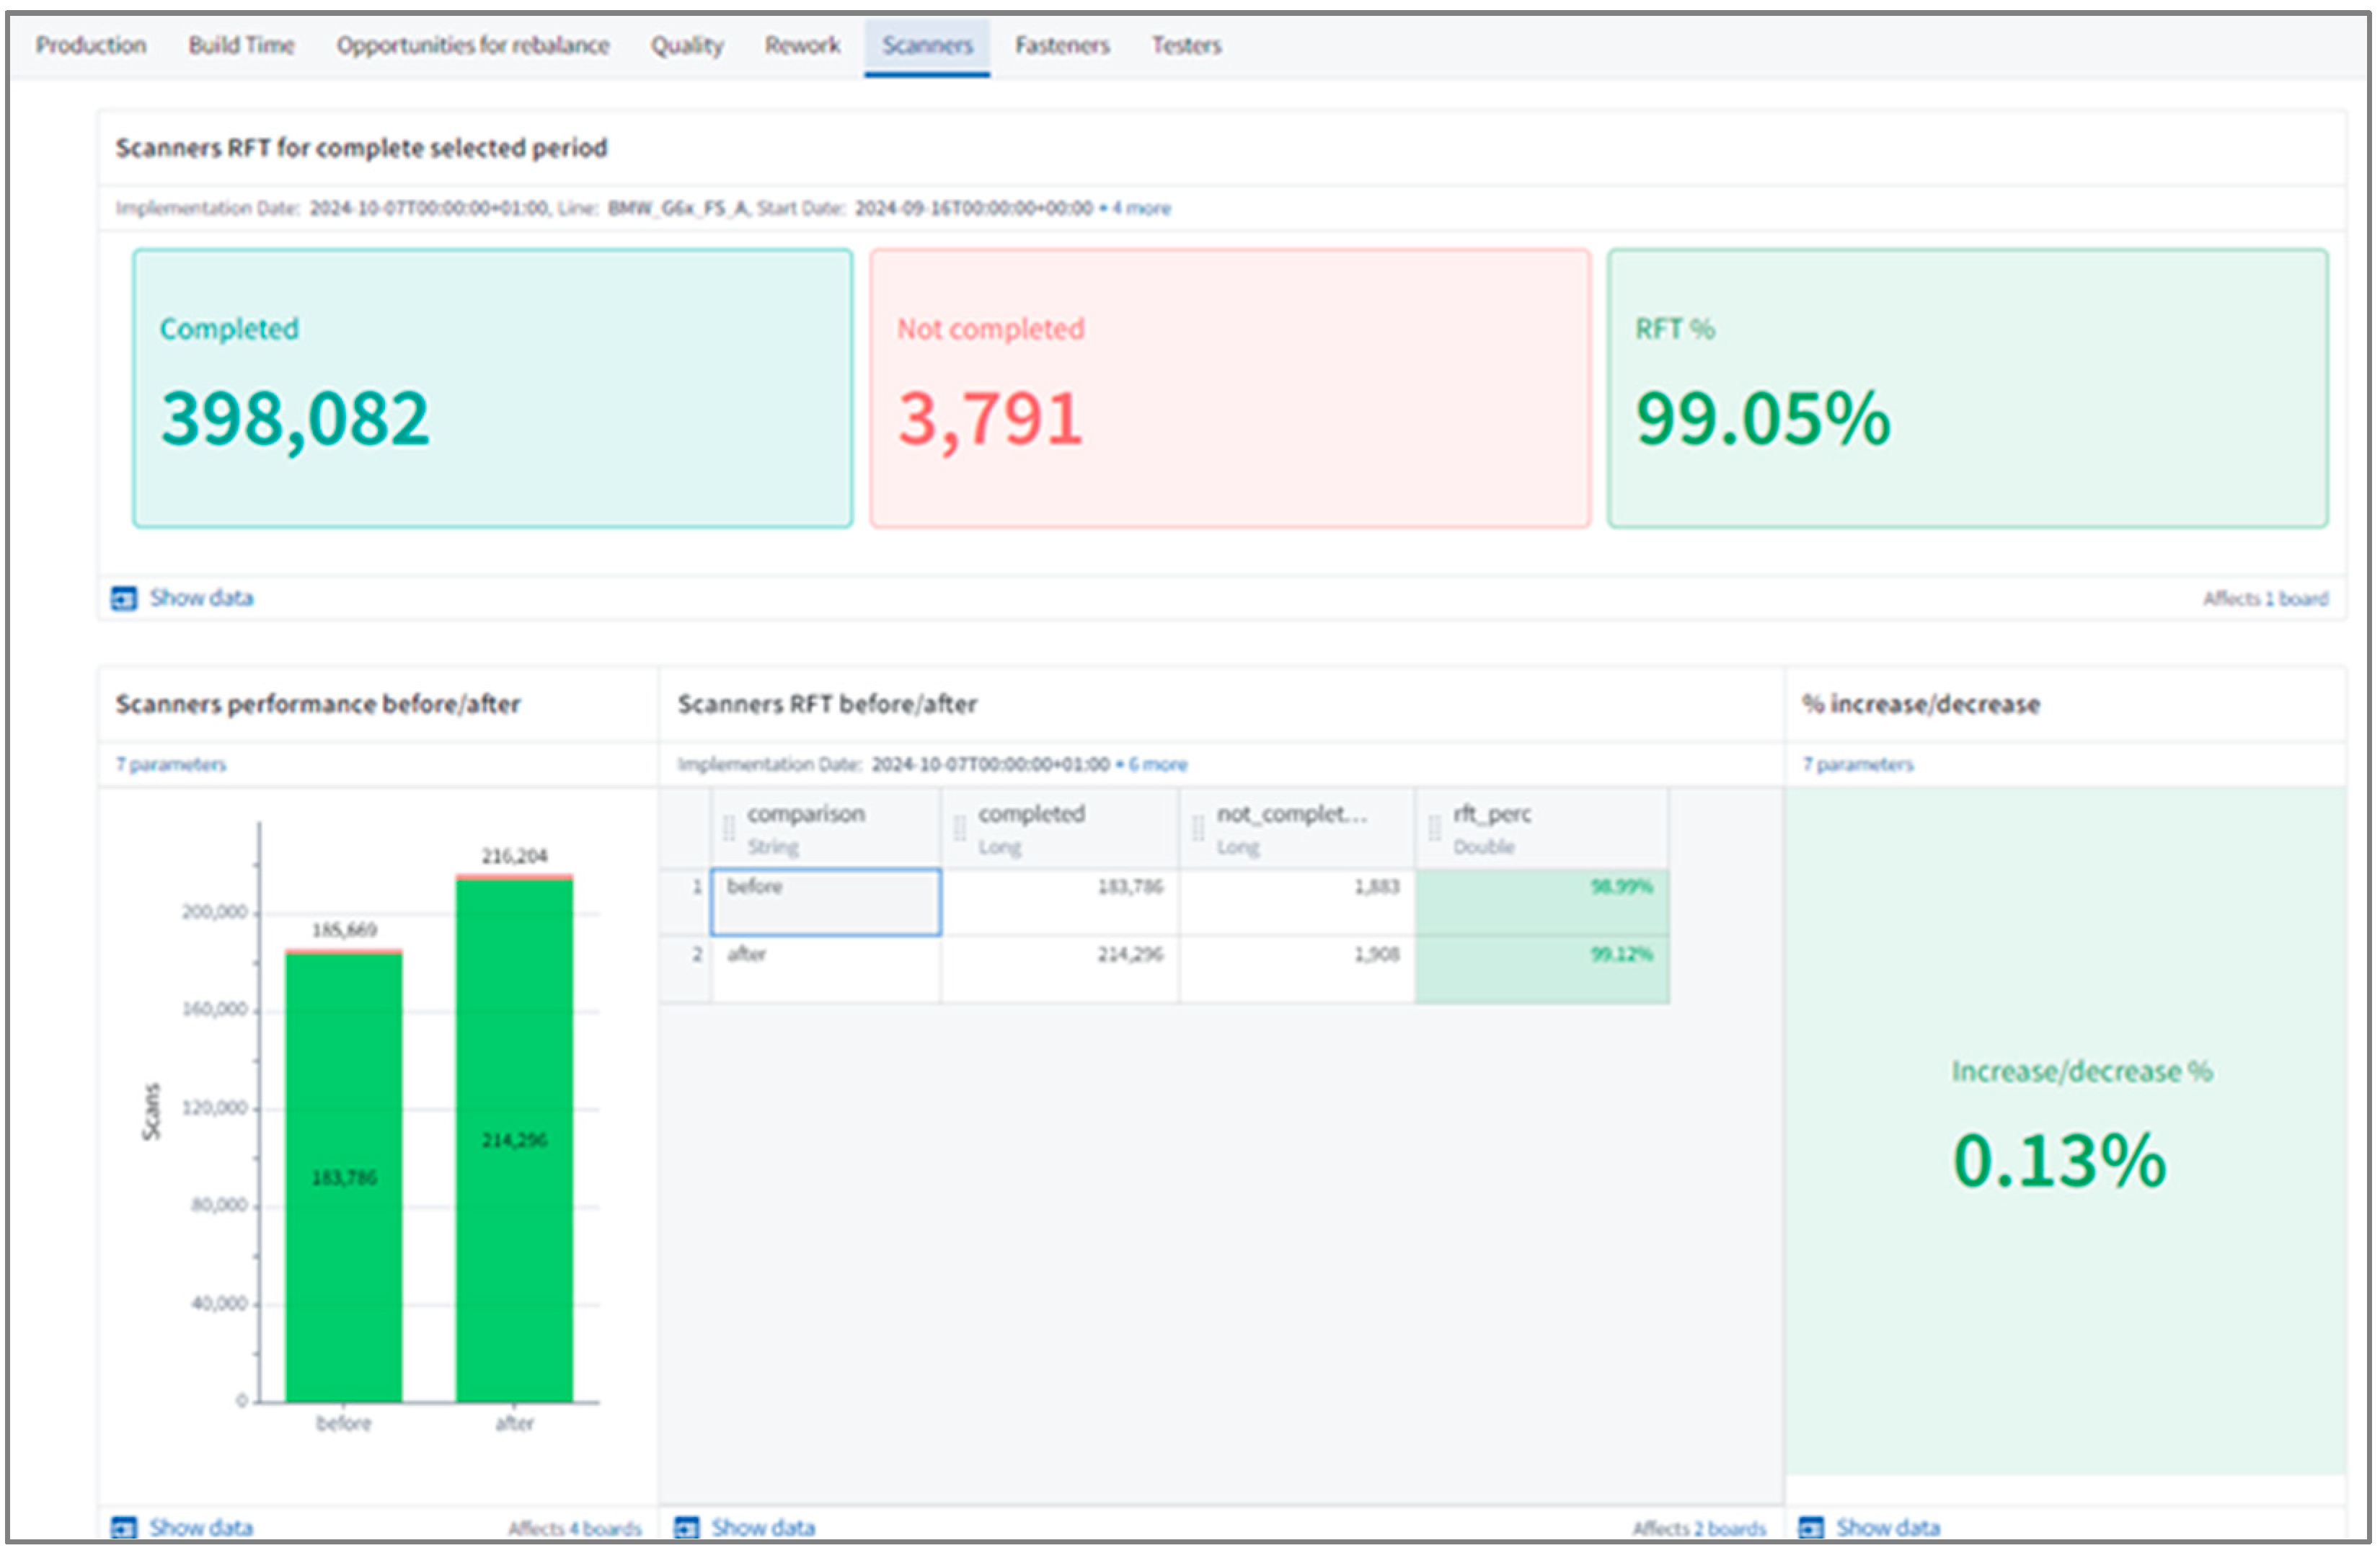
| Scanners and fasteners | The main indicator is RFT and also their performance, completed and not completed scanning or fastenings. |
| Testers | Testers RFT is evaluated with information about completed and not completed tests |
Disclaimer/Publisher’s Note: The statements, opinions and data contained in all publications are solely those of the individual author(s) and contributor(s) and not of MDPI and/or the editor(s). MDPI and/or the editor(s) disclaim responsibility for any injury to people or property resulting from any ideas, methods, instructions or products referred to in the content. |
© 2024 by the authors. Licensee MDPI, Basel, Switzerland. This article is an open access article distributed under the terms and conditions of the Creative Commons Attribution (CC BY) license (https://creativecommons.org/licenses/by/4.0/).
Share and Cite
Krajný, P.; Janeková, J.; Fabianová, J. Data Digitization in Manufacturing Factory Using Palantir Foundry Solution. Processes 2024, 12, 2816. https://doi.org/10.3390/pr12122816
Krajný P, Janeková J, Fabianová J. Data Digitization in Manufacturing Factory Using Palantir Foundry Solution. Processes. 2024; 12(12):2816. https://doi.org/10.3390/pr12122816
Chicago/Turabian StyleKrajný, Peter, Jaroslava Janeková, and Jana Fabianová. 2024. "Data Digitization in Manufacturing Factory Using Palantir Foundry Solution" Processes 12, no. 12: 2816. https://doi.org/10.3390/pr12122816
APA StyleKrajný, P., Janeková, J., & Fabianová, J. (2024). Data Digitization in Manufacturing Factory Using Palantir Foundry Solution. Processes, 12(12), 2816. https://doi.org/10.3390/pr12122816