Article

Establishment of a Temperature–Pressure Coupling Model for a Tubular String in a Carbon Dioxide Injection Well

Mechanical Engineering College, Xi’an Shiyou University, Xi’an 710065, China
*
Author to whom correspondence should be addressed.
Processes 2024, 12(12), 2848; https://doi.org/10.3390/pr12122848
Submission received: 8 October 2024 / Revised: 23 November 2024 / Accepted: 9 December 2024 / Published: 12 December 2024
(This article belongs to the Section Energy Systems)

Abstract

:
Tubular string temperature and pressure are important parameters in string mechanics analysis. Thus, accurately calculating temperature and pressure in the injection process is fundamental for analyzing the tubular string mechanics of CO2 injection wells. Based on the S-W equation of state and Vesovic models, we modeled the physical properties of CO2. Then, based on the physical properties of CO2, combined with the theory of heat transfer and three conservation laws, a temperature–pressure coupling model of a tubular string was established. Lastly, the temperature and pressure field distributions of the G66X1 well were determined using the alternating iteration method. According to a comparison of the established model and the actual data, the maximum error in predicting temperature was 4.1% and the maximum error in predicting pressure was 2.3%; thus, the model exhibits a high level of accuracy. In the final section, the model was used to study the influence of injection temperature on the tubular string temperature and pressure field distribution. Next, we studied the influence of the injection time, displacement, and pressure on the bottom hole temperature. This study provides a reference for predicting the wellbore temperature and pressure in CO2 injection wells.

1. Introduction

CCUS (Carbon Capture, Utilization, and Storage) technology plays a crucial role in capturing CO2 emissions from industrial processes, offering solutions for their utilization and safe storage [1]. In the quest for low-carbon practices, major oil fields are increasingly adopting CO2 EOR (CO2-Enhanced Oil Recovery) technology to boost oil recovery from less permeable reservoirs [2]. The density and specific heat capacity of supercritical CO2 are similar to those of its liquid form, while its viscosity, interfacial tension, and diffusion coefficient are similar to those of the gas [3]. SC-CO2 (supercritical CO2) has properties bridging those of liquids and gasses and is a versatile medium with excellent solubility for organic compounds. This quality enables it to efficiently extract light fractions from crude oil in reservoirs, forming dynamic miscible systems [4]. Supercritical fluids like supercritical carbon dioxide (SC-CO2) have shown significant abilities in various fields [5]. The demonstrated success of CO2 EOR technology underscores its advantages, showcasing its potential for optimizing oil recovery processes and advancing sustainable energy practices. Through innovative applications of supercritical CO2, ongoing progress is being made in carbon capture and utilization efforts [6].
To develop CO2 EOR technology, numerous scholars have researched topics such as tubular mechanics, corrosion prediction, and protection. Zhang, S.; Shi, Y.; and Liu, Y. conducted a three-dimensional heterogeneous physical simulation experiment on relatively homogeneous oil shale samples. The permeability exhibited a monotonic increase with rising pyrolysis temperature [7].
Ramey developed a mathematical model for wellbore heat transfer by dividing the wellbore into three parts and considering conservation laws [8,9,10]. Abdelhafiz proposed a numerical model to predict the temperature distribution in vertical wellbores under different conditions, accounting for transient temperature disturbances in the casing, cement, and surrounding rock [11]. Klinkby studied the influence of fluid buoyancy on heat transfer in vertical wellbores, analyzing the impact of fluid buoyancy on wall temperature using normalized Nusselt numbers [12]. Li established an analytical model for supercritical CO2 flow in fracturing wellbores, considering heat source, equation of state, and transport property models [13]. Qiu derived a computational model for the fluid temperature in supercritical CO2 drilling wellbores, considering thermophysical properties and encounters with water layers [14]. Lesem formulated partial differential equations for temperature fields in dry gas wells based on simplified energy conservation equations [15]. Sproull, R. developed a detailed heat conduction model for infinite cylindrical heat sources under different boundary conditions, offering a transient solution for heat conduction in formations and highlighting the relationship between temperature and time at the second interface during extended construction periods [16]. Zeng, X. improved a wellbore/reservoir simulator by enhancing the relaxation distance calculation method and solving the mass and momentum equations numerically [17]. Gu extended the Ramey model to inject superheated steam into horizontal wells, considering phase transition behavior and steam-quality variations [18]. Dong studied the wellbore temperature distribution during volume fracturing, considering heat conduction in the axial direction. Previous studies on CO2 injection wells showed errors when using different equations of state for CO2 properties [19]. Wu, based on existing studies, found significant errors in predicting temperature and pressure in CO2 injection wellbores when selecting different equations of state for CO2 and its properties [20,21,22]. Yasunami developed a numerical system to predict CO2 flow characteristics, focusing on keeping supercritical CO2 in the tubing. That study successfully predicted the required CO2 temperature for maintaining supercritical conditions [23]. Cheng investigated the influence of tube diameter on the flow and heat transfer characteristics of SC-CO2 in horizontal tubes, explaining the tube diameter effect based on the pseudo-boiling theory [24]. Hou numerically investigated the flow and heat transfer characteristics of SC-CO2 in circular tubes, specifically considering the heat transfer effect of buoyancy [25]. Sun proposed an ANN (Artificial Neural Network) prediction model to accurately predict the thermal properties of SC-CO2 flows, addressing the limitations of traditional prediction methods [26]. Chen developed a prediction model that considers the full transient coupling of shaft temperature and pressure fields, providing insights into well polyphase flow and offering theoretical references for controlling well kick and extending to different well orientations and geothermal applications [27]. Jing refined a calculation model for wellbore temperature and pressure fields in offshore HPHT (High Pressure High Temperature) wells, achieving high accuracy with minimal errors compared with measured data [28]. Liu established a mathematical model for single-phase gas transient flow in tubular strings during gas well production, providing insights into pressure and temperature distribution patterns. The model demonstrated higher accuracy when compared to measured data and analytical models, supporting the selection and optimal design of completion production tubular tools [29]. Pang considered the flow of superheated steam in vertical shafts, accounting for physical properties, pipe structure, friction loss, and heat conduction/convection to establish a heat loss model [30]. Zheng investigated the heat transfer characteristics of supercritical fluid in vertical pipes with a constant wall temperature, identifying fluctuations in heat transfer in the transcritical section attributable to the decreasing amplitude of wall surface fluctuations along the axial direction [31]. Tang developed a numerical simulation model for CO2 injection fracturing displacement while considering the transition from liquid into the supercritical state and changes in fluid density during the process [32]. Khan and May developed a mathematical model for predicting transient bottomhole temperature during drilling, applicable to vertical wells, inclined wells, and horizontal wells [33]. To prevent fracture and corrosion in the actual applications of a tubular column, understanding the physical properties of CO2 is crucial. This study establishes a mathematical model for the temperature and pressure fields of CO2 in the wellbore, calculates the temperature and pressure distributions along the depth of the well, and subsequently determines the phase distribution pattern of CO2 in the actual wellbore [34]. Dang, Z. found that, during the drilling process, the bottom hole’s circulating temperature exceeded the temperature tolerance of downhole instruments, leading to frequent issues such as device burnouts and signal loss. Therefore, a numerical model for transient heat transfers in the wellbore–formation system was established to predict the temperature field of ultra-deep directional wells [35]. Cao, J. established a transient temperature field model for horizontal wells based on convective heat transfer between the wellbore and the formation combined with the principle of energy conservation. These research findings can provide theoretical guidance for adjusting relevant parameters [36].
Based on an extensive literature review, this study aims to investigate the temperature and pressure distribution patterns in CO2 injection wellbores and calculate CO2 property parameters. By comparing prediction results with field data, the accuracy of the prediction model is validated, providing essential parameters to ensure the safety and integrity of the tubular string in subsequent operations.

2. Establishing and Solving the Temperature–Pressure Prediction Model

2.1. Physical Property Parameters Analysis of CO2

When CO2 is used as a drilling fluid and flows inside the wellbore, its physical properties continuously change. Therefore, to analyze the flow characteristics of CO2 in a wellbore, it is necessary to investigate variations in the physical properties of supercritical CO2 based on temperature and pressure. Supercritical CO2 refers to carbon dioxide at temperatures and pressures above its critical values (31.06 °C, 7.38 MPa). Table 1 lists some of the physical properties of CO2 [36].
A physical parameter is a function of temperature and pressure that is generally solved by the equation of state. Density and specific heat capacity can be calculated with Span and Wagner’s (S-W) equation of state, derived from the Helmholtz free energy. This equation’s calculation results can provide a wide range of temperatures and pressures (−56.56~826.85 °C; 0.52~800 MPa) with very high accuracy (a density relative error of 0.03~0.05%; a relative specific heat capacity error of 0.15~1.5%) [37]. Regarding viscosity and thermal conductivity, the calculated relative error of the model established by Vesovic [38] is 0.3% at low pressure and within 5% at high pressure. This high accuracy can meet the requirements of engineering applications; thus, the S-W equation of state is used to calculate CO2 density and specific heat capacity, and the Vesovic model calculates CO2 thermal conductivity and viscosity. The CO2 phase diagram [39] in Figure 1 illustrates the transition process between the CO2 gas–liquid phase and its supercritical state.

2.1.1. Density Analysis of CO2

During the CO2 injection process, Span and Wagner’s model calculates CO2 density, which can meet engineering needs with high accuracy. CO2 density expression is calculated as follows [37]:
ρ ( δ , τ ) = p M n Z ( δ , τ ) R T
Z ( δ , τ ) = 1 + δ ϕ δ r
Φ ( δ , τ ) = Φ 0 ( δ , τ ) + Φ r ( δ , τ )
where M is the molar mass of CO2, 44 g/mol; δ is the contrast density; τ is the contrast temperature; n is the amount of CO2, mol; Z is the compression factor; R is the gas constant, 8.314 J/(K /mol); T is temperature, °C; and p is pressure, MPa. Φ ( δ , τ ) is the Helmholtz free energy, comprising the ideal state part Φ 0 ( δ , τ ) and the residual state part Φ r ( δ , τ ) , specifically calculated in the literature [37].

2.1.2. Specific Heat Capacity Analysis of CO2

The specific heat capacity is difficult to measure, and the specific heat capacity is mainly used in practical applications. The expression of constant pressure ratio heat c p is as follows [37]:
c p ( δ , τ ) = R τ 2 ϕ τ τ o + ϕ τ τ r + 1 + δ ϕ δ r δ τ ϕ δ τ r 2 1 + 2 δ ϕ δ r + δ 2 ϕ δ δ r
h ( δ , τ ) = R T 1 + τ ϕ τ o + ϕ τ r + δ ϕ δ r

2.1.3. Joule–Thomson Coefficient Analysis of CO2

The Joule–Thomson coefficient solution equation is expressed as follows [37]:
J ( δ , τ ) = 1 R ρ δ Φ δ r + δ 2 Φ δ δ r + δ τ Φ δ τ r 1 + δ Φ δ r δ τ Φ δ τ r 2 τ 2 Φ τ τ o + Φ τ τ r 1 + 2 δ Φ δ r + δ 2 Φ δ δ r

2.1.4. Thermal Conductivity Analysis of CO2

CO2 thermal conductivity λ consists of three parts: zero-density thermal conductivity, residual thermal conductivity, and strange thermal conductivity. The expression is as follows [38]:
λ ( T , ρ ) = λ 0 + Δ λ ( T , ρ ) + Δ λ c ( T , ρ )
where λ is the CO2 thermal conductivity, W/(m·K); λ0 is the zero density thermal conductivity, W/(m·K); Δλ is the residual thermal conductivity, W/(m·K); and Δλc is the singular thermal conductivity, W/(m·K). The specific parameters are described in the literature [39].

2.1.5. Viscosity Analysis of CO2

Based on experimental data, the CO2 viscosity calculation is as follows [39]:
η ( T , ρ ) = η 0 ( T ) + Δ η ( T , ρ ) + Δ η c ( T , ρ )
where η0(T) represents the zero-density viscosity in Pa·s; Δη(T,ρ) represents the residual viscosity in Pa·s; and Δηc(T,ρ) represents the singular viscosity in Pa·s. The specific parameters are described in the literature [39].
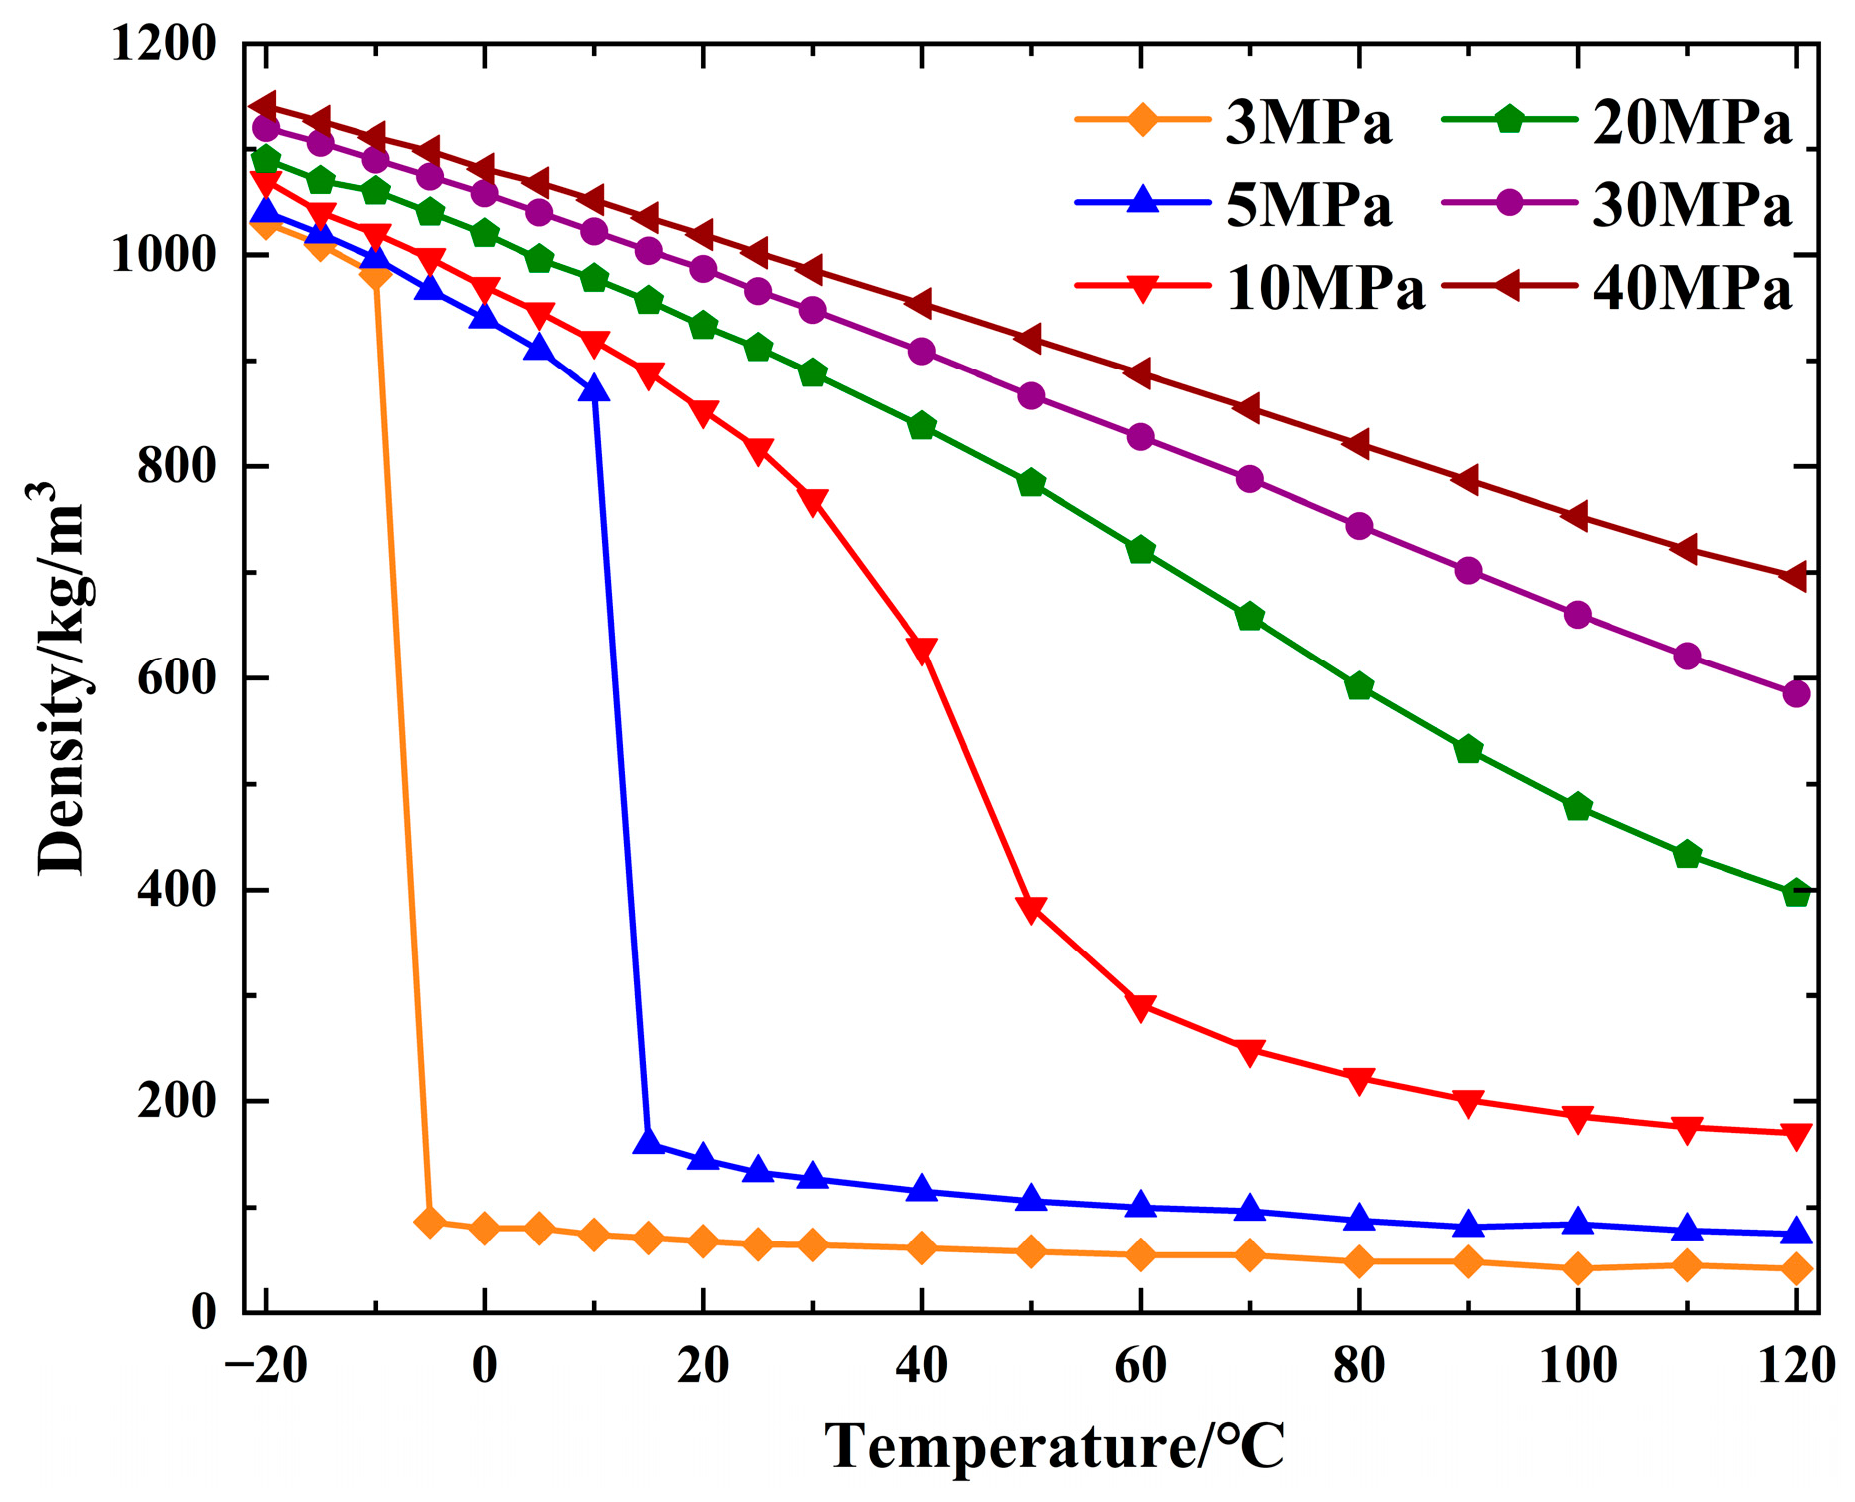
Using the above equation, the CO2 density, viscosity, specific heat capacity, and heat transfer coefficient at different temperatures and pressures are calculated using MATLAB programming. Figure 2 shows the changes in CO2 density at different pressures, decreasing CO2 density with temperature and increasing CO2 density with pressure. At 3 MPa and 5 MPa, the density is discontinuous because of the gas–liquid phase transition, while, at 10 MPa to 50 MPa, the pressure increase changes the CO2 from a liquid to a supercritical state and the density change is continuous; however, the density is sensitive to temperature and pressure. At 10 MPa, the density decreases at 290 kg/m3 from 20 °C to 60 °C, representing a 66% decrease.
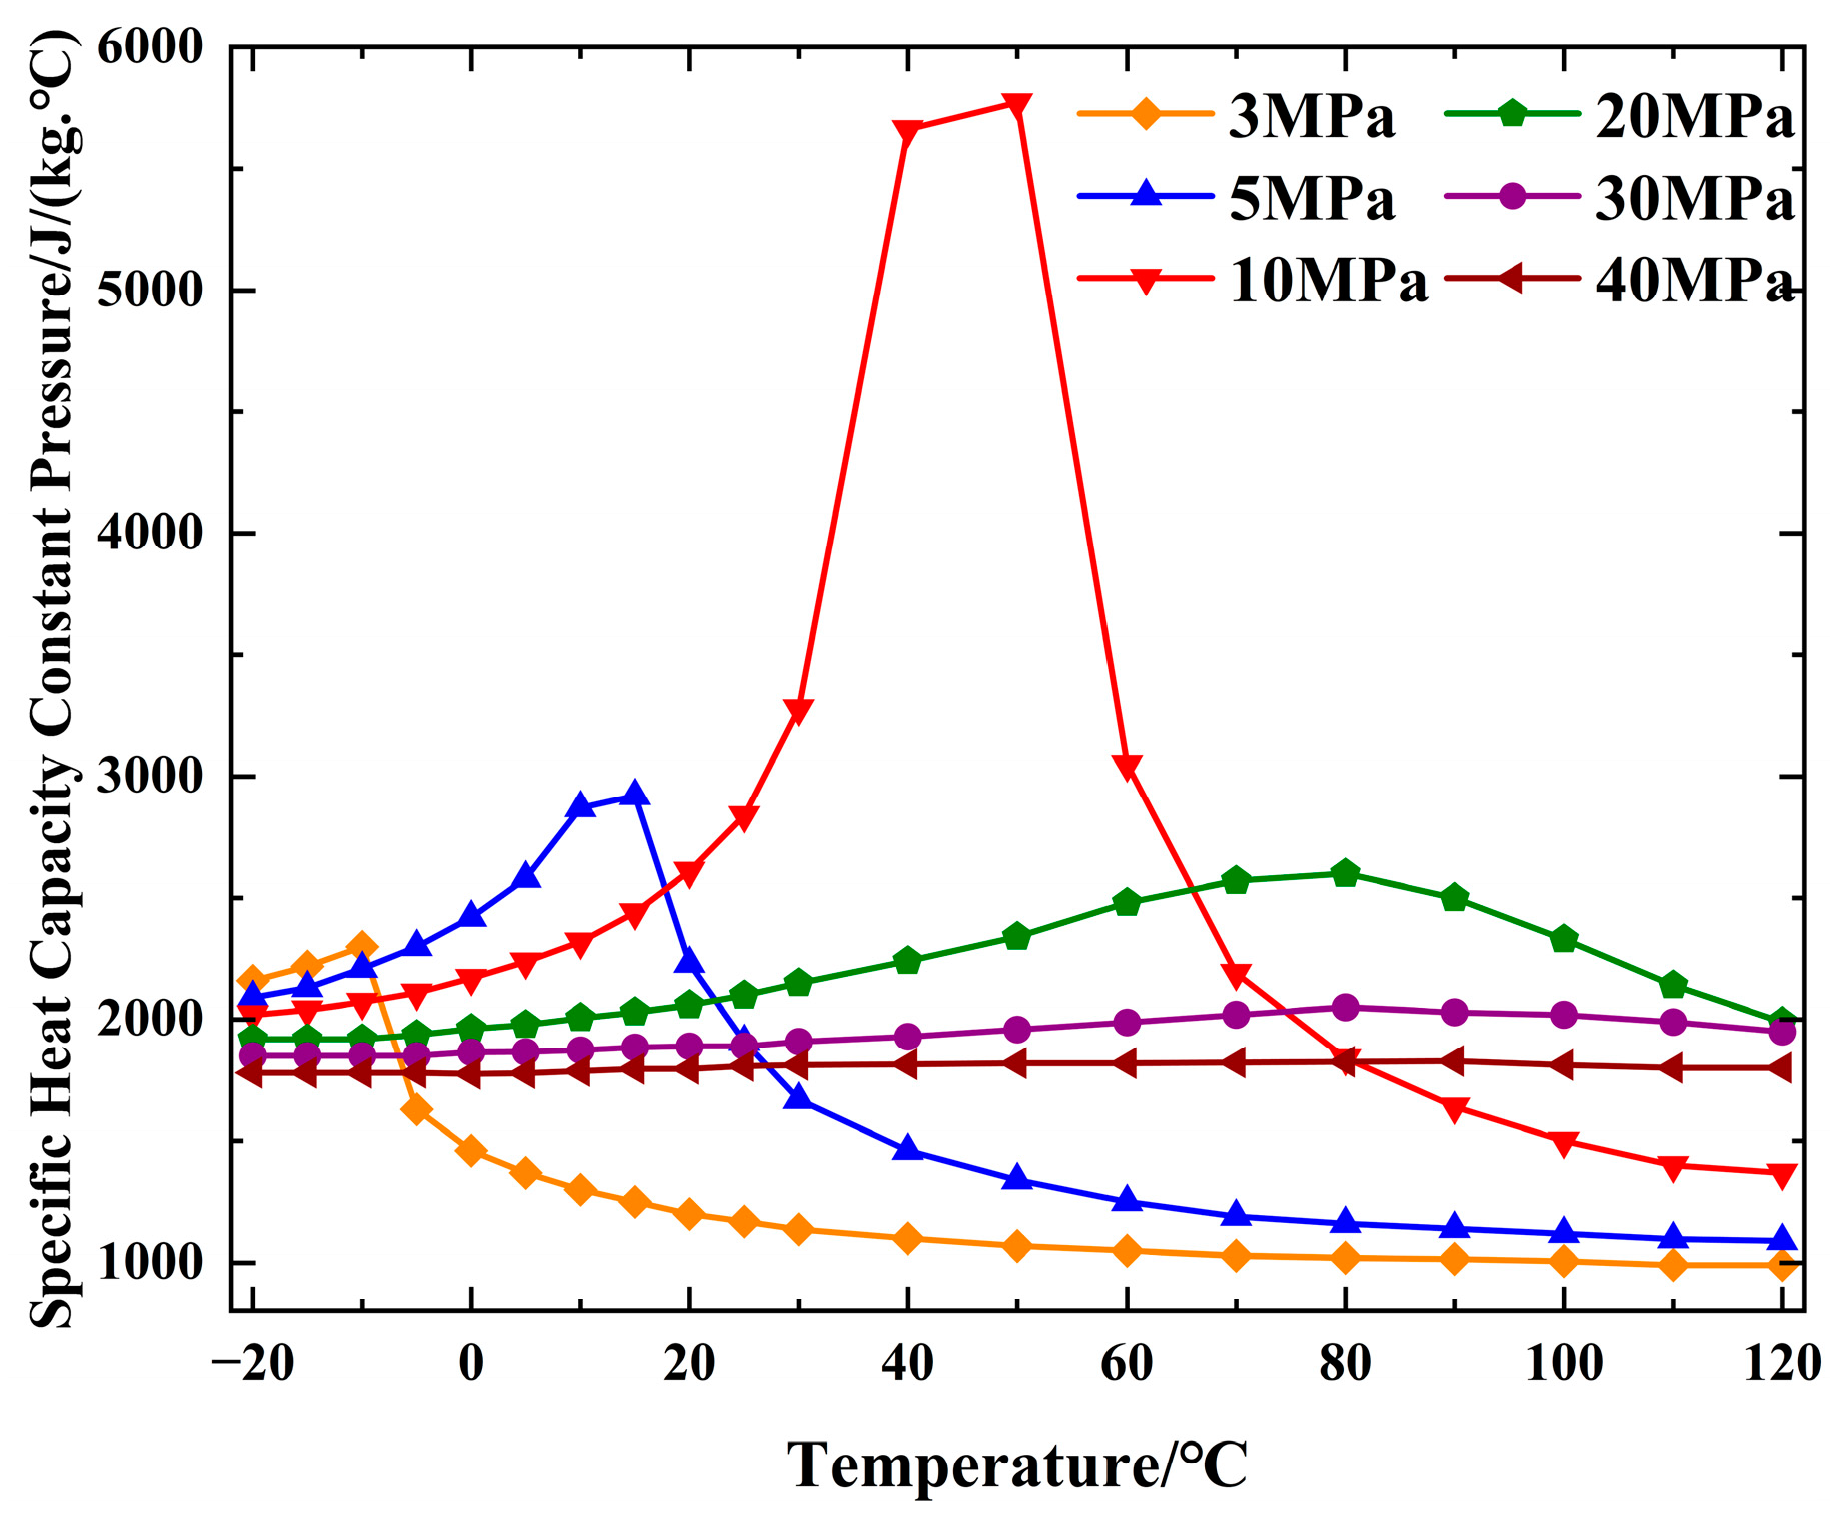
Figure 3 shows a change in the specific heat capacity of CO2 constant pressure under different pressures. At the same pressure, the change in specific heat capacity with temperature is nonlinear and non-monotonic, and each pressure corresponds to a temperature; thus, when the specific heat capacity of CO2 takes its maximum value, the temperature is called the quasi-critical temperature [38]. The specific heat capacity increased from 30 °C to 40 °C from 3260 J/(kg·°C) to 5657 J/(kg·°C), an increase of 73.5%. However, with the increased pressure, the quasi-critical temperature increases and the peak specific heat capacity decreases. When the pressure reaches 50 MPa, the specific heat capacity of CO2 is basically stable at about 1750 J/(kg·°C).
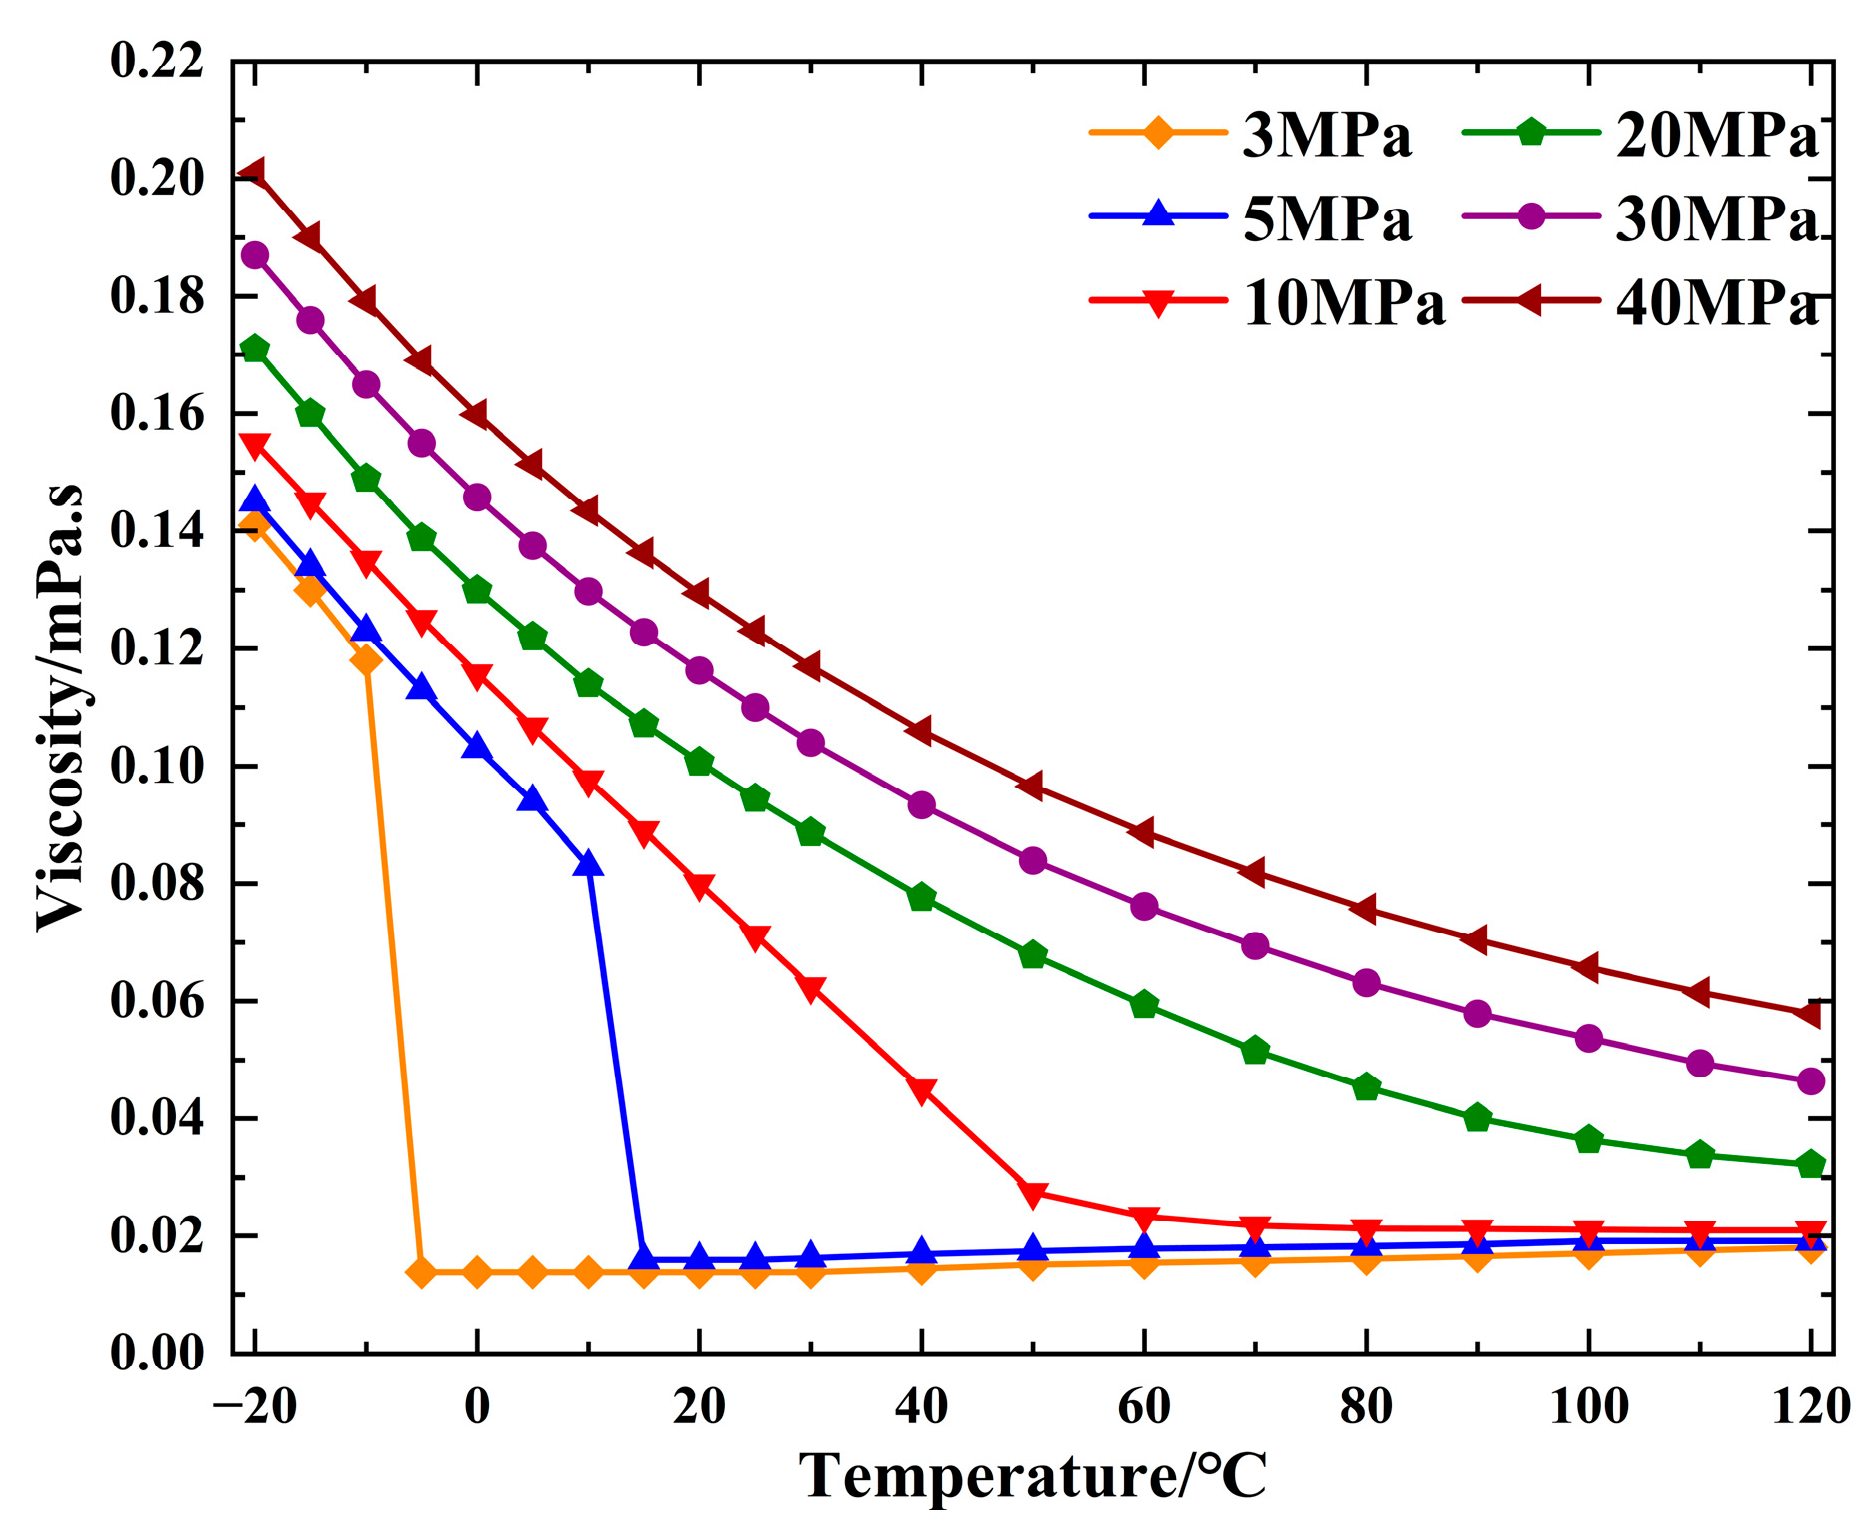
Figure 4 shows the change in CO2 viscosity with temperature at different pressures. As pressure increases, CO2 viscosity increases; as temperature increases, CO2 viscosity decreases in most temperature and pressure ranges, but it increases slightly in the gaseous and supercritical states below 10 MPa. However, the increase is very small. Moreover, at 3 MPa and 5 MPa, the gas–liquid phase transition occurs and the viscosity varies continuously with increasing pressure from 10 MPa to 50 MPa. The viscosity is also sensitive to temperature and pressure changes. At 10 MPa, with a temperature reduction from 60 °C to 20 °C, the viscosity increases from 0.02 mPa·s to 0.08 mPa·s, a four-fold increase. The maximum viscosity of CO2 is 0.22 mPa·s.
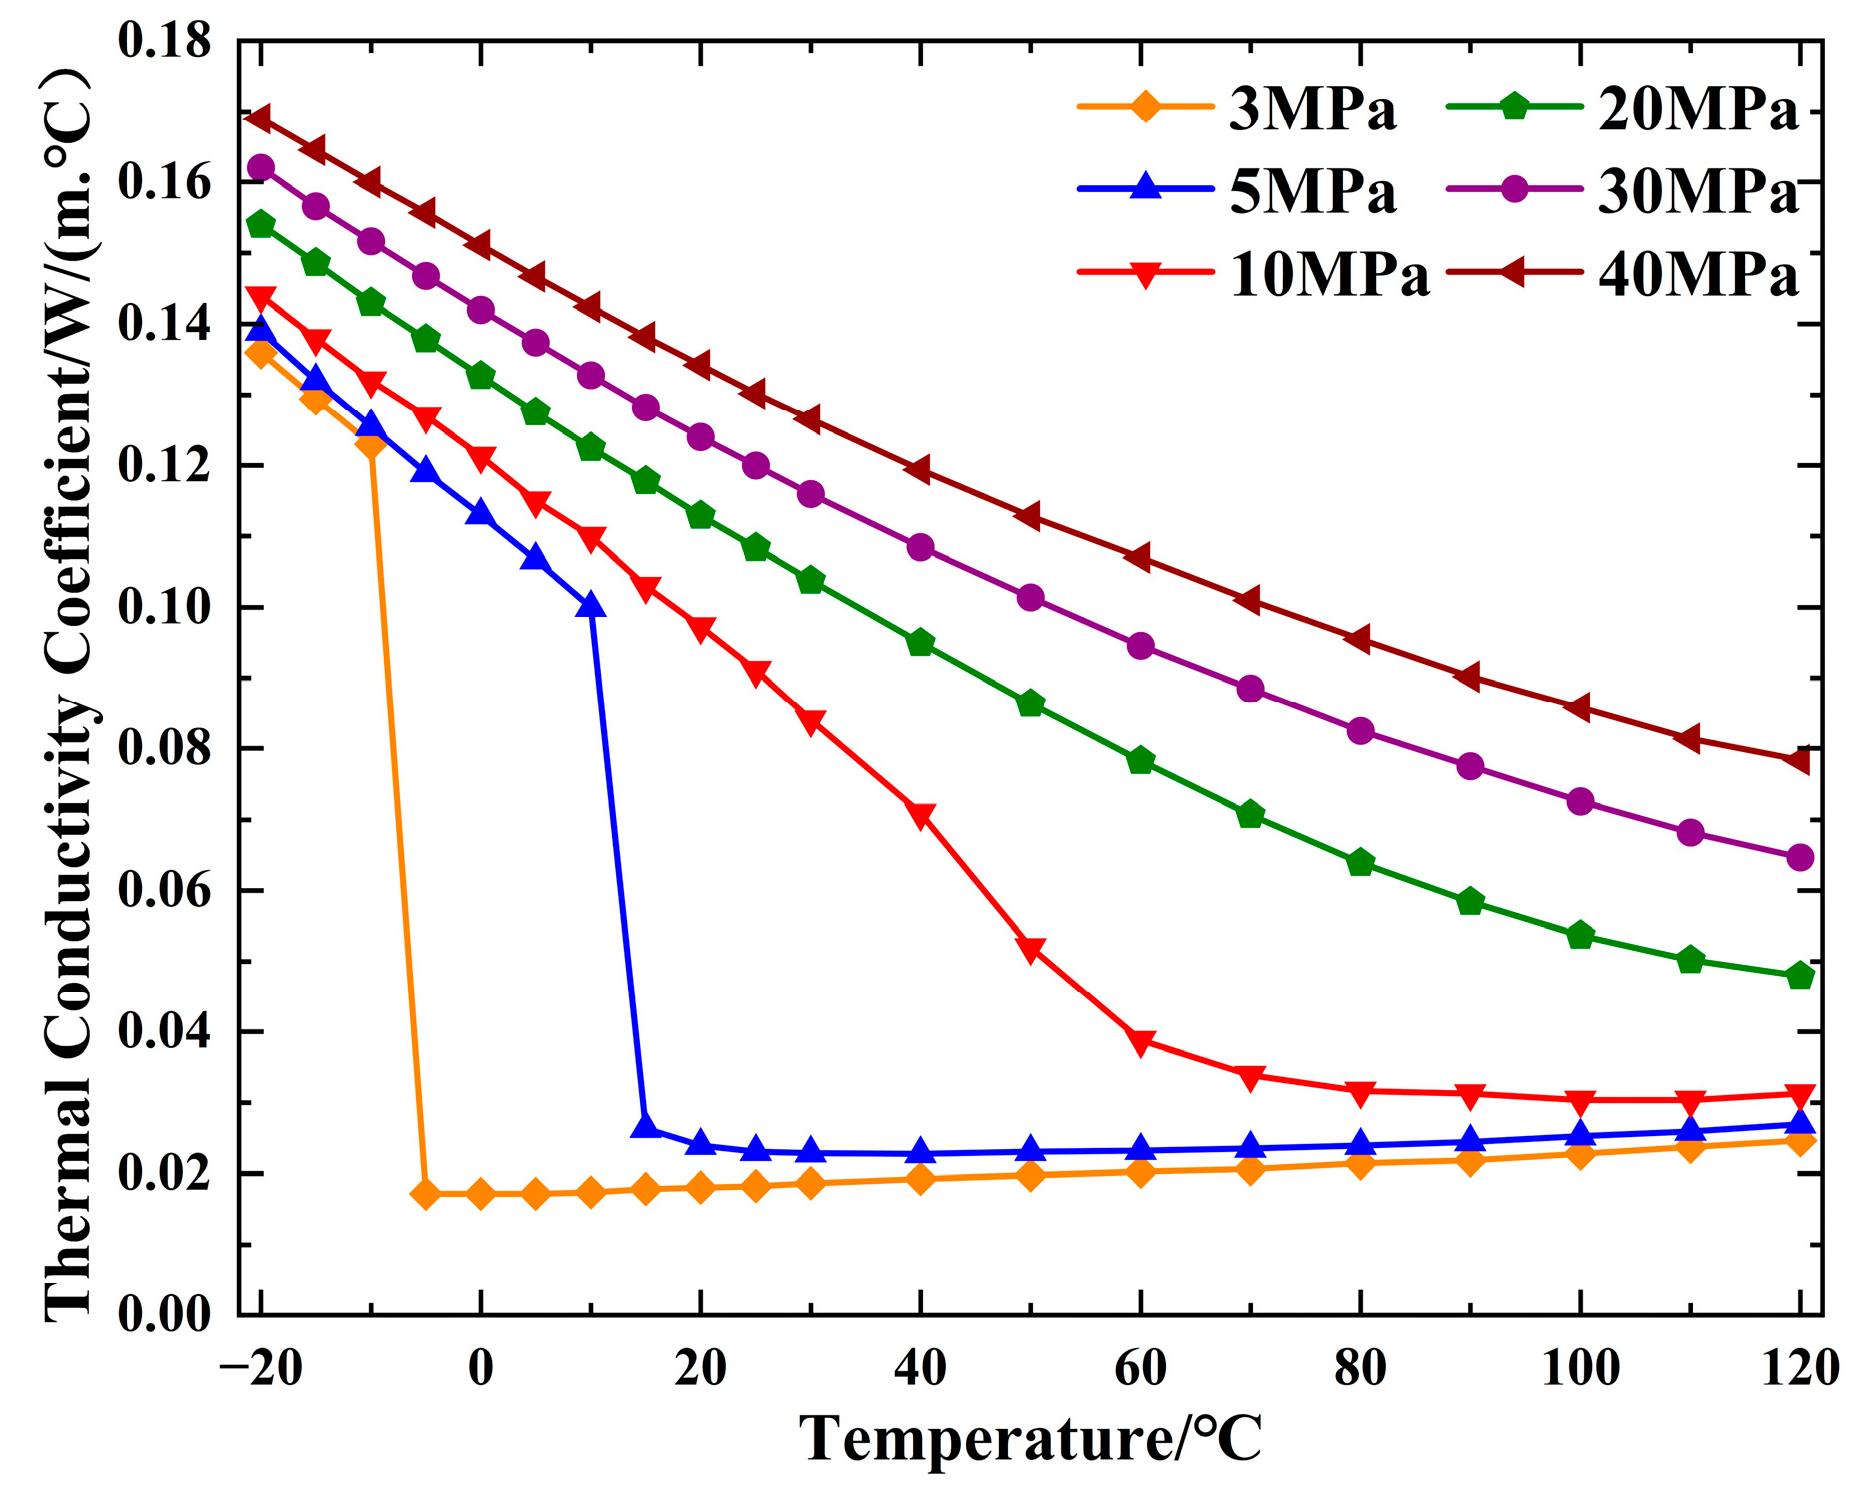
Figure 5 shows the change in CO2 thermal conductivity with temperature at different pressures. As the pressure increases, CO2 thermal conductivity increases; as the temperature increases, the CO2 thermal conductivity decreases at most temperatures and pressures; however, as the temperature increases, the CO2 thermal conductivity increases slightly in the gaseous and supercritical states below 10 MPa. At 3 MPa and 5 MPa, due to the gas–liquid phase transition, the thermal conductivity also appears to be discontinuous. At 10 MPa~50 MPa, the pressure increase changes the CO2 thermal conductivity continuously as it is sensitive to temperature and pressure. At 10 MPa, increasing the temperature from 60 °C to 20 °C leads to a 2.5-fold increase of 0.04 W/(m·°C) to 0.1 W/(m·°C).

2.2. Temperature Distribution Model

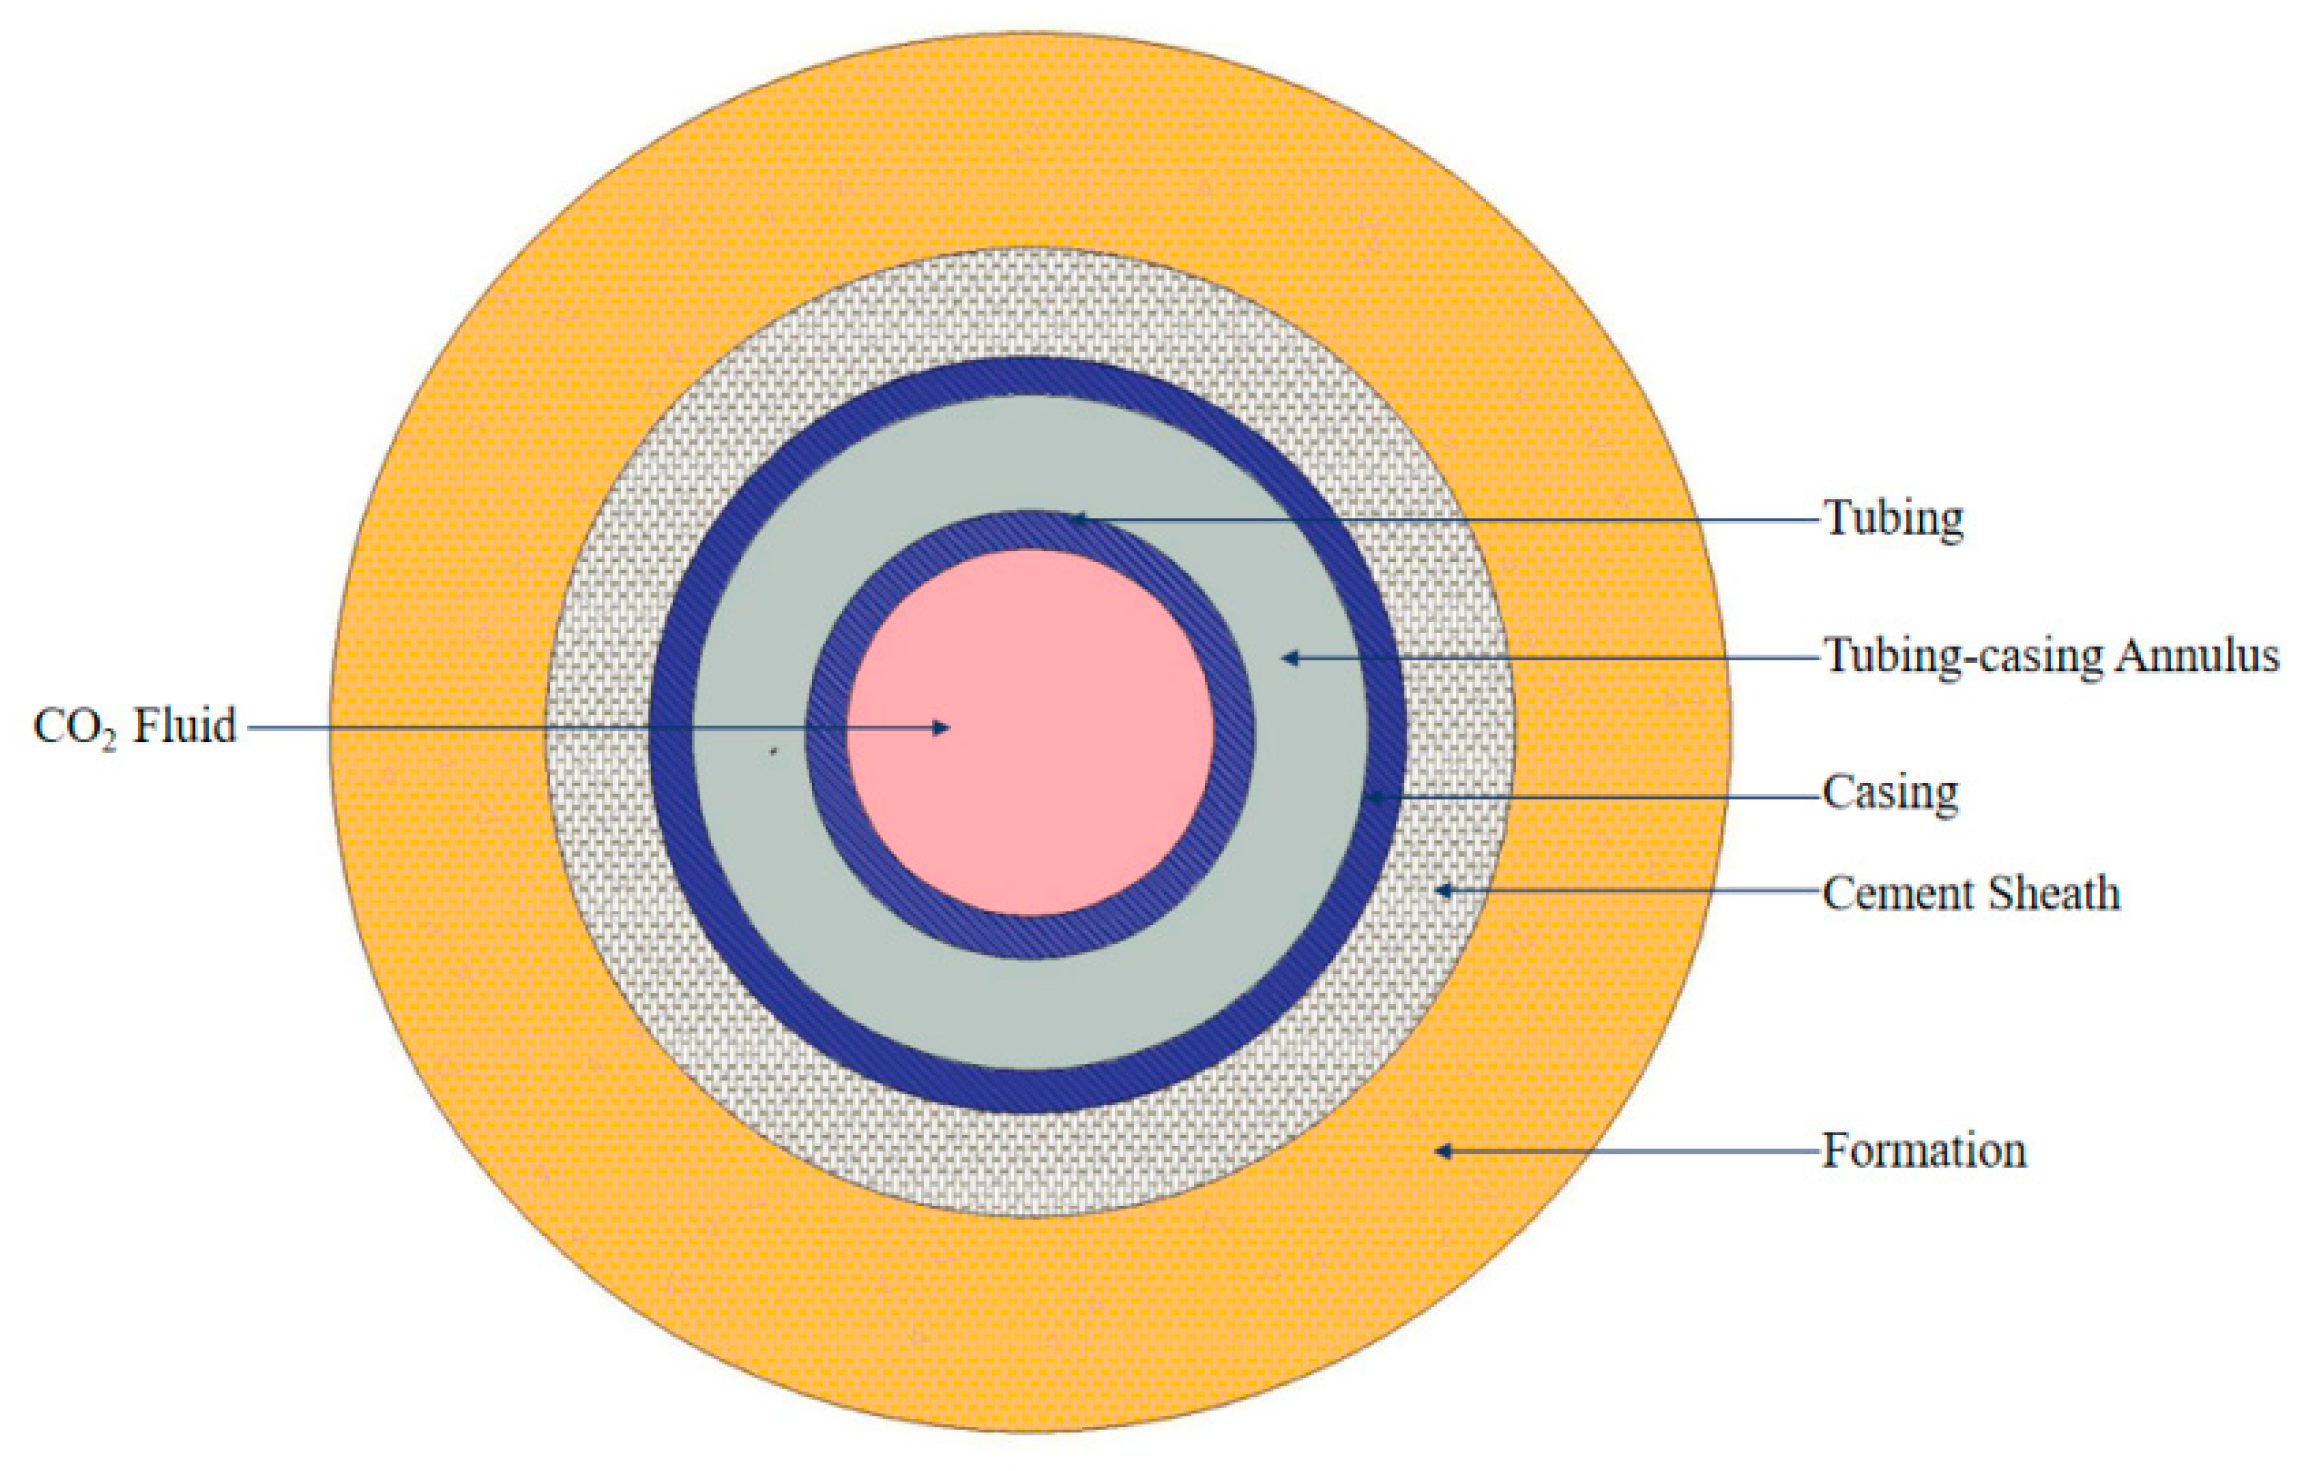
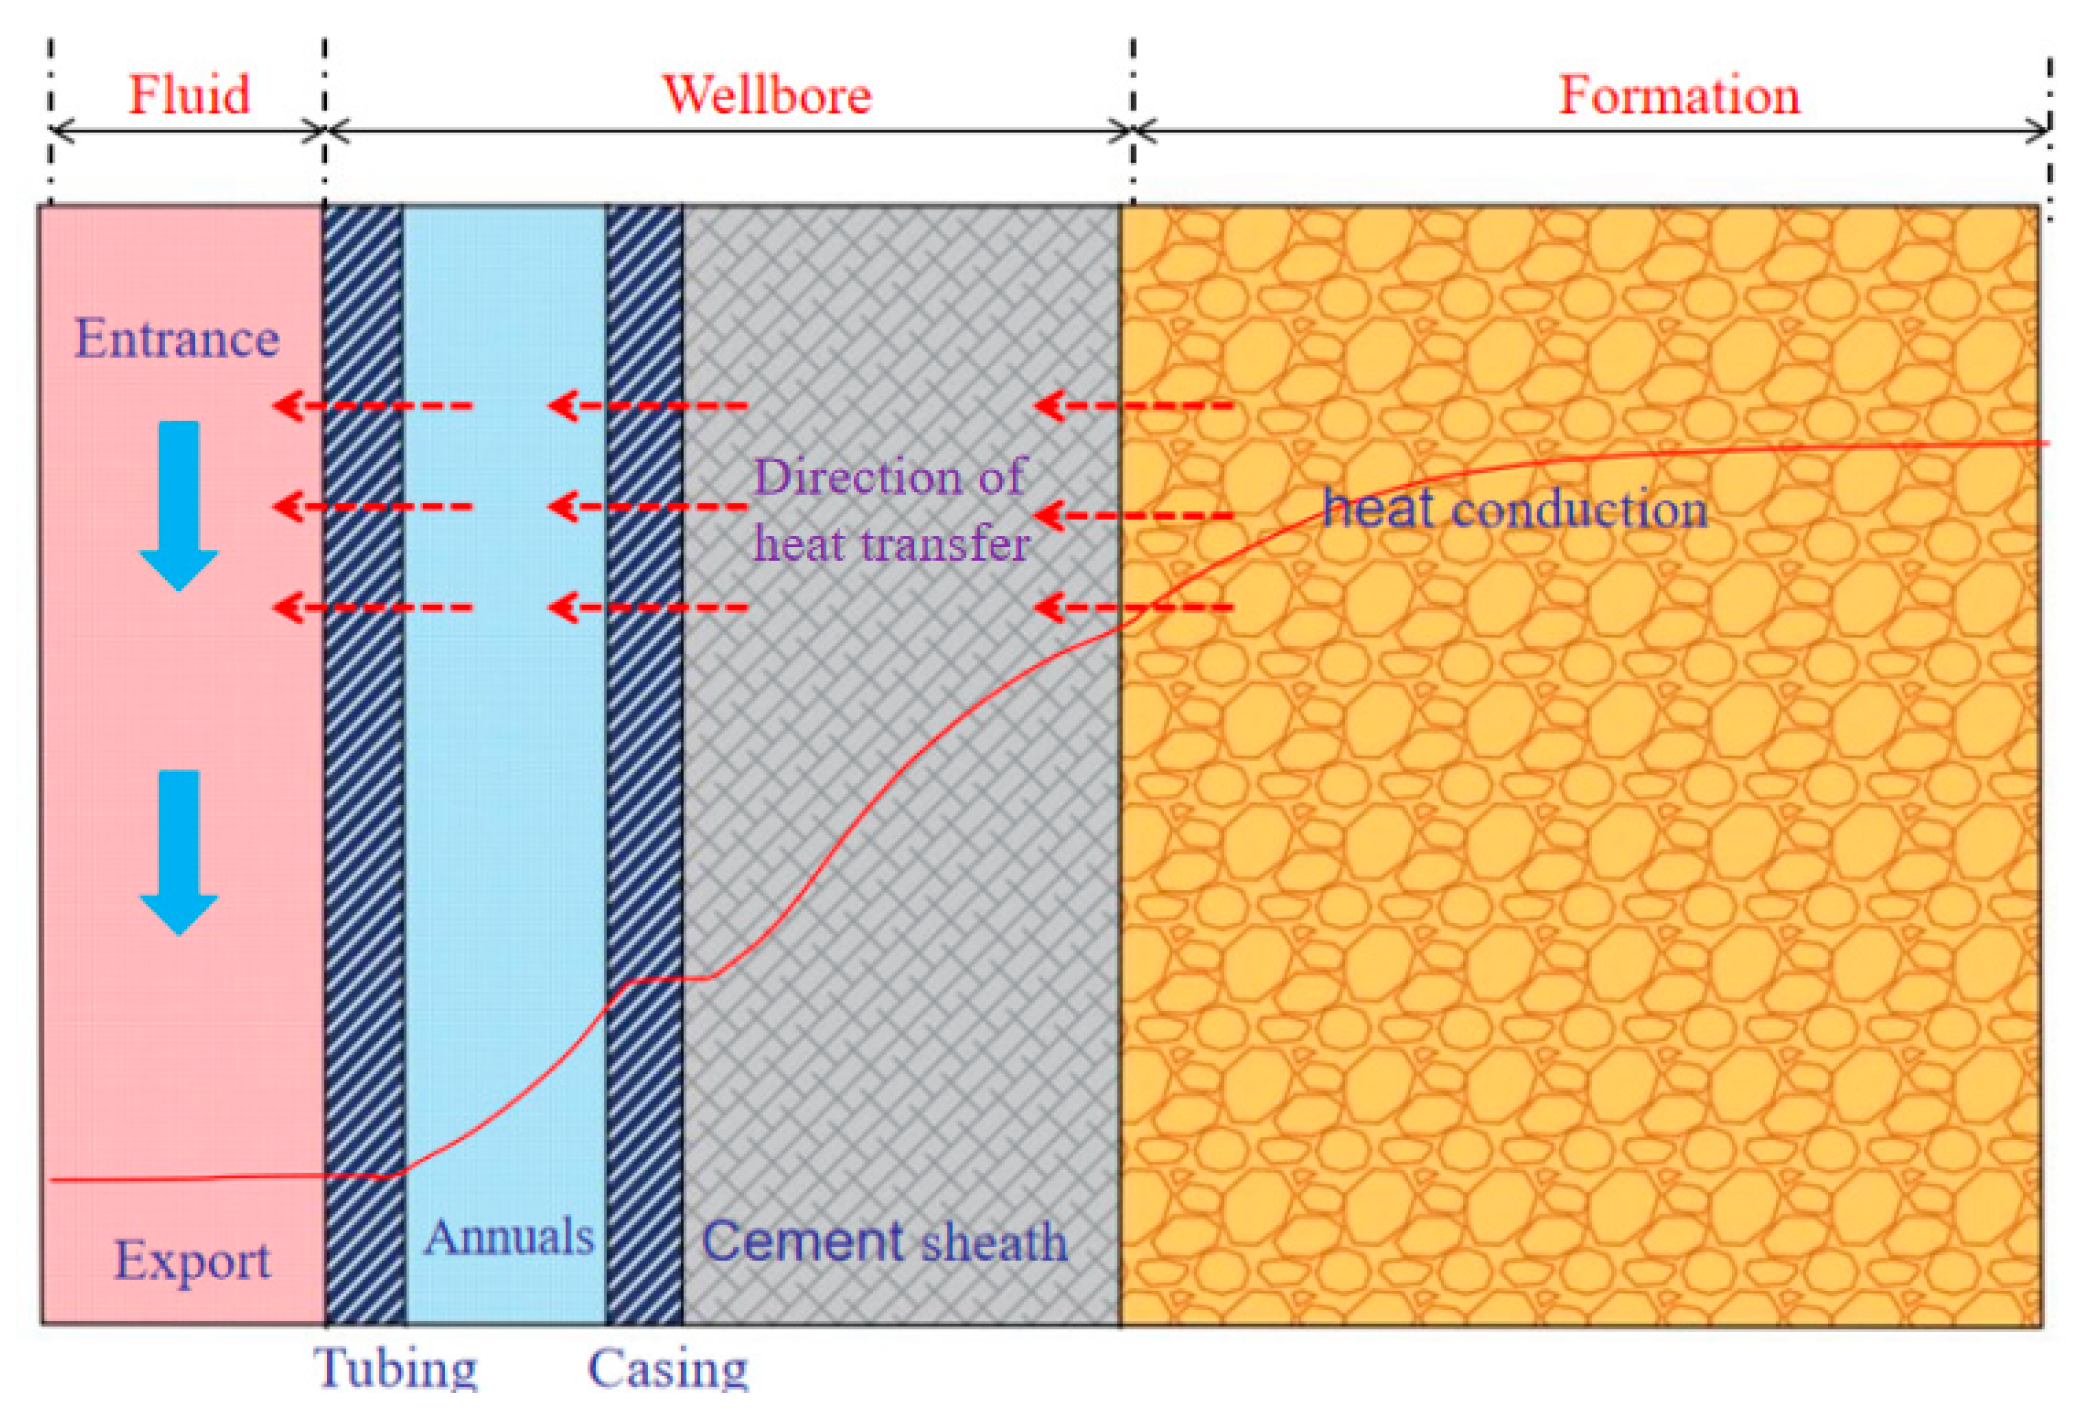
The heat that occurs during the injection of CO2 is divided into three processes: the forced convection heat transfer process generated during the top-down flow of CO2 in the wellhead; the heat conduction process; and the heat transfer process of the air sleeve ring, cement ring, and formation. A model diagram of the injection well is shown in Figure 6. CO2 The flow and heat transfer processes after fluid injection are shown in Figure 7.
In the micro-element stage of injecting the CO2 tubular string, the mass conservation equation of the CO2 flow is:
ρ m d v d h + v d ρ m d h = 0
The conservation of the energy equation is:
d [ ρ m v ε + 1 2 v 2 ] d h = ρ v g sin ( θ ) d ( ρ m v ) d h d Q S d h
where ɛ is the CO2 fluid internal energy per unit mass, m2/s2, and S is the cross-sectional area of the tube tubular string, m2.
Heat transfer is divided into two parts, from the formation to the cement ring. Each casing layer pipes CO2 fluid through the tubular string. The radial heat change in any micro-element in the tubular string can be expressed as:
d Q = 2 π r y o U t o T l T s o w d h
where ryo is the outer diameter of the tubular string, m, and Uto is the total heat transfer coefficient of heat from the tubular string to CO2 fluid, W / m · ° C . Tl is the temperature of the CO2 fluid, °C; Tso is the temperature of the outer edge of the cement ring, °C; ω is the mass flow of the CO2 fluid, kg/s.
The expression of the heat change from the outer edge of the cement ring to the formation can be expressed as follows:
d Q = 2 π λ e T s o T e f t D d h
The temperature at the edge of the cement ring is equal to the formation temperature, that is T s o = T e = T b + t a · z ; T b is the surface temperature.
Suppose that the heat transfer mode from the tubular string system to the heat fluid in the oil pipe is a steady-state heat transfer and the heat transfer mode between the formation and the tubular string system is an unsteady state [39].
The cashing and the cement ring touch each other, simplifying the calculation needed to establish a single-layer casing and a single-layer cement ring model, n, at the well’s depth. Using the rn radius calculation, the CO2 drive injection tubular string temperature at this point can be expressed as:
T n = T n s o + r y o U t o ( T l T n s o ) r n U n o
where Tn is the temperature of the well depth at n and the radius at rn, °C; Tnso is the temperature at the outer edge of the cement ring at the well depth n m; Uno is the heat transfer coefficient from the point to the cement ring, W/(m·°C).
After considering the enthalpy change in CO2 fluid, the enthalpy gradient from the energy conservation equation can be expressed as:
d H d h = C p c d T l d h η C p c d p d h
where Cpc is the constant pressure specific heat capacity of the CO2 fluid, J/(kg·°C).
The CO2 heat transfer equation for CO2 in the tube tubular string according to Formulas (10), (12) and (14) is:
d T l d h = η d p d h + ρ m v g sin ( θ ) C p c v C p c · d v d h 1 C p c · d Q S d h

2.3. Pressure Drop Model

For the energy conservation analysis of the CO2 injection tubular string, the pressure drop equation for the CO2 fluid flowing downward in the tubular string is:
d p d h = ρ m g sin θ ρ m v d v d h f ρ m v 2 2 d
where ρm is the density of the CO2 fluid in the tubular string, kg/m3 and v is the flow rate of the CO2 in the tubular string, m/s.
During CO2 injection, the CO2 pressure loss along the axis of the tubular string mainly comprises the pressure drop generated by gravitational potential energy, the pressure drop generated by the acceleration of CO2 fluid transfer, and the pressure drop generated by the contact friction between the CO2 fluid flow and the injection tubular string. CO2 The pressure drop generated by the fluid gravitational potential energy is:
E 1 = ρ m g sin ( θ )
The pressure drop resulting from the friction is as follows:
E 2 = f ρ m v 2 2 d
The pressure drop resulting from the fluid mass transfer acceleration is as follows:
E 3 = ρ m v 2 p d p d h
The mathematical model of CO2 fluid pressure drop from Formulas (17)–(19) is as follows:
d p d h = ρ m g sin ( θ ) f ρ m v 2 2 d 1 ρ m v 2 p
CO2 The volume of the annular space, the average temperature of the annular space and the mass of the annular space and the annulus pressure are as follows:
Δ p = α l k T Δ T 1 k T V a n n Δ V a n n + 1 k T V 1 Δ V 1
where ΔVnn is the annular volume variation, m3; kT is the annular liquid isothermal compression coefficient, MPa−1; ΔT is the average casing air temperature difference, °C; αl is the annular liquid thermal expansion coefficient, °C−1; ΔV1 is the annular liquid volume variation, m; Vnn is the annular volume, m3; and V1 is the annular liquid volume, m3. Since there is no material exchange with the outside world, ΔV1 = 0 can be solved, and the closed-ring air pressure can be calculated as follows:
Since there is no material exchange with the outside world, ΔV1 = 0 can be obtained, and the closed-ring air pressure is calculated as follows:
Δ p = α l k T Δ T 1 k T V a n n Δ V a n n
According to the above derivation process, the CO2 fluid flow rate, density, and pressure and temperature-coupled equations can be obtained from Equation (15):
d v d h = v d ρ m ρ m d h d p d h = ρ m g sin ( θ ) f ρ m v 2 2 d 1 ρ m v 2 p d T l d h = η d p d h + ρ m v g sin ( θ ) C p c v C p c · d v d h 1 C p c · 2 π r t o U t o ( T l T b z · t a ) w S
Wellhead injection parameters are known conditions when predicting the tubular string temperature distribution of the CO2 injection process. The initial conditions can be calculated as p h = 0 = p 0 , T l h = 0 = T l 0 , v h = 0 = w c o 2 / S · ρ m 0 , and ρ m h = 0 = ρ m 0 = 28.97 p 0 r g C O 2 / Z R T l 0 , where p0 is the injected pressure and Tl0 is the injection temperature.

2.4. Model Solution

The specific enthalpy gradient (14) is inserted into the energy equation (Equation (8)). Combined with the actual fluid equation of state, the system of equations contains four unknown quantities, namely p, T, v, and ρ. The number of equations is equal to the number of unknown quantities, and the system of equations is closed. In addition, the solution conditions can calculate the distribution of the fluid pressure, temperature, flow rate and density along the well depth. We can mark the unknown quantity (p, T, v, and ρ) as y i ( i = 1 , 2 , 3 , 4 ) . The system of equations can be the corresponding gradient equation form; Fi is the right function.
d y i d h = F i h , y 1 , y 2 , y 3 , y 4 ( i = 1 , 2 , 3 , 4 )
The function value of the starting point position is h0; as with yi0, the step length is χ. The solution at the node of h1 = h0 + χ can be expressed as
y i 1 = y i 0 + h 6 a i + 2 b i + 2 c i + d i ( i = 1 , 2 , , 3 , 4 ) a i = F i h 0 , y 1 0 , y 2 0 , y 3 0 , y 4 0 b i = F i h 0 + χ 2 , y 1 0 + χ 2 a 1 , y 2 0 + χ 2 a 2 , y 3 0 + χ 2 a 3 , y 4 0 + χ 2 a 4 c i = F i h 0 + χ 2 , y 1 0 + χ 2 b 1 , y 2 0 + χ 2 h 2 , y 3 0 + χ 2 b 3 , y + 0 + χ 2 h 4 d i = F i h 0 + χ , v 1 0 + χ c 1 , y 2 0 + χ c 2 , y 3 + χ c 3 , y 4 0 + χ c 4

3. Model Validation

For an example analysis of the G66X1 well in a certain oilfield, refer to Table 2 for the basic data of the example well.
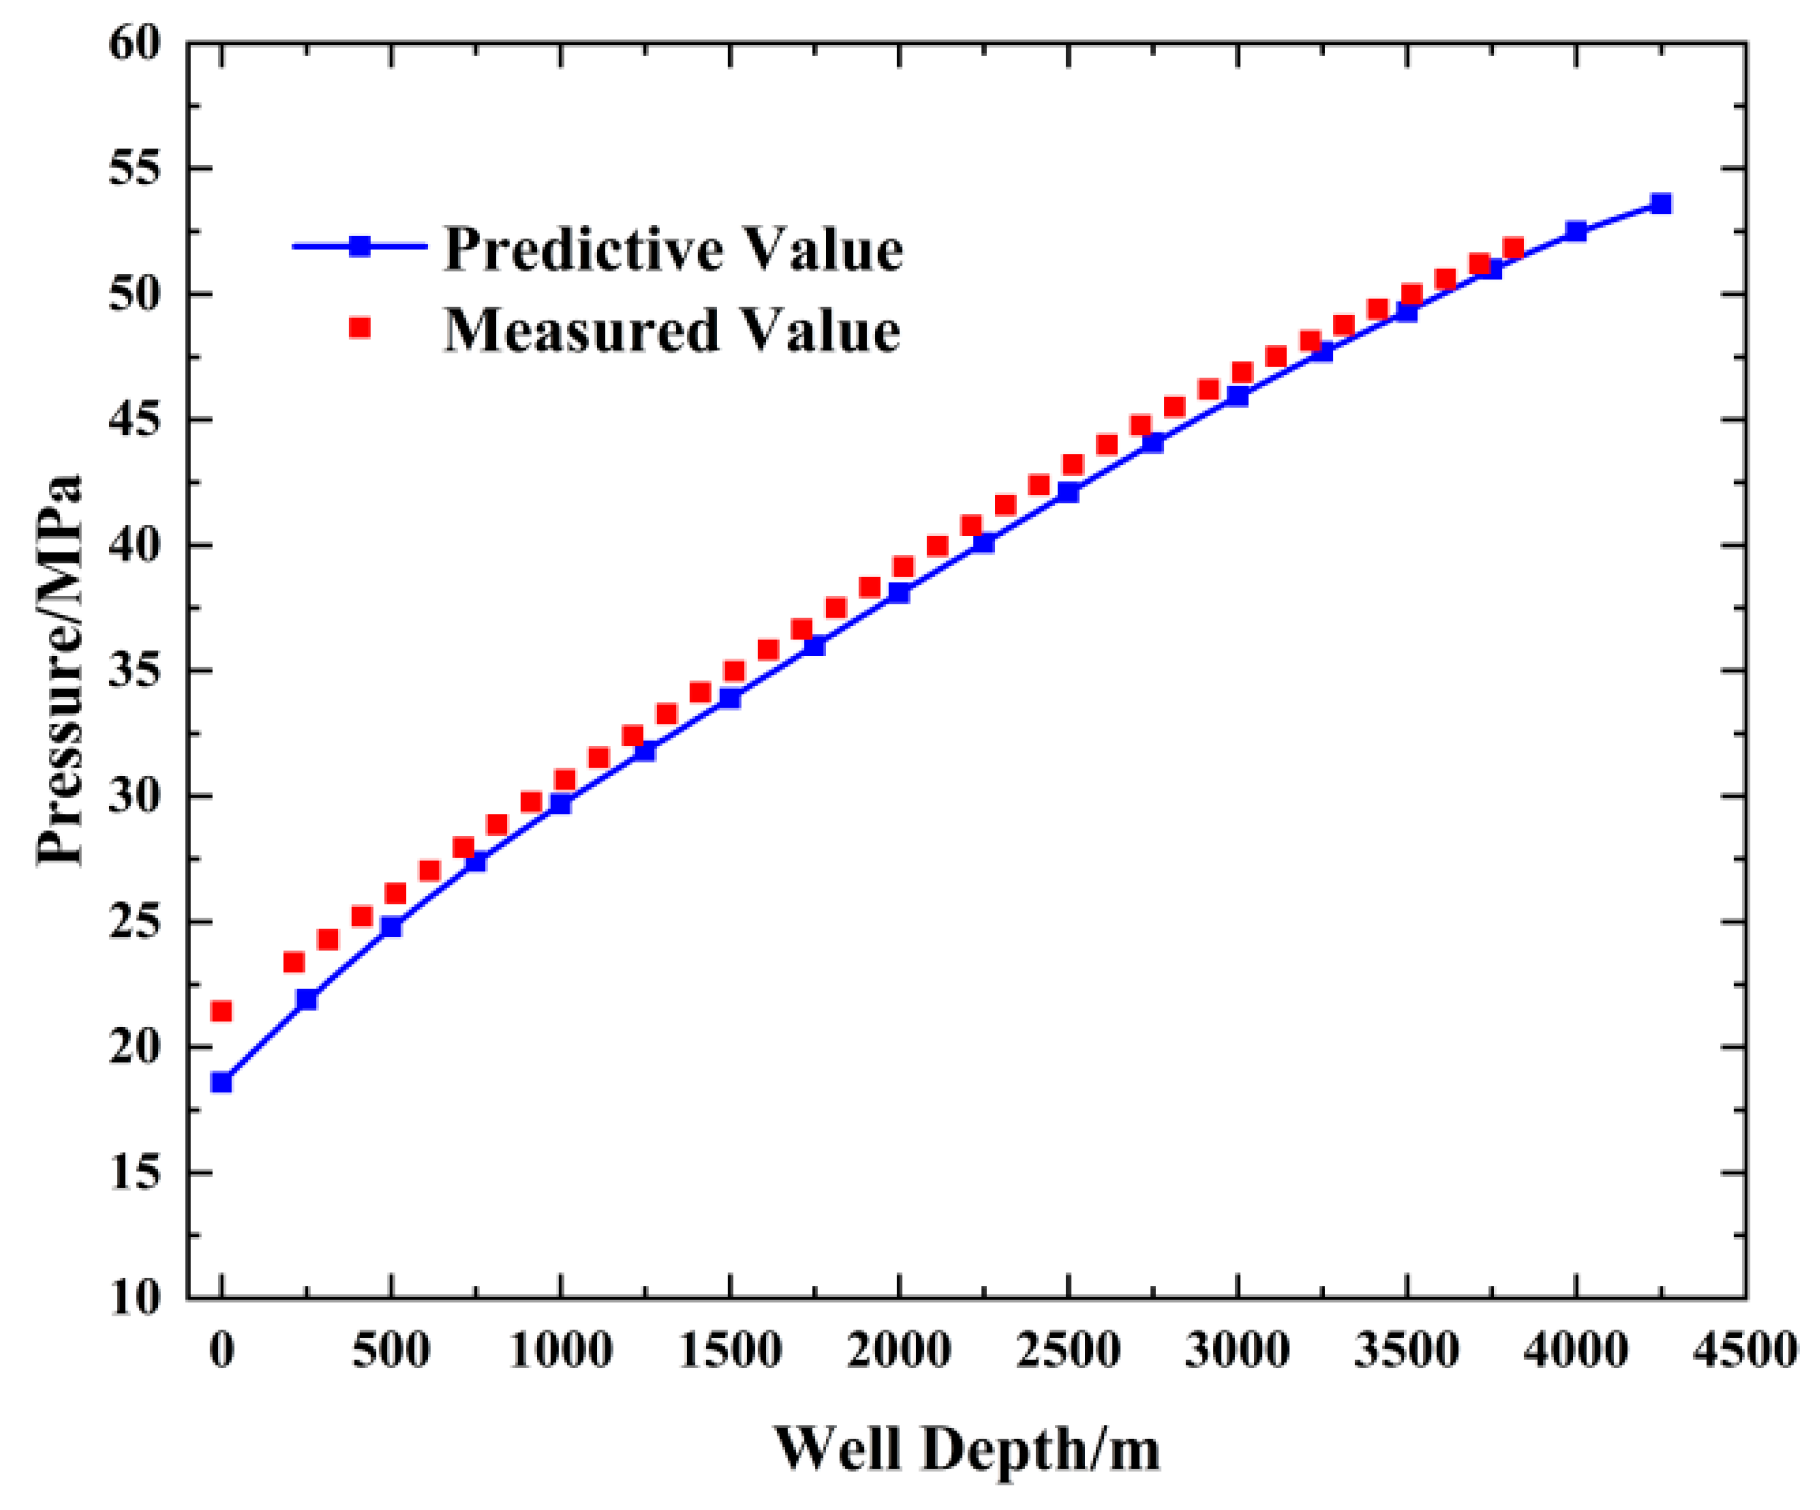
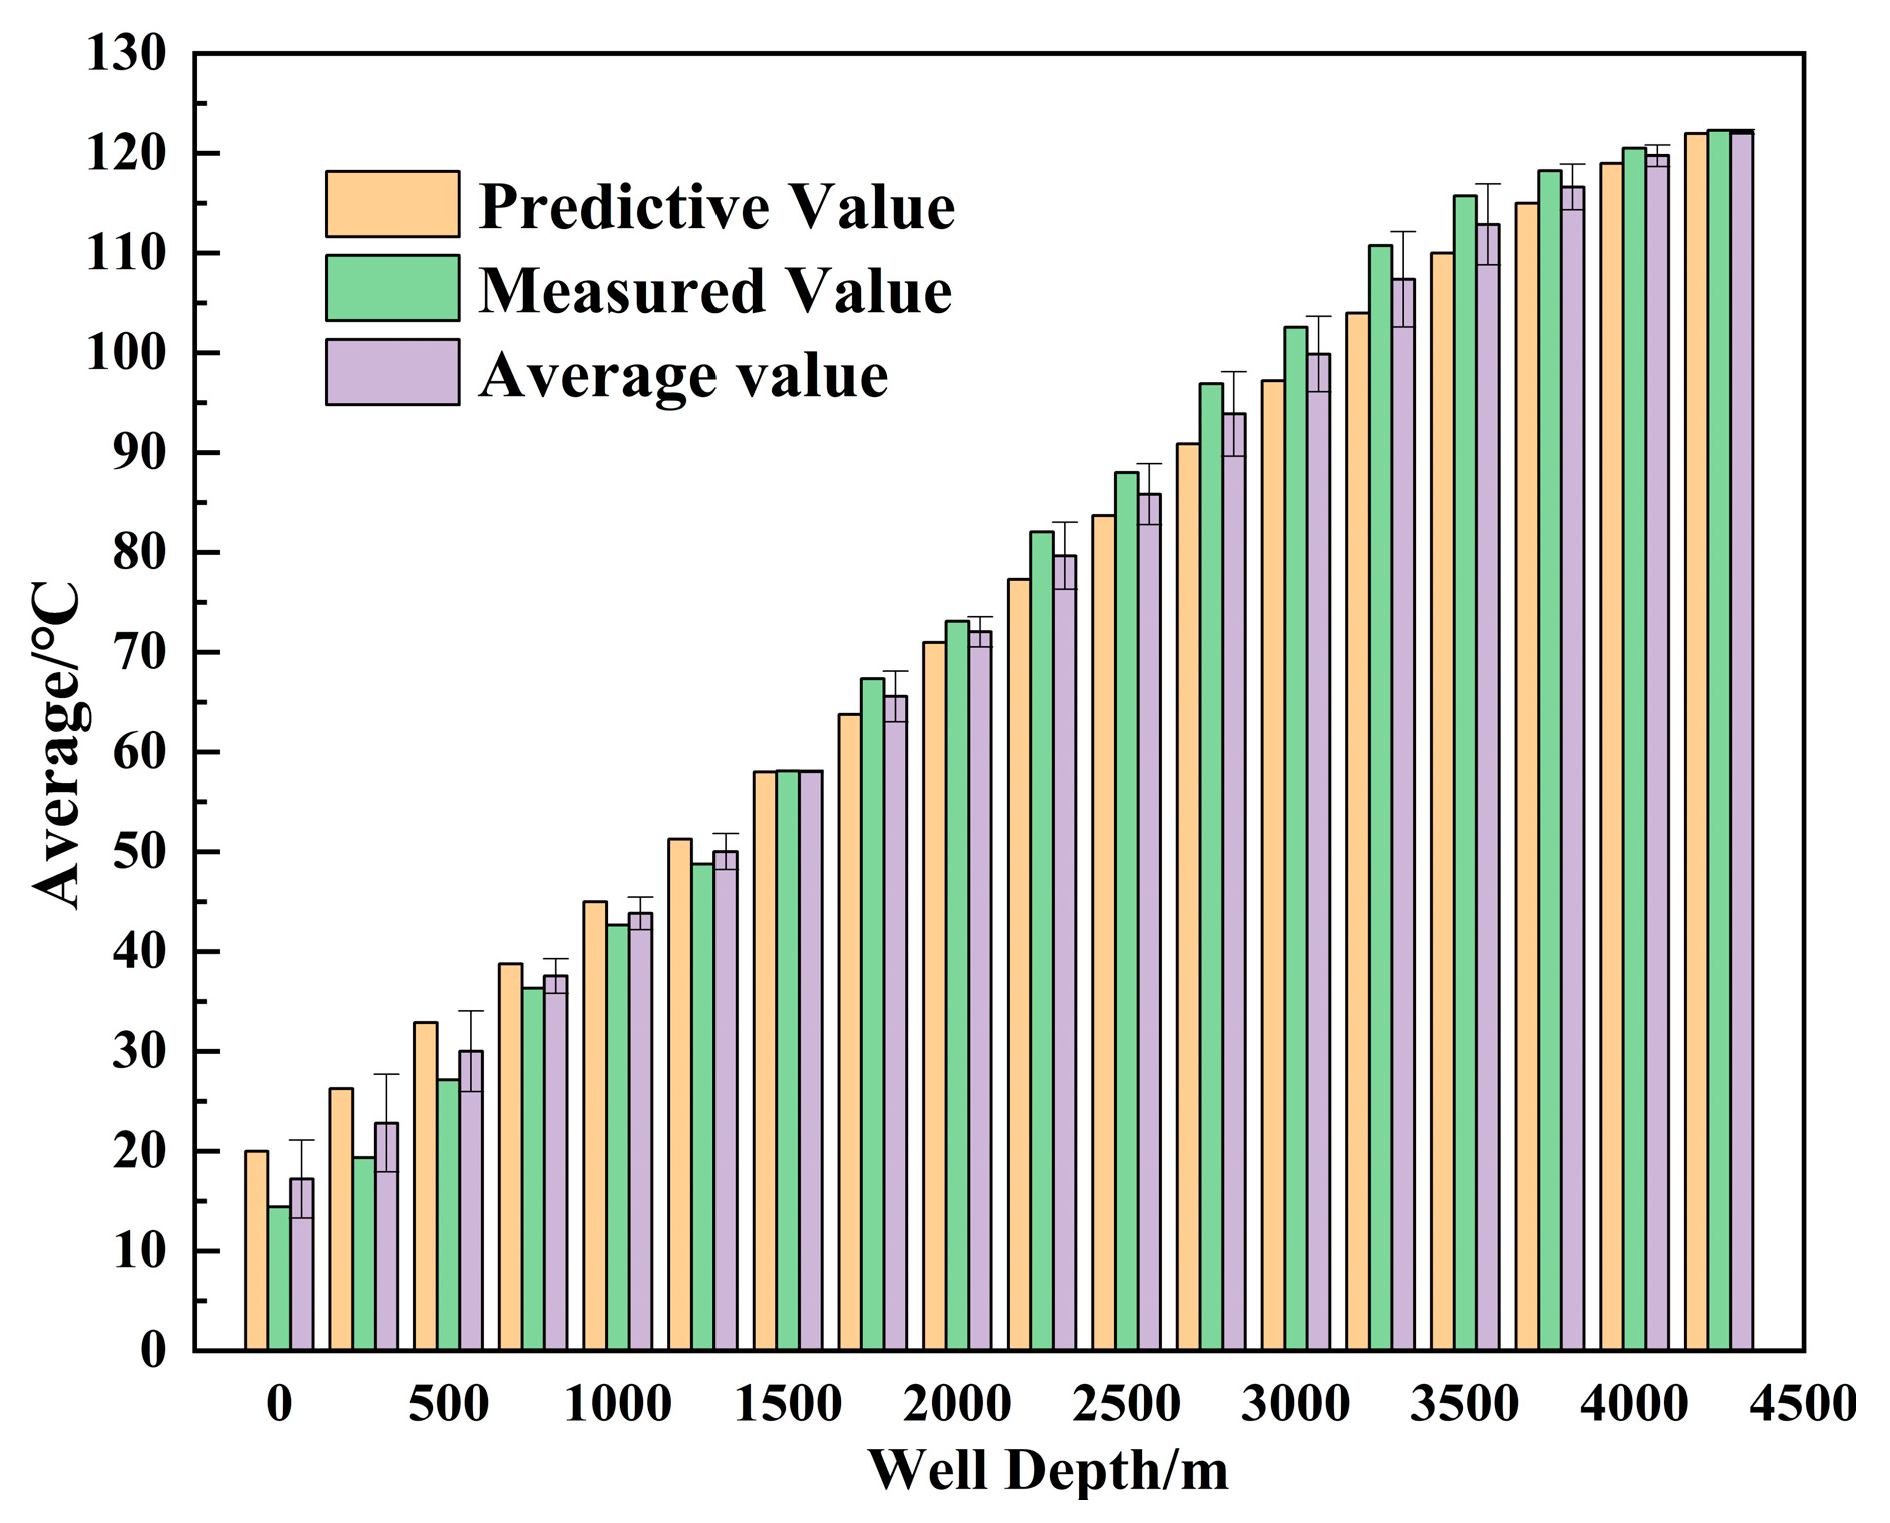
According to the model built in Section 1, the pipe temperature and pressure change along the well depth, and we can compare the predicted value with the measured value. The results are shown in Figure 8 and Figure 9. The predicted value is consistent with the field-measured value in which the maximum error of the predicted temperature is 4.1% and the maximum error of the measured value is 2.3%.
The uncertainties in the established model were measured, and the causes of errors were analyzed. Error plots were generated, as shown in Figure 10 and Figure 11. According to the change in string temperature along the well depth and the analysis of the measured and predicted values, the average deviation is 3.6524 and the standard deviation is 0.89474. Throughout the string, pressure changes along the well depth. According to the analysis of the measured value and predicted value, the average deviation is 1.9487 and the standard deviation is 0.68628.
The causes of the error are as follows: considering the particularity of the CO2 fluid, the model first analyzes the physical parameters of CO2 and then establishes and solves the temperature field pressure field model; the actual situation is complicated, and the measured data are biased. The inaccurate parameter estimation process causes deviation. Overall, the dispersion of error is small and the obtained data are stable and highly accurate.

4. Discussion

4.1. Change in the Tubular String Temperature and Pressure with the Injection Temperature

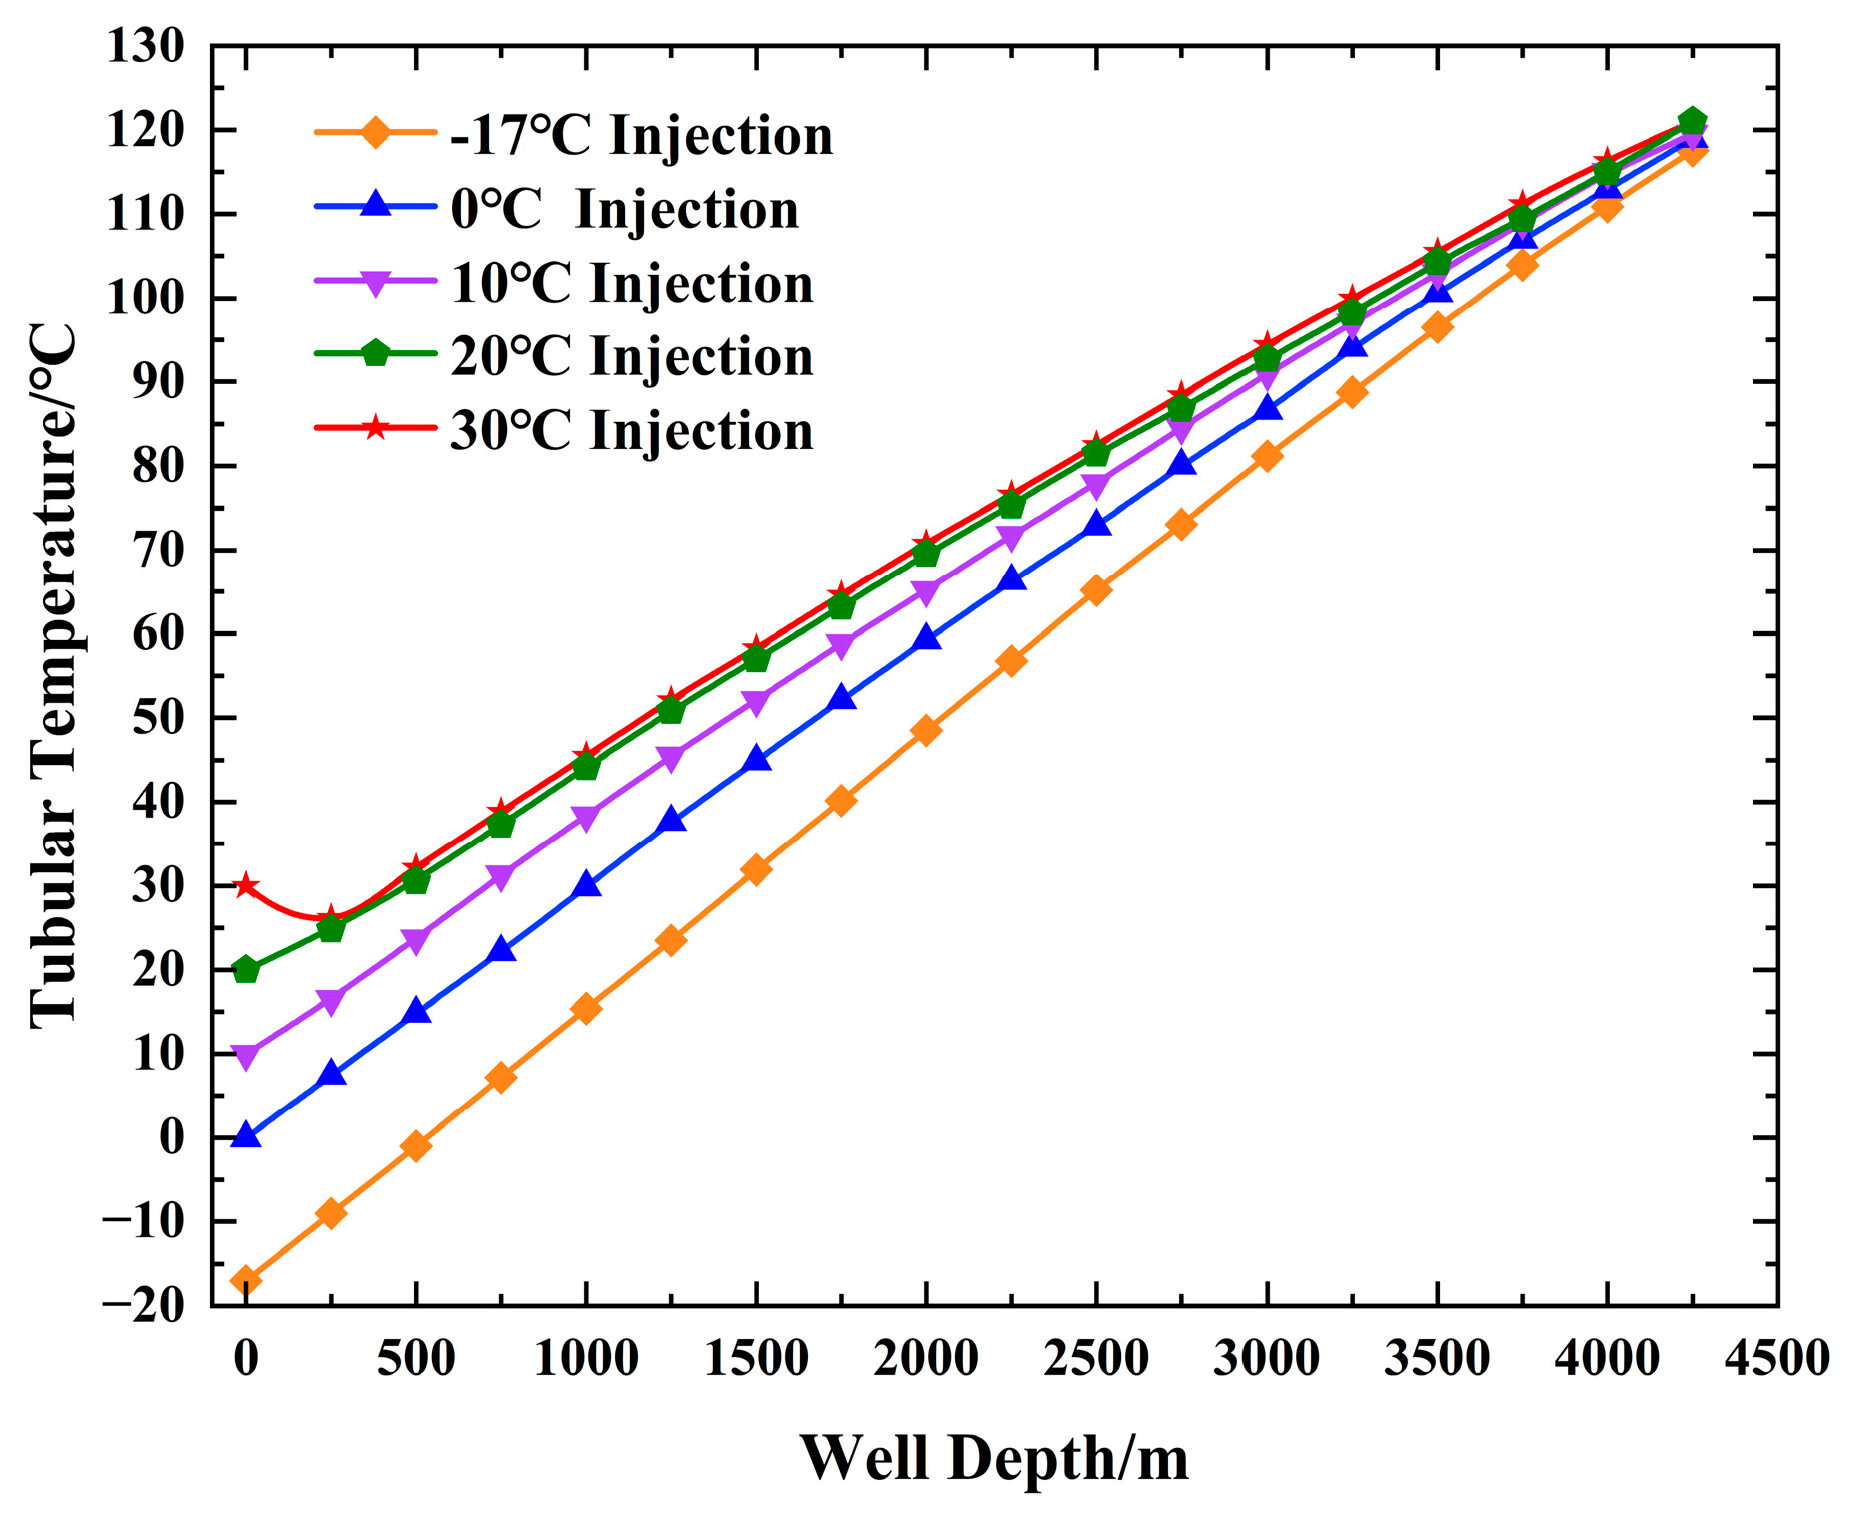
According to Figure 12 and Figure 13, due to the large difference between the formation temperature and the fluid temperature, the CO2 fluid temperature in the pipeline increases linearly near the wellhead; additionally, in the ring air, the bottom of the pipeline is close to the formation temperature, while, up the shaft, the CO2 temperature decreases linearly and the CO2 temperature reduction increases at the wellhead, indicating a significant inflection point. In this example, the CO2 in the tubing is converted into a supercritical state at around 1000 m and the CO2 fluid in the loop air is in a supercritical state at 900 m and below [40].

4.2. Change in Bottom Hole Temperature Pressure with Injection Time (20 °C)

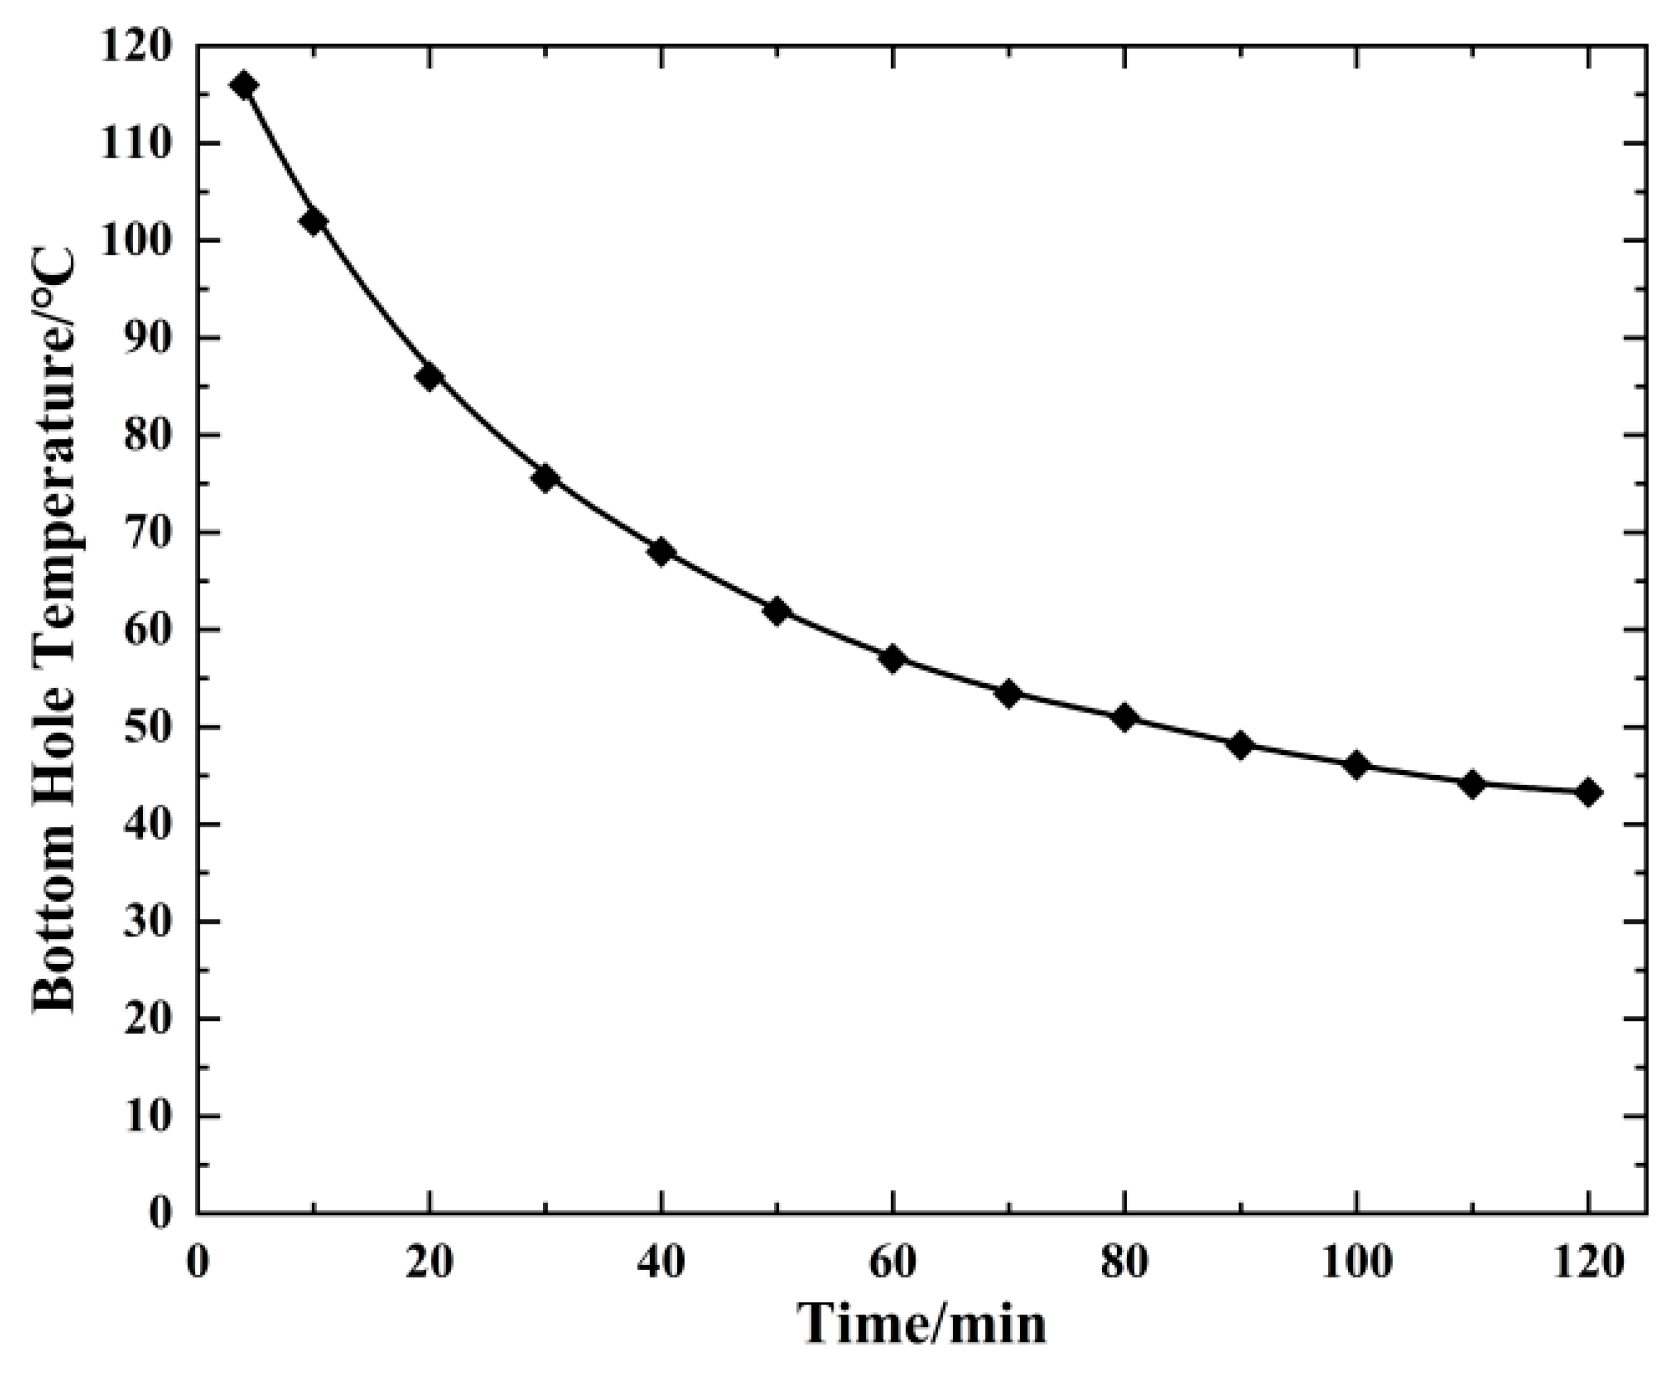
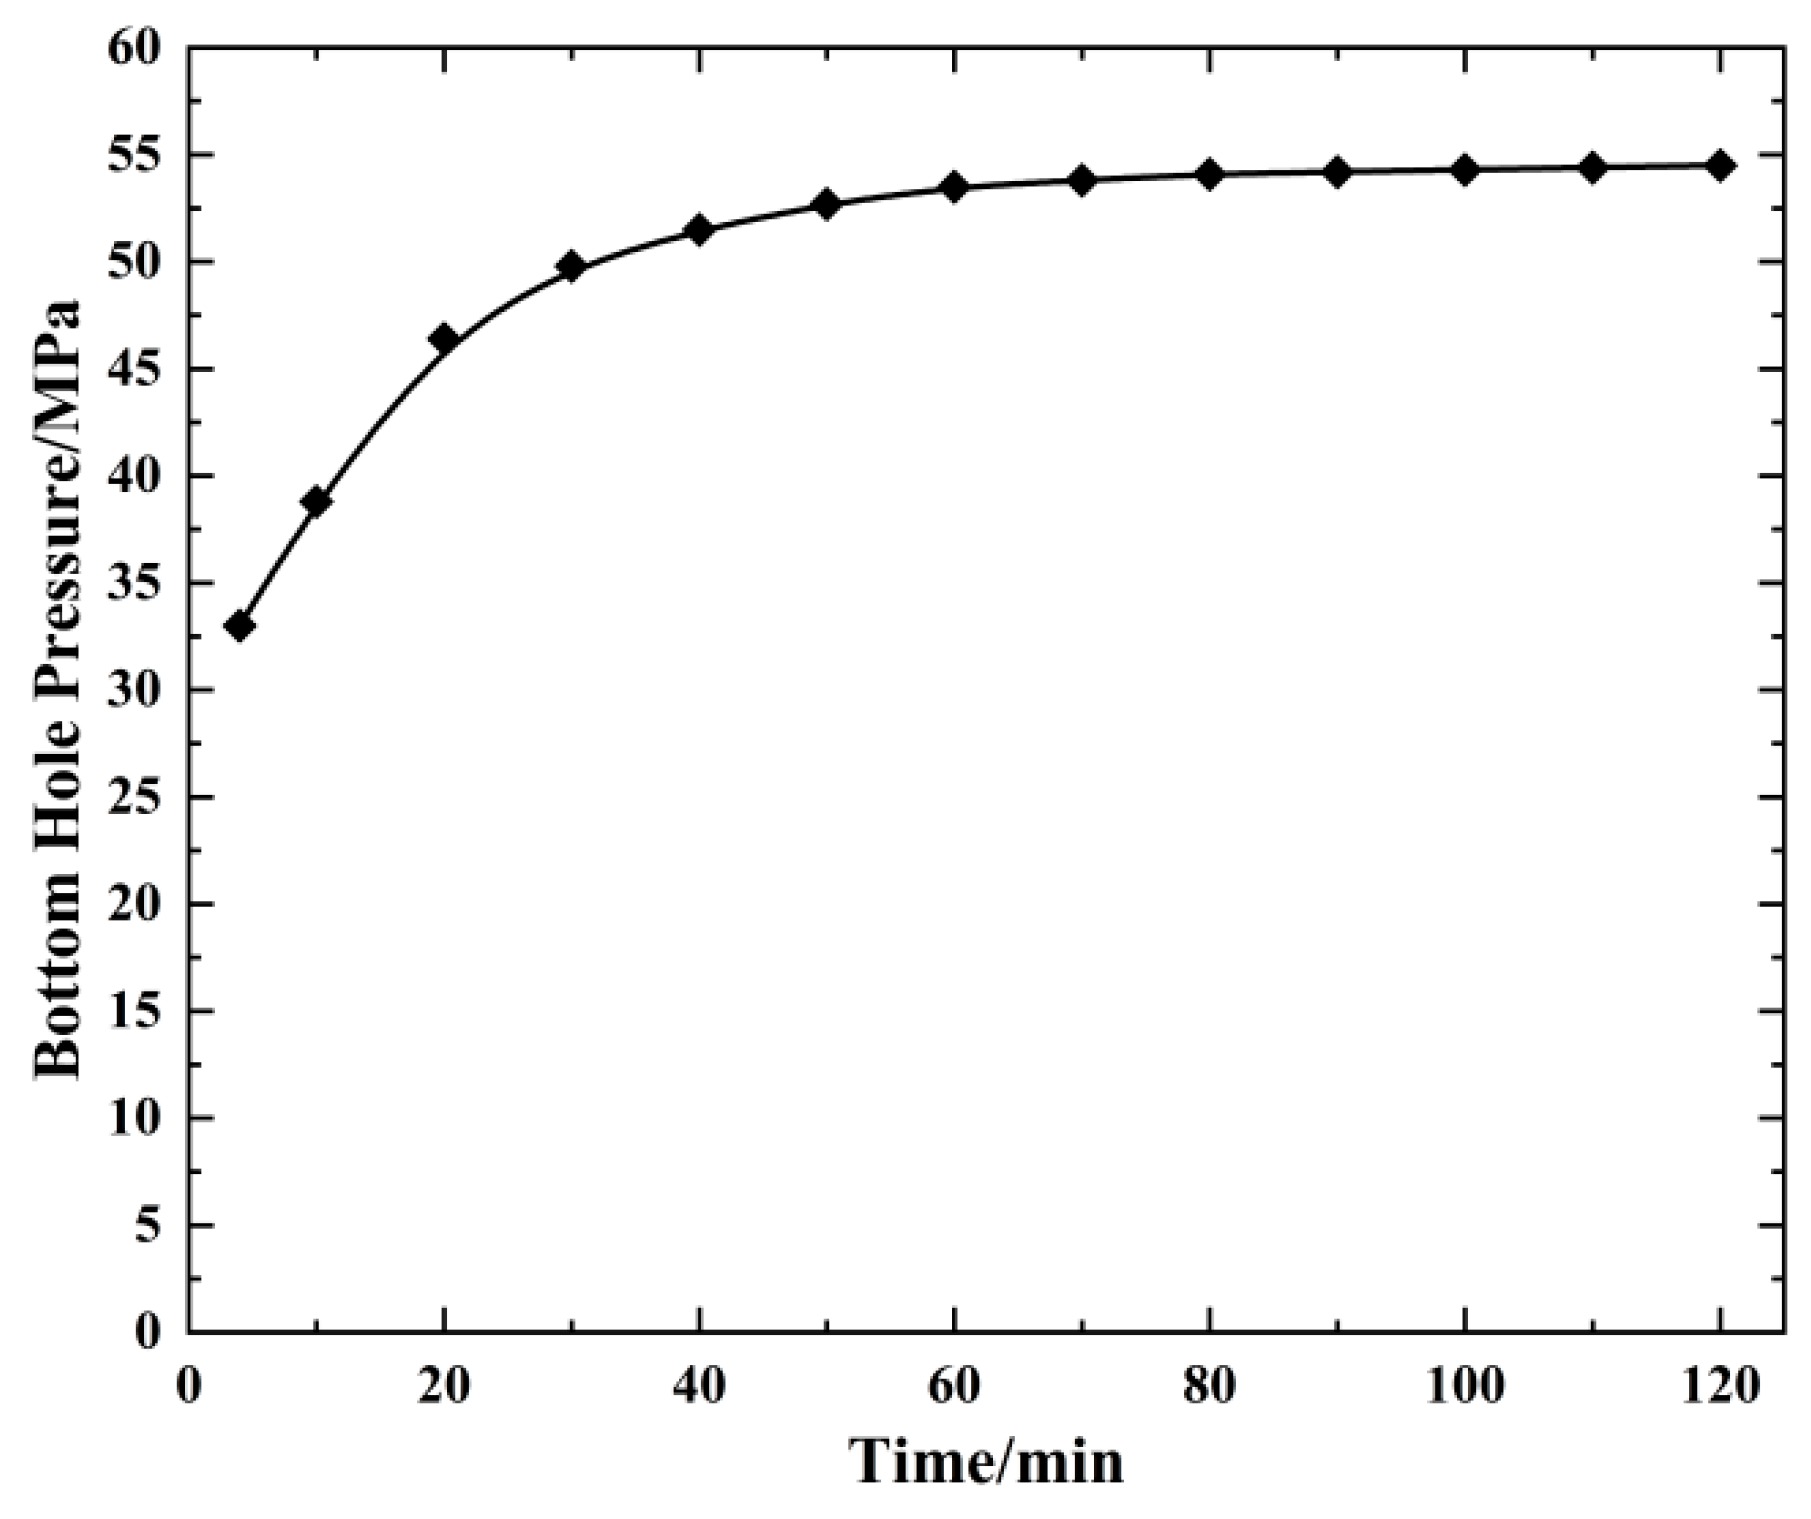
Figure 14 and Figure 15 show that, during pipeline injection construction, the bottom temperature of the well continuously decreases but eventually remains above the critical temperature of 31.1 °C; due to its low critical pressure, the carbon dioxide pumped into the bottom of the well always reaches the supercritical state [41].

4.3. Change in Bottom Hole Temperature and Pressure with Displacement

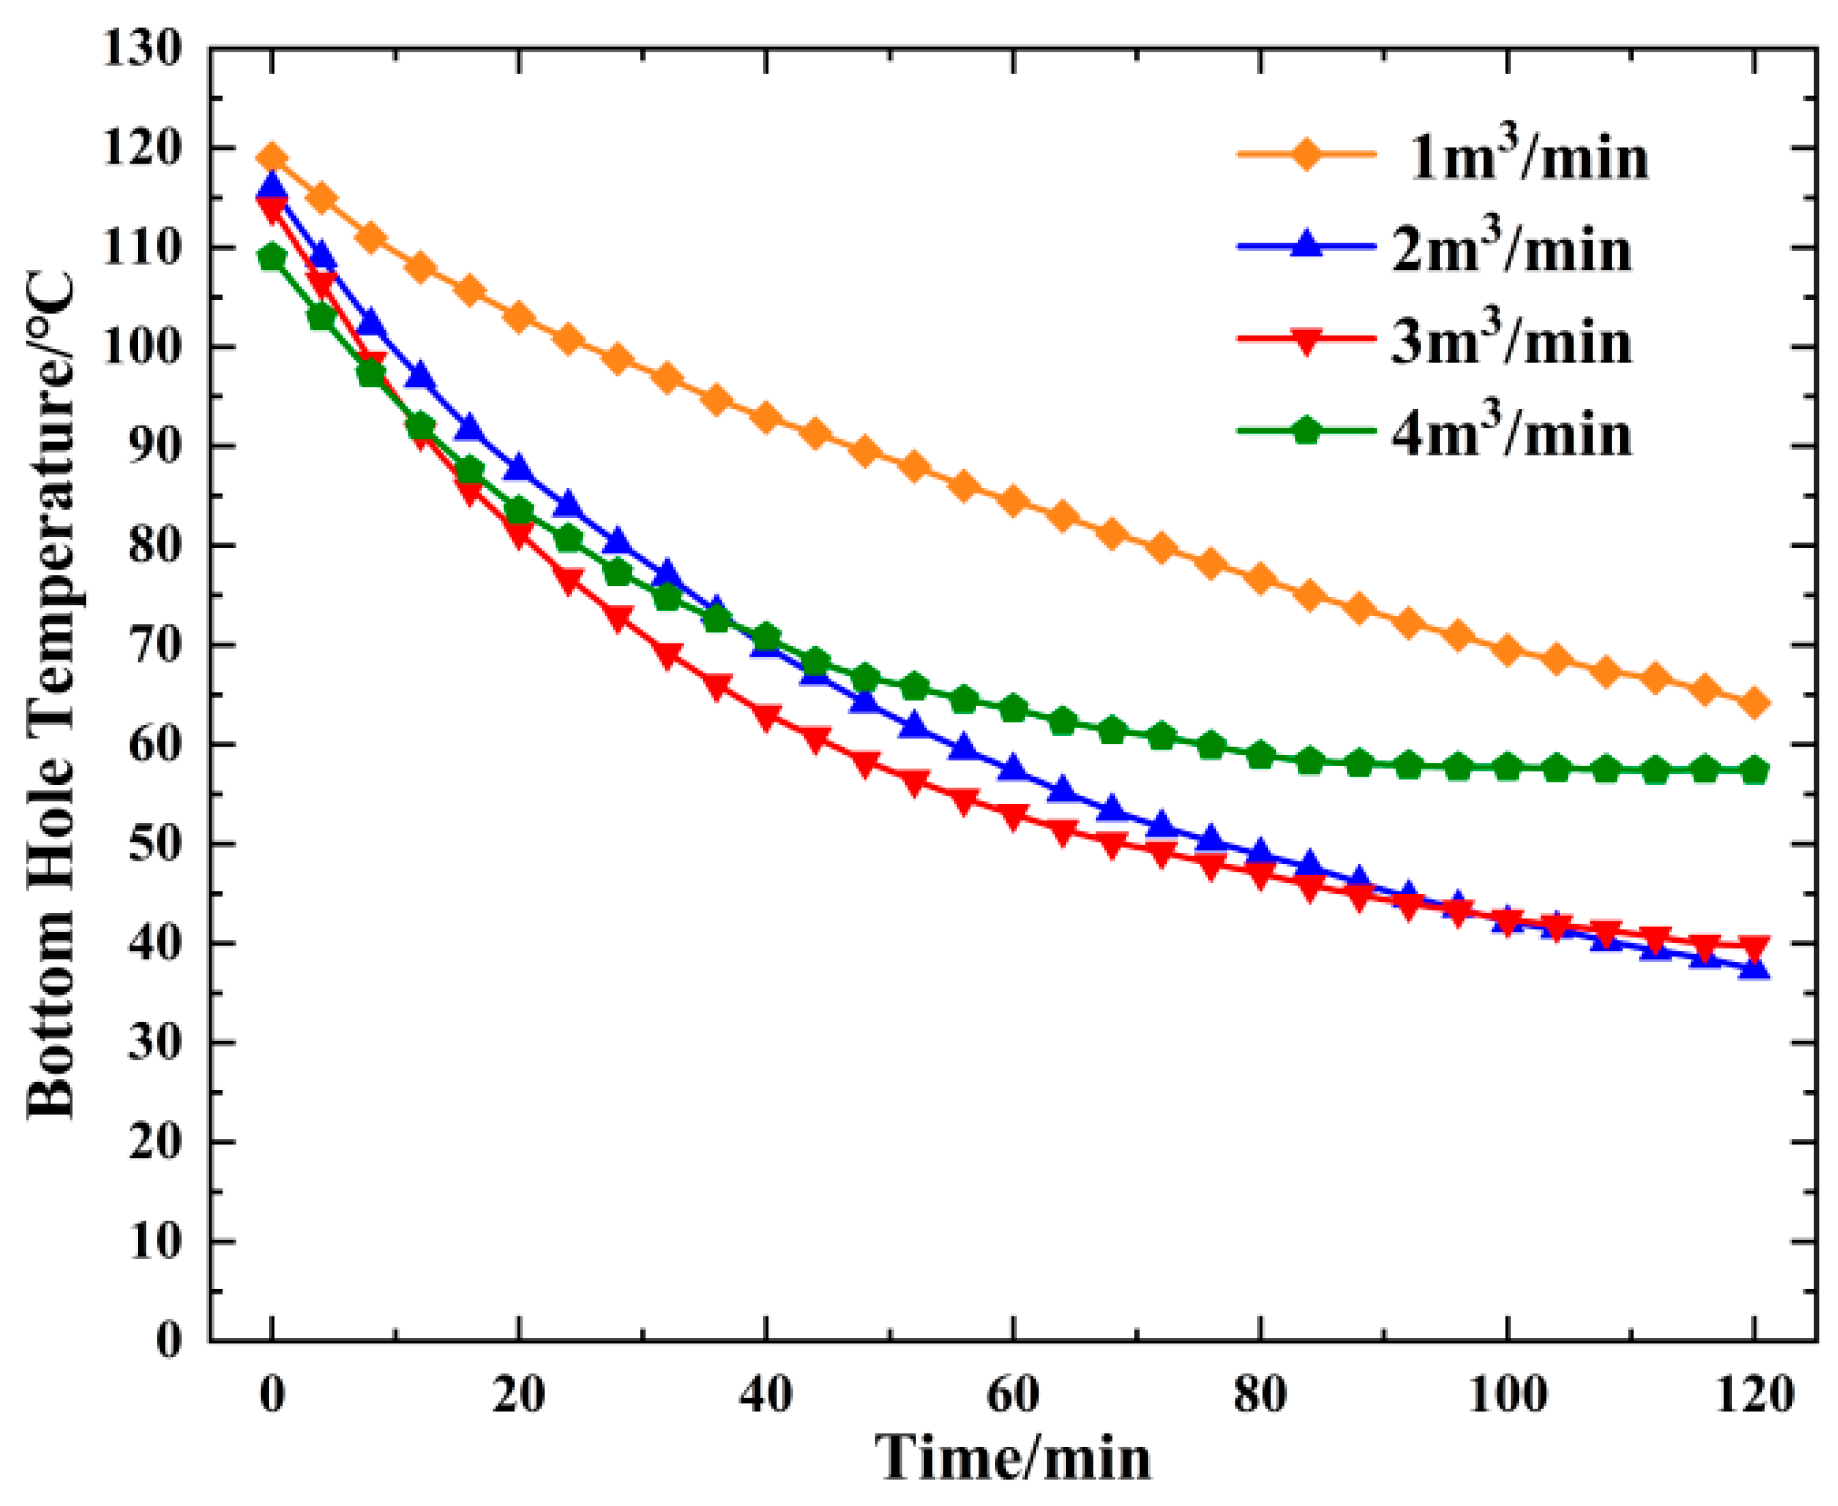
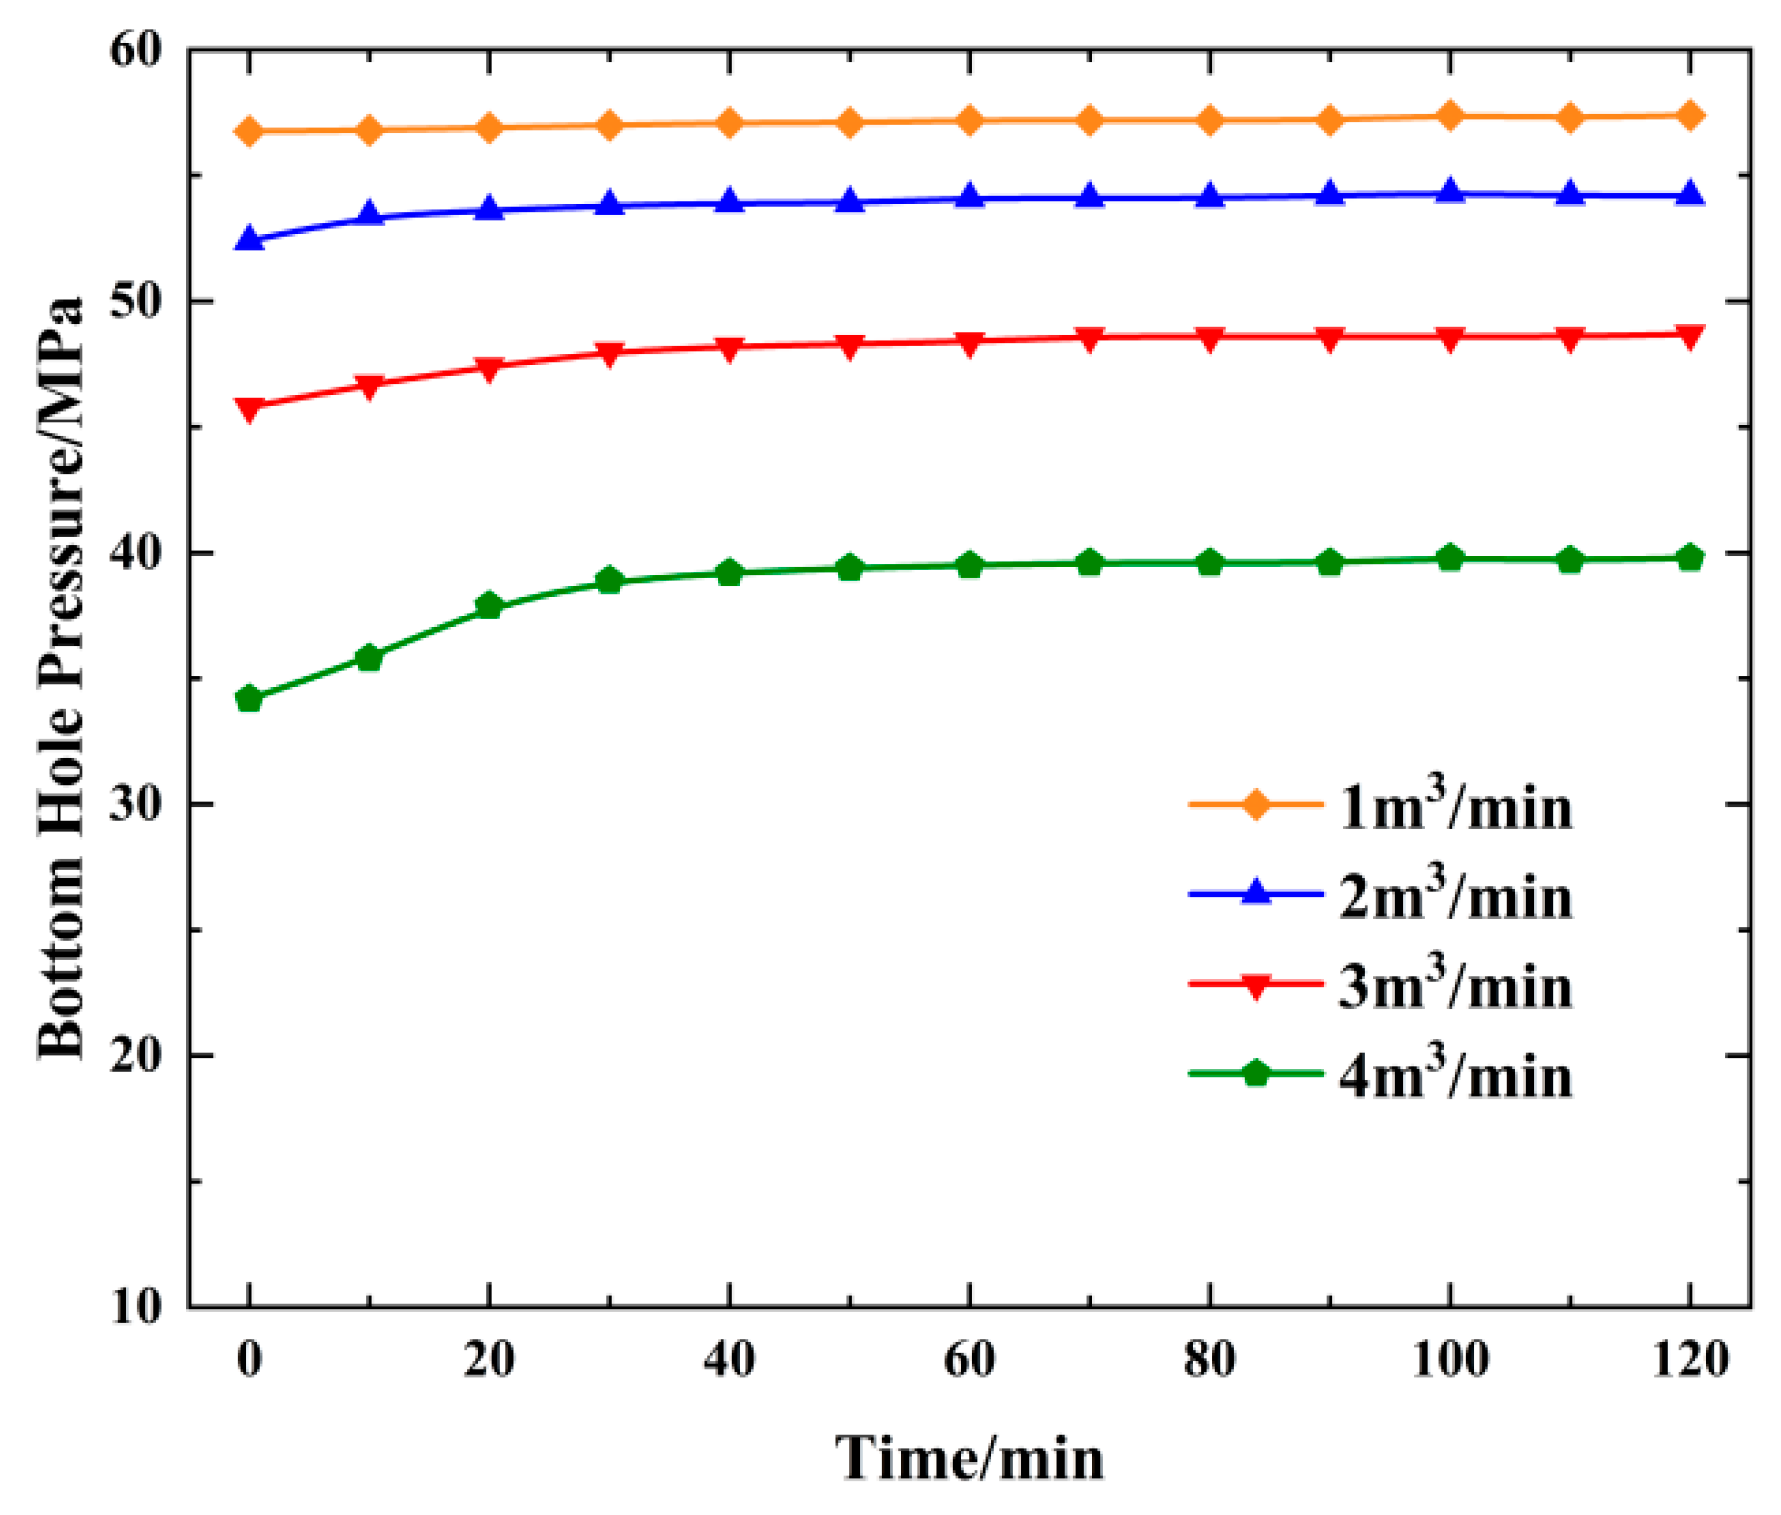
Figure 16 and Figure 17 show that the curves of the bottom hole temperature and pressure change over time when the injection displacement is 1 m3/min, 2 m3/min, 3 m3/min, or 4 m3/min. The figure shows that the larger the injection displacement, the lower the pressure at the bottom for the different displacements. Due to the rapid increase in displacement, the bottom temperature decreases with the increased injection time and the range of temperature changes is obvious. Figure 16 shows that the temperature at the bottom at 4 m3/min of displacement is higher than at 2 m3/min and 3 m3/min. This is because the mechanical energy of the CO2 fluid is converted into an increased amount of internal energy through friction work, increasing the fluid temperature. The larger the displacement, the higher the amount of internal energy conversion that occurs. In the production process, if the displacement continues to increase, the friction resistance will inevitably increase significantly and the required wellhead pump pressure will increase accordingly. Therefore, the bottom hole’s temperature and pressure can be significantly adjusted by reasonably changing the wellhead’s injection displacement [40].

4.4. Change in the Bottom Hole Temperature Pressure with the Injection Pressure

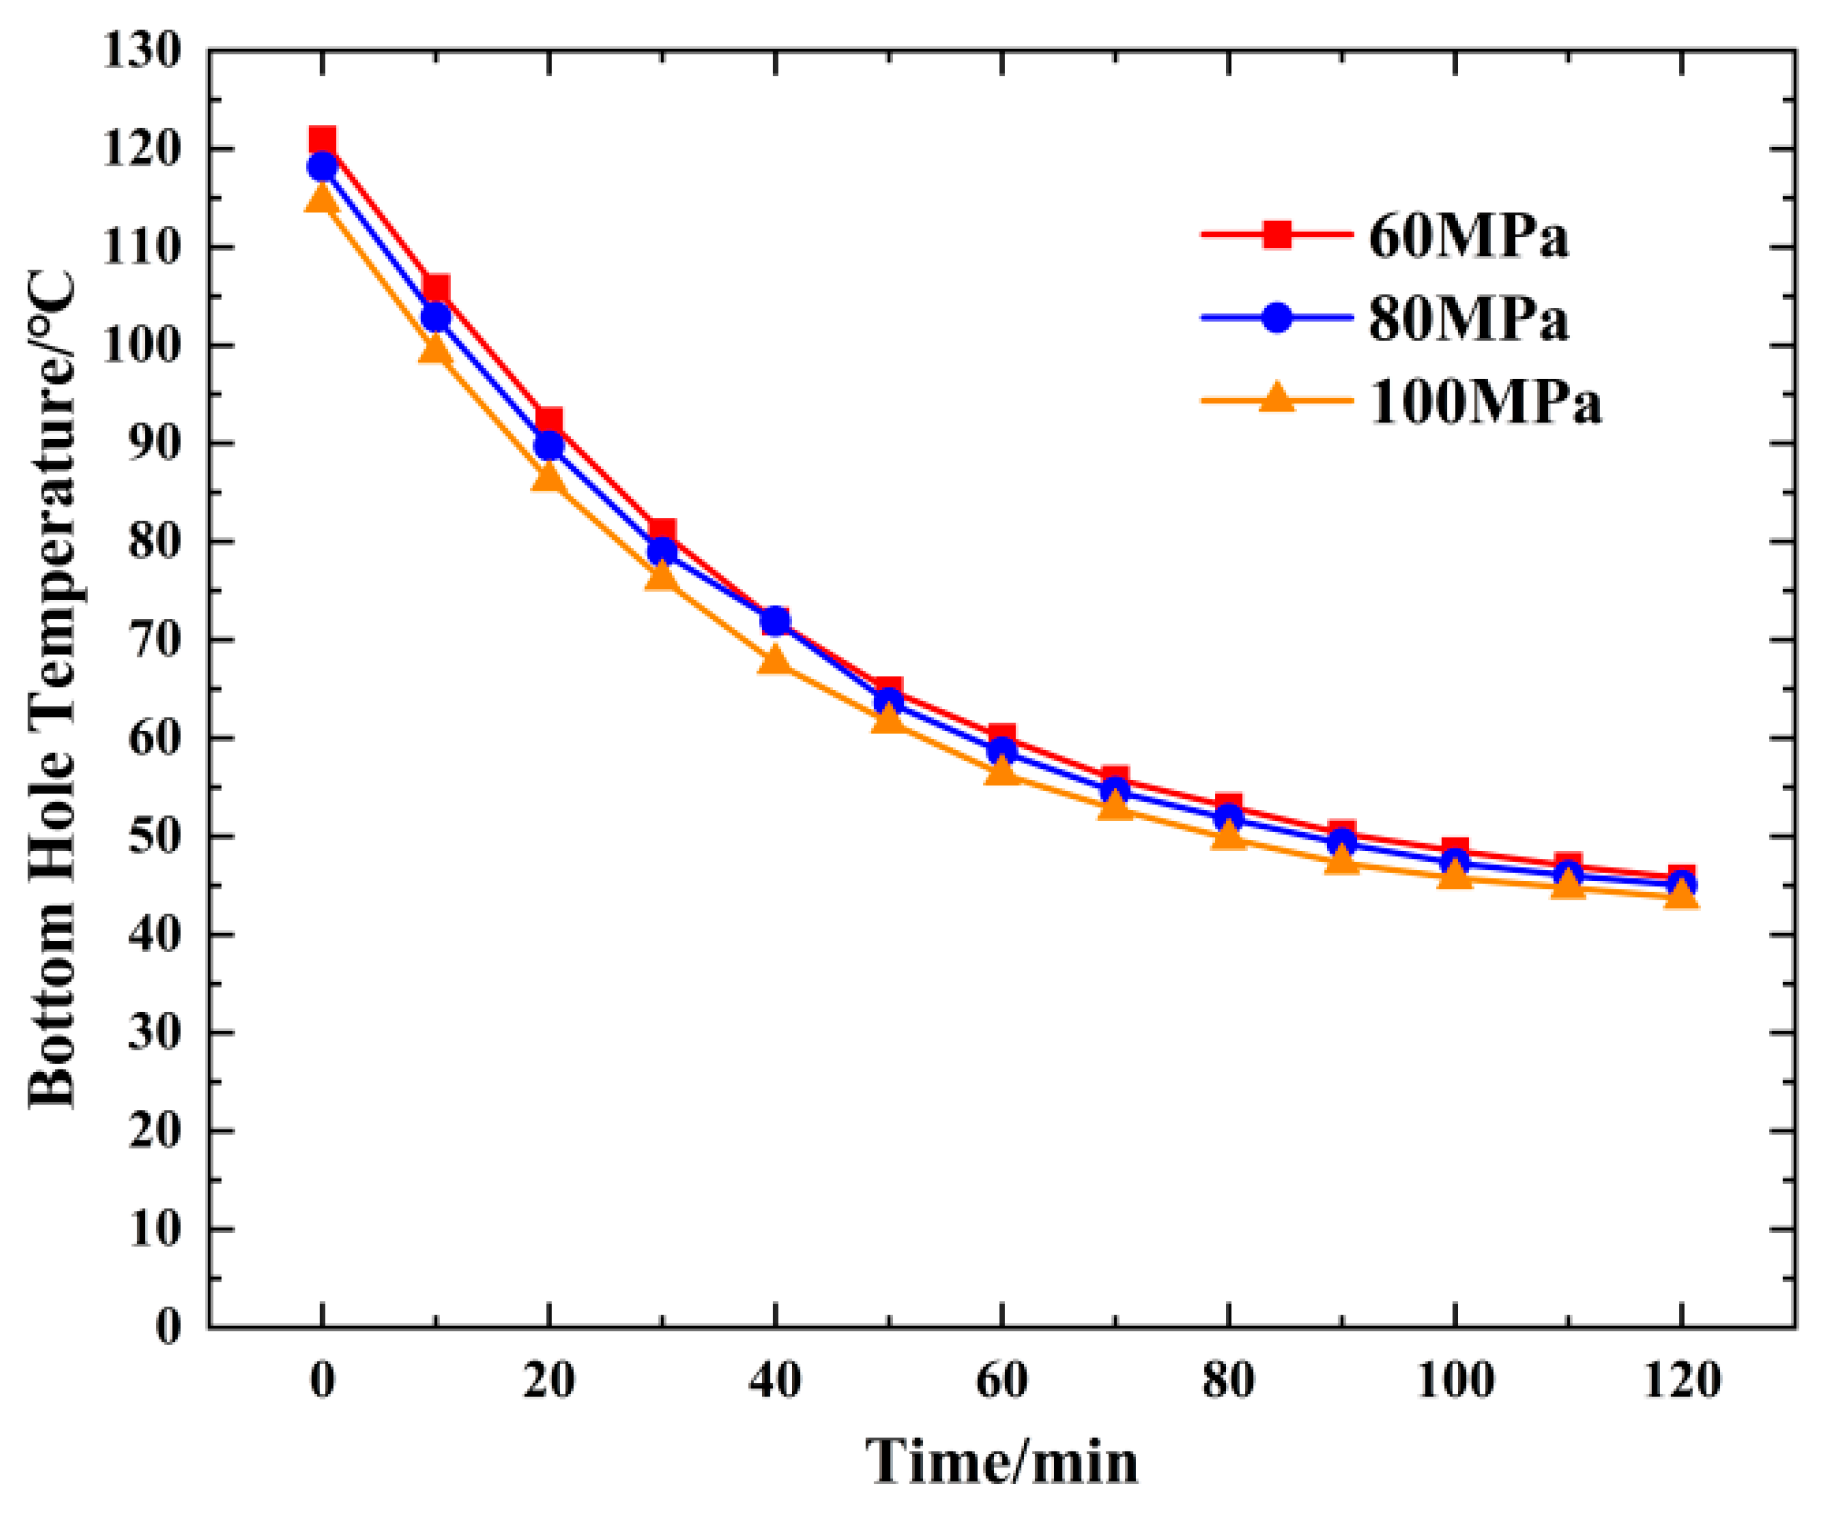
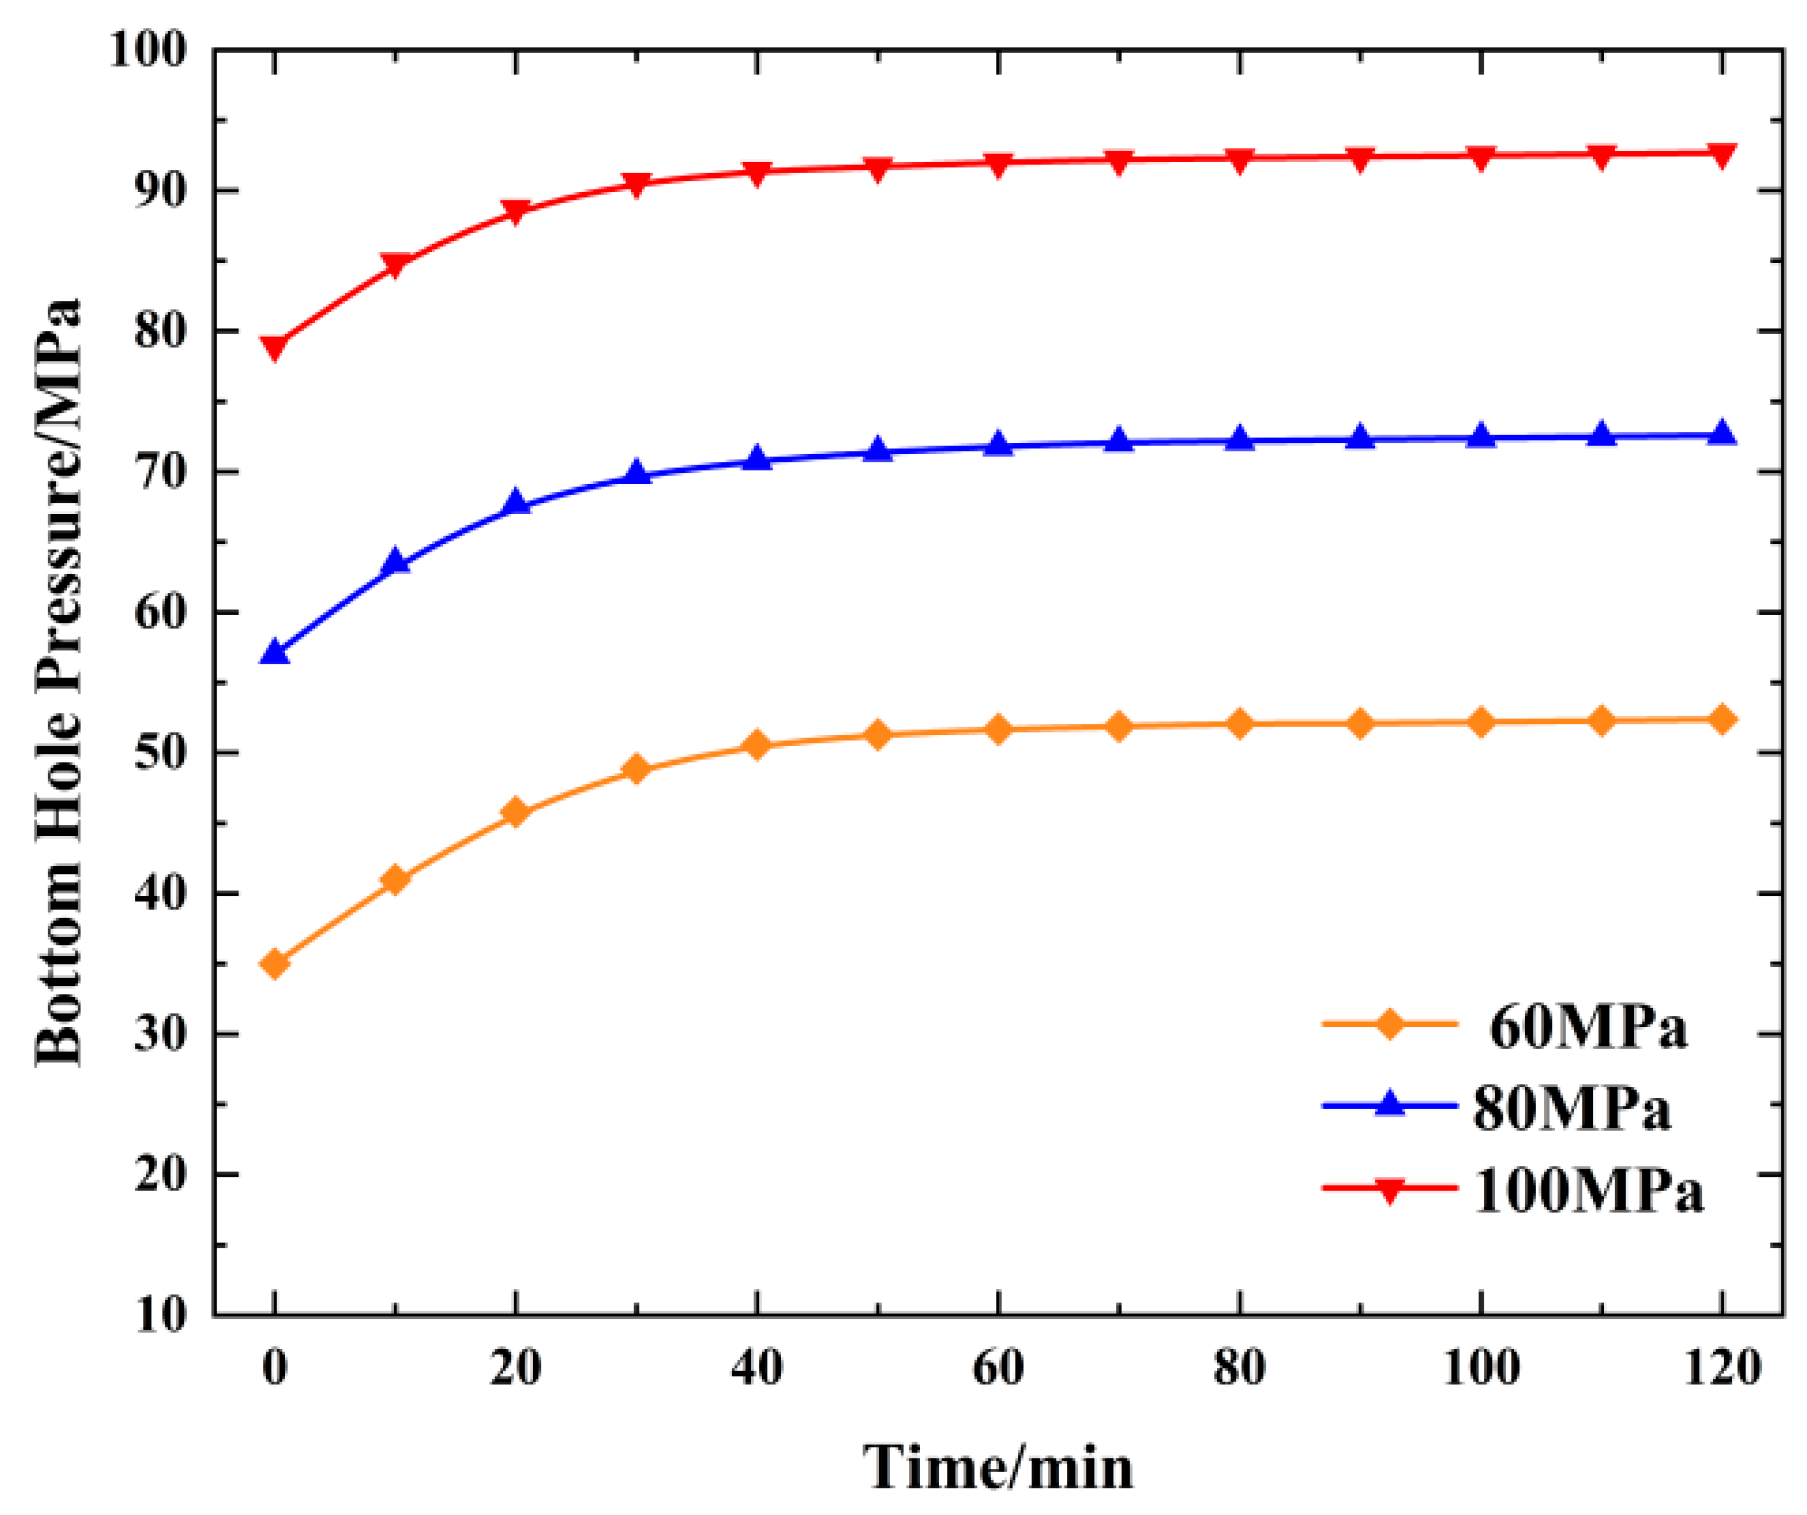
Figure 18 and Figure 19 show the bottom hole temperature and pressure change curves over time when the injection pressure is 60 MPa, 80 MPa, or 100 MPa. The figure shows that, as the injection pressure increases, the bottom hole temperature and pressure increase. The bottom hole pressure shows a relatively stable difference value under different injection pressures. Increased pressure can increase carbon dioxide density, viscosity, and friction thermogenesis, but this heat increase is relatively small. Changing the wellhead injection pressure significantly impacts the bottom pressure but has a weak effect on the bottom temperature [42].

5. Conclusions

We can complete the CO2 physical property parameter calculation by considering the tubular string temperature and pressure coupling model between the axial and radial heat transfer. We can also complete the temperature and pressure double iterative solution. Thus, the tubular string temperature pressure distribution can be predicted using the temperature–pressure coupling model.
(1) In comparison with the measured data from the G66X1 well, the maximum temperature error is 4.1% and the maximum pressure error is 2.3%, meeting the calculation requirements. CO2 thermal property parameters are greatly affected by temperature and pressure, which should be considered when calculating the temperature and pressure distribution of tubing string. The results indicate that the thermal properties of CO2 are significantly influenced by temperature and pressure. When calculating the temperature and pressure distribution of the tubular strings, these factors must be considered.
(2) The temperature and pressure of CO2 in the tubular string increase with increasing well depth. With a −17 °C injection, CO2 enters the supercritical state at 800 m; the density and viscosity of the fluid decrease with increasing well depth, changing at the critical point. In practical operations, it is crucial to emphasize the impact of wellhead injection temperature on tubular string temperature to better control the operational state.
(3) Wellhead injection temperature significantly influences the tubular string temperature distribution and weakly influences the pipe pressure field distribution. The injection displacement significantly impacts the bottom temperature pressure. The greater the displacement, the greater the internal friction energy, the higher the fluid temperature and injection pressure, and the lower the impact on bottom temperature. During the injection process, adjustments to operational parameters based on displacement size are necessary to ensure that bottom temperature and pressure remain within a controllable range.
This provides a method and reference for determining the wellhead parameters of a CO2 injection well and predicting wellbore temperature and pressure.

Author Contributions

Y.C. contributed to the conception of the study; X.C. performed the experiment and wrote the manuscript; W.L. contributed significantly to analysis; H.D. performed the data analyses; Y.H. contributed significantly to the prediction accuracy. All authors have read and agreed to the published version of the manuscript.

Funding

This research was funded by Y.C.: National Natural Science Foundation of China (No. 52374039), Y.C.: Shaanxi Province Natural Science Basic Research Programme Project (2023-JC-YB-337) and Y.D.: National Natural Science Foundation of China (No. 52274006).

Data Availability Statement

The original contributions presented in the study are included in the article; further inquiries can be directed to the corresponding author.

Conflicts of Interest

The authors declare no conflicts of interest.

References

  1. Pires da Mata Costa, L.; Micheline Vaz de Miranda, D.; Couto de Oliveira, A.; Falcon, L.; Stella Silva Pimenta, M.; Guilherme Bessa, I.; Juarez Wouters, S.; Andrade, M.; Pinto, J. Capture and Reuse of Carbon Dioxide (CO2) for a Plastics Circular Economy: A Review. Processes 2021, 9, 759. [Google Scholar] [CrossRef]
  2. He, Y.; Gao, H.; Zhou, X. Study on method for improving displacement effect of CO2 drive in extra-low permeability reservoir. Fault-Block Oil Gas Field 2011, 18, 512–515. [Google Scholar]
  3. Yang, Y. Research and application of CO2 flooding technology in extra-low permeability reservoirs of Shengli Oilfield. Oil Gas Geol. Oil Recovery Ratio 2020, 27, 11–19. [Google Scholar] [CrossRef]
  4. Brown, D. A hot dry rock geothermal energy concept utilizing supercritical CO2 instead of water. In Proceedings of the Twenty-Fifth Workshop on Geothermal Reservoir Engineering, Stanford University, Stanford, CA, USA, 24–26 January 2000; pp. 233–238. Available online: https://api.semanticscholar.org/CorpusID:2049110 (accessed on 1 January 2000).
  5. Sodeifian, G.; Usefi, M.M.B. Solubility, extraction, and nanoparticles production in supercritical carbon dioxide: A mini-review. ChemBioEng Rev. 2023, 10, 133–166. [Google Scholar] [CrossRef]
  6. Jiang, P.; Zhang, L.; Xu, R. Experimental study of convective heat transfer of carbon dioxide at supercritical pressures in a horizontal rock fracture and its application to enhanced geothermal systems. Appl. Therm. Eng. 2017, 117, 39–49. [Google Scholar] [CrossRef]
  7. Zhang, S.; Fu, J.; Peng, C.; Su, Y.; Zhang, H.; Yang, M. The Analysis of Transient Temperature in the Wellbore of a Deep Shale Gas Horizontal Well. Processes 2024, 12, 1402. [Google Scholar] [CrossRef]
  8. Shi, Y.; Weng, D.; Cai, B.; Zhang, Y.; Zhang, Y.; Wang, B.; Wang, H. Flow and Heat Transfer of Shale Oil Reservoir during CO2 Enhanced Pyrolysis: A Pore-Scale Modeling. Processes 2024, 12, 1694. [Google Scholar] [CrossRef]
  9. Liu, Y.; Nie, F.; Zhang, B.; Liu, T.; Hong, Y. The Three-Dimensional Heterogeneous Simulation Study of CO2 Flooding in Low-Permeability Reservoirs. Processes 2024, 12, 1843. [Google Scholar] [CrossRef]
  10. Ramey, H.J. Wellbore heat transmission. J. Pet. Technol. 1962, 14, 427–435. [Google Scholar] [CrossRef]
  11. Abdelhafiz, M.; Hegele, J.; Oppelt, J. Temperature modeling for wellbore circulation and shut-in with application in vertical geothermal wells. J. Pet. Sci. Eng. 2021, 204, 108660. [Google Scholar] [CrossRef]
  12. Klinkby, L.; Nielsen, C.; Krogh, E. Sim-ulating rapidly fluctuating CO2 flow into the Vedsted CO2 pipeline, injection well and reservoir. Energy Procedia 2011, 4, 4291–4298. [Google Scholar] [CrossRef]
  13. Li, X.; Li, G.; Wang, H. A wellbore flow model and coupling solution for supercritical CO2 fracturing. Pet. Drill. Technol. 2018, 42, 87–94. [Google Scholar] [CrossRef]
  14. Qiu, Z.; Xie, B.; Wang, Z. Research on the key technology of supercritical carbon dioxide drilling fluid. Pet. Drill. Technol. 2012, 40, 1–7. [Google Scholar] [CrossRef]
  15. Lesem, L.; Greytok, F.; Marotta, F. A Method of Calculating the Distribution of Temperature in Flowing Gas Wells. Soc. Pet. Eng. 1957, 210, 1–8. [Google Scholar] [CrossRef]
  16. Sproull, R. The conduction of heat in solids. Sci. Am. 1962, 207, 92–107. [Google Scholar] [CrossRef]
  17. Zeng, X.; Liu, Y.; Li, Y. Mechanistic model for predicting bore pressure and temperature distribution. J. Xi’an Inst. Pet. Technol. 2003, 18, 40–44. [Google Scholar]
  18. Gu, H.; Cheng, L.; Huang, S. Thermophysical properties estimation and performance analysis of superheated-steam injection in horizontal wells considering phase change. Energy Convers. Manag. 2015, 99, 119–131. [Google Scholar] [CrossRef]
  19. Dong, W.; Shen, R.; Liang, Q. Model Calculations and Factors Affecting Wellbore Temperatures During SRV Fracturing. Arab. J. Sci. Eng. 2018, 43, 6475–6480. [Google Scholar] [CrossRef]
  20. Wu, X.; Wang, Q.; He, Y. Temperature-pressure field coupling calculation model considering phase behavior change in CO2 injection wellbore hole. J. China Univ. Pet. Nat. Sci. Ed. 2009, 33, 73–77. [Google Scholar] [CrossRef]
  21. Wang, Q.; Wu, X. Study on Temperature and Pressure Profiles and Its Influencing Factors in CO2 Injection Wellbore. Sci. Technol. Eng. 2009, 9, 5330–5334. [Google Scholar]
  22. Paterson, L.; Lu, M.; Connell, L. Numerical modeling of pressure and temperature profiles including phase transitions in carbon dioxide wells. SPE 2008, 115946. [Google Scholar] [CrossRef]
  23. Yasunami, T.; Sasaki, K.; Sugai, Y. CO2 temperature prediction in injection tubing considering supercritical condition at Yubari ECBM pilot-test. J. Can. Pet. Technol. 2010, 49, 44–50. [Google Scholar] [CrossRef]
  24. Cheng, L.; Xu, J.; Wang, Q. The influence of tube diameter parameters on the flow resistance and heat transfer characteristics of supercritical CO2 in horizontal tubes. Appl. Therm. Eng. 2024, 241, 122361. [Google Scholar] [CrossRef]
  25. Hou, J.; Zhou, Y.; Yuan, Y. Numerical study on flow structure and heat transfer of supercritical CO2 in tubes with different inclination angles. Prog. Nucl. Energy 2024, 168, 105028. [Google Scholar] [CrossRef]
  26. Sun, F.; Xie, G.; Song, J.; Li, S. Thermal characteristics of in-tube upward supercritical CO2 flows and a new heat transfer prediction model based on artificial neural networks (ANN). Appl. Therm. Eng. 2021, 194, 117067. [Google Scholar] [CrossRef]
  27. Chen, X.; He, M.; Xu, M. Fully transient coupled prediction model of wellbore temperature and pressure for multi-phase flow during underbalanced drilling. Geoenergy Sci. Eng. 2023, 223, 211540. [Google Scholar] [CrossRef]
  28. Jing, J.; Shan, H.; Zhu, X.; Huangpu, Y. Wellbore temperature and pressure calculation of offshore gas well based on gas–liquid separated flow model. Processes 2022, 10, 2043. [Google Scholar] [CrossRef]
  29. Liu, X.; Liu, L.; Yu, Z.; Zhang, L. Study on the coupling model of wellbore temperature and pressure during the production of high temperature and high pressure gas well. Energy Rep. 2022, 8, 1249–1257. [Google Scholar] [CrossRef]
  30. Pang, Z.; Wang, L. A model to calculate heat loss of flowing superheated steam in pipe or wellbore. Comput. Comput. Therm. Sci. 2016, 8, 249–263. [Google Scholar] [CrossRef]
  31. Yang, Z.; Cheng, X.; Zheng, X. Numerical investigation on heat transfer of the supercritical fluid upward in vertical tube with constant wall temperature. Int. J. Heat Mass Transf. 2019, 128, 875–884. [Google Scholar] [CrossRef]
  32. Tang, Y.; Hu, S.; Wang, Y. Phase behaviors of CO2 in the whole process of injection–fracturing–flowback: A case study of Well SH52 in a tight sandstone gas reservoir of the Shenmu Gas Field. Ordos Basin Nat. Gas Ind. 2019, 39, 58–64. [Google Scholar] [CrossRef]
  33. Khan, N.U.; May, R. A generalized mathematical model to predict transient bottomhole temperature during drilling operation. J. Pet. Sci. Eng. 2016, 147, 435–450. [Google Scholar] [CrossRef]
  34. Dang, Z.; Chen, X.; Yao, X.; Xu, Z.; Zhou, M.; Yang, W.; Song, X. Wellbore Temperature Prediction Model and Influence Law of Ultra-Deep Wells in Shunbei Field, China. Processes 2024, 12, 1715. [Google Scholar] [CrossRef]
  35. Cao, J.; Ma, G.; Zhao, G.; Yang, S.; Han, L.; Wang, J.; Mou, Y.; Cai, M. Research on Wellbore Integrity Evaluation Model of CO2 Enhanced Composite Fracturing. Processes 2024, 12, 2338. [Google Scholar] [CrossRef]
  36. Zhang, H. Study on Heat Transfer Characteristics in Wellbore during Cryogenic Fracturing. Ph.D. Dissertation, Oil and Gas Well Engineering, China University of Petroleum, Beijing, China, 2020. Available online: https://link.cnki.net/doi/10.27643/d.cnki.gsybu.2020.000002 (accessed on 11 March 2022).
  37. Span, R. A new equation of state for carbon dioxide covering the fluid region from the triple-point temperature to 1100 K at pressures up to 800 MPa. J. Phys. Chem. Ref. Data 1996, 25, 1509–1596. [Google Scholar] [CrossRef]
  38. Vesovic, V.; Wakeham, W.; Olchowy, G.; Sengers, J. The transport properties of carbon dioxide. J. Phys. Chem. Ref. Data 1990, 19, 763–808. [Google Scholar] [CrossRef]
  39. Fenghour, A.; Wakeham, W. The viscosity of carbon dioxide. J. Phys. Chem. Ref. Data 1998, 27, 31–44. [Google Scholar] [CrossRef]
  40. Bo, X. Coupling solving method of temperature and pressure fieldduring supereritical carbon dioxide dry fracturing. China Sci. 2020, 15, 119–124. [Google Scholar] [CrossRef]
  41. Guo, C.Q.; Li, Y.C. Comprehensive numerical simulation of pressure and temperature prediction in gas well. Acta Pet. Sin. 2001, 22, 100. [Google Scholar] [CrossRef]
  42. Lan, J.P.; Gong, Q.; Xu, Z.G. Effect of CO2 fracturing parameters on well temperature and pressure. China Pet. Mach. 2018, 46, 101–107. [Google Scholar] [CrossRef]
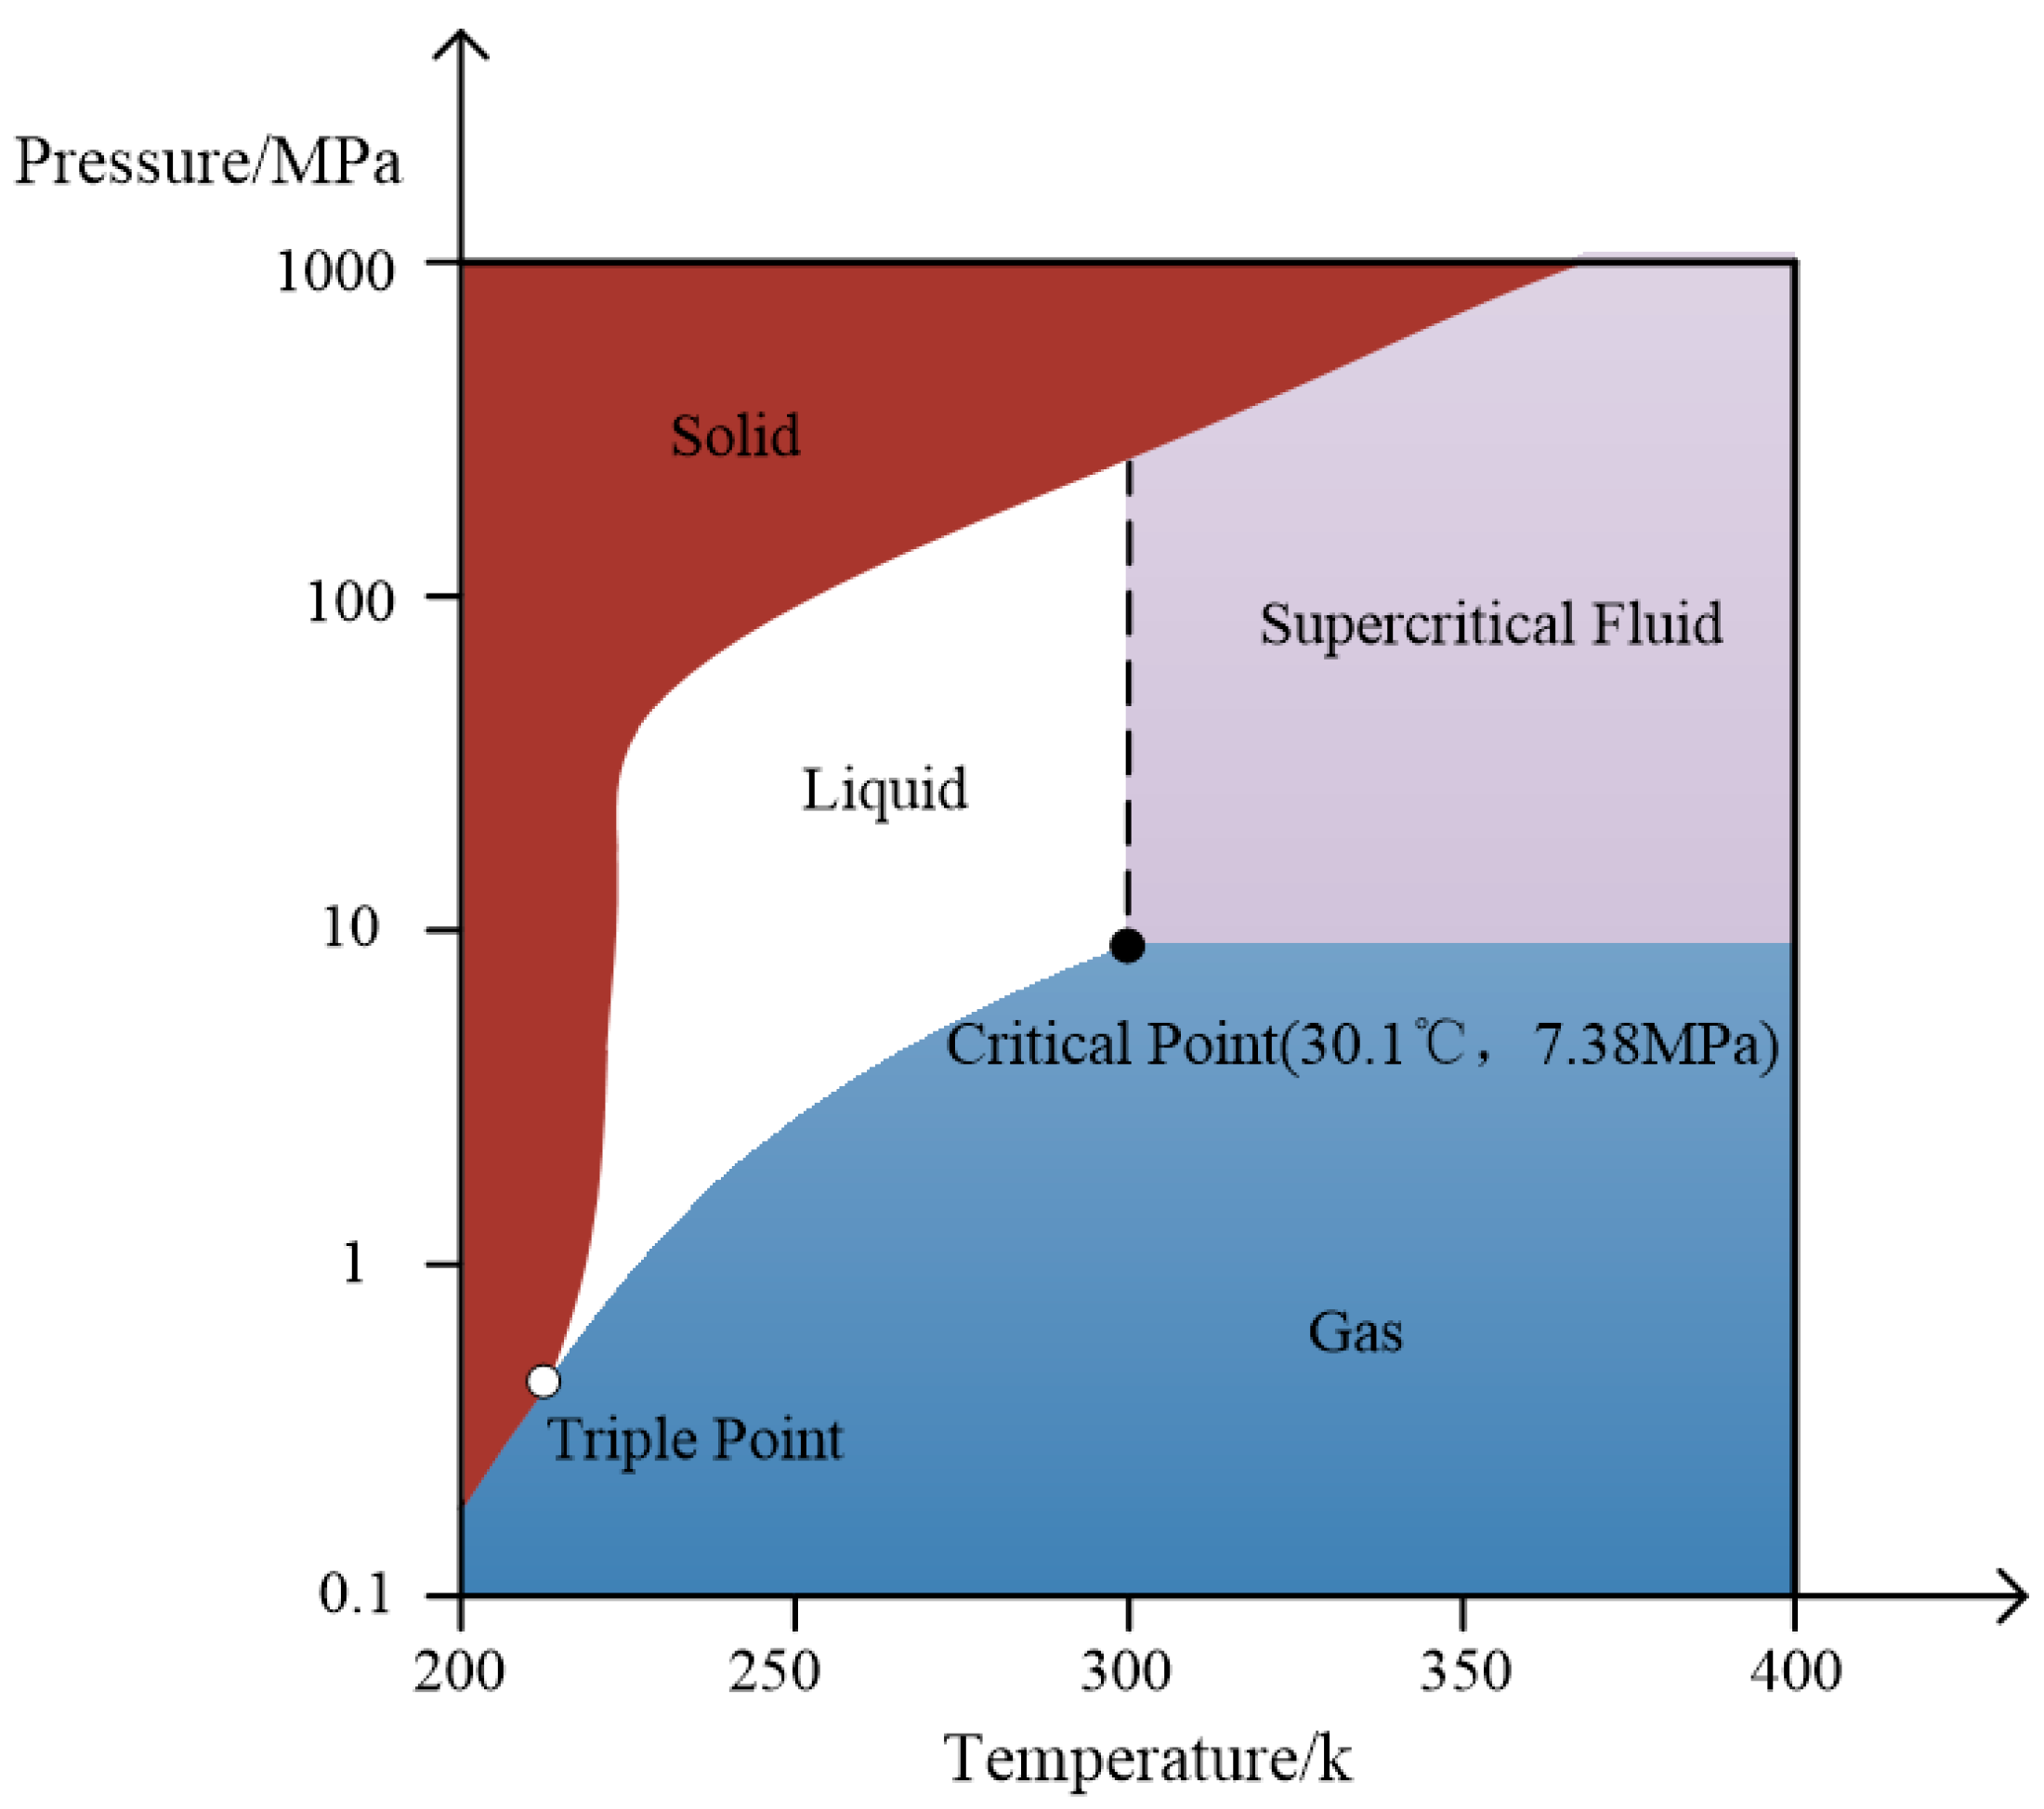
Figure 1. CO2 phase state diagram.
Processes 12 02848 g001
Figure 2. CO2 density changes at different temperature pressures.
Processes 12 02848 g002
Figure 3. The specific heat capacity change in CO2 at different temperatures and pressures.
Processes 12 02848 g003
Figure 4. Changes in CO2 viscosity with temperature at different pressures.
Processes 12 02848 g004
Figure 5. Change in CO2 thermal conductivity with temperature at different pressures.
Processes 12 02848 g005
Figure 6. The wellbore model diagram.
Processes 12 02848 g006
Figure 7. Schematic diagram of heat transfer after CO2 injection.
Processes 12 02848 g007
Figure 8. Comparison of predicted and measured values of pipe tubular string temperature.
Processes 12 02848 g008
Figure 9. Comparison of predicted and measured values of pipe tubular string pressure.
Processes 12 02848 g009
Figure 10. Temperature error plot.
Processes 12 02848 g010
Figure 11. Pressure error plot.
Processes 12 02848 g011
Figure 12. Field distribution of the tubular string temperature at different injection temperatures.
Processes 12 02848 g012
Figure 13. Tubular string pressure field distribution at different injection temperatures.
Processes 12 02848 g013
Figure 14. Bottom hole temperature changes with time.
Processes 12 02848 g014
Figure 15. Bottom hole pressure varies with time.
Processes 12 02848 g015
Figure 16. The bottom temperatures of different displacement wells vary with time.
Processes 12 02848 g016
Figure 17. The bottom pressures of different displacement wells vary with time.
Processes 12 02848 g017
Figure 18. The bottom temperature of different injection pressures varies with time.
Processes 12 02848 g018
Figure 19. Well temperature of different injection pressures varying with time.
Processes 12 02848 g019
Table 1. Summary of GRA results.
PropertyParameterPropertyParameter
Boiling Point/°C−78.5Density/kg/m3468
Volume/cm3/mol93.9Viscosity/mPas0.404
Gas Density/kg/m37.74Compressibility Factor0.315
Liquid Density/kg/m31178Deviation Factor0.274
Critical Point31.1 °C, 7.38 MPaTriple Point−56.67 °C, 0.527 MPa
Table 2. Basic data for CO2 injection well.
Basic DataParameterBasic DataParameter
Drilling Depth (m)4399Artificial Bottom (m)4326.28
Casing Outer Diameter (mm)139.7Casing Inner Diameter (mm)121.36
Tubing Outer Diameter (mm)73.02Tubing Wall Thickness (mm)5.51
Injection Temperature (°C) Density/kg/m3−17Surface Temperature (°C)26
Geothermal Gradient (°C/100 m)2.8Injection Pressure (MPa)39
Injection Rate (m3/min)2.0Formation Thermal Conductivity W/(m°C)2.0
Tubing Thermal Conductivity W/(m°C)44.66Casing Thermal Conductivity W/(m°C)44.66
Disclaimer/Publisher’s Note: The statements, opinions and data contained in all publications are solely those of the individual author(s) and contributor(s) and not of MDPI and/or the editor(s). MDPI and/or the editor(s) disclaim responsibility for any injury to people or property resulting from any ideas, methods, instructions or products referred to in the content.