Article

Experimental Study on Damage Evaluation of Working Fluid Invasion in Tight Sandstone Gas Reservoirs

1
University of Chinese Academy of Sciences, Beijing 100190, China
2
School of Petroleum Engineering, Chongqing University of Science and Technology, Chongqing 401331, China
3
Research Institute of Petroleum Exploration and Development, PetroChina, Beijing 100083, China
4
Key Laboratory of Gas Reservoir Formation and Development, PetroChina, Langfang 065007, China
5
Changqing Oilfield Company, PetroChina, Xi’an 710018, China
*
Authors to whom correspondence should be addressed.
Processes 2024, 12(12), 2857; https://doi.org/10.3390/pr12122857
Submission received: 18 November 2024 / Revised: 9 December 2024 / Accepted: 12 December 2024 / Published: 13 December 2024
(This article belongs to the Topic Exploitation and Underground Storage of Oil and Gas)

Abstract

:
The scientific evaluation of the damage caused by working fluid invasion in tight sandstone gas reservoirs is critical for optimizing drilling design, fracturing fluid systems, and construction design. This study focused on the tight sandstone core of the Qingshimao gas field in the Ordos Basin. A set of experimental methods and equipment were designed to facilitate the visual monitoring and quantitative evaluation of the reservoir damage caused by working fluids. Systematic evaluation experiments were conducted to analyze the extent of reservoir damage caused by working fluid invasion under varying pore pressure and permeability conditions. The results show the following: (1) As permeability increases, the real-time invasion flow rate rises, and the invasion rate accelerates. Meanwhile, as pore pressure increases, the real-time invasion flow rate decreases, and the invasion rate slows down. (2) The core’s fluid saturation after working fluid invasion exceeds 70%, with permeability damage reaching 95% or higher. (3) At the same reservoir pore pressure, cores with permeability ranges between 0.1 × 10⁻³ μm2 and 1 × 10⁻³ μm2 exhibit higher fluid-phase saturation and greater invasion damage. For cores with similar permeability, the higher the pore pressure, the higher the invasion-phase saturation, and the greater the extent of invasion damage. The research results provide certain guiding significance for evaluating the extent of the damage caused by working fluid invasion in tight sandstone gas reservoirs and achieving efficient gas reservoir development.

1. Introduction

With the advancement of oil and gas field exploration and development techniques, the development object has changed from conventional to tight reservoirs, with drilling, completion, and multi-stage fracturing widely applied as effective development techniques [1,2,3]. For tight reservoirs, the damage of drilling fluids, fracturing fluids, and other working fluids to the reservoir cannot be ignored [4,5,6,7]. The Qingshimao gas field is a newly developed tight gas field in the Ordos Basin, where the He 8 member of the Permian Lower Shihezi Formation is the main gas-producing formation [8]. The reservoir is characterized by poor physical properties, with an average porosity of 6.07%, an average permeability of 0.37 × 10⁻³ μm2, and a high average water saturation of 45.9% [9]. The Qingshimao gas field is currently in the production test evaluation stage, and the extent of reservoir damage caused by working fluid invasion has not been clarified yet. Therefore, quantitatively evaluating the damage caused by working fluid to the reservoir during construction is crucial for efficiently developing oil and gas fields.
Many scholars have conducted extensive research on the damage caused by working fluids in tight sandstone gas reservoirs. Xu et al. [10] investigated the damage mechanism of fracturing fluid in tight sandstone reservoirs, indicating that fracturing fluid in a reservoir with poor physical properties was seriously retained, causing great damage to the reservoir. Xu et al. [11] conducted dynamic and static adsorption and core damage experiments, revealing that the main damage to cores caused by guar fracturing fluid is water-phase damage, with guar molecules exerting less influence on permeability. Cao et al. [12] used the nuclear magnetic resonance (NMR) technique in combination with conventional flow experiments to analyze the different damage mechanisms of fracturing fluids in reservoirs. Their research found that low-permeability cores generally exhibit higher damage rates than high-permeability cores. Guo et al. [13] conducted core displacement experiments combining NMR and computed tomography (CT) scanning techniques to study the change in sandstone pore throat structure caused by the adsorption of fracturing fluid. The results show that the fracturing fluid can be adsorbed inside porous rock media, reducing the rock pore size and deteriorating reservoir permeability. Tang et al. [14] simulated the invasion process of fracturing fluid in tight sandstone gas reservoirs by improving the experimental process and method. Then, the extent of fracturing fluid-induced damage to the gas reservoir was evaluated, and the damage mechanisms of fracturing fluid were analyzed systematically. Their study indicated that fracturing fluid damages the gas reservoir in various forms, including solid-phase residue, particle migration, high molecular polymer adsorption/retention, and salting out. Although many research results have been obtained regarding the damage mechanism of working fluids, the core damage occurring during the invasion of the working fluid remains unclear. Currently, the experimental methods for evaluating the extent of fracturing fluid-induced damage to reservoirs mainly refer to the Chinese standard SY/T6540-2021 [15]. The experimental process includes the following steps: (1) The holder and the intermediate container containing the working fluid are placed in a thermostat, and the temperature is set. After stabilizing for a period of time, the core, with an initial permeability of Ko, is loaded into the holder. (2) The confining pressure is increased to 5 MPa, the vent valve at the inlet end is opened, and the working fluid in the intermediate container is driven by nitrogen until the air in the pipeline at the inlet end of the core is discharged, and the vent valve is closed. (3) The pressure of the intermediate container is adjusted to 3.5 MPa, and the working fluid invades the core while timing begins. The filtration volume is recorded at the outlet end. When the filtration time reaches 120min, the experiment is stopped. (4) The experimental core is taken out, the end face is cleaned, its permeability Kos is measured, and its permeability recovery rate R is calculated (R = Kos/Ko × 100%). However, the method has three limitations: (1) The maximum confining pressure of the experiment is 5 MPa, and the maximum filtration pressure difference is 3.5 MPa, whereas an actual reservoir’s pressure is above 30 MPa. The filtration pressure difference is also related to the construction and fluid column pressure. Therefore, a significant disparity exists between the experimental and actual field conditions, limiting the applicability of the experimental results. (2) The damage experiment by direct pressurization cannot simulate the gradual increase in formation pressure upon actual reservoir working fluid invasion. (3) Real-time visual monitoring of the process and distribution of working fluid invasion into the reservoir are not feasible, and parameters such as invasion speed and fluid volume cannot be quantitatively evaluated. Therefore, effectively revealing the mechanisms of working fluid-induced reservoir damage remains difficult.
This study took the tight sandstone core of the Qingshimao gas field in the Ordos Basin as the research subject. Based on the Chinese standard SY/T6540-2021, the experimental method was improved. The ISCO pump simulated the gradual increase in formation pressure as the actual reservoir working fluid invaded the space. The design of the filtration pressure difference considered the actual construction pressure difference. We used nuclear magnetic resonance (NMR) equipment and its imaging techniques to conduct T2 spectrum and real-time imaging analysis of working fluid invasion inside the core. This set of experimental methods accurately reflects the migration law of the working fluid in the core with different invasion times and quantitatively and objectively evaluates the working fluid damage mechanism from the microscopic perspective. The research results provide the experimental and theoretical basis for the rational and efficient development of this type of gas reservoir.

2. Materials and Methods

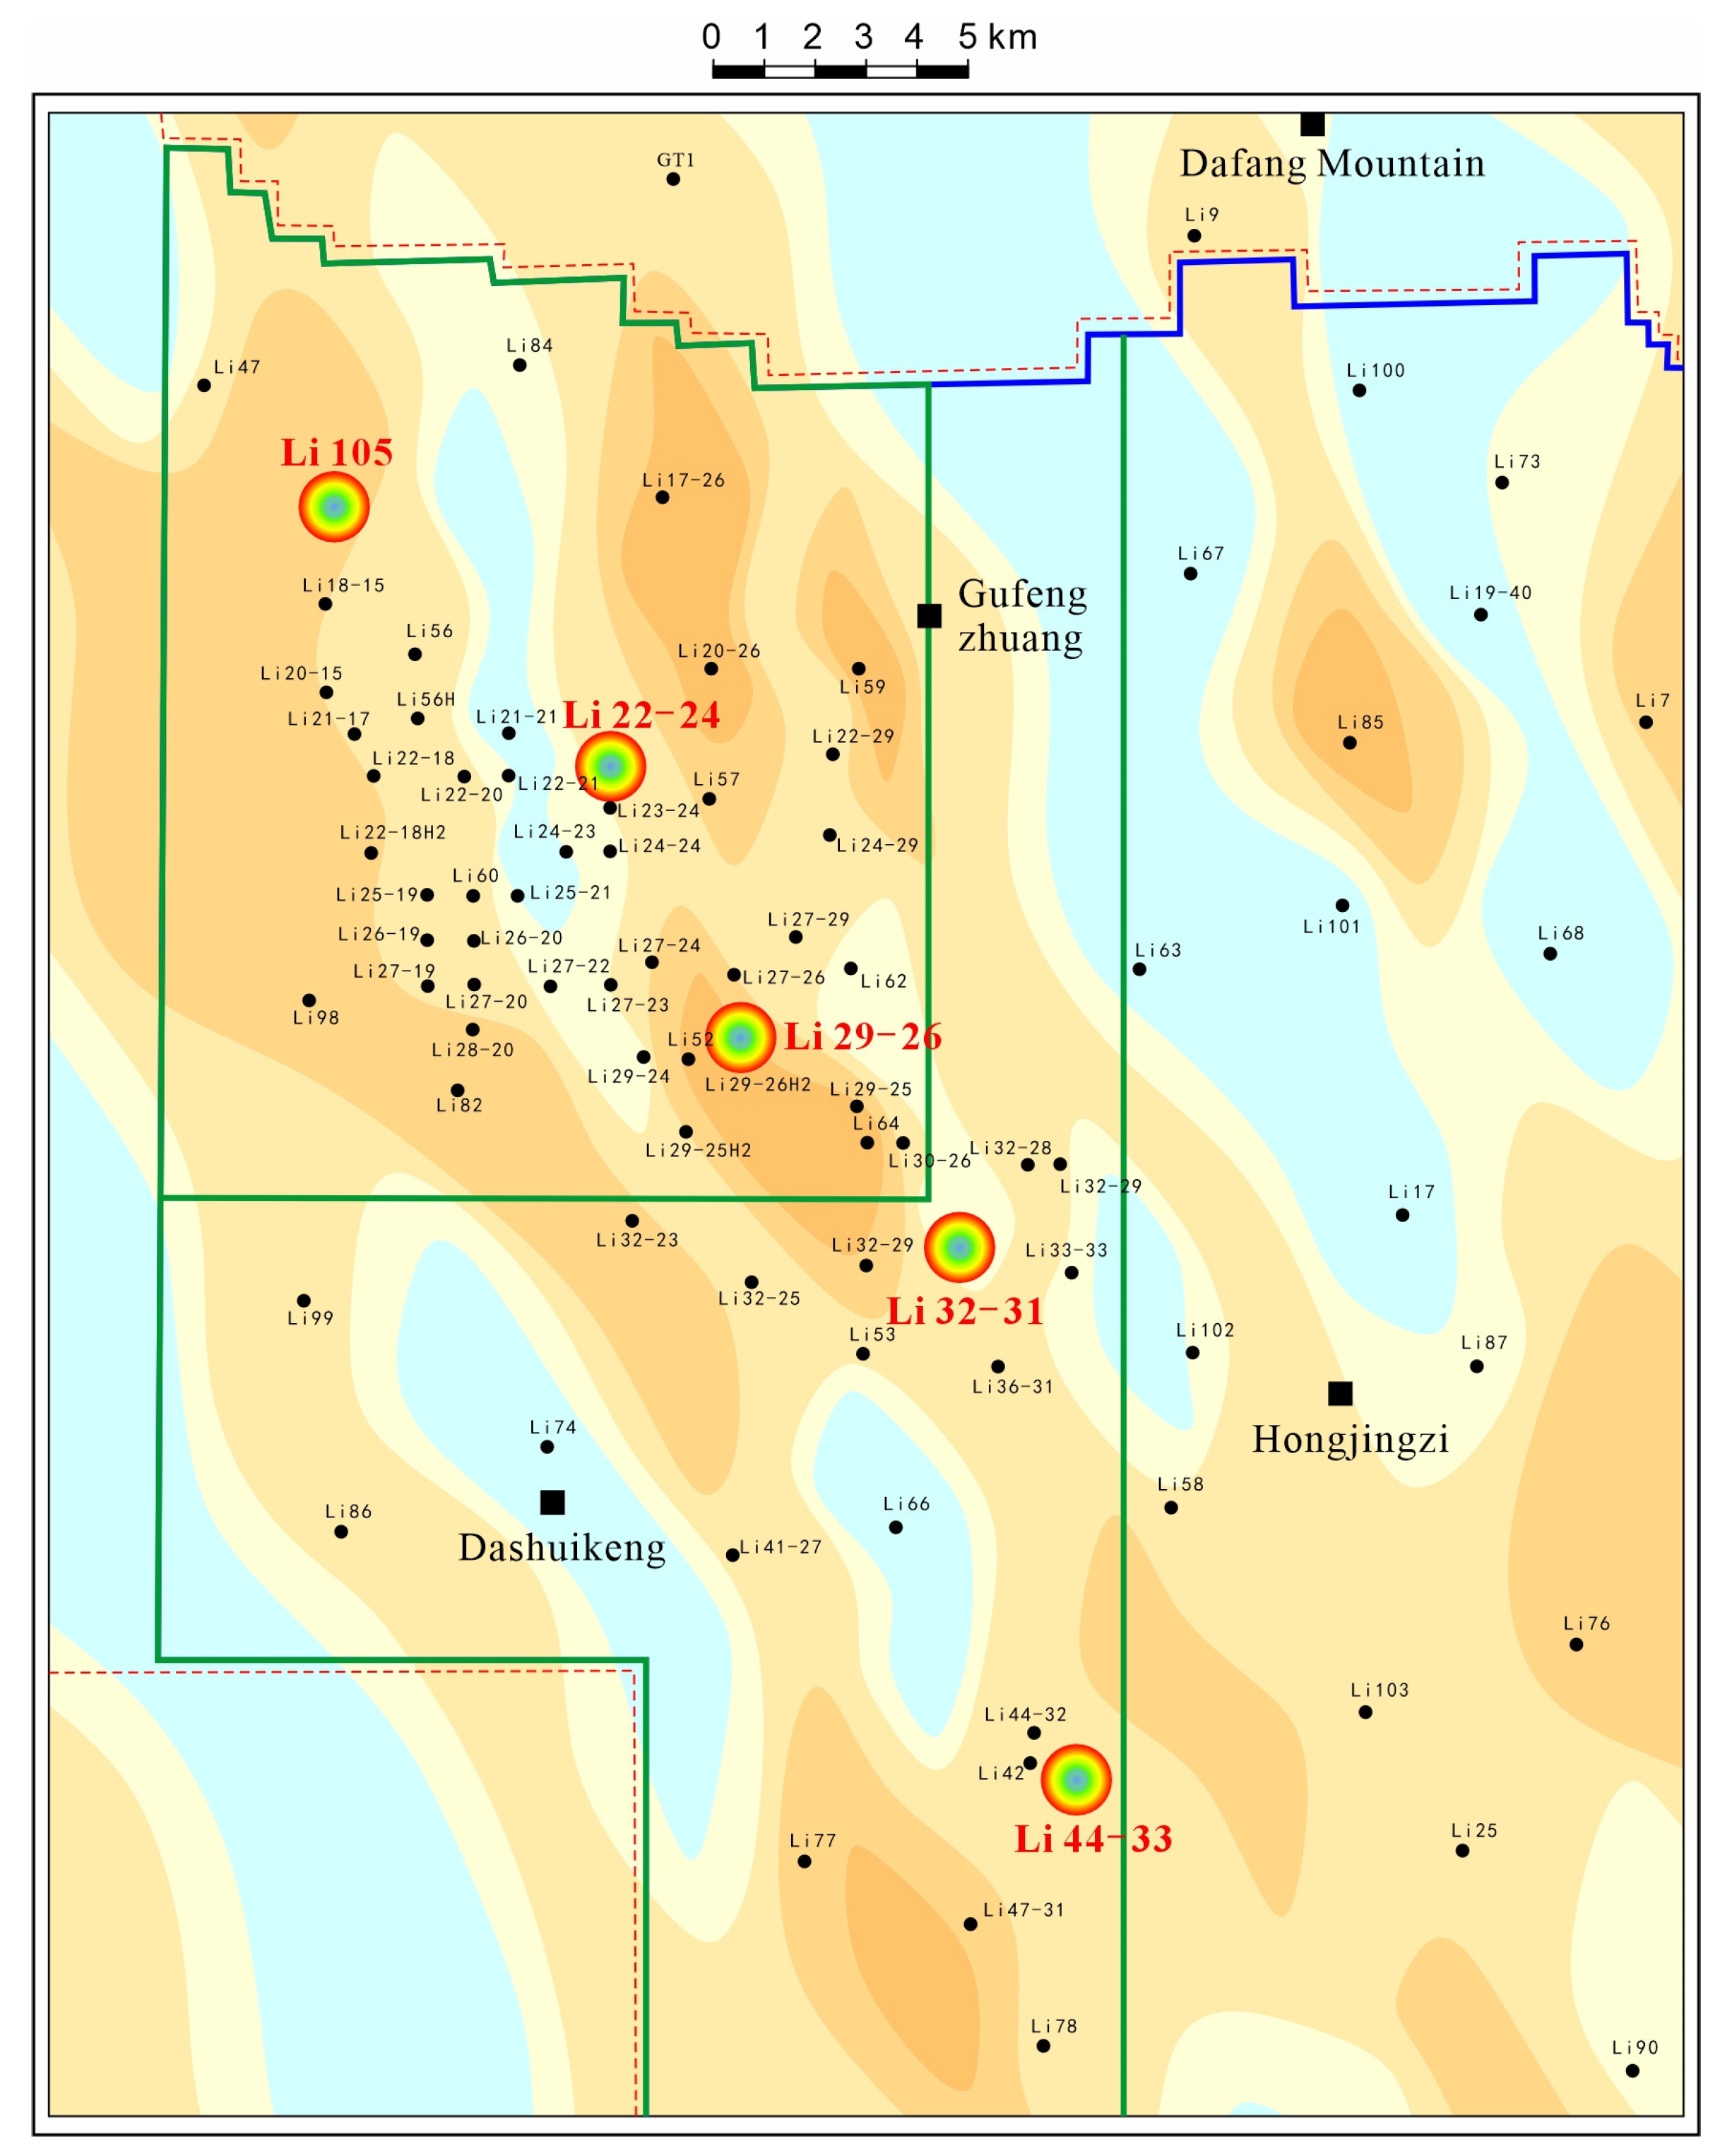
2.1. Experimental Materials

The core from the He 8 member of the main production reservoir of the Qingshimao gas field in the Ordos Basin was selected in this experiment, and the distribution of the core well is shown in Figure 1. The conventional air permeability was 0.016 × 10⁻³–7.76 × 10⁻³ μm2. The working fluid used in the experiment was the water-based fracturing fluid system used in the Qingshimao gas field. The composition was 0.4% hydroxypropyl guanidine gum + 0.1% bactericide + 0.5% anti-swelling agent + 0.5% cleanup additive + 0.5% blowing agent + 0.3% conditioning agent + 0.4% crosslinking agent + 0.1% breaker + 96.3% water.

2.2. Experimental Design and Steps

A series of physical simulation experiments on working fluid invasion into the core were conducted under pore pressures of 0.1 MP, 20 MP, and 30 MP to evaluate the damage caused by working fluid invasion under different formation conditions. The parameters of the experimental design are shown in Table 1.
The online NMR displacement system is shown in Figure 2, and its connection to the experimental equipment is shown in Figure 3. In this experiment, the high-pressure gas source applied pore pressure to the core, the confining pressure pump provided confining pressure for the core holder, and the ISCO pump and working fluid container injected the working fluid into the core. The core holder was placed in the NMR imaging analyzer to carry out online NMR and imaging acquisition. The inlet and outlet end were connected to the pressure sensor to collect the pressure data, and the back pressure valve was added at the fluid discharge outlet. By changing the back pressure, the formation pressure when the actual reservoir working fluid invaded the space was simulated, and the mass flow controller collected the real-time flow. The experimental steps were as follows:
(1)
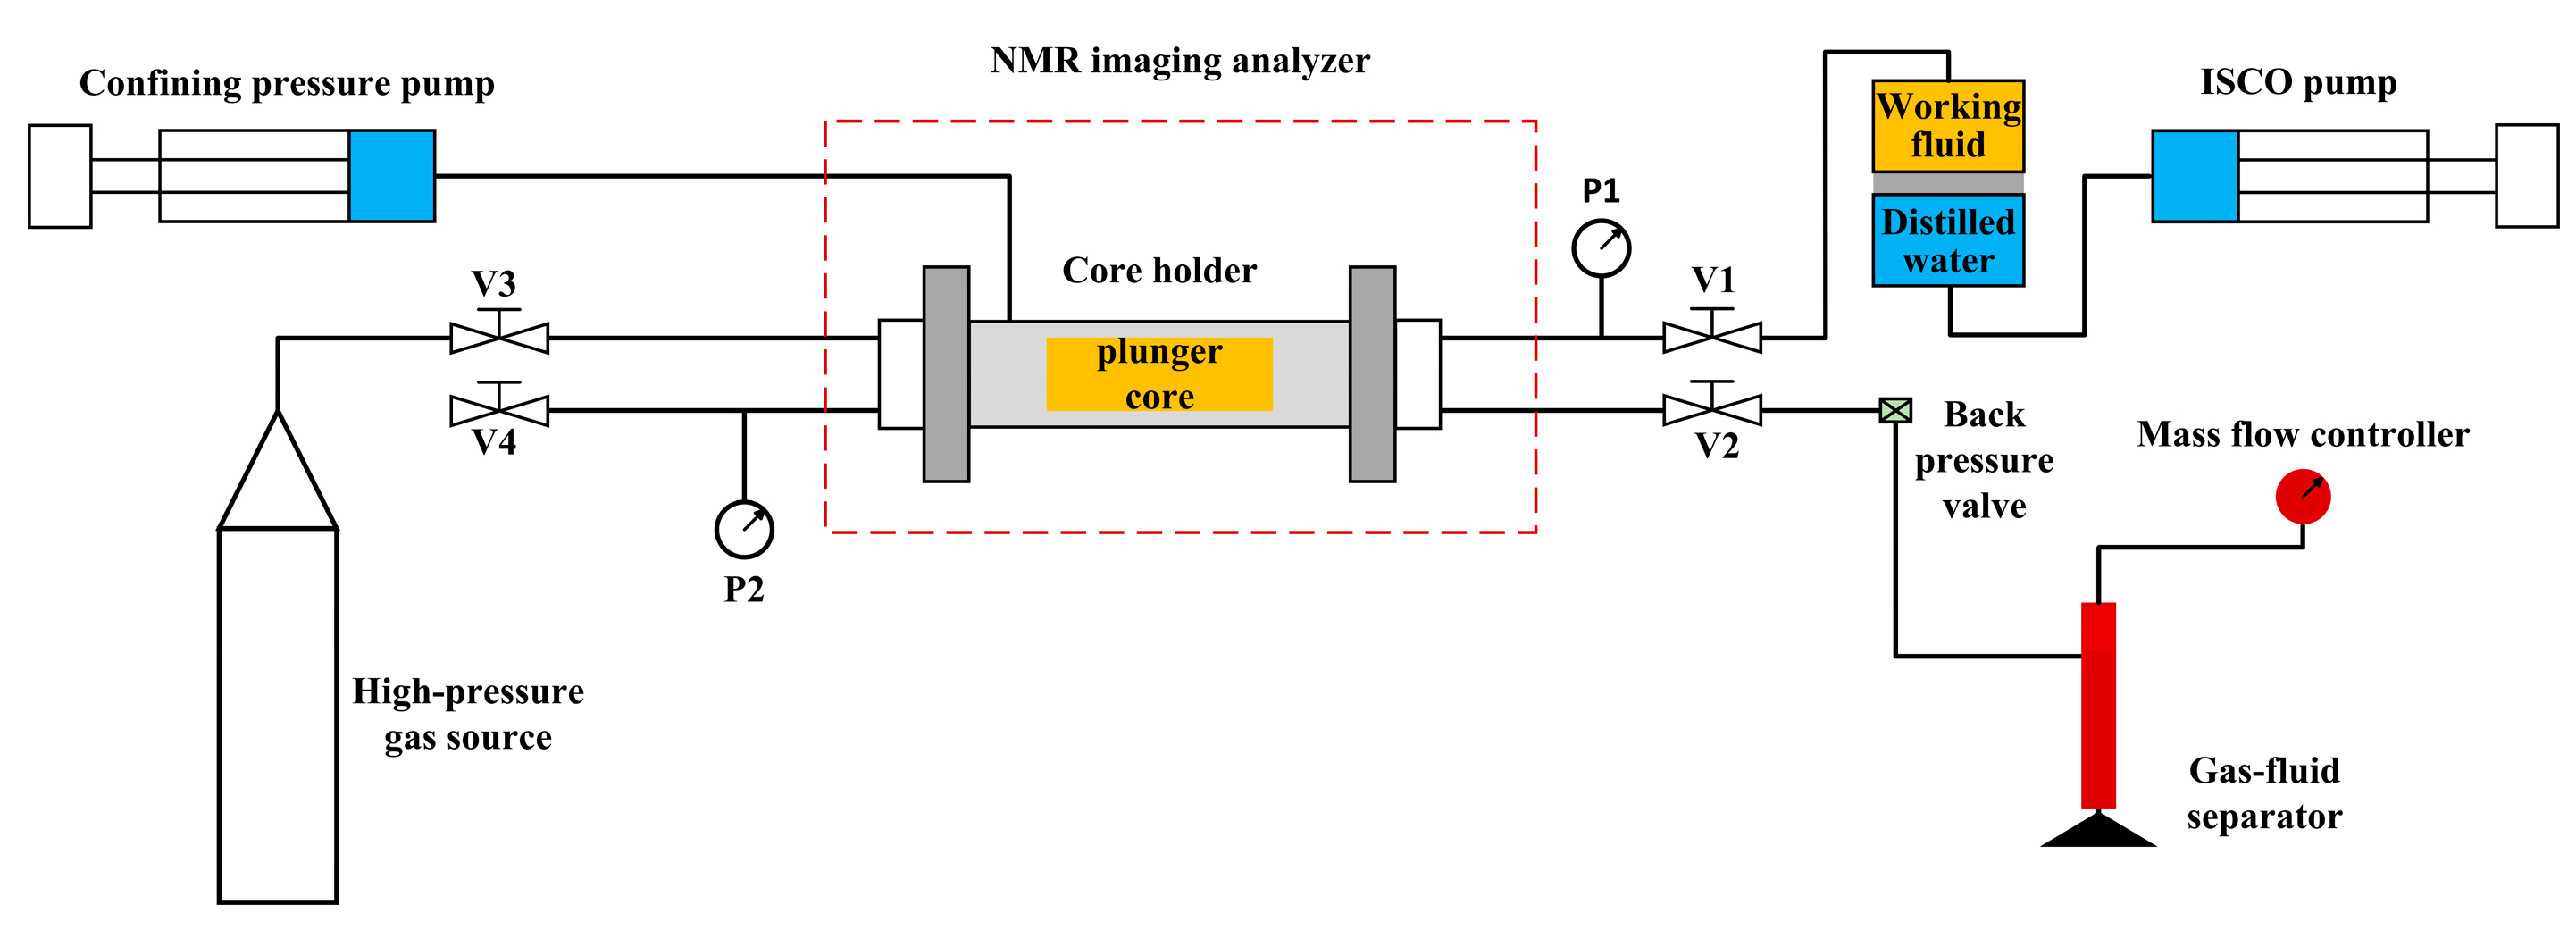
We put the core into the core holder, connected the equipment according to Figure 2, and closed valves V1, V2, V3, and V4;
(2)
We opened the confining pressure pump and applied confining pressure to the core to set the confining pressure value;
(3)
We opened V3 to fill the core with gas until the two pressure gauges showed the pore pressure and closed V3;
(4)
We opened V1, started the ISCO pump, and injected the working fluid into the experimental core according to the pressure set by the experimental design. We then regularly measured the T2 spectrum and NMR imaging of the core;
(5)
The V1 and ISCO pumps were closed at 120 min, V4 and V2 were opened to collect the real-time flow, and we measured core permeability.

3. Results

3.1. Visual Monitoring and Dynamic Analysis of Working Fluid Invasion Process

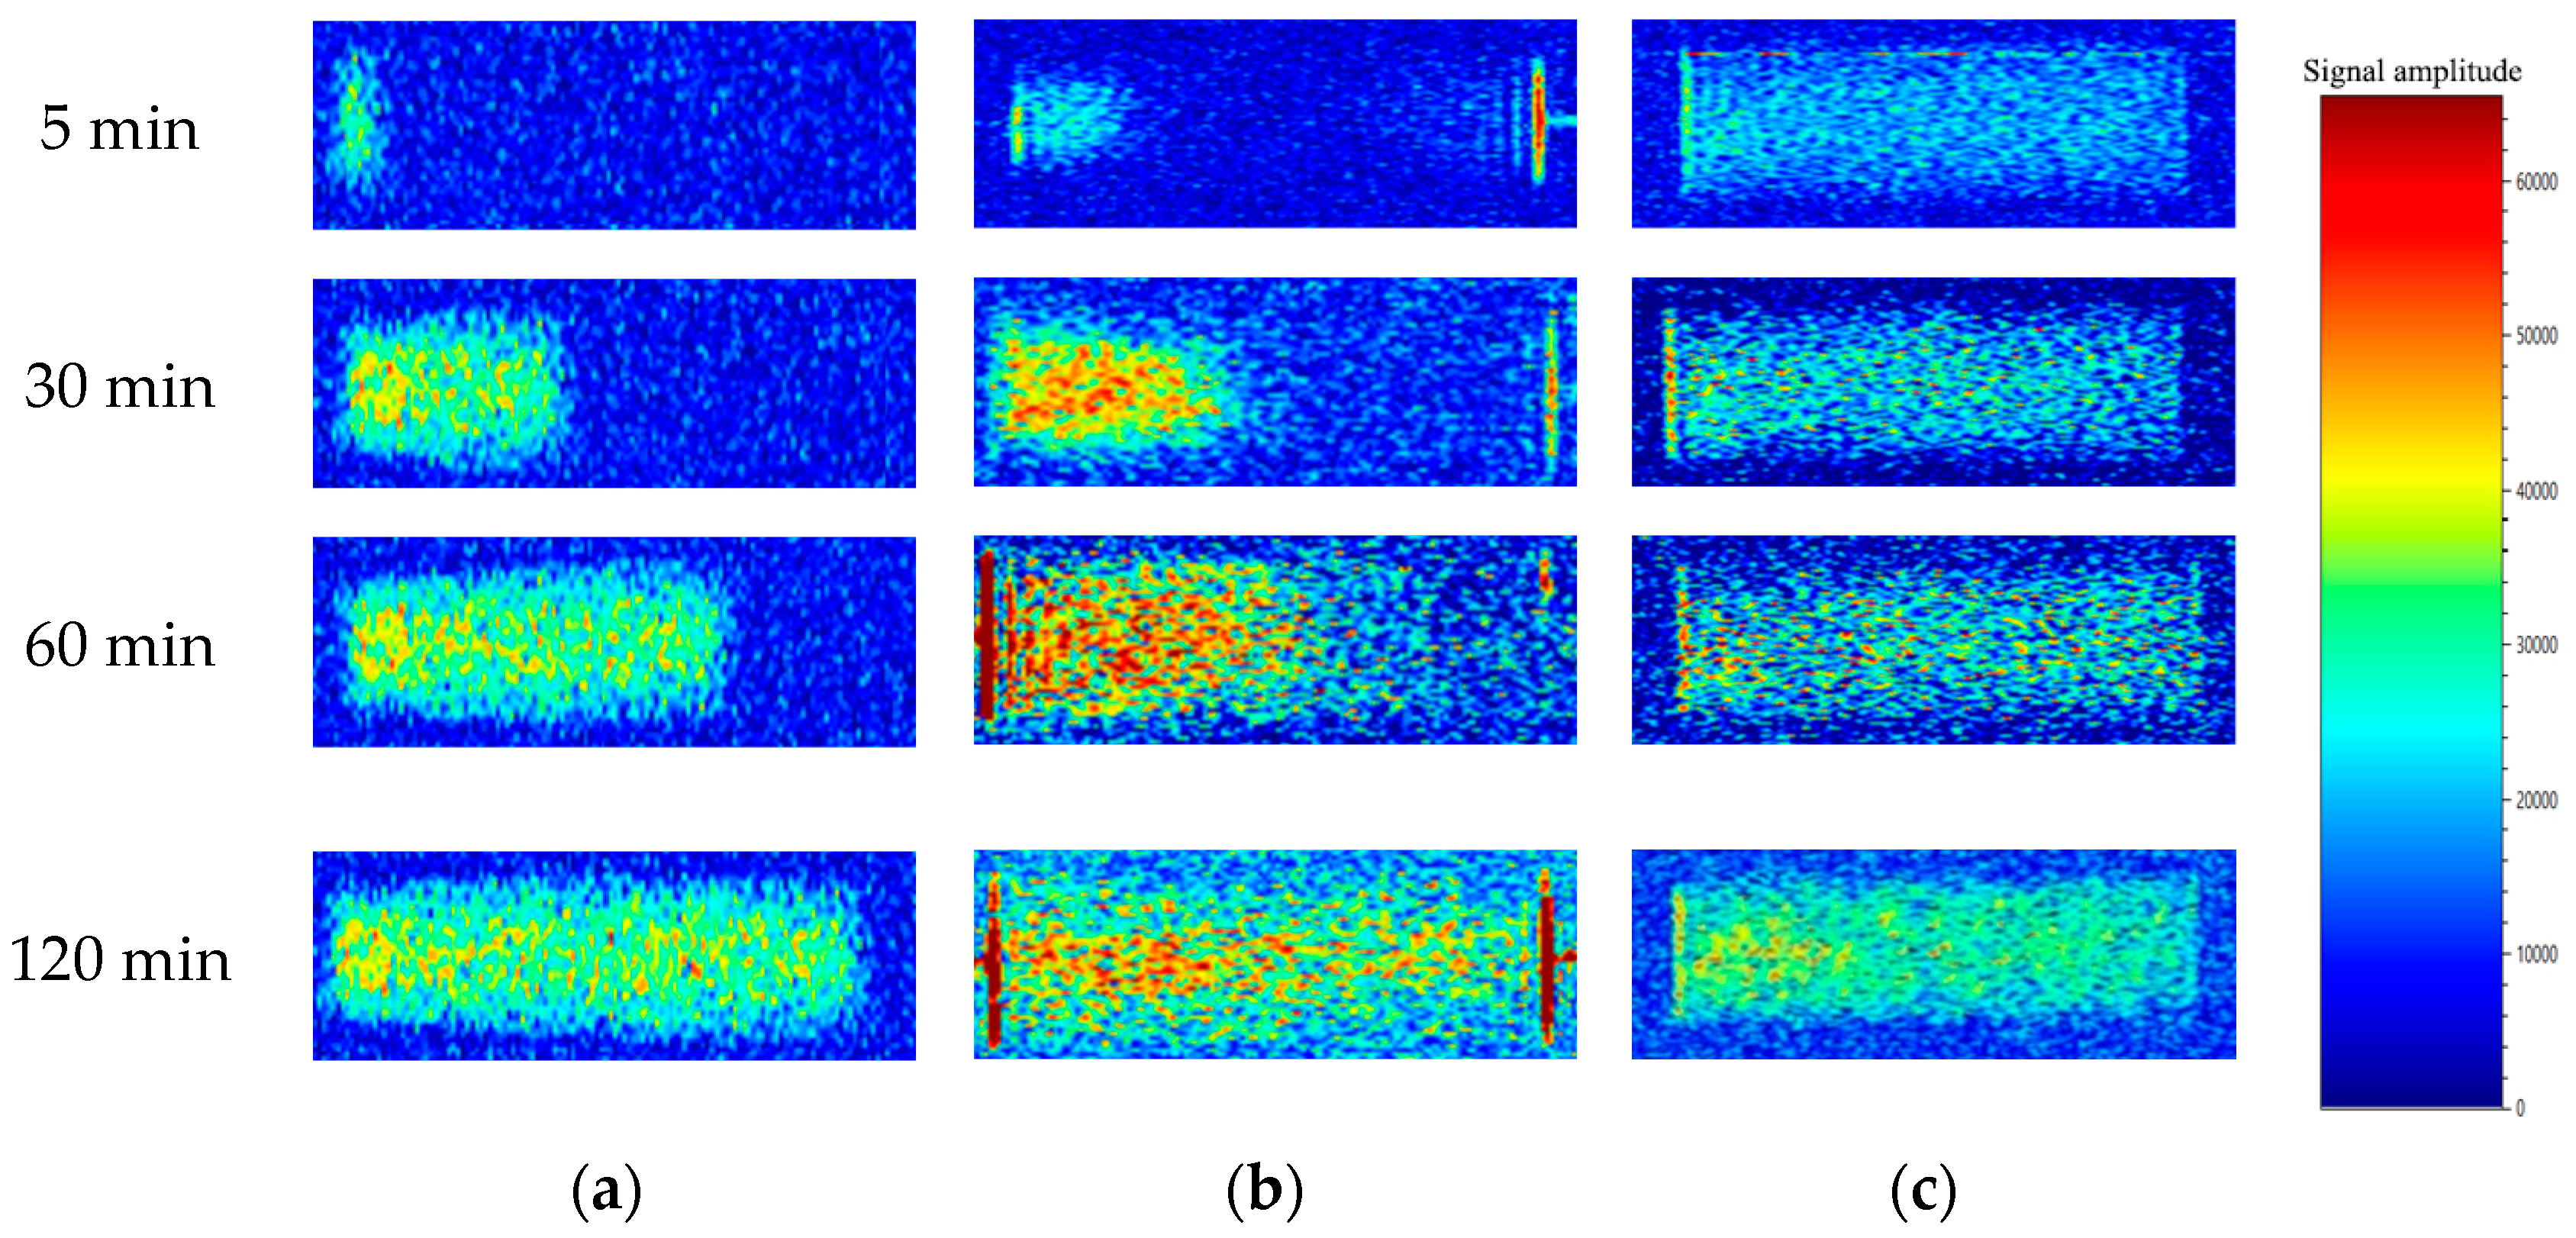
3.1.1. Visual Monitoring of the Invasion Process

Since tight gas contains no hydrogen atoms and hydrogen atoms are only present in the working fluid, the signal collected by the nuclear magnetic resonance (NMR) technique corresponds to the hydrogen atoms in the working fluid. After signal processing, the hydrogen atom density image of the sample was obtained, enabling the visualization of the working fluid migration process within the core. The NMR imaging of the experimental core was tested. Three sets of experimental results of 10-34-1 (0.016 × 10⁻³ μm2), 10-45-8 (0.171 × 10⁻³ μm2), and 8-7-5 (3.02 × 10⁻³ μm2) were selected for representative comparative analysis under the same experimental conditions.
Figure 4 shows the working fluid entering from the inlet end, where the imaging color saturation is high, indicating a significant accumulation of the working fluid. During the invasion process, the working fluid can be seen continuously advancing toward the outlet end. The working fluid in cores 8-7-5 advances toward the outlet end, reaching it in only 5 min, while the working fluid in cores 10-34-1 and 10-45-8 advances toward the outlet end, reaching it after 120 min. This indicates that higher core permeability results in a faster advancement of the working fluid under the same pore pressure and working fluid pressure. Compared to the same position of the core, with the invasion time increasing, the imaging color saturation gradually increases, indicating that the working fluid will continue to fill the pore throat in the core, and the working fluid volume gradually increases. When the imaging color saturation stabilizes, the working fluid within the pore throats of the core nears saturation.

3.1.2. The Working Fluid Invasion Rate Variation Law

A further analysis was conducted on the relationship between the invasion rate and time, calculating the working fluid invasion rate at various times (Equation (1)):
v = L n L n 1 Δ t
where v is the working fluid invasion rate, in cm/min; Ln is the front edge position of the working fluid at a certain time, in cm; Ln−1 is the front edge position of the working fluid at the previous moment, in cm; and Δt is the adjacent time interval, in min.
As shown in Figure 5a, in the comparative analysis of 10-34-1, 10-45-8, and 8-7-5—three groups of cores under the same experimental conditions—the working fluid invasion rate at 5 min was 0.130 cm/min, 0.308 cm/min, and 1.402 cm/min. The average working fluid invasion rate was 0.074 cm/min, 0.115 cm/min, and 0.701 cm/min. Due to the limitation of the experimental scale, the working fluid in cores 8-7-5 fully invaded the space after 5 min, making it impossible to calculate the subsequent invasion rate. The results show that the higher the permeability, the faster the invasion rate, which is consistent with the analytical conclusions of core visualization. As shown in Figure 5b, in the comparative analysis of 10-45-8, 10-45-3, and 44-37-5—three groups of cores with a similar permeability—the working fluid invasion rate at 5 min was 0.309 cm/min, 0.250 cm/min, and 0.224 cm/min. The average working fluid invasion rate was 0.115 cm/min, 0.099 cm/min, and 0.093 cm/min. The results show that, in the early stage of invasion, the smaller the pore pressure, the faster the invasion rate.

3.1.3. The Variation Law for the Real-Time Invasion Flow Rate of the Working Fluid

As shown in Figure 6, the real-time invasion flow rate of the working fluid was relatively large in the early stage but immediately dropped in a sharp manner. In the middle stage, the real-time invasion flow rate of the working fluid decreased slowly. In the late stage, the real-time invasion flow rate of the working fluid fluctuated within an extremely small range. In the comparative analysis of 8-10-6, 10-45-3, and 71-48-1—three groups of cores under the same experimental conditions—the maximum real-time invasion flow rate of the working fluid was 3.5379 mL/min, 0.4051 mL/min, and 0.2754 mL/min. The average real-time invasion flow rate was 0.2136 mL/min, 0.0492 mL/min, and 0.0240 mL/min. The results show that permeability positively correlates with the real-time invasion flow rate. The higher the permeability, the greater the real-time invasion flow rate. In the comparative analysis of 10-45-8, 10-45-3, and 44-37-5—three groups of cores with similar permeability—the maximum real-time invasion flow rate of the working fluid was 0.7403 mL/min, 0.4051 mL/min, and 0.3492 mL/min. The average real-time invasion flow rate was 0.0962 mL/min, 0.0492 mL/min, and 0.0381 mL/min. The results show that the pore pressure significantly affects the real-time invasion flow rate of the working fluid. The real-time invasion flow rate decreases with the increase in the pore pressure.

3.1.4. Theoretical Analysis of Working Fluid Invasion Mechanisms

The working fluid needs to overcome the effects of capillary pressure and viscous resistance to invade the core [16,17,18]. In the early stages of invasion, viscous resistance is minimal. Therefore, in the early stage of working fluid invasion, the real-time invasion flow rate of the working fluid is high, and the invasion rate is fast. As shown in Figure 7, the capillary pressure curves of cores with different permeabilities vary significantly. As permeability increases, the capillary pressure curve shifts downward and to the left, with capillary pressure decreasing sharply [19]. Therefore, under the same displacement pressure, a higher permeability corresponds to a greater real-time invasion flow rate of the working fluid and a faster working fluid invasion rate. However, as the fluid content within the core pore throats increases, the viscous resistance between the fluid and the capillaries rises. Under the combined influence of capillary force, viscous resistance, inertial force, and external force, the working fluid invasion rate decreases [20]. Zhang et al. [21] conducted gas–water relative permeability test experiments under different pressure conditions, finding that the seepage resistance positively correlated with the pore pressure. Therefore, the seepage resistance coefficient during the displacement process increases alongside the pore pressure: the lower the pore pressure, the higher the real-time invasion flow rate of the working fluid and invasion rate.

3.2. Working Fluid Damage Evaluation

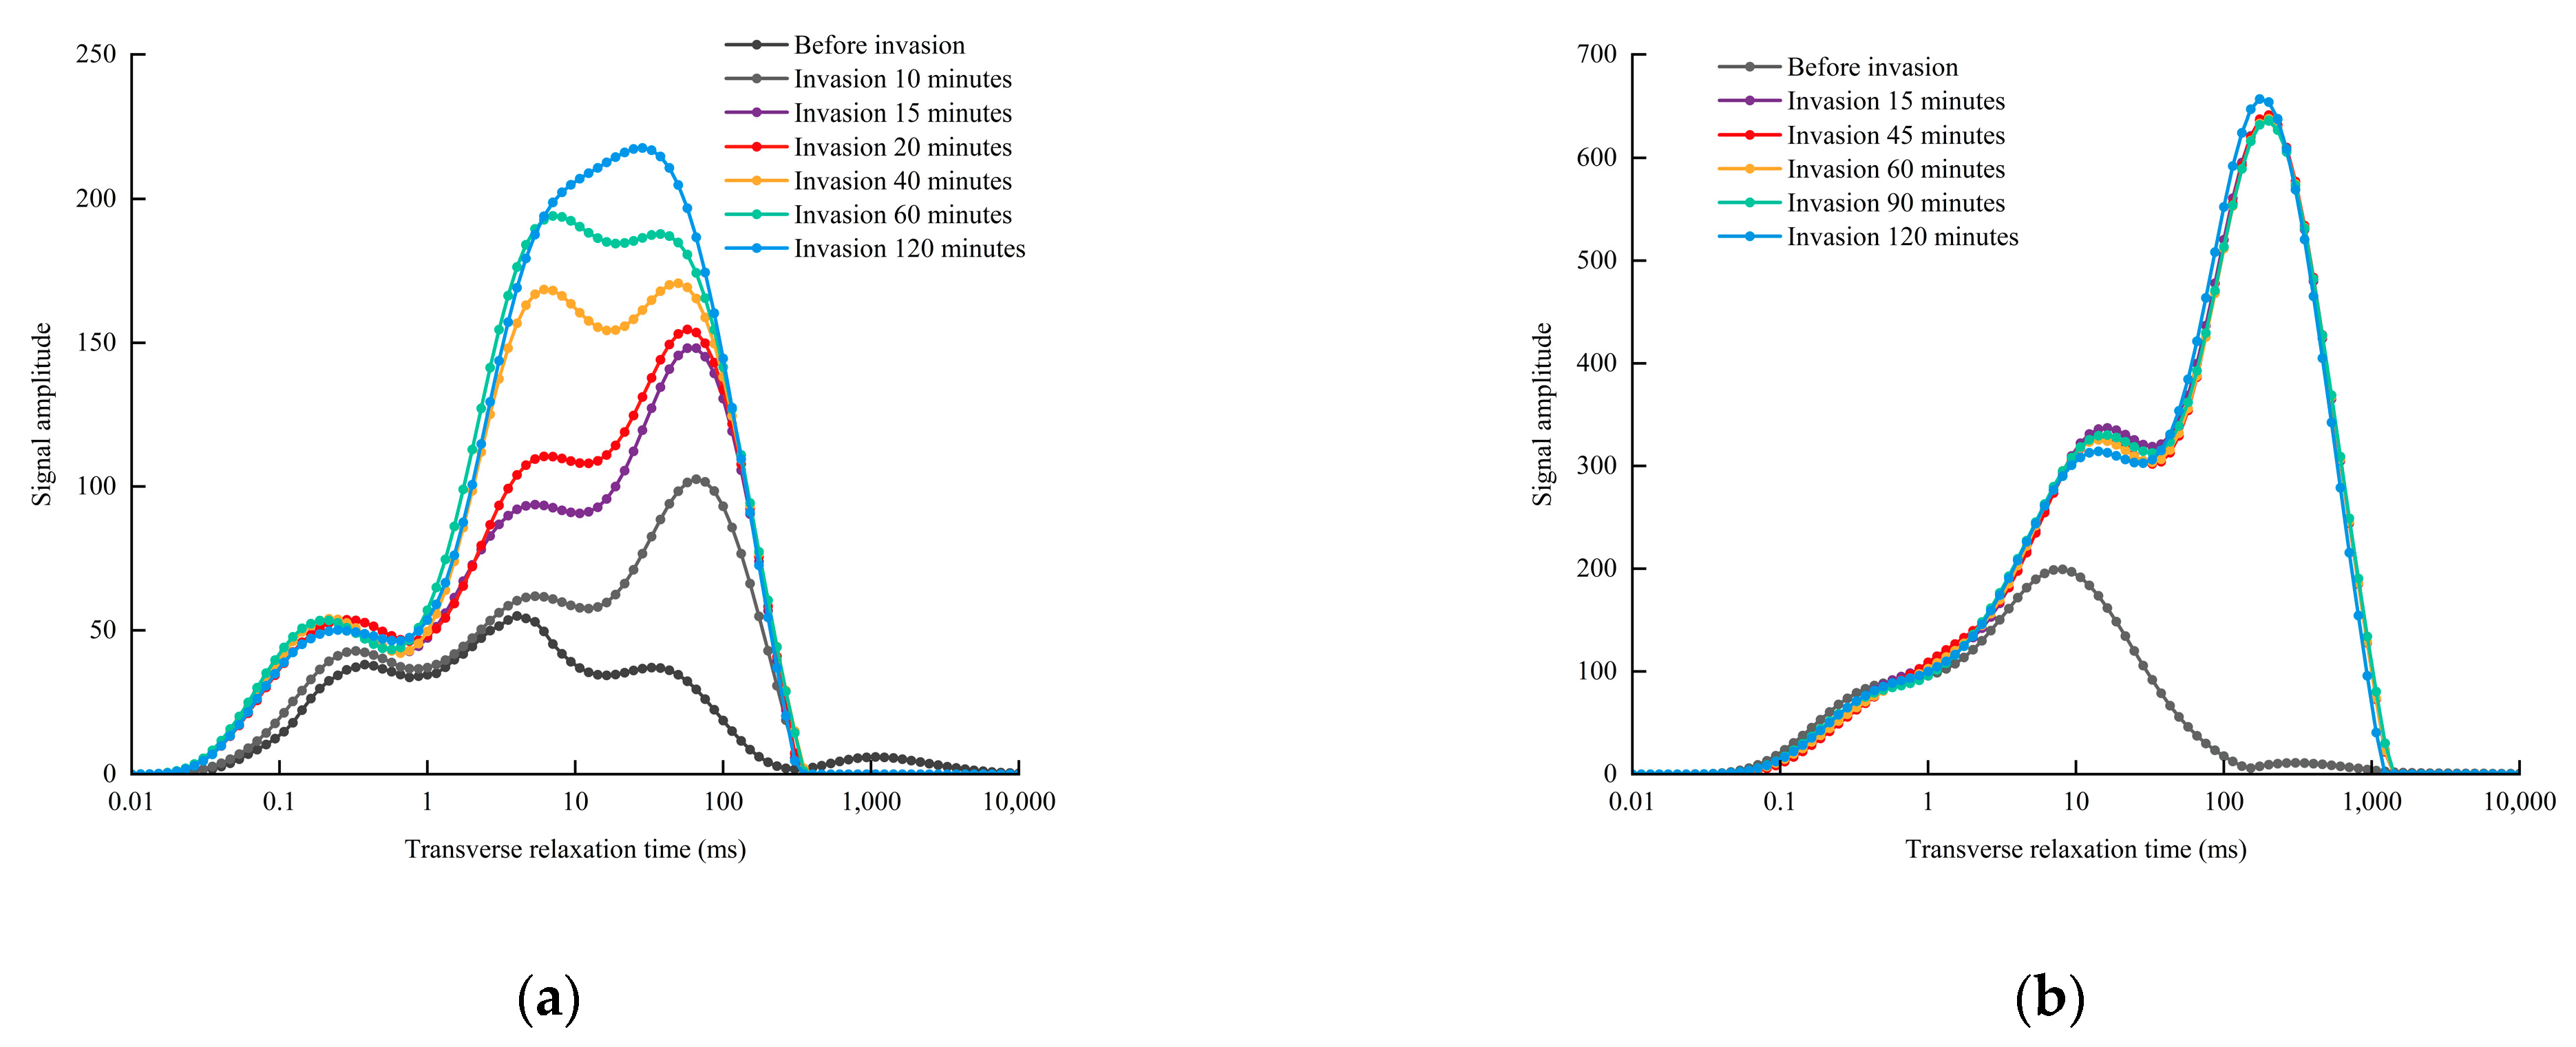
3.2.1. Real-Time T2 Spectrum of Damage

The T2 spectra of the working fluid invasion process for cores 10-45-3 (0.166 × 10⁻³ μm2) and 8-7-11 (7.76 × 10⁻³ μm2) were analyzed (Figure 8). The results show that, compared to the T2 spectrum at different times, fine pores and macropores are filled with working fluid in the early stage. In the late stage, the working fluid in fine pores increases slowly, and the working fluid mainly fills the macropores. During the working fluid invasion process, the working fluid first saturates the fine pores and then stops increasing. Meanwhile, the working fluid continues to fill the macropores until saturation. The core with high permeability reaches a state of near saturation when the working fluid invades the space initially. In contrast, the core with low permeability reaches a state of near saturation over a long period of time.
The occurrence state of fluid within different core pore throats varies [22]. In the displacement process, the fluid in the fine pores exists in the “thick water film” form under strong interfacial tension and high capillary pressure. The residual fluid saturation is high, reducing seepage channels and increasing seepage resistance. Therefore, the working fluid in the fine pores increases slowly in the later stage. The fluid in the macropores exists in the “thin water film” form under the interfacial tension, and the residual fluid saturation is low, which has little effect on the fluid seepage. Therefore, the macropores are consistently filled with working fluid in both the early and later stages of working fluid invasion. For completely saturated cores, the worse the physical properties, the more residual water is left in the reservoir pores, and the more influence on the seepage channel, the longer is the time to saturation in the core with lower permeability.

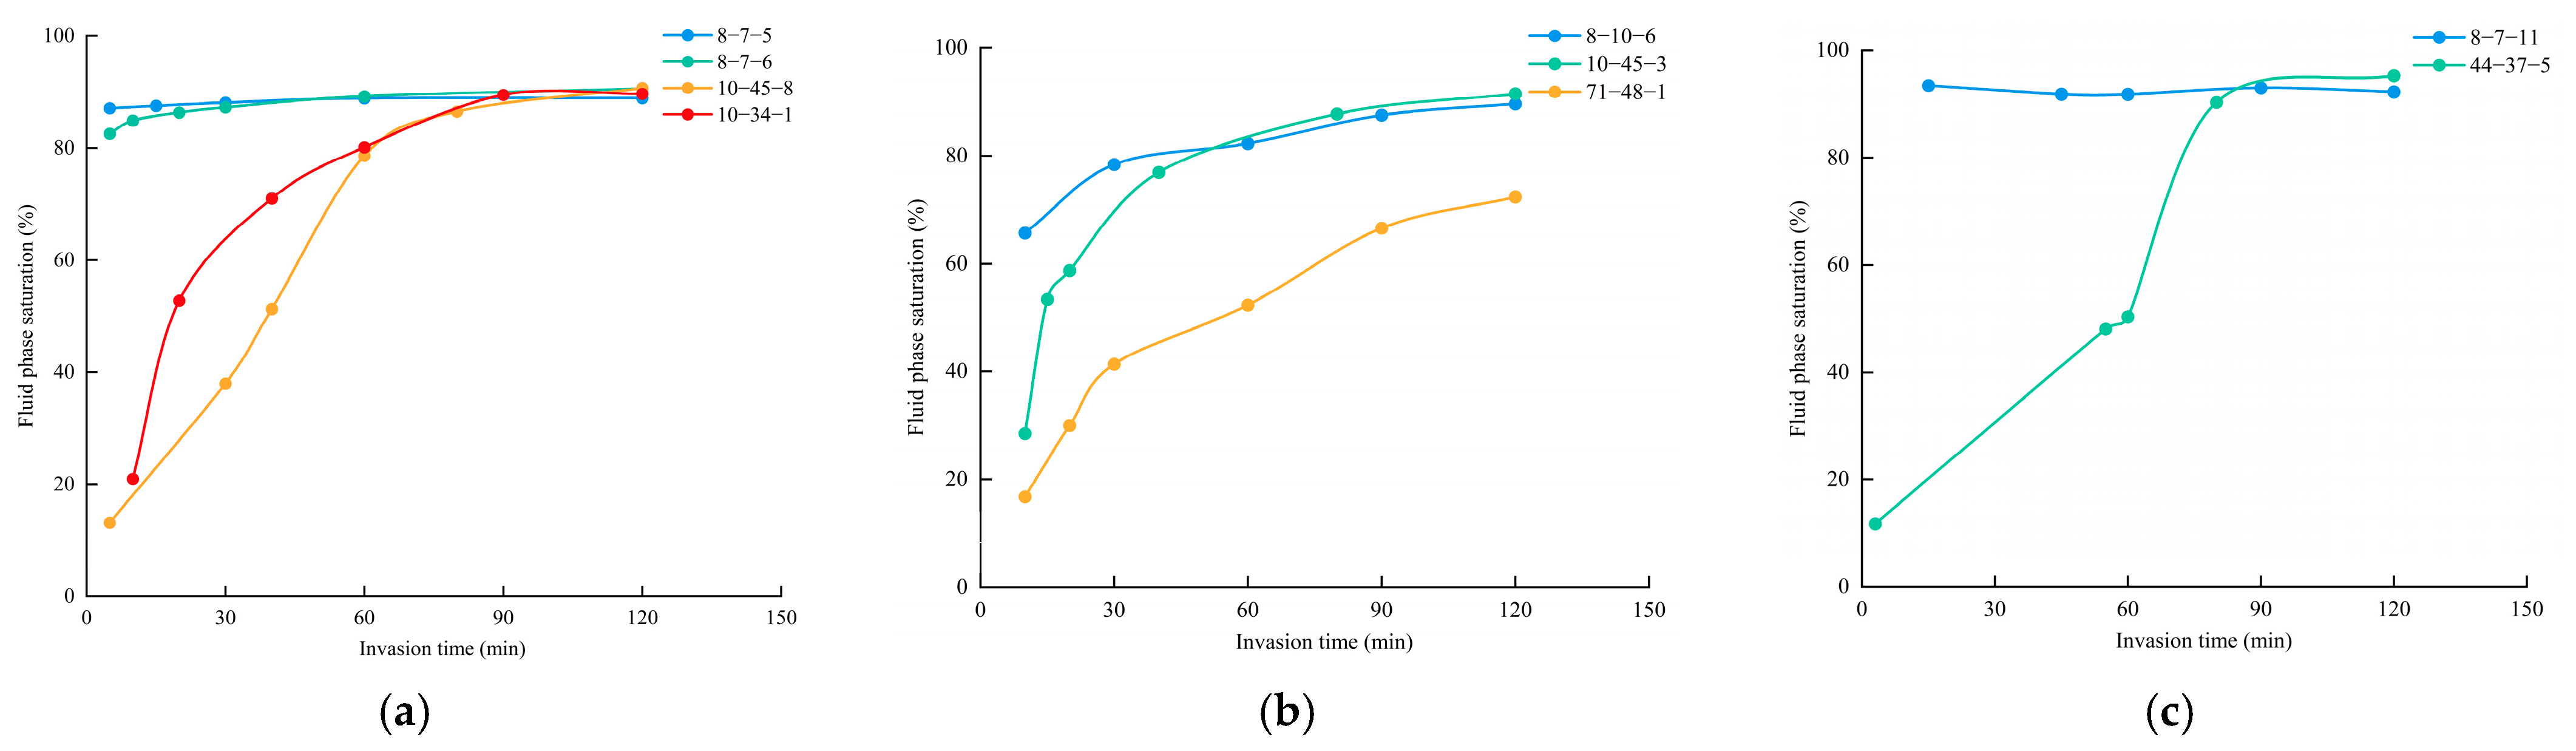
3.2.2. Fluid Saturation Variation Law

Fluid saturation refers to the proportion of the working fluid to the core pore volume, and the fluid in the pore throat space has a certain influence on the gas-phase seepage capacity [23,24]. As fluid saturation increases, the gas seepage capacity decreases, and the extent of damage caused by working fluid invasion increases. As shown in Figure 9, fluid saturation increases over time, initially at a rapid rate which gradually slows down. In the early stage, fluid saturation rises quickly, but, after 50 min, the growth rate decelerates. After 120 min, the working fluid has fully invaded the core, occupying more than 70% of the pore volume. For cores with permeability greater than 0.5 × 10⁻³ μm2, fluid saturation exceeds 60%, whereas for those with permeability below 0.5 × 10⁻³ μm2, fluid-phase saturation remains under 30%. During the early stages of working fluid invasion, cores with a higher permeability experience more significant invasion damage. For cores with permeability greater than 0.5 × 10⁻³ μm2, fluid saturation exceeds 80% within 10 min, whereas for cores with permeability less than 0.5 × 10⁻³ μm2, it takes 70 min to surpass 80%. A higher permeability enables the working fluid to more rapidly fill most of the pore throats in the core.

3.3. Comprehensive Analysis

As shown in Figure 10 and Figure 11, the core fluid saturation after working fluid invasion exceeds 70%, with permeability damage reaching 95% or higher (Equation (2)). The invasion-phase saturation is influenced by both permeability and pore pressure. At the same reservoir pore pressure, the invasion-phase saturation is higher when the permeability ranges between 0.1 × 10⁻³ μm2 and 1 × 10⁻³ μm2. This means that, for cores with similar permeability, the higher the pore pressure, the higher the invasion-phase saturation. The extent of invasion damage is influenced by both permeability and pore pressure. At the same reservoir pore pressure, invasion damage is particularly severe when permeability ranges between 0.1 × 10⁻³ μm2 and 1 × 10⁻³ μm2. This means that, for cores with similar permeability, the higher the pore pressure, the higher the extent of invasion damage. In the case of cores 44-37-5, the extent of invasion damage approaches 100%, and the core permeability is extremely low after working fluid damage.
I z = ( 1 - K 1 K 0 ) × 100 %
In Equation (2), Iz is the extent of invasion damage, K0 is the initial permeability at atmospheric pressure, ×10−3 μm2, and K1 is the permeability after core damage, ×10−3 μm2.

4. Conclusions

(1)
Permeability is positively correlated with the real-time invasion flow rate and the invasion rate: the higher the permeability, the greater the real-time invasion flow rate and the faster the invasion rate. The pore pressure also significantly impacts the real-time invasion flow rate and invasion rate. As the pore pressure increases, the real-time invasion flow of the working fluid decreases, and the invasion rate slows down.
(2)
During construction, working fluid invasion into the reservoir significantly increases fluid saturation. Experimental results indicate that fluid saturation typically reaches or exceeds 70%, with some samples exceeding 90%. The increase in fluid saturation causes severe damage to the gas-phase permeability of the reservoir, with damage extent exceeding 95%, particularly in low-permeability tight cores.
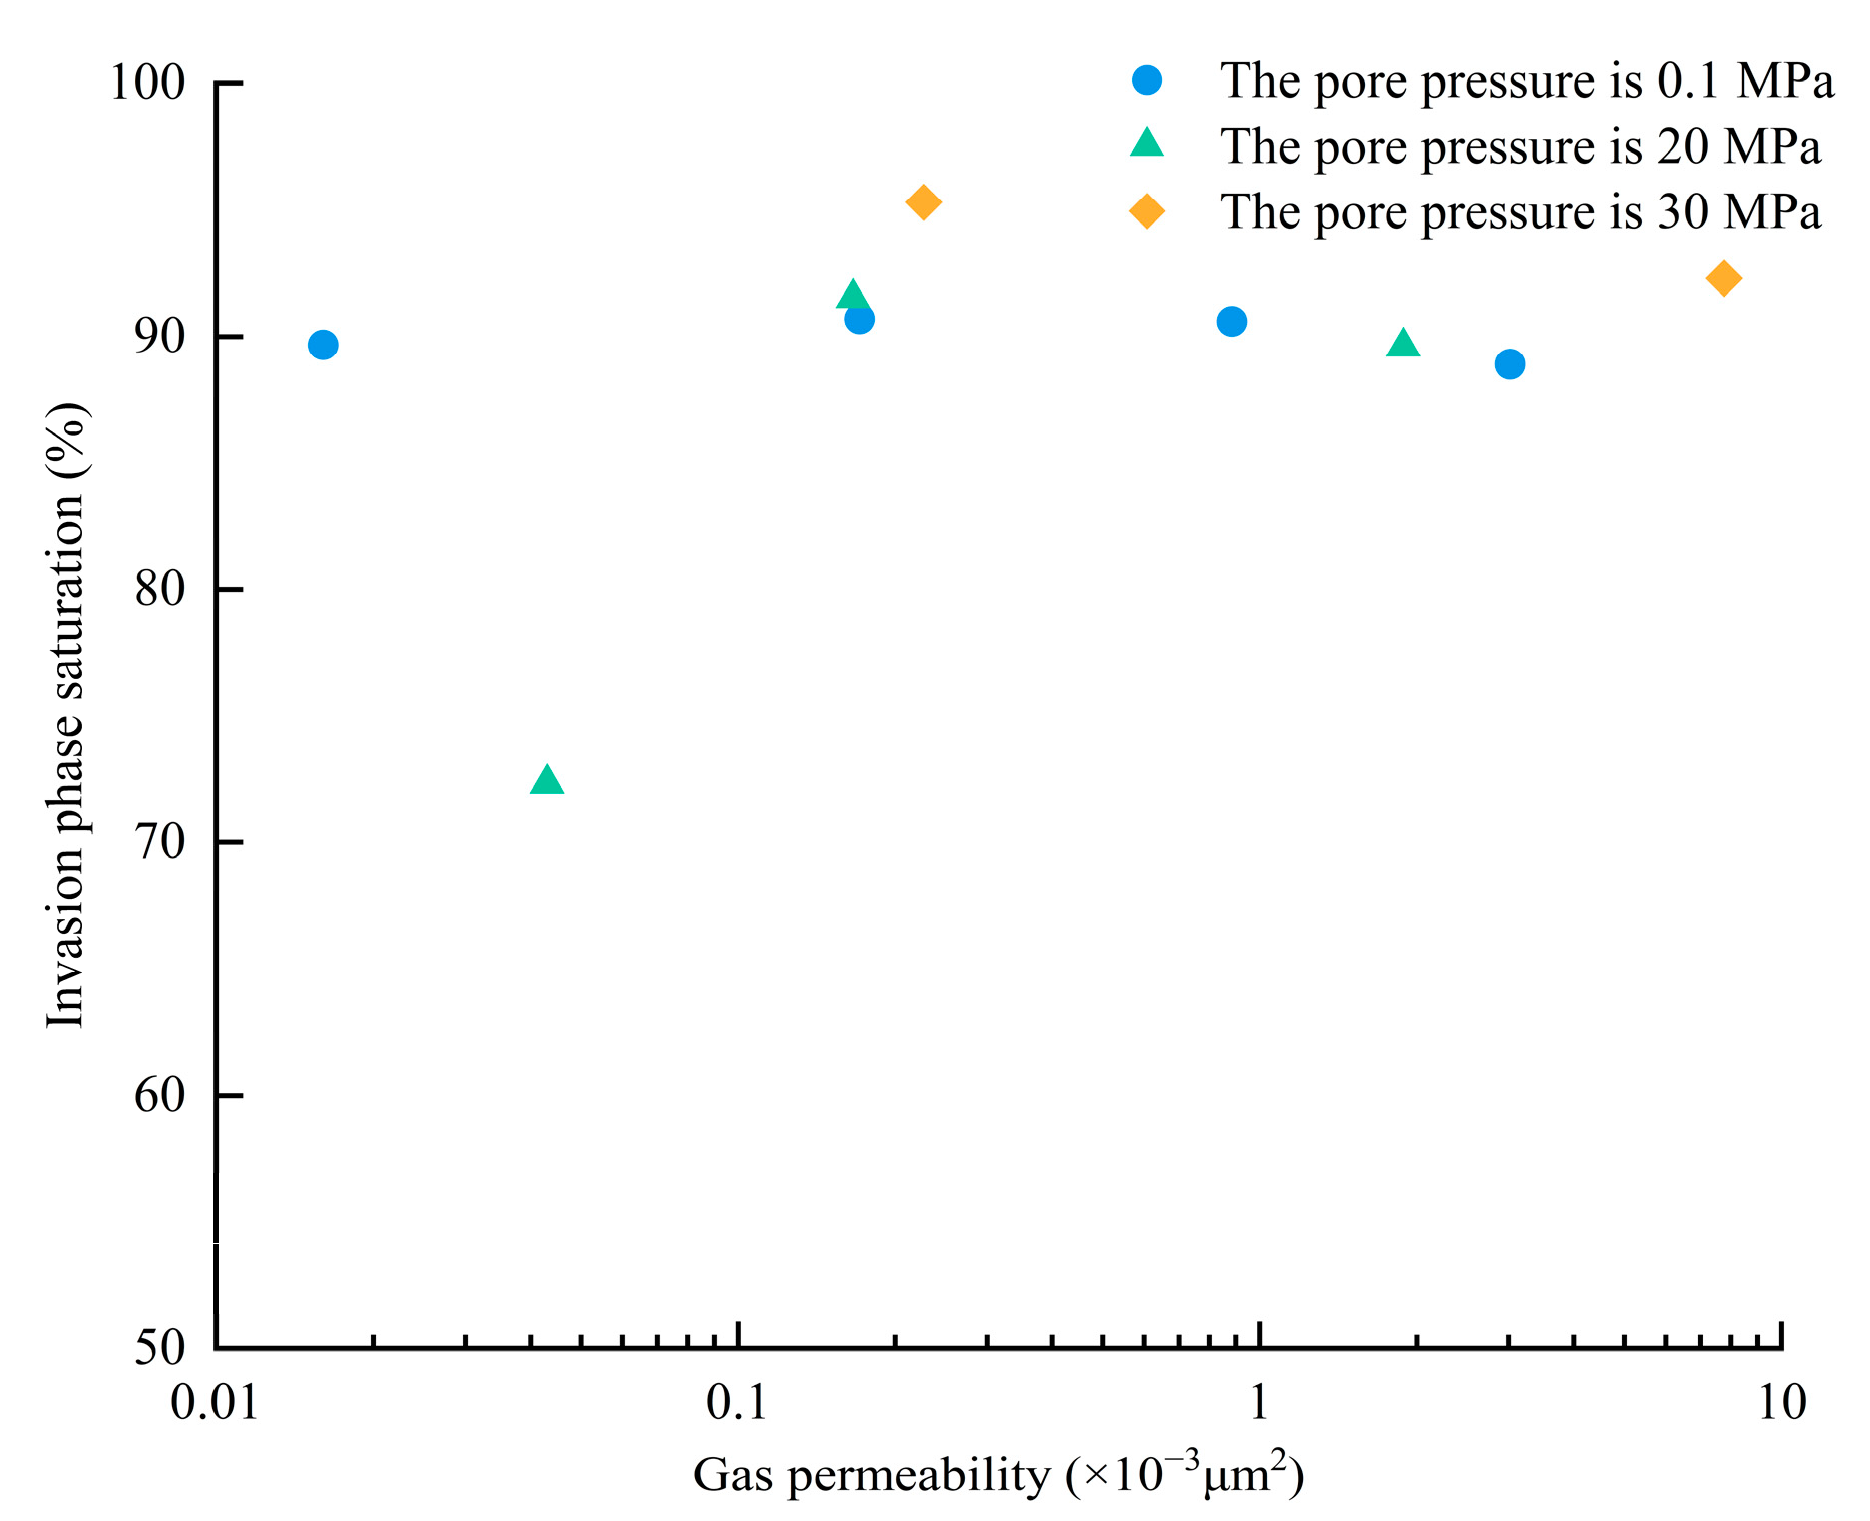
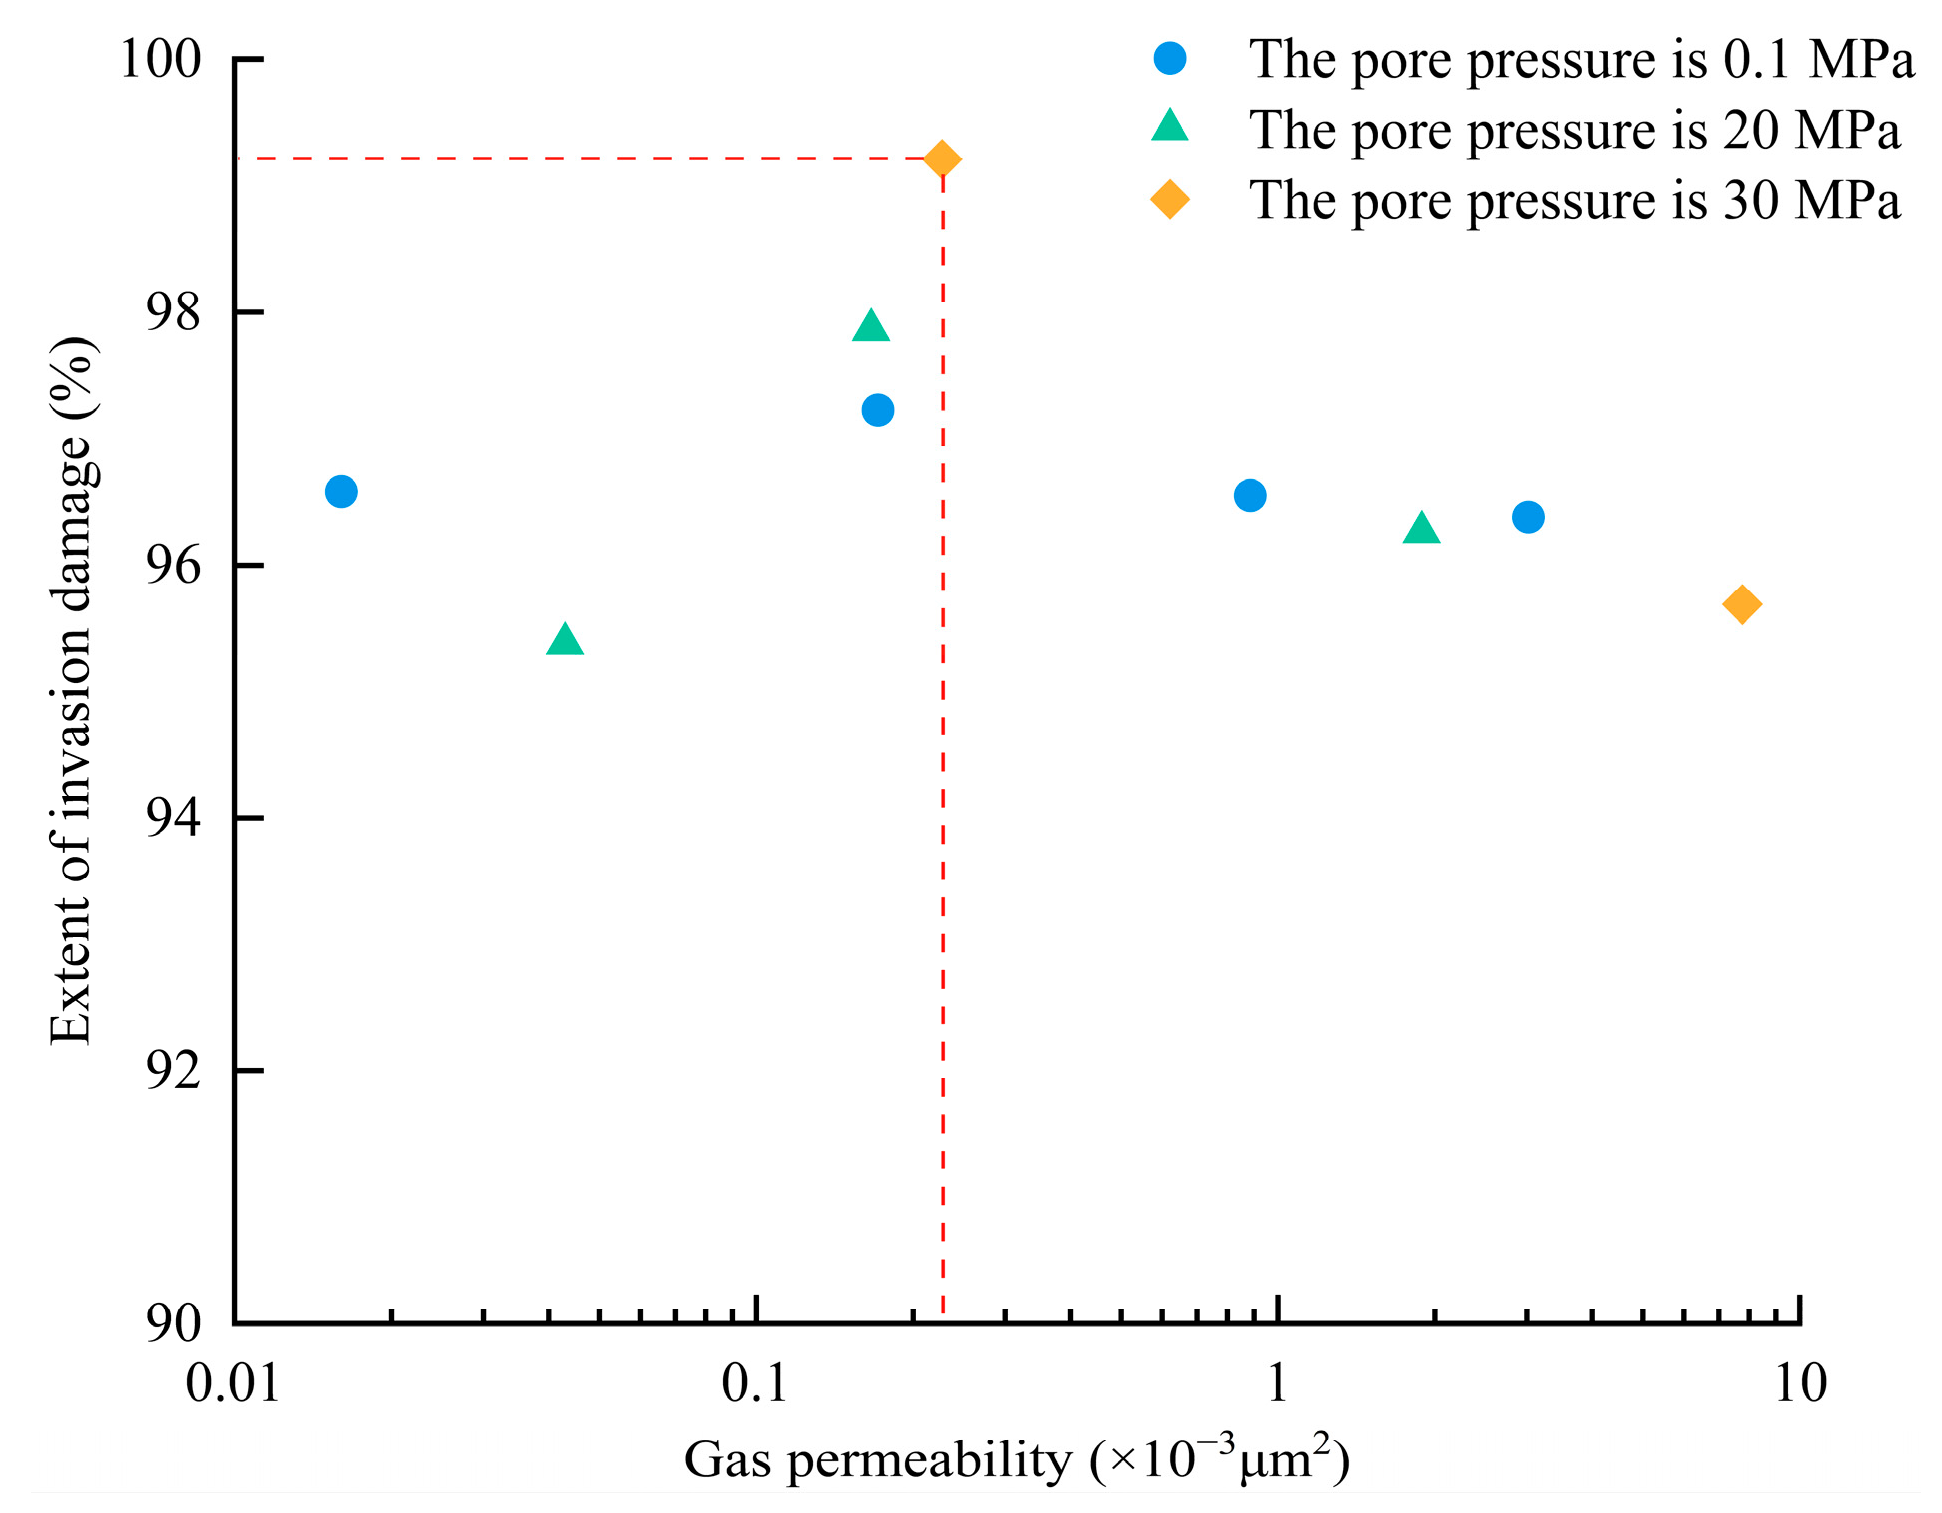
(3)
Both permeability and pore pressure influence the invasion-phase saturation and the extent of invasion damage. At the same reservoir pore pressure, cores with permeability ranges between 0.1 × 10⁻³ μm2 and 1 × 10⁻³ μm2 exhibit higher fluid-phase saturation and greater invasion damage. This means that, for cores with similar permeability, the higher the pore pressure, the higher the invasion-phase saturation and the greater the extent of invasion damage.
(4)
Due to the limited number and size of the samples in this experiment, the conclusions can only be qualitatively analyzed. Effectively removing or reducing the damage in the early stage of development is critical for cost-effective development. Further investigation is needed to explore the influence of the backflow of working fluid and the variation in working fluid with the gas extracted on the degree of reservoir damage during the production process.

Author Contributions

Conceptualization, L.C. and Y.H.; methodology, L.C. and Y.H.; software, J.W.; validation, C.J. and J.L.; formal analysis, Y.Z.; investigation, C.G.; resources, L.C. and Y.H.; data curation, Y.H.; writing—original draft preparation, L.C. and Y.H.; writing—review and editing, S.H. and F.F.; visualization, S.H.; supervision, S.H. and F.F.; project administration, S.H.; and funding acquisition, L.C. and Y.H. All authors have read and agreed to the published version of the manuscript.

Funding

This research was funded by the China National Petroleum Corporation (CNPC) Technical Tackling and Field Trial Programs (101023yq1005001b31).

Data Availability Statement

The data presented in this study are available upon request from the corresponding author. The data are not publicly available due to some data confidentiality restrictions.

Conflicts of Interest

Authors Yong Hu, Jiping Wang, Chunyan Jiao, Jianning Luo, Yuanyuan Zhang and Changmin Guo were employed by the company PetroChina. The remaining authors declare that the research was conducted in the absence of any commercial or financial relationships that could be construed as a potential conflict of interest.

References

  1. Ma, X.; Jia, A.; Tan, J.; He, D. Tight sand gas development technologies and practices in China. Petrol. Explor. Develop. 2012, 39, 572–579. [Google Scholar] [CrossRef]
  2. Li, X.; Wang, L.; Wang, W.; Xiao, Y.; Chen, B.; Zhang, Y.; Zhou, C.; Ma, Z.; Shi, H. Innovation and efficient development practice of key fracturing technologies based on slim-hole completion: A case study of tight gas reservoir in Sulige Gasfield. Nat. Gas Ind. 2022, 42, 76–83. [Google Scholar] [CrossRef]
  3. Jia, A.; Wei, Y.; Guo, Z.; Wang, G.; Meng, D.; Huang, S. Development status and prospect of tight sandstone gas in China. Nat. Gas Ind. 2022, 42, 83–92. [Google Scholar] [CrossRef]
  4. Shi, H.; Ding, Y.; Ding, L.; Li, X.; Lyu, X.; Yin, X. Damage mechanism of fracturing fluid in the eastern Sulige Gasfield and countermeasures. J. Oil Gas Technol. 2013, 35, 131–135. [Google Scholar]
  5. Zhu, J.; You, L.; Li, J.; Kang, Y.; Zhang, J.; Zhang, D.; Huang, C. Damage evaluation on oil-based drill-in fluids for ultra-deep fractured tight sandstone gas reservoirs. Nat. Gas Ind. 2017, 37, 62–68. [Google Scholar] [CrossRef]
  6. Li, G.; Cai, W.; Meng, Y.; Wang, L.; Wang, L.; Zhang, X. Experimental evaluation on the damages of different drilling modes to tight sandstone reservoirs. Nat. Gas Ind. 2017, 37, 69–76. [Google Scholar] [CrossRef]
  7. Huang, W.; Lei, M.; Teng, X.; Zhu, J.; Li, N.; Zhang, Z.; Zhou, B. Damaging mechanism of tight sandstone gas reservoirs and optimization of drilling fluids for reservoir protection. Drill. Fluid Complet. Fluid 2018, 35, 33–38. [Google Scholar] [CrossRef]
  8. Xi, S.; Yan, W.; Liu, X.; Zhang, C.; Yin, L.; Dong, G.; Jing, X.; Wei, L. New fields, new types, and resource potential of natural gas exploration in Ordos Basin. Acta Pet. Sin. 2024, 45, 33–51. [Google Scholar] [CrossRef]
  9. Zhao, W.; Huang, D.; Wang, K.; Hu, X.; Hui, J.; Chen, Y. Accumulation conditions and key technologies of exploration and development for Qingshimao gas field in Ordos Basin. Acta Pet. Sin. 2023, 44, 1739–1754. [Google Scholar] [CrossRef]
  10. Xu, B.; Li, L.; He, Q.; Luo, Y.; Zhang, Y.; Li, G. Discussion on damage mechanism of fracturing fluid in tight sandstone reservoir. Fault-Block Oil Gas Field 2013, 20, 639–643. [Google Scholar] [CrossRef]
  11. Xu, L.; Zhang, S.; Ma, X. Characteristics of Damage of Guar Fracturing Fluid to Reservoir Permeability. Xinjiang Pet. Geol. 2016, 37, 456–459. [Google Scholar] [CrossRef]
  12. Cao, Y.; Qu, Z.; Guo, T.; Xu, H.; Gong, D. Experimental study on damage mechanism of water-based fracturing fluid to reservoir. J. Xi’an Shiyou Univ. (Nat. Sci. Ed.) 2016, 31, 87–92. [Google Scholar] [CrossRef]
  13. Guo, J.; Li, Y.; Wang, S. Hydrogen bond inhibition method: Reducing the adsorption damage of guar fracturing fluid to sandstone reservoirs. Nat. Gas Ind. 2019, 39, 57–62. [Google Scholar] [CrossRef]
  14. Tang, H.; Tang, H.; He, J.; Zhao, F.; Zhang, L.; Liao, J.; Wang, Q.; Yuan, X. Damage mechanism of water-based fracturing fluid to tight sandstone gas reservoirs: Improvement of the evaluation measurement for properties of water-based fracturing fluid: SY/T 5107-2016. Nat. Gas Ind. 2020, 40, 55–63. [Google Scholar] [CrossRef]
  15. National Energy Administration. Lab Testing Method of Drilling and Completion Fluids Damaging Oil Formation: SY/T 6540-2021; Petroleum Industry Press: Beijing, China, 2021. [Google Scholar]
  16. Hu, Y.; Li, X.; Wan, Y.; Lu, J.; Zhu, H.; Zhang, Y.; Zhu, Q.; Yang, M.; Niu, L. Physical simulation on gas percolation in tight sandstone. Petrol. Explor. Develop. 2013, 40, 580–584. [Google Scholar] [CrossRef]
  17. Dong, X.; Meng, X.; Pu, R. Occurrence characteristics of movable fluids based on the division of pore throat system in tight gas reservoir by fractal theory. Nat. Gas Ind. 2023, 43, 78–90. [Google Scholar] [CrossRef]
  18. Li, X.; Feng, D.; Zhang, T.; Sun, Z.; He, M.; Liu, Q.; Liu, W.; Zhao, W.; Li, J. The role and its application of capillary force in the development of unconventional oil and gas reservoirs. Acta Pet. Sin. 2020, 41, 1719–1733. [Google Scholar] [CrossRef]
  19. Ren, X.; Li, A.; Wang, Y.; Wu, S.; Wang, G. Pore structure of tight sand reservoir and its influence on percolation—Taking the Chang 8 reservoir in Maling oilfield in Ordos Basin as an example. Oil Gas Geol. 2015, 36, 774–779. [Google Scholar] [CrossRef]
  20. Li, G.; Ren, W.; Meng, Y.; Wang, C.; Wei, N. Micro-flow kinetics research on water invasion in tight sandstone reservoirs. J. Nat. Gas Sci. Eng. 2014, 20, 184–191. [Google Scholar] [CrossRef]
  21. Zhang, J.; Gao, S.; Xiong, W.; Ye, L.; Liu, H.; Zhu, W.; Yang, Y.; Niu, W. A new productivity model based on gas-water seepage resistance coefficient for tight sandstone reservoirs. Nat. Gas Ind. 2023, 43, 177–187. [Google Scholar] [CrossRef]
  22. Li, X.; Hu, Y.; Xu, X.; Jiao, C. Research and Application of Tight Sandstone Gas Development Mechanism; Science Press: Beijing, China, 2020. [Google Scholar]
  23. Sheng, J.; Sun, W.; Duan, B.; Liu, Y.; Zhang, T.; Cao, L. Water lock effect mechanism of tight sandstone gas reservoir: An example of the He 8 reservoir of the upper Paleozoic in the southeast region of Sulige Gasfield. Nat. Gas Geosci. 2015, 26, 1972–1978. [Google Scholar] [CrossRef]
  24. Ye, L.; Gao, S.; Yang, H.; Xiong, W.; Hu, Z.; Iiu, H.; Du, S. Water production mechanism and development strategy of tight sandstone gas reservoirs. Nat. Gas Ind. 2015, 35, 41–46. [Google Scholar] [CrossRef]
Figure 1. Thickness map of the He 8 member of the Permian Lower Shihezi Formation in the Qingshimao gas field.
Processes 12 02857 g001
Figure 2. Online NMR displacement system.
Processes 12 02857 g002
Figure 3. Physical simulation experiment of working fluid invading the core.
Processes 12 02857 g003
Figure 4. NMR imaging of the invasion process: (a) 10-34-1; (b) 10-45-8; and (c) 8-7-5.
Processes 12 02857 g004
Figure 5. Change in working fluid invasion rate: (a) working fluid invasion rate under the same experimental conditions; and (b) working fluid invasion rate for cores with similar permeability.
Processes 12 02857 g005
Figure 6. The real-time invasion flow rate of the working fluid: (a) the pore pressure is 0 MPa; (b) the pore pressure is 20 MPa; and (c) the pore pressure is 30 MPa.
Processes 12 02857 g006
Figure 7. Capillary pressure curves of cores with different permeabilities from the Qingshimao gas field.
Processes 12 02857 g007
Figure 8. T2 spectrum of the invasion process: (a) 10-45-3 and (b) 8-7-11.
Processes 12 02857 g008
Figure 9. Change in fluid saturation during the invasion process: (a) the pore pressure is 0 MPa; (b) the pore pressure is 20 MPa; and (c) the pore pressure is 30 MPa.
Processes 12 02857 g009
Figure 10. The relationship between invasion-phase saturation and permeability.
Processes 12 02857 g010
Figure 11. The relationship between the extent of invasion damage and permeability.
Processes 12 02857 g011
Table 1. Experimental design.
Well NameCore NumberPhysical ParametersExperimental Parameters
Length
(cm)
Diameter
(cm)
Porosity
(%)
Permeability
(×10−3 μm2)
Pore Pressure
(MPa)
Working Fluid Pressure (MPa)
Li 44-3310-34-16.972.518.260.0160.15
Li 44-3310-45-87.092.508.900.171
Li 29-268-7-67.182.519.500.884
Li 29-268-7-57.102.5010.813.02
Li 32-3171-48-16.942.506.290.0432025
Li 44-3310-45-36.982.508.750.166
Li 22-248-10-66.432.519.511.885
Li 29-268-7-116.62.511.337.763035
Li 10544-37-57.102.56.680.227
Disclaimer/Publisher’s Note: The statements, opinions and data contained in all publications are solely those of the individual author(s) and contributor(s) and not of MDPI and/or the editor(s). MDPI and/or the editor(s) disclaim responsibility for any injury to people or property resulting from any ideas, methods, instructions or products referred to in the content.

