Article

Optimization Operation Strategy for Comprehensive Energy System Considering Multi-Mode Hydrogen Transportation

1
College of Electrical and New Energy, China Three Gorges University, Yichang 443002, China
2
State Grid Hubei Electric Power Co., Ltd., Jingmen Power Supply Company, Jingmen 448124, China
*
Authors to whom correspondence should be addressed.
Processes 2024, 12(12), 2893; https://doi.org/10.3390/pr12122893
Submission received: 28 October 2024 / Revised: 2 December 2024 / Accepted: 10 December 2024 / Published: 18 December 2024
(This article belongs to the Topic Advances in Power Science and Technology, 2nd Edition)

Abstract

:
The transformation from a fossil fuel economy to a low-carbon economy has reshaped the way energy is transmitted. As most renewable energy is obtained in the form of electricity, using green electricity to produce hydrogen is considered a promising energy carrier. However, most studies have not considered the transportation mode of hydrogen. In order to encourage the utilization of renewable energy and hydrogen, this paper proposes a comprehensive energy system optimization operation strategy considering multi-mode hydrogen transport. Firstly, to address the shortcomings in the optimization operation of existing systems regarding hydrogen transport, modeling is conducted for multi-mode hydrogen transportation through hydrogen tube trailers and pipelines. This model reflects the impact of multi-mode hydrogen delivery channels on hydrogen utilization, which helps promote the consumption of new energy in electrolysis cells to meet application demands. Based on this, the constraints of electrolyzers, combined heat and power units, hydrogen fuel cells, and energy storage systems in integrated energy systems (IESs) are further considered. With the objective of minimizing the daily operational cost of the comprehensive energy system, an optimization model for the operation considering multi-mode hydrogen transport is constructed. Lastly, based on simulation examples, the impact of multi-mode hydrogen transportation on the operational cost of the system is analyzed in detail. The results indicate that the proposed optimization strategy can reduce the operational cost of the comprehensive energy system. Hydrogen tube trailers and pipelines will have a significant impact on operational costs. Properly allocating the quantity of hydrogen tube trailers and pipelines is beneficial for reducing the operational costs of the system. Reasonable arrangement of hydrogen transportation channels is conducive to further promoting the green and economic operation of the system.

1. Introduction

As climate issues are pushed to an unprecedented level, some countries (such as Germany [1], China [2], and the United States [3]) have put forward ambitious goals to address climate change and achieve low-carbon goals. To achieve these commitments, it is necessary to achieve a comprehensive transformation from fossil fuels to renewable energy on a global scale. However, as the share of renewable energy continues to increase, accelerating the process toward net zero emissions, we also face the challenge of how to transport and distribute renewable energy globally [4]. Hydrogen has been identified as a key component of the transformation to a low-carbon economy, and the use of renewable energy to produce hydrogen as a future energy carrier has always been considered the most effective way [5]. Meanwhile, hydrogen is also considered an environmentally friendly energy carrier that reduces carbon emissions.
Hydrogen transportation technology encompasses a range of secure and efficient methods for delivering hydrogen from production sites to end-users, playing a pivotal role in the widespread adoption of hydrogen as an energy source [6,7]. The most common approach is gaseous hydrogen transportation, where hydrogen is distributed in its gaseous form and compressed under high pressure. This compressed hydrogen gas is subsequently stored and transported via hydrogen pipelines or trailers. Specifically, hydrogen long tube trailers and pipelines are frequently employed methods for transporting gaseous hydrogen. Owing to their relatively low cost and comprehensive infrastructure, they are extensively utilized. Depending on factors such as transportation distance, scale, and geographical features, effective hydrogen pipelines and long-distance trailers can be chosen to facilitate hydrogen transportation [8].
Numerous studies have been carried out on the operation of gaseous hydrogen. Specifically, for long tube trailers, compressed hydrogen cylinders or pressure vessels are mounted onto specialized trailers, and the hydrogen produced is compressed to high pressure to ensure safe transportation. This compression reduces the volume of hydrogen gas, thereby enhancing the feasibility of transportation [9]. These trailers commonly feature multiple cylinders or pipes mounted on their chassis and typically transport compressed hydrogen to end-users or storage facilities via roads. Upon reaching the destination, the trailer is connected to the hydrogen system to transfer the compressed hydrogen gas to storage facilities or directly to end-user applications, such as gas stations or industrial sites. Similarly, hydrogen must be compressed before it enters the hydrogen pipeline. The compression pressure may vary based on the pipeline’s design and distance [10]. Once compressed, the hydrogen gas is injected into the pipeline for long-distance transportation. The pipeline material must be compatible with hydrogen to prevent issues like hydrogen embrittlement [11]. The operation of the pipeline must be continuously monitored and controlled to maintain optimal pressure, flow rate, and safety. Additionally, leakage detection and emergency shutdown systems are essential for ensuring safe operation. At the receiving end, hydrogen is extracted from the pipeline and may undergo further compression or pressure regulation before being used or stored. The technology for transporting gaseous hydrogen through pipelines is well established, with existing infrastructure in certain regions [12].
In the existing research on optimizing the operation of IESs, the transportation of hydrogen is a key issue. However, most studies have not considered the transportation mode of hydrogen. Existing research mainly focuses on hydrogen production and storage to meet energy supply needs or improve economic benefits. Zhou J [13] proposed a mixed-integer nonlinear programming problem (NPP) that considers a linearized model of hydrogen production and storage modules, natural gas pipeline flow equations, and generator unit equations. An NPP algorithm was adopted to minimize the operation cost of the electrical energy system. Wang J [14] used a multivariate process, combined with the maximum rectangle and particle swarm optimization algorithm, to establish an energy device model considering hydrogen production and storage. Schrotenboer AH [15] applies Markov decision process theory to propose the optimal business strategy for a comprehensive energy system consisting of renewable energy production and hydrogen production and storage, with the goal of maximizing profits. Ruiming F [16] utilized an enhanced non-dominated sorting genetic algorithm to develop a comprehensive nonlinear mixed-integer dynamic scheduling optimization model for hydrogen-integrated energy systems, aiming to minimize both system operating costs and environmental expenses. Song Y [17] created a multi-objective hierarchical optimization model tailored for photovoltaic hydrogen-integrated grid-connected power generation systems, with the objective of reducing annual total costs and carbon dioxide emissions. Sohani A [18] introduced a multi-objective optimization approach for solar-geothermal cogeneration systems with dynamics and hydrogen storage, aiming to boost the annual production of electricity, thermal energy, hydrogen, and freshwater, enhance energy efficiency, and shorten investment payback periods. In summary, research on the optimization and operation of IESs incorporating hydrogen primarily emphasizes leveraging hydrogen production and storage to enhance system efficiency, balance stakeholder interests, and decrease operating costs. However, this study did not address the optimization of a comprehensive energy system for multi-mode hydrogen transportation.
Drawing from the aforementioned analysis, this article focuses on researching the optimal operation of comprehensive energy systems for multi-mode hydrogen transportation. It establishes a multi-mode hydrogen transportation model aimed at minimizing the overall operational costs of the system during its daily scheduling cycle. Additionally, it constructs a comprehensive energy system framework for multi-mode hydrogen transportation, incorporating long tube trailers and hydrogen pipelines. Building upon this framework, the article further develops an optimization model for the integrated energy system and determines the appropriate operational strategy for this system.
The rest of this paper is organized as follows. Section 2 defines the comprehensive energy system structure. Section 3 establishes the hydrogen multi-mode transportation model. Section 4 presents the optimization model. Section 5 draws conclusions.

2. A Comprehensive Energy System Structure Considering Multi-Mode Hydrogen Transportation

Based on the energy flow relationship of the system, this section analyzes and considers the comprehensive energy system structure of multi-mode hydrogen transportation from an overall perspective. An integrated energy system refers to the coordinated planning, optimal operation, collaborative management, interactive response, and complementary mutual assistance among multiple heterogeneous energy subsystems within a certain area. This paper focuses on the coupling relationship between hydrogen and electricity flows, so the integrated energy system mentioned in this paper includes electricity and hydrogen energy demand. As shown in Figure 1, the electricity produced by wind and solar renewable energy is produced through electrolysis tanks to produce hydrogen, which is then transported to the hydrogen load of the integrated energy system through hydrogen pipelines and hydrogen long pipe trailers. In the figure, the red arrow indicates the flow direction of electrical energy within the integrated energy system, while the blue arrow represents the flow direction of hydrogen energy. Renewable energy sources have successfully converted wind and solar resources into electricity. Electrolytic cells then consume this electricity to produce hydrogen, effectively converting electricity into hydrogen. The hydrogen is subsequently transported via hydrogen pipelines and hydrogen long tube trailers.

3. Hydrogen Multi-Mode Transportation Model

In the multimodal transportation of hydrogen, hydrogen pipelines and hydrogen long pipe trailers are the core facilities, and their operating models are crucial for the optimization of the system. In response to the neglect of modeling hydrogen transportation in existing research, this paper constructs hydrogen pipeline and hydrogen long pipe trailer models based on hydrogen pipelines and hydrogen long pipe trailers, providing model support for the IES.
Hydrogen pipeline trailers have gained widespread commercial adoption due to their advanced technology and robust safety features. These trailers, which comprise a truck cab and several tubular, pressure-resistant hydrogen storage containers, serve as a valuable secondary storage option for hydrogen refueling stations. Utilizing a trailer to transport hydrogen gas to a refueling station enhances loading and unloading efficiency by simply swapping out the depleted trailer, with the entire process typically taking less than an hour [19,20]. Consequently, at least two hydrogen long tube trailers are typically deployed for transportation between hydrogen production sites and refueling stations, with the exact number determined by factors such as hydrogen demand, trailer capacity, transportation duration, loading and unloading times, and truck availability. However, the construction and maintenance of pipeline infrastructure for gaseous hydrogen transportation can be capital-intensive [12,21]. Moreover, the energy consumption associated with pipeline transportation may diminish the overall efficiency of hydrogen as an energy carrier [7]. As hydrogen demand grows, the development and expansion of pipeline infrastructure will become crucial for widespread adoption. Additionally, the proliferation of renewable energy sources can further drive the demand for hydrogen transportation technology, facilitating energy storage and distribution.

3.1. A Hydrogen Transport Model for Long Tube Hydrogen Trailers

Hydrogen long tube trailers can only stay in one position at any time when transporting hydrogen energy, and hydrogen long tube trailers also need to consider the storage, charging, and discharging constraints of hydrogen. Based on this, the hydrogen transportation model of a hydrogen long tube trailer [7] is described as follows:
s Ψ ξ s . t . v = μ t . v
S s . t . v = S s . t 1 . v + S K s . t . v S D s . t . v
0 S s . t . v S s . max . v
ξ s . t . v S K s . min . v S K s . t . v ξ s . t . v S K s . max . v
ξ s . t . v S D s . min . v S D s . t . v ξ s . t . v S D s . max . v
In the formula, s represents the driving station; v represents a collection of sites; ψ represents the index of long tube trailers; μ t . v and ξ s . t . v are both binary variables that represent the utilization status of the long pipe trailer and whether the long pipe trailer is at the station, respectively; S K s . t . v and S D s . t . v are the hydrogen charging and discharging capacities for long tube trailers, respectively; S s . t . v and S s . max . v represent the amount and capacity of hydrogen stored in long tube trailers, respectively; S K s . max . v is the upper and S K s . min . v is the lower limit for hydrogen charging of long tube trailers; S D s . max . v is the upper and S D s . min . v is the lower limit for hydrogen release from long tube trailers.
Among them, Equation (1) indicates that if a long tube trailer is put into use, each trailer can correspond to a station at each time point; Equation (2) ensures balanced hydrogen storage in the trailer; Equation (3) limits the maximum storage capacity of long tube trailers; Equations (4) and (5) mean that long tube trailers can only load and unload hydrogen at parking stations.

3.2. A Hydrogen Transportation Model for Hydrogen Pipelines

The gas flow rate in pipelines can be expressed as a function of air pressure and pipeline characteristics (such as diameter, length, and friction coefficient), which is known as the general flow equation [22,23]. In some cases, it can be approximated using the Weymouth or Panhandle equations. It is obtained from the momentum equation that describes the sum of all forces acting on gas particles. The square of the average flow rate is written as q i j . t q i j . t to reflect that the model allows bidirectional flow. Therefore, the pipeline airflow model [23] is not only nonlinear but also non-convex:
q i j . t q i j . t = π 4 2 D i j 5 Δ x i j F i j R T Z ρ 0 2 p i . t 2 p j . t 2
In the formula, q i j . t is the average gas flow rate; ρ 0 is the gas density under standard conditions; R, Z, and T are specific gas constants, gas compression factors, and temperature; F i j is the friction coefficient of the pipeline; D i j and Δ x i j represent the diameter and length of the pipeline; p i . t and p j . t are node air pressures, constrained by
p i . min p i . t p i . max
In the formula, p i . max is the upper and p i . min is the lower limit of the node air pressure. Similarly, the constraint on pipeline airflow can be expressed as
q i j . min q i j . t q i j . max
In the formula, q i j . max is the upper and q i j . min is the lower limit of the pipeline gas flow rate.
The above nonlinear form is a univariate function with h ( x ) = x 2 , which can be approximated in segments. The incremental formula based on piecewise linearization exhibits the best performance in terms of computational speed, and this paper introduces it into the optimization of the hydrogen pipeline equation [24]. This method approximates equation h ( x ) as Equations (9)–(12). δ i is a continuous variable representing each segment, and ψ i is a binary variable that forces so-called fill conditions:
h x h X 1 + i P h X i + 1 h X i δ i
x = X 1 + i P X i + 1 X i δ i
δ i + 1 ψ i , i M 1 , ψ i δ i , i M 1
0 δ i 1 , i M
In the formula, M is the number of segmentation points, and X i is the i-th segmentation point.

4. Integrated Energy System Optimization Operation Framework

Based on the aforementioned hydrogen multimodal transportation model, this section considers the operational constraints of the system, with the daily operating cost of the integrated energy system as the goal, and constructs an optimized operation model considering hydrogen multimodal transportation.

4.1. Constraint Condition

When constructing the optimization operation model for the integrated energy system, it is crucial to account for various constraints, including power balance, equipment operation, and hydrogen transportation. While Section 3 has already discussed the hydrogen multi-mode transportation constraints, the following sections will delve into the specifics of cogeneration units, hydrogen storage tanks, hydrogen fuel cells, electrolysis tanks, electrochemical energy storage, and the power balance constraints.
(1) Operational constraints of cogeneration units
The cogeneration unit includes a gas turbine and waste heat recovery. Gas turbines generate heat during operation. A portion of the heat is directly supplied to the heat load through waste heat recovery, while a portion of the heat is used to generate waste heat through organic Rankine cycles, which can be described as
P t C H P = η e C H P G t C H P
H t C H P = η h C H P G t C H P
G min C H P G t C H P G max C H P
Δ G min C H P G t + 1 C H P G t C H P Δ G max C H P
In the formula, η e C H P and η h C H P are the heat and electricity generation efficiency of the equipment; P t C H P and H t C H P are the electric heating power; G t C H P is the natural gas consumption; G max C H P is the upper and G min C H P is the lower limit of natural gas consumption; Δ G max C H P and Δ G min C H P are ramp-up limits for natural gas consumption. Equations (13) and (14) represent the power and heat generation process of the cogeneration unit, respectively. Equation (15) represents that the cogeneration unit has a certain minimum output power and is limited by the installed capacity. Equation (16) represents the uphill/downhill climbing constraint.
(2) Operational limitations of hydrogen storage facilities
H S t + 1 = H S t + m ch . t m dis . t
H S min H S t H S max
H S t = 1 = α H S max
Δ H S min H S t H S t 1 Δ H S max
m HS . min m ch . t Z HS m HS . max
m HS . min m dis . t ( 1 Z HS ) m HS . max
In the formula, H S t represents the quantity of hydrogen contained within the hydrogen storage tank; m c h . t and m d i c . t represent the hydrogen charging and discharging capacities, respectively, of the hydrogen storage tank; H S min is the upper and H S max is the lower limit of hydrogen storage capacity; α and Z H S are the initial state coefficients and hydrogen charging and discharging states of the hydrogen storage tank; Δ H S max and Δ H S min are the climbing restrictions for hydrogen storage; m H S . min is the upper and m H S . max is the lower limit for hydrogen storage tank charging and discharging. Equation (17) represents the power balance process of the hydrogen storage tank. Equations (18)–(22) specify the capacity limits and operational constraints, such as uphill and downhill charging/discharging rates, associated with the hydrogen storage tank.
(3) Operational constraints [24] of hydrogen fuel cells
P t F C = η e F C m t F C
P min F C P t F C P max F C
Δ P min F C P t F C P t 1 F C Δ P max F C
In the formula, m t F C , η t F C , and P t F C respectively represent the amount of hydrogen consumed, energy conversion coefficient, and electricity generated by the hydrogen fuel cell; P min F C is the upper and P max F C is the lower limit of hydrogen consumption; Δ P max F C and Δ P min F C are the climbing limits for fuel cells. Equation (23) represents the power production process of hydrogen fuel cells. Equations (24) and (25) represent the capacity limitations and uphill/downhill constraints of hydrogen fuel cells.
(4) Operation constraints of electrolytic cells
P t P E M = η e P E M m t P E M
P min P E M P t P E M P max P E M
Δ P min P E M P t P E M P t 1 P E M Δ P max P E M
In the formula, m t P E M , η t P E M , and P t P E M respectively represent the quality of hydrogen produced by the electrolytic cell, energy conversion coefficient, and consumed electrical energy; P min P E M is the upper and p min P E M is the lower limit of power consumption; Δ P max P E M and Δ P min P E M are the ramp-up limits for the electrolytic cell. Equation (26) represents the hydrogen production process of the electrolytic cell. Equations (27) and (28) represent the capacity limit and uphill/downhill slope constraint of the electrolytic cell.
(5) Operational constraints [24] of electrochemical energy storage
S O C t + 1 = S O C t + ( P ch . t P dis . t )
S O C min S O C s , t S O C max
S O C t = 1 = β S O C max
P bat . min P ch . t Z bat P bat . max
P bat . min P dis . t ( 1 Z bat ) P bat . max
In the formula, S O C t , P c h . t , and P d i s . t are the electrical energy, charge, and discharge power; S O C min is the upper and S O C max is the lower limit of the energy storage capacity; P b a t . min is the upper and P b a t . max is the lower limit of the discharge or charge power; β and Z b a t are the initial state coefficients and charge–discharge states. Equation (29) represents the storage process of electrochemical energy storage. Equations (30) and (31) represent the state-of-charge constraint for electrochemical energy storage. Equations (32) and (33) represent the charging or discharging power constraints for electrochemical energy storage.
(6) Power balance constraints [23] of IES
P R D G . t + P dis . t = P cur . t + P t PEM   + P grid . t + P ch . t
P cur . t 0
H t C H P = H t l o a d
G t C H P = G t G a s
m t l o a d + m t F C + m c h . t + v Υ S D s . t . v = m t P E M + v Υ S K s . t . v + i j p i p e q i j . t ρ 0 + m d i s . t
In the formula, P R D G . t and P c u r . t are the renewable power generation and reduction; P g r i d . t is the power exchanged by the superior power grid; H t l o a d , G t G a c , and m t l o a d represent the demand for heat load, gas purchase at the gas source point, and hydrogen load demand; Υ and pipe represent the number of hydrogen long tube trailers and hydrogen pipelines. Equation (34) represents the storage processes of electrochemical energy storage. Equations (35) and (36) represent constraints on renewable energy reduction and thermal power balance. Equations (37) and (38) represent natural gas balance and hydrogen balance constraints.

4.2. Objective Function

The objective of the operation model for the hydrogen multi-mode transportation comprehensive energy system is to reduce the system’s daily operating cost to a minimum, as illustrated below:
min t = 1 T c c u r t P c u r t . t + t = 1 T c e P g r i d . t + t = 1 T c g a s G t G a s + t = 1 T c H T T m t H T T + t = 1 T c p i p e m t p i p e
Among them, c c u r t , c e , and c g a s respectively represent the penalty price for abandoning solar and wind power, the purchase price for electricity, and the purchase price for gas; c H T T and c p i p e represent the unit operating costs of hydrogen long tube trailers and hydrogen pipelines, respectively.
The aforementioned model is a mixed-integer linear programming model capable of being solved directly with the commercial solver Cplex 12.6.

5. Case Study

5.1. Parameter Settings

This paper develops four optimization operation strategies for the integrated energy system depicted in Figure 1, in order to validate the efficacy of the proposed optimization strategy when considering hydrogen multi-mode transportation within the integrated energy system. Based on the literature [25,26,27], this paper selects representative data to demonstrate and validate the characteristics of each approach. Table 1 shows the equipment configuration of the integrated energy system, and Table 2 shows the output of new energy and load. The optimization cycle is T = 24 h. The time interval is 1 h. According to schemes 1–4, the operational strategies of the integrated energy system were optimized, and Table 3 compares the economic results of the schemes. Figure 2 and Figure 3 compare the hydrogen production power and hydrogen transport capacity of different electrolysis cell schemes. Figure 4 conducts a sensitivity analysis on the impact of hydrogen long tube trailers and hydrogen pipelines on system operating costs.
Option 1: Optimize the operation strategy of the IES based on an operation model that does not consider hydrogen transportation [25].
Option 2: Optimize the operation strategy of the IES based on the hydrogen transportation mode that only considers the transportation of hydrogen long tube trailers [26].
Option 3: Optimize the operation strategy of the IES based on the hydrogen transportation mode that only considers hydrogen pipeline transportation [27].
Option 4: The method proposed in this article is based on optimizing the operation strategy of the IES by considering the hydrogen long tube trailer and hydrogen pipeline model.

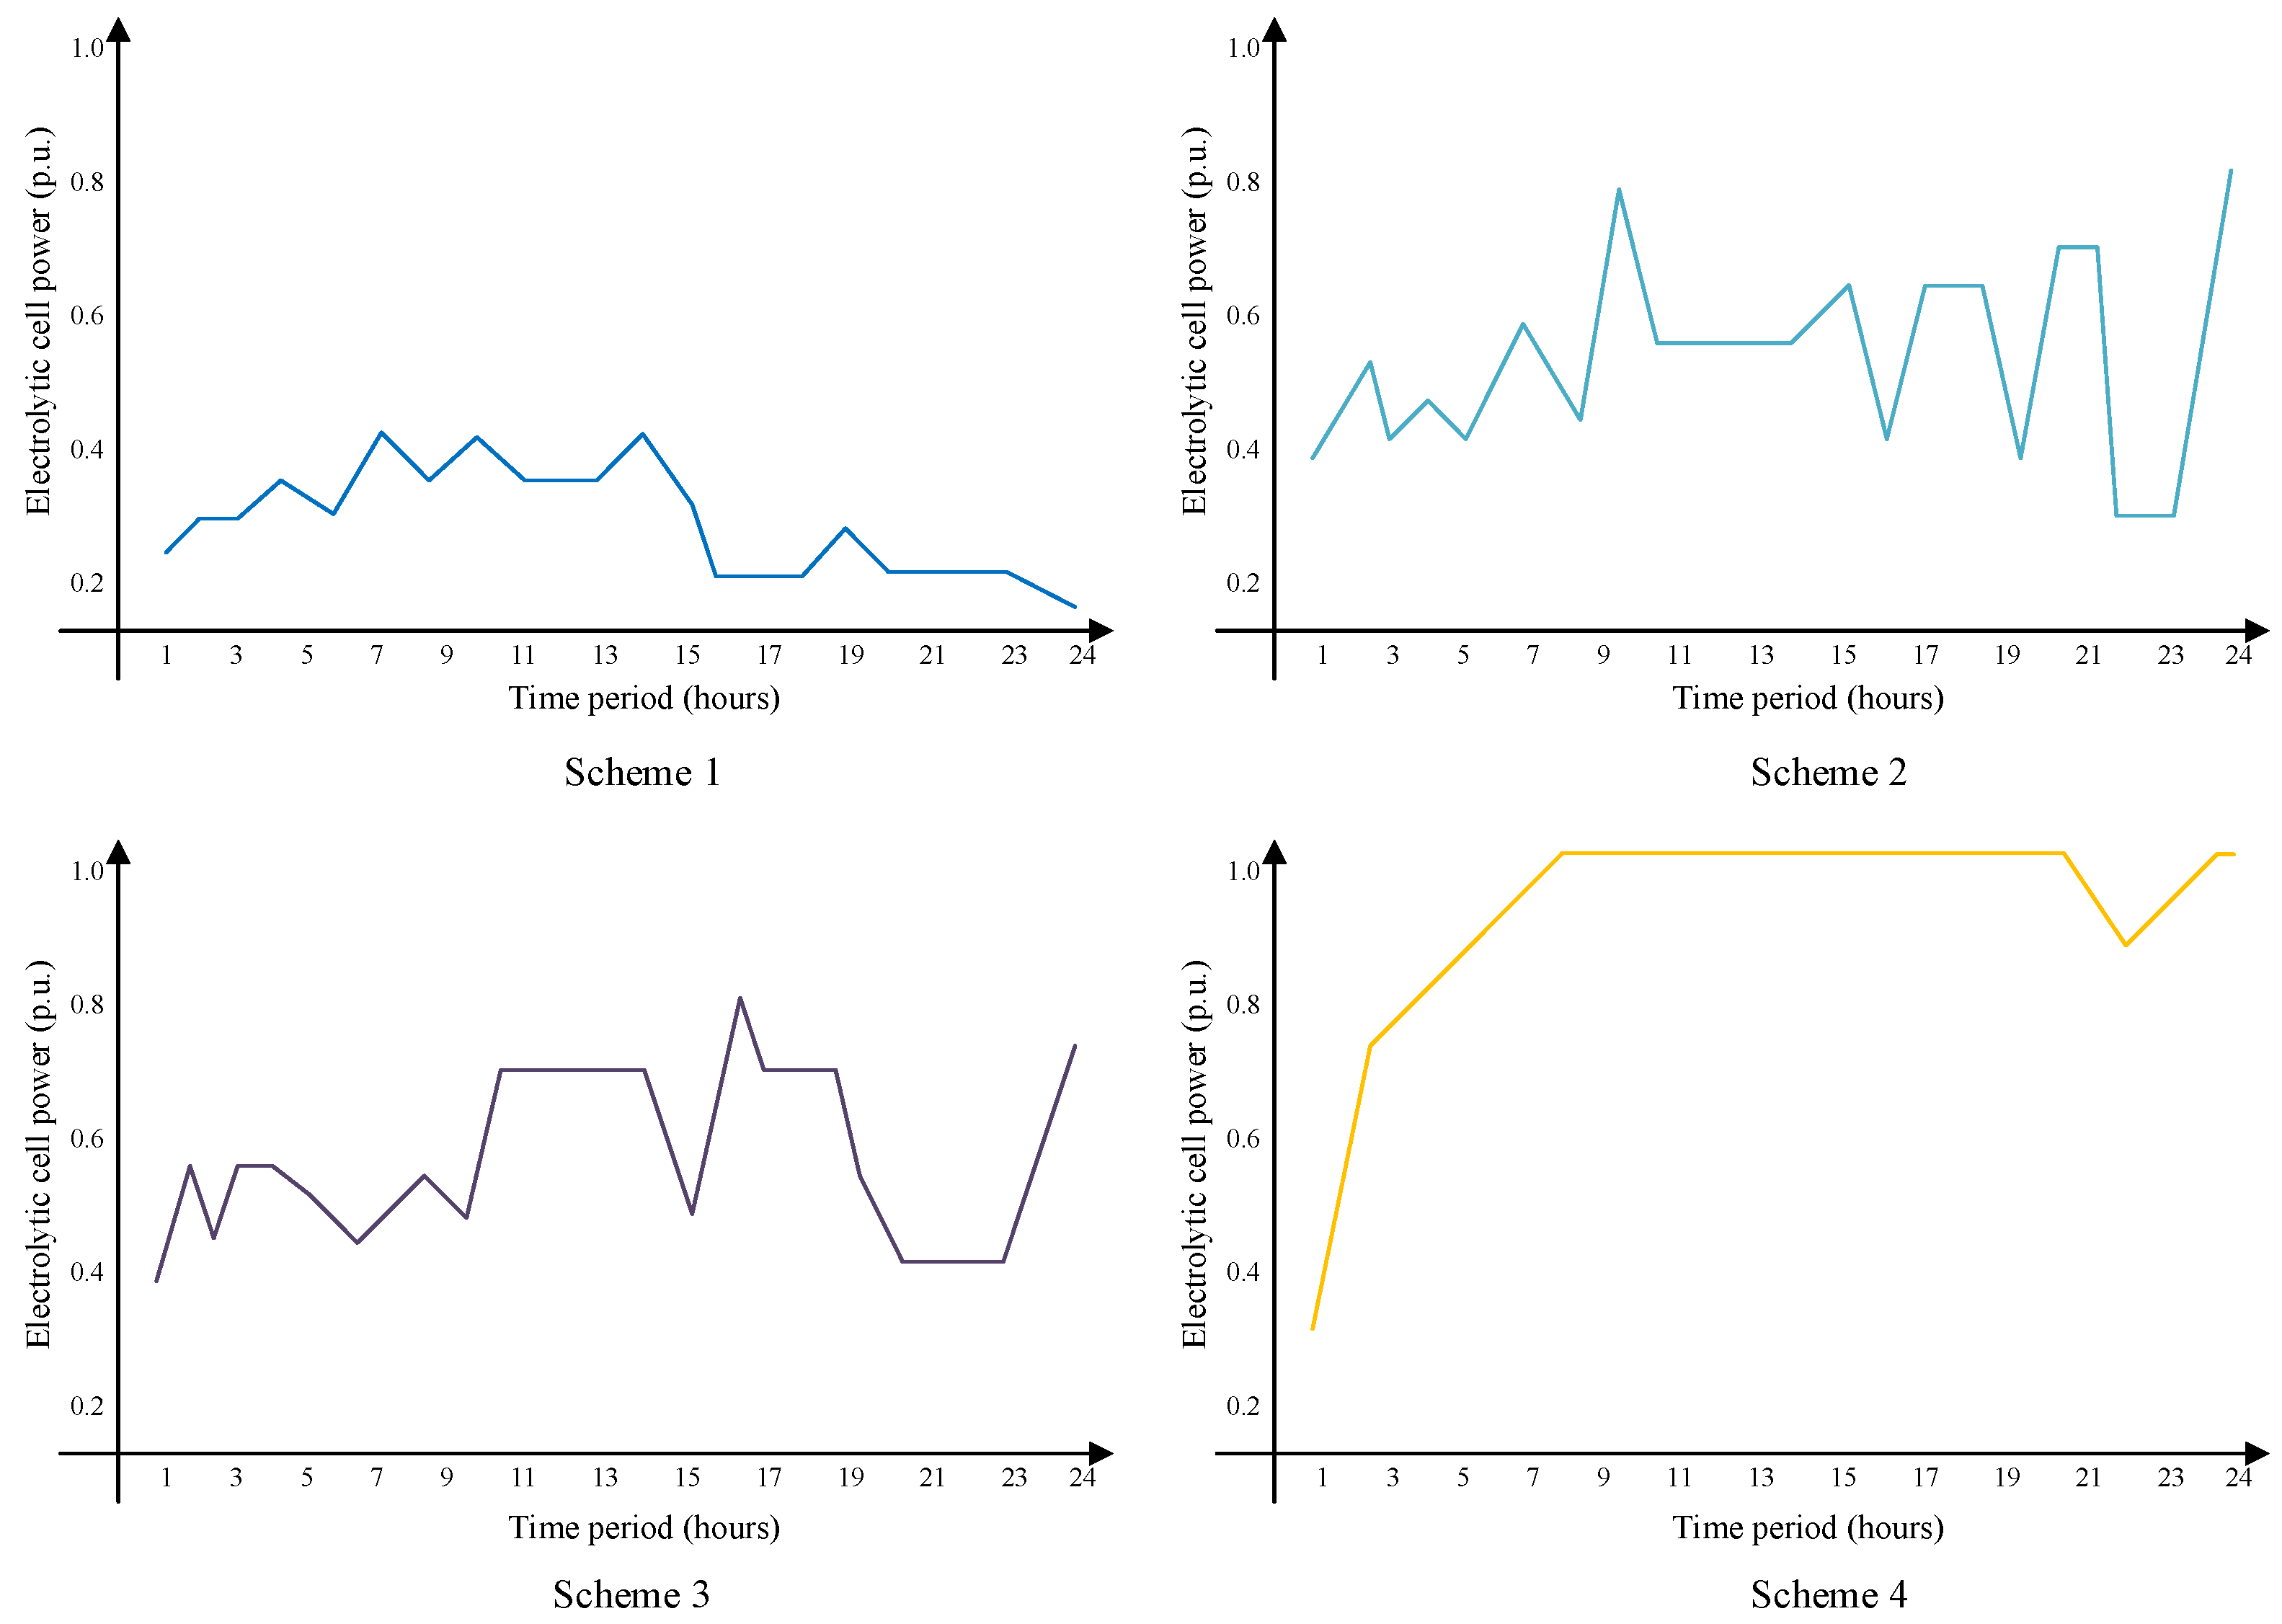
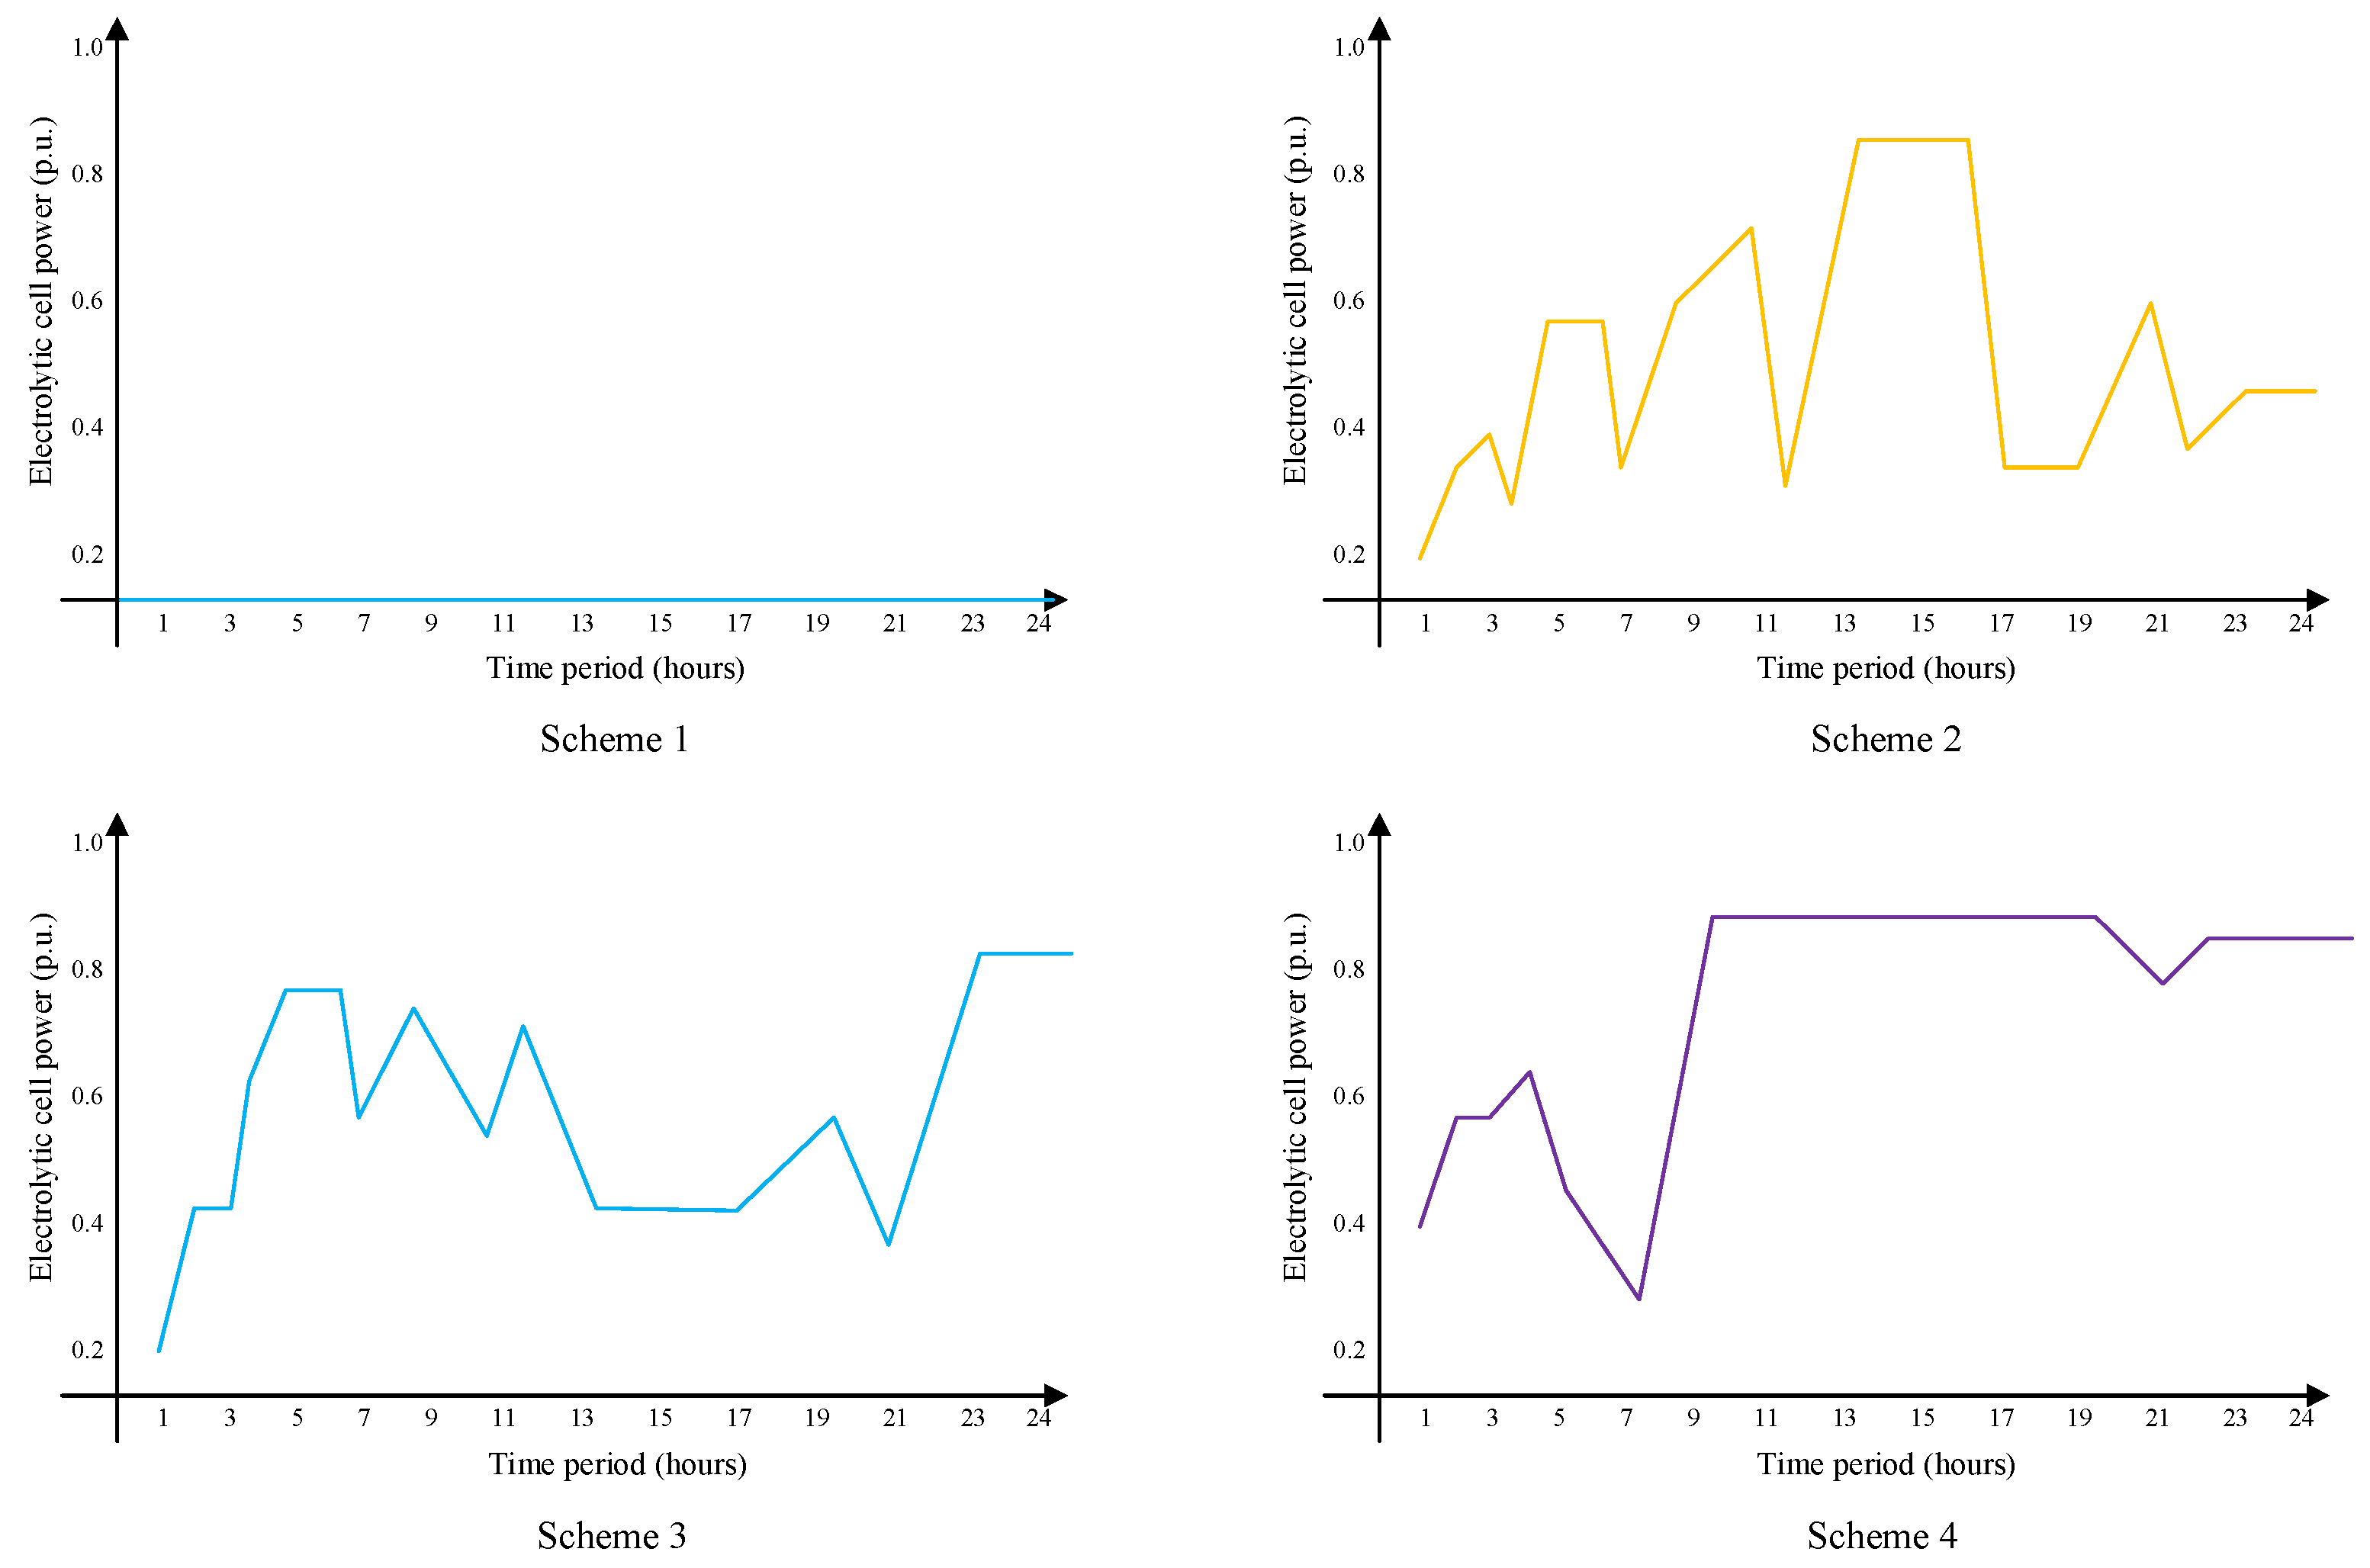
5.2. Comparative Analysis of Plans

(1) Economic analysis
Table 3 shows the operational economic results of schemes 1–4. From the table, it can be concluded that scheme 1 has the highest cost of wind and solar power abandonment, electricity purchase, and gas purchase, which leads to the worst operating economy of scheme 1. This indicates that ignoring hydrogen transportation will lead to large-scale solar and wind power abandonment in the system, limiting the consumption of new energy and affecting the system’s energy supply. In scheme 2 and scheme 3, the total operating costs are similar, with a reduction of 16.02% and 12.90%, respectively, compared to scheme 1. From this, it can be concluded that considering the hydrogen energy transportation mode of hydrogen long tube trailers and hydrogen pipelines is beneficial for improving the economic efficiency of system operation. Plan 4 has the lowest total operating cost. Compared to Plans 1–3, Plan 4 significantly reduces the cost of abandoning wind and solar power, purchasing electricity, and purchasing gas. Although hydrogen transportation costs have increased, the overall operating cost has significantly decreased. Specifically, scheme 4 reduces total operating costs by 2.53, 2.12, and 2.20 times compared to schemes 1–3, respectively. This indicates that considering the multimodal transport of hydrogen energy is beneficial for significantly reducing the total operating cost of the system.
(2) Analysis of system operation status
Figure 2 compares the hydrogen production power of electrolytic cells under different schemes. Table 4 displays the indicators related to wind and solar energy consumption. According to Table 4, scheme 4 has the lowest amount of abandoned electricity, achieving full consumption of new energy. This is because in Figure 2, the electrolytic cell of scheme 4 can quickly produce hydrogen, while scheme 1, due to ignoring the hydrogen energy transport mode, cannot effectively transport the hydrogen generated by the electrolytic cell, limiting the hydrogen production amount and leading to large-scale wind and solar abandonment. Plans 2 and 3 only consider partial hydrogen delivery modes, and some of the hydrogen produced by the electrolysis tank can be effectively delivered but still limit the production of hydrogen. Option 4 considers multi-mode hydrogen transportation, which can effectively transport the hydrogen produced by the electrolytic cell through hydrogen pipelines and hydrogen long tube trailers. Therefore, the electrolytic cell can effectively produce hydrogen under capacity limitations. Therefore, based on Table 4 and Figure 2, it can be concluded that considering multi-mode hydrogen transportation can significantly raise the efficiency of hydrogen production in electrolysis cells, thereby achieving the consumption of alternative energy and reducing the cost of wind and solar energy waste. Due to the fact that the transported hydrogen can be further utilized and converted into electrical energy by hydrogen fuel cells, the cost of purchasing electricity for the system and the cost of purchasing gas for co-generation units can be further reduced. It can be seen that multi-mode hydrogen transportation is of great significance in reducing the operating costs of IESs.
Figure 3 depicts the variation curves of hydrogen transportation volume across various schemes, as illustrated in the figure, scheme 1 did not consider the hydrogen transportation mode, resulting in zero hydrogen transportation volume; schemes 2 and 3 respectively consider the hydrogen transportation of long tube trailers and hydrogen pipelines, with similar hydrogen transportation volumes, both of which improve the hydrogen transportation volume compared to scheme 1. Plan 4 comprehensively considers the transportation modes of hydrogen long tube trailers and hydrogen pipelines, significantly increasing the hydrogen energy transportation capacity. This indicates that considering the multimodal transportation of hydrogen is beneficial for improving the transmission of hydrogen in IESs, thereby enhancing hydrogen consumption and meeting load demands.

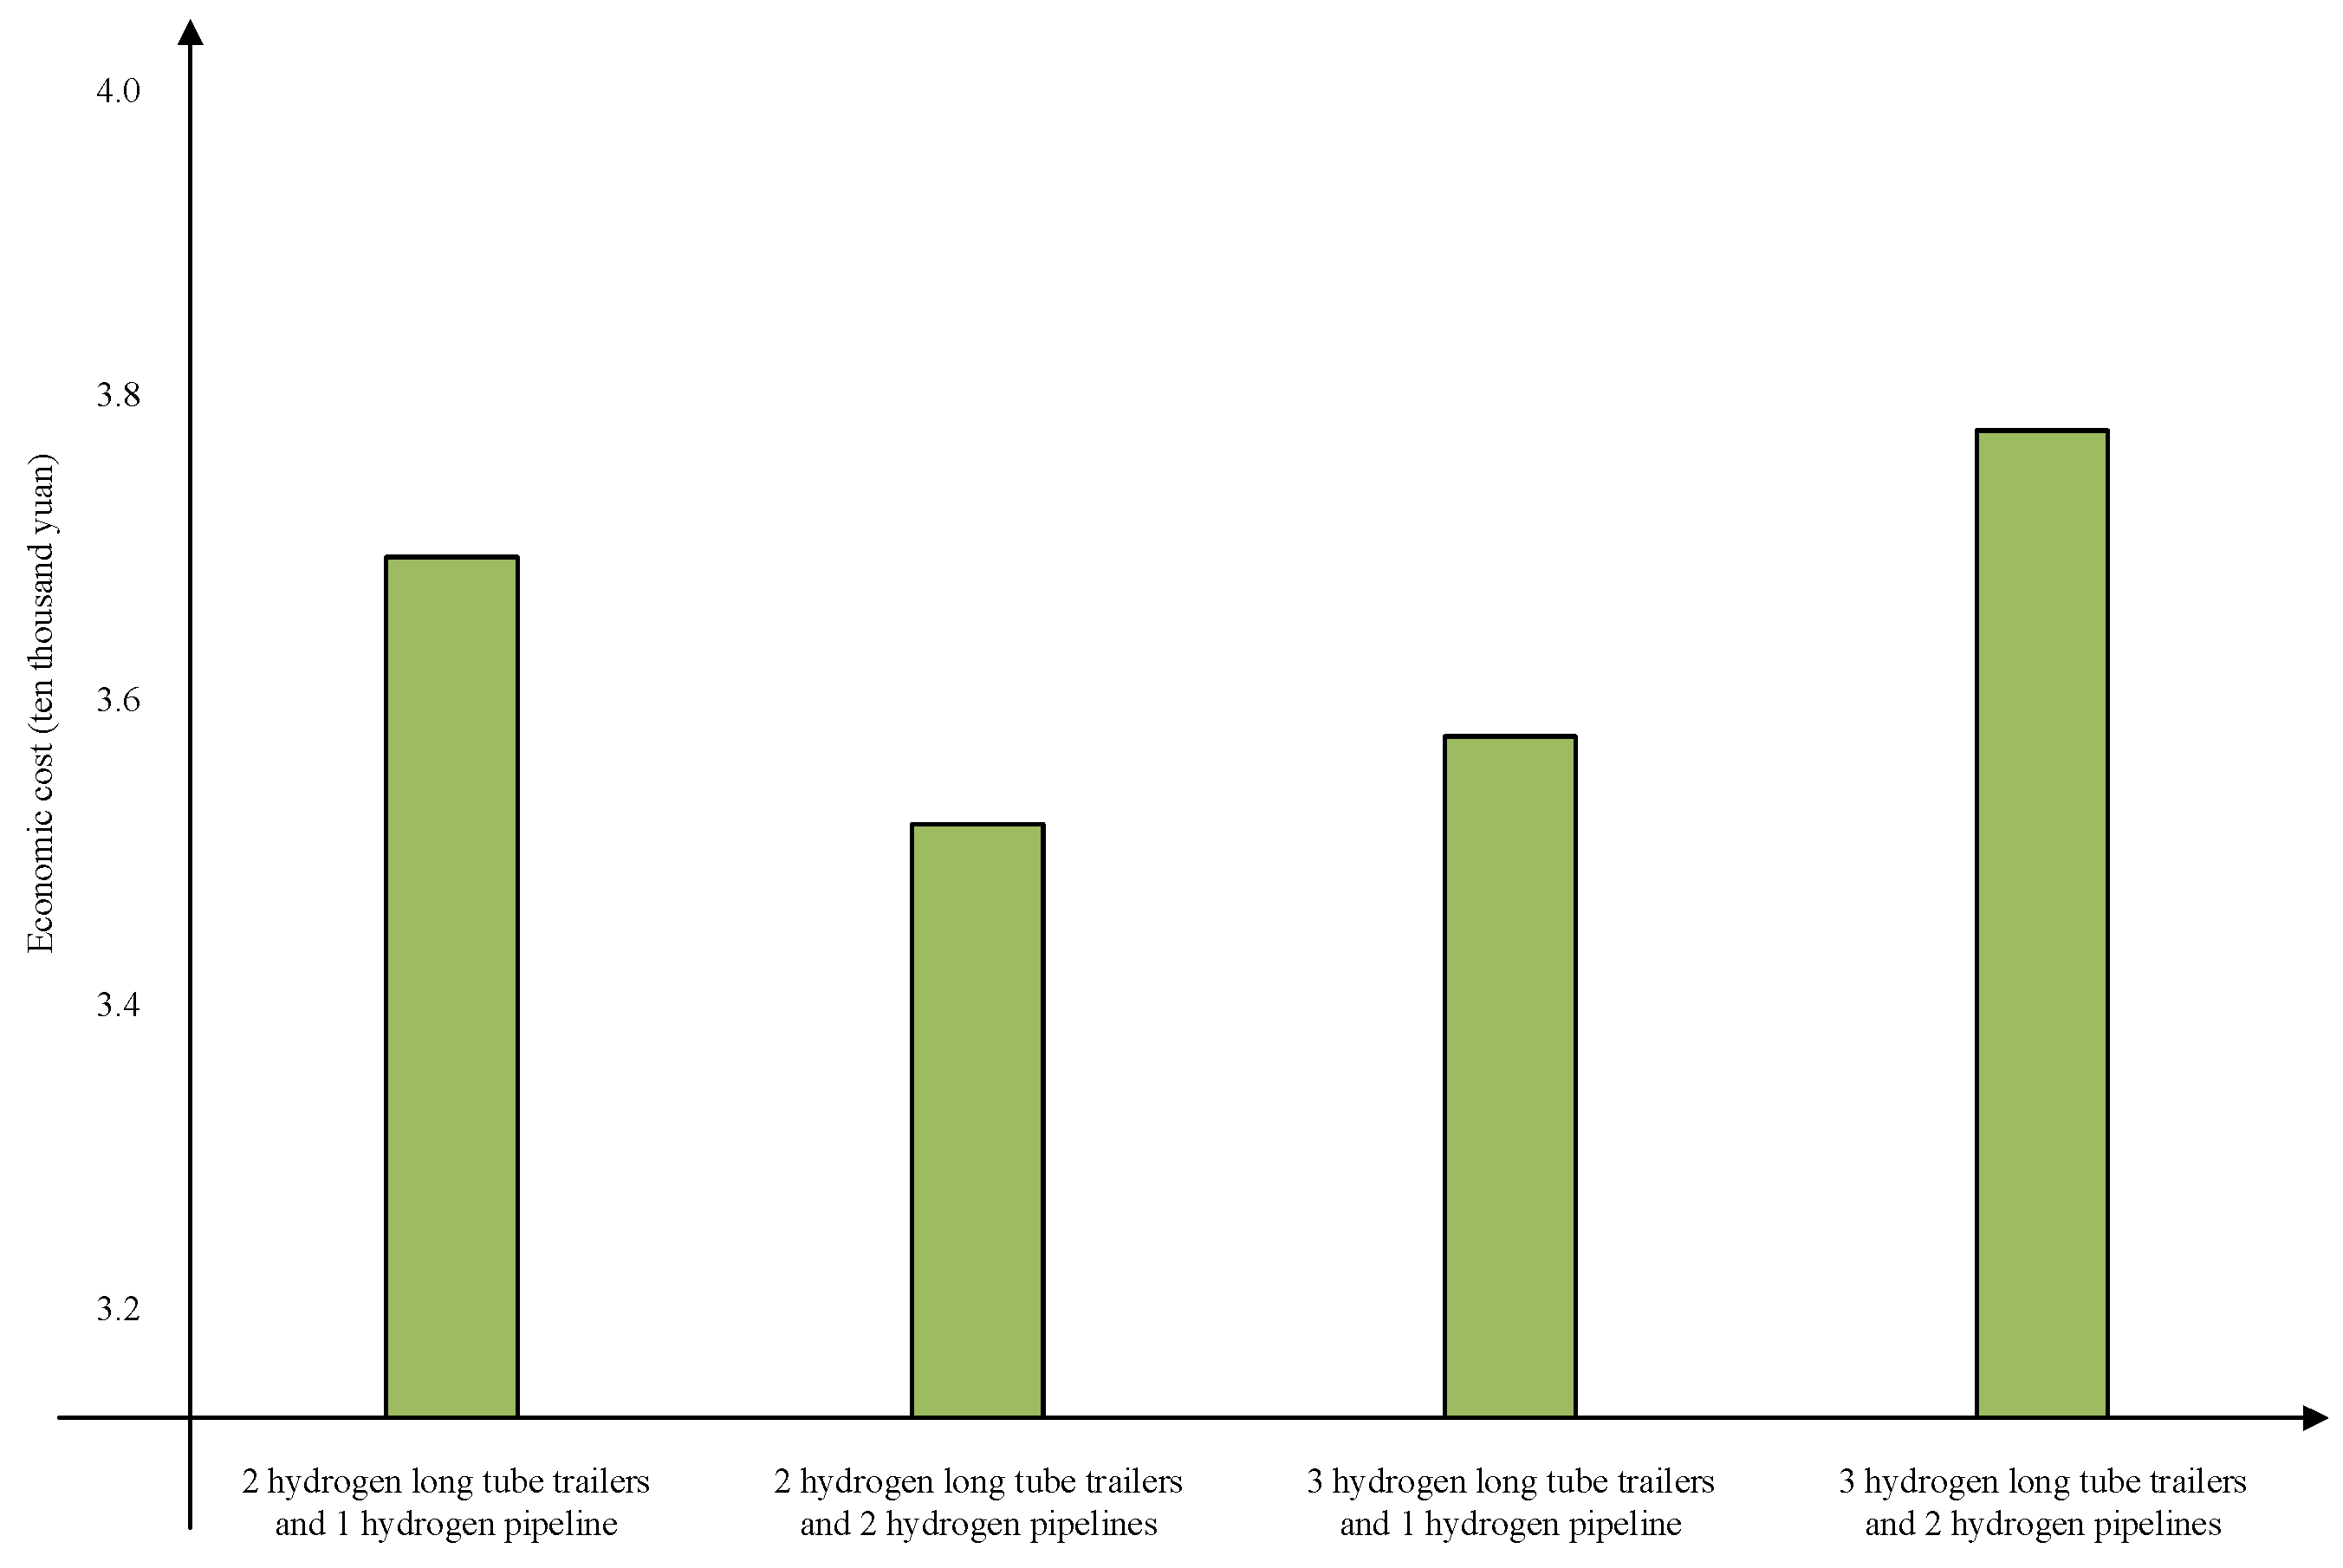
5.3. Analysis of the Impact of Hydrogen Long Tube Trailers and the Number of Hydrogen Pipelines on System Operating Costs

Figure 4 compares the operating costs of systems with different numbers of hydrogen pipelines and hydrogen long tube trailers. As illustrated in the figure, the total cost gradually decreases with the increase in the number of hydrogen pipelines and then increases. Similarly, the total cost gradually decreases and then increases with the increase in the number of hydrogen long tube trailers. This is because the increase in the number of hydrogen pipelines and long tube trailers provides more hydrogen energy transmission channels for hydrogen transportation, promotes the consumption of solar and wind energy, and reduces costs such as penalties for solar and wind power abandonment, electricity purchase, and energy purchase. However, the increase in hydrogen transportation channels has also led to a continuous increase in the cost of hydrogen transportation in the system. Due to the constant generation of new energy in the system and the peak production of hydrogen, there are boundaries in hydrogen energy transportation. Adding too many hydrogen pipelines and long trailers can cause redundancy in hydrogen energy channels, which will increase operating costs and affect the system economy.

6. Conclusions

This article considers the hydrogen transportation modes of long tube trailers and hydrogen pipelines and constructs a comprehensive strategy for energy system operation that considers multi-mode hydrogen transportation. Based on hydrogen long tube trailers and hydrogen pipelines, the hydrogen transmission channel significantly decreases the overall system operating cost. The simulation results from the case study validated the effectiveness of the proposed model, highlighting the significant role of multi-mode hydrogen transportation in lowering system operating costs and enhancing clean energy consumption. A comparison of system operations under different hydrogen transportation modes was also conducted. It was found that a reasonable arrangement of hydrogen transportation channels can further promote green and economic system operation. However, this study did not yet account for the impact of hydrogen pipeline failures on costs and benefits, nor did it consider the coordination with other clean energy technologies. In future research, we will conduct a more thorough analysis focusing on these aspects.

Author Contributions

Conceptualization, Q.L., Z.Z., D.Z., J.C. and H.Z.; software, Q.L., Z.Z., D.Z., J.C. and H.Z.; writing—original draft preparation, Q.L., Z.Z., D.Z., J.C. and H.Z. All authors have read and agreed to the published version of the manuscript.

Funding

This research received no funding.

Data Availability Statement

The data presented in this study are available on request from the corresponding author due to laboratory rules.

Conflicts of Interest

Author Dan Zheng was employed by the State Grid Hubei Electric Power Co., Ltd. The remaining authors declare that the research was conducted in the absence of any commercial or financial relationships that could be construed as a potential conflict of interest.

References

  1. McKinsey. Net-Zero Germany: Opportunities and Challenges on the Pathway to Climate Neutrality by 2045; McKinsey: New York, NY, USA, 2021. [Google Scholar]
  2. U.S. Energy Information Administration. Annual Energy Outlook 2022 AEO2022 Highlights; U.S. Energy Information Administration: Washington, DC, USA, 2022.
  3. United States Department of State. The Long-Term Strategy of the United States: Pathways to Net-Zero Greenhouse Gas Emissions by 2050; United States Department of State: Washington, DC, USA, 2021.
  4. Züttel, A.; Remhof, A.; Borgschulte, A.; Friedrichs, O. Hydrogen: The future energy carrier. Phil. Trans. Math. Phys. Eng. Sci. 2010, 368, 3329–3342. [Google Scholar] [CrossRef] [PubMed]
  5. Cui, J.; Aziz, M. Techno-economic analysis of hydrogen transportation infrastructure using ammonia and methanol. Int. J. Hydrogen Energy 2023, 48, 15737–15747. [Google Scholar] [CrossRef]
  6. Faye, O.; Szpunar, J.; Eduok, U. A critical review on the current technologies for the generation, storage, and transportation of hydrogen. Int. J. Hydrogen Energy 2022, 47, 13771–13802. [Google Scholar] [CrossRef]
  7. Noh, H.; Kang, K.; Seo, Y. Environmental and energy efficiency assessments of offshore hydrogen supply chains utilizing compressed gaseous hydrogen, liquefied hydrogen, liquid organic hydrogen carriers and ammonia. Int. J. Hydrogen Energy 2023, 48, 7515–7532. [Google Scholar] [CrossRef]
  8. Sdanghi, G.; Maranzana, G.; Celzard, A.; Fierro, V. Review of the current technologies and performances of hydrogen compression for stationary and automotive applications. Renew. Sustain. Energy Rev. 2019, 102, 150–170. [Google Scholar] [CrossRef]
  9. Hassan, I.A.; Ramadan, H.S.; Saleh, M.A.; Hissel, D. Hydrogen storage technologies for stationary and mobile applications: Review, analysis and perspectives. Renew. Sustain. Energy Rev. 2021, 149, 111311. [Google Scholar] [CrossRef]
  10. Di Lullo, G.; Giwa, T.; Okunlola, A.; Davis, M.; Mehedi, T.; Oni, A.O.; Kumar, A. Large-scale long-distance land-based hydrogen transportation systems: A comparative techno-economic and greenhouse gas emission assessment. Int. J. Hydrogen Energy 2022, 47, 35293–35319. [Google Scholar] [CrossRef]
  11. Wang, H.; Tong, Z.; Zhou, G.; Zhang, C.; Zhou, H.; Wang, Y.; Zheng, W. Research and demonstration on hydrogen compatibility of pipelines: A review of current status and challenges. Int. J. Hydrogen Energy 2022, 47, 28585–28604. [Google Scholar] [CrossRef]
  12. Gordon, J.A.; Balta-Ozkan, N.; Nabavi, S.A. Socio-technical barriers to domestic hydrogen futures: Repurposing pipelines, policies, and public perceptions. Appl. Energy 2023, 336, 120850. [Google Scholar] [CrossRef]
  13. Zhou, J.; Li, S.; Zhou, X.; Li, C.; Xiong, Z.; Zhao, Y.; Liang, G. Operation optimization for gas-electric integrated energy system with hydrogen storage module. Int. J. Hydrogen Energy 2022, 47, 36622–36639. [Google Scholar] [CrossRef]
  14. Wang, J.; Xue, K.; Guo, Y.; Ma, J.; Zhou, X.; Liu, M.; Yan, J. Multiobjective capacity programming and operation optimization of an integrated energy system considering hydrogen energy storage for collective energy communities. Energy Convers. Manag. 2022, 268, 116057. [Google Scholar] [CrossRef]
  15. Schrotenboer, A.H.; Veenstra, A.A.T.; uit het Broek, M.A.J.; Ursavas, E. A Green Hydrogen Energy System: Optimal control strategies for integrated hydrogen storage and power generation with wind energy. Renew. Sustain. Energy Rev. 2022, 168, 112744. [Google Scholar] [CrossRef]
  16. Ruiming, F. Multi-objective optimized operation of integrated energy system with hydrogen storage. Int. J. Hydrogen Energy 2019, 44, 29409e17. [Google Scholar] [CrossRef]
  17. Song, Y.; Mu, H.; Li, N.; Wang, H. Multi-objective optimization of large-scale grid-connected photovoltaic-hydrogen-natural gas integrated energy power station based on carbon emission priority. Int. J. Hydrogen Energy 2023, 48, 4087–4103. [Google Scholar] [CrossRef]
  18. Sohani, A.; Delfani, F.; Hosseini, M.; Sayyaadi, H.; Karimi, N.; Li, L.K.B.; Doranehgard, M.H. Dynamic multi-objective optimization applied to a solar-geothermal multi-generation system for hydrogen production, desalination, and energy storage. Int. J. Hydrogen Energy 2022, 47, 31730e41. [Google Scholar] [CrossRef]
  19. Dehdari, L.; Burgers, I.; Xiao, P.; Li, K.G.; Singh, R.; Webley, P.A. Purification of hydrogen from natural gas/hydrogen pipeline mixtures. Sep. Purif. Technol. 2022, 282, 120094. [Google Scholar] [CrossRef]
  20. Hansen, O.R. Hydrogen infrastructure—Efficient risk assessment and design optimization approach to ensure safe and practical solutions. Process Saf. Environ. Prot. 2020, 143, 164–176. [Google Scholar] [CrossRef]
  21. Luo, H.; Sohn, S.S.; Lu, W.; Li, L.; Li, X.; Soundararajan, C.K.; Krieger, W.; Li, Z.; Raabe, D. A strong and ductile medium-entropy alloy resists hydrogen embrittlement and corrosion. Nat. Commun. 2020, 11, 3081. [Google Scholar] [CrossRef]
  22. Correa-Posada, C.M.; Sánchez-Martín, P. Integrated Power and Natural Gas Model for Energy Adequacy in Short-Term Operation. IEEE Trans. Power Syst. 2015, 30, 3347–3355. [Google Scholar] [CrossRef]
  23. Menon, E.S. Gas Pipeline Hydraulics; Taylor & Francis: Boca Raton, FL, USA, 2005. [Google Scholar]
  24. Correa-Posada, C.M.; Sanchez-Martin, P. Gas Network Optimization: A Comparison of Piecewise Linear Models. Unpubl. Prepr. 2014, pp. 1–24. Available online: http://www.optimization-online.org/DB_FILE/2014/10/4580.pdf (accessed on 27 October 2024).
  25. Zhang, C.; Kuang, Y. Low-Carbon Economy Optimization of Integrated Energy System Considering Electric Vehicles Charging Mode and Multi-Energy Coupling. IEEE Trans. Power Syst. 2023, 39, 3649–3660. [Google Scholar] [CrossRef]
  26. Tao, Y.; Qiu, J.; Lai, S.; Sun, X. Coordinated Planning of Electricity and Hydrogen Networks with Hydrogen Supply Chain for Fuel Cell Electric Vehicles. IEEE Trans. Sustain. Energy 2023, 14, 1010–1023. [Google Scholar] [CrossRef]
  27. Fang, S.; Zhang, S.; Zhao, T.; Liao, R. Optimal Power-Hydrogen Networked Flow Scheduling for Residential Carpark With Convex Approximation. IEEE Trans. Ind. Appl. 2022, 58, 2751–2759. [Google Scholar] [CrossRef]
Figure 1. System structure diagram of integrated energy system considering multi-mode transportation of hydrogen.
Processes 12 02893 g001
Figure 2. Comparison of hydrogen production power for various schemes.
Processes 12 02893 g002
Figure 3. Comparison of hydrogen transmission under various cases.
Processes 12 02893 g003
Figure 4. Comparison of system operation costs under various hydrogen energy pathways.
Processes 12 02893 g004
Table 1. Rated capacity of integrated energy system equipment.
EquipmentRated Capacity
Hydrogen storage tank3000 kg
Electrolytic tank20 MW
Cogeneration unit100 km3
Hydrogen fuel cell10 MW
Wind turbines50 MW
Photovoltaic unit40 MW
Electrochemical energy storage10 MWh
Hydrogen pipeline10 km3/h
Hydrogen long tube trailer200 kg
Table 2. Renewable energy output and load demand.
TimeWind PowerPhotovoltaicElectric LoadHydrogen LoadHeat Load
10.9500.2100.1795
20.700.0500.141
3100.100.1621
40.5500.1400.2083
50.7800.2300.2723
60.700.380.14640.4733
70.430.180.490.53230.5299
80.10.260.7310.628
90.450.290.90.570.5821
100.230.470.950.23380.4742
110.830.590.770.15090.3865
120.980.820.510.10210.6943
1310.970.630.23380.6615
140.9510.770.09120.3856
150.20.940.870.52430.222
160.350.880.950.570.2256
170.20.8210.83670.3466
180.50.590.790.8250.8025
190.220.290.730.25580.8745
200.060.060.540.22721
210.500.460.1360.9776
220.7500.380.10390.8377
230.200.2800.7038
240.7500.2100.2468
Table 3. Comparisons of operation benefits of various cases (USD).
SchemeTotal CostAbandoned Scenery CostsElectricity Purchase CostsGas Purchase CostsHydrogen Transportation Costs
112,834.004250.403891.605106.000
21077.802925.603891.602939.40897.00
311,178.002898.003477.603726.001076.40
45078.4001449.001518.002111.40
Table 4. Comparisons of photovoltaic–wind-power accommodation indexes among various scenarios.
SchemePower Generation/MWAbandoned Power/MWAbandonment Rate
1995.4888.84%
2995.460.576.09%
3995.4606.03%
4995.400%
Disclaimer/Publisher’s Note: The statements, opinions and data contained in all publications are solely those of the individual author(s) and contributor(s) and not of MDPI and/or the editor(s). MDPI and/or the editor(s) disclaim responsibility for any injury to people or property resulting from any ideas, methods, instructions or products referred to in the content.

