Abstract
In multi-coal seam mining, when the lower coal seam mining face passes over the goaf, residual coal pillars, and other geological anomaly areas of the overlying coal seam, abnormal mine pressure appears, and the hydraulic support monitoring system is inaccurate in identifying the pressure, which brings great hidden dangers to the safe production of the mining face. It is very necessary to carry out the prediction and early warning of the mine pressure of this kind of mining face. In order to improve the reliability of the prediction model, this paper takes the 31317 mining faces of the Chahasu coal mine as the engineering background, studies the mechanism of the disaster caused by the abnormal mine pressure of the residual coal pillar, uses the clustering analysis algorithm to divide the abnormal mine pressure area of the mining face, reconstructs the abnormal mine pressure type and number based on the prediction results of CEEMDAN–Transformer deep learning, and proposes the disaster criterion of the abnormal mine pressure. The research results show that, when the 31317 mining face enters the goaf of the overlying 31203 and 31201 coal seams, the residual coal pillars are accompanied by the instability of the interlayer rotation, and the dynamic and static loads are superimposed to form the additional stress of the residual coal pillars and transfer downward, causing the abnormal mine pressure of the mining face to appear; based on the hydraulic support resistance data of the mining face within the range of 3921.4–5050.4 m advance, the clustering analysis results show that there are six abnormal mine pressures during this period, and the types are cutting eye, residual coal pillar, square breaking, previous working face goaf square breaking, double square breaking, and geological damage zone. The clustering analysis is used to reconstruct the abnormal mine pressure area based on the prediction results of the mine pressure time series (MPTS) after interpolation completion, decomposition, and noise reduction preprocessing, and the MAE values are all lower than 2000 kN, predicting that there will be one abnormal pressure between the 80#–129# hydraulic supports in the process of advancing to 5050.4–5219.5 m, corresponding to the 18th square breaking area of the working face. Through the verification in the actual production, the prediction result is accurate; when the predicted value of the hydraulic support working resistance is greater than 19,000 KN, measures should be taken to speed up the advancing speed of the mining face, quickly pass through the abnormal mine pressure area, and prevent the disaster caused by the abnormal mine pressure. The prediction clustering analysis reconstruction abnormal pressure analysis method based on mining working face mine pressure data proposed in this paper provides a new direction and guidance for the abnormal mine pressure prediction analysis of mining working face and has good foresight, good intelligent prediction, and a good analysis method for the intelligent empowerment of mine safety production.
1. Introduction
In the process of multi-coal seam mining, after the upper coal seam is mined, a large amount of coal pillars are often left behind [1]. When the lower coal seam mining face advances into the influence range of the mining area, the roof structure collapses again, and the thick and hard suspended roof breaks and fails under the additional stress of the residual coal pillar [2]. The special coal–rock occurrence conditions and repeated mining disturbance cause abnormal mine pressure, and there is a hidden danger of cutting the roof pressure on the hydraulic support of the mining face. The mining face cannot advance for a long time and then causes the spontaneous combustion of coal seams and other problems, which seriously affects the safety production of coal mines. The current mine pressure monitoring system cannot predict and analyze the mine pressure law under the special roof structure condition in real time, and the field technicians cannot predict the abnormal pressure and take corresponding measures, resulting in production stoppage due to pressure support.
The residual coal pillar adjusts the stress distribution characteristics of the mining face under complex geological conditions [3] and bears the load of roof fractures in the mining area [4]. The resource occurrence conditions in Shendong mining area are relatively simple. The upper coal seam group is generally mined with room-and-pillar or super-long and super-large mining faces [5,6]. When the lower coal seam in the coal seam group is mined, the overlying rock layer that has been moved and stabilized is reactivated and collapses again, and the stress field redistributes. The residual coal pillar acts as a bearing structure of the arch foot of the collapsed pressure arch of the upper mining area and continues to bear the roof load [7]. The bearing area includes the collapse area and the delamination area, causing the nearby coal–rock mass to become unstable and damaged and transferring the concentrated stress to the lower part, inducing strong mine pressure in the lower mining area. Regarding the research on the disaster mechanism of the chain instability of the residual coal pillar group in room-and-pillar mining, Bai, Feng, and others proposed a method for evaluating the chain instability of the residual coal pillar group by referring to the anti-continuous collapse design theory of building structures, based on considering the local instability characteristics of the “key pillar”, analyzing the chain response characteristics of adjacent residual coal pillar group damage [6,8]. The instability of a single coal pillar is the cause of the instability of the whole coal pillar–roof system [9]. The coal pillar is first damaged and causes the rock layer to be damaged. The rock layer damage aggravates the coal pillar damage. The instability of the residual coal pillar causes the thick and hard basic roof to be damaged. Hydraulic fracturing can effectively weaken the thick and hard basic roof, destroy its integrity; block the stress transfer path; and reduce the strong dynamic load borne by the hydraulic support [10].
In recent years, the coal industry internet has been rapidly implemented, and the storage, transmission, and utilization rate of mine pressure data have been improved, providing conditions for the online monitoring and deep mining of mine pressure data on the mining face [11,12]. The mine pressure monitoring data of the mining field mainly reflects the hydraulic support monitoring data, including the initial support force, the final resistance, the working resistance, the number of safety valve openings, the resistance change rate, etc. By analyzing the massive mine pressure monitoring data from multiple sources, a multi-factor work cycle characteristic parameter index system is established, which can realize the intelligent perception of the hydraulic support state and the roof state of the mining field [13]. The mine pressure data of the mining face has temporal characteristics in the advancing process. By performing a time series analysis and modeling on the massive mine pressure data, extracting key features for data prediction, neural network deep learning can realize the prediction of the mine pressure manifestation law of the working face. Zhao and others used SQL (Structured Query Language) and SLTM (Long Short-Term Memory Artificial Neural Network) deep learning methods to successfully generalize the prediction model [14]. Gao used the field monitoring data of the hydraulic support working resistance, used the nonlinear prediction method to extract the dynamic data sequence characteristics of the hydraulic support working resistance, and applied the AGCRN model to the hydraulic support working resistance prediction of the super-long comprehensive mining face. The predicted result is that the average working resistance in the middle of the working face is higher [15]. Dong proposed a multivariate linear regression model to predict the pressure when the coal mine roof breaks and obtained the linear regression coefficient and pressure prediction value of the model. The prediction result and the monitoring data error are less than 30% [16]. The clustering analysis algorithm can extract feature parameters to more accurately classify the data [17], and this algorithm is increasingly used in the field of mining engineering. Javaid used the k-means algorithm in multivariate stress space to classify the stress tensor data, and divided the stress heterogeneity data into homogeneous stress domains, and characterized them using multivariate statistics [18]. Chen et al. considered the time–space correlation of hydraulic support working resistance data on the working face, proposed a continuity classification method based on k-means clustering algorithm for large space mining field size pressure; divided the roof pressure into four types: no pressure, small pressure, large pressure, and strong pressure; and accurately identified the mining field pressure [19]. The clustering analysis method is also applied in the field of impact pressure prevention and control. Chen took the LW8102 working face of Tongxin Mine as the research object, used the k-means clustering algorithm to analyze the microseismic event data, and identified the relationship between the microseismic event and the dynamic change of the overlying layer fracture [20].
With the advancement of the coal mine intelligence process, the intelligent algorithm provides a new idea for the roof pressure prediction and early warning of working face, but only using algorithm prediction does not combine with mining theory and field practice and does not consider the strong mine pressure manifestation characteristics of mining face under the geological abnormal area, such as goaf and residual coal pillar in coal seam group mining. For this purpose, this paper establishes a dynamic and static load residual coal pillar bearing-transfer mechanical model under the condition of downward mining, numerically simulates the stress transfer law of a residual coal pillar in goaf, deeply extracts the time–space correlation characteristics of the mine pressure data of support working resistance during mining face advancement, clusters an analysis of abnormal pressure types on the mining face based on the CEEMDAN–Transformer deep learning method, intelligently predicts the hydraulic support working resistance of the whole area of the mining face over the upper coal seam goaf and residual coal pillar abnormal geological area, clusters the analysis, and reconstructs the abnormal roof pressure faced by the mining face. The prediction clustering analysis reconstruction abnormal pressure analysis method based on mine pressure data of the mining face proposed in this paper provides guidance for a strong mine pressure analysis, prediction, and early-warning method of the mining face and has good foresight, intelligent prediction, and an intelligent analysis method for the intelligent empowerment of mine safety production.
2. The Abnormal Mine Pressure Characteristics of the Working Face
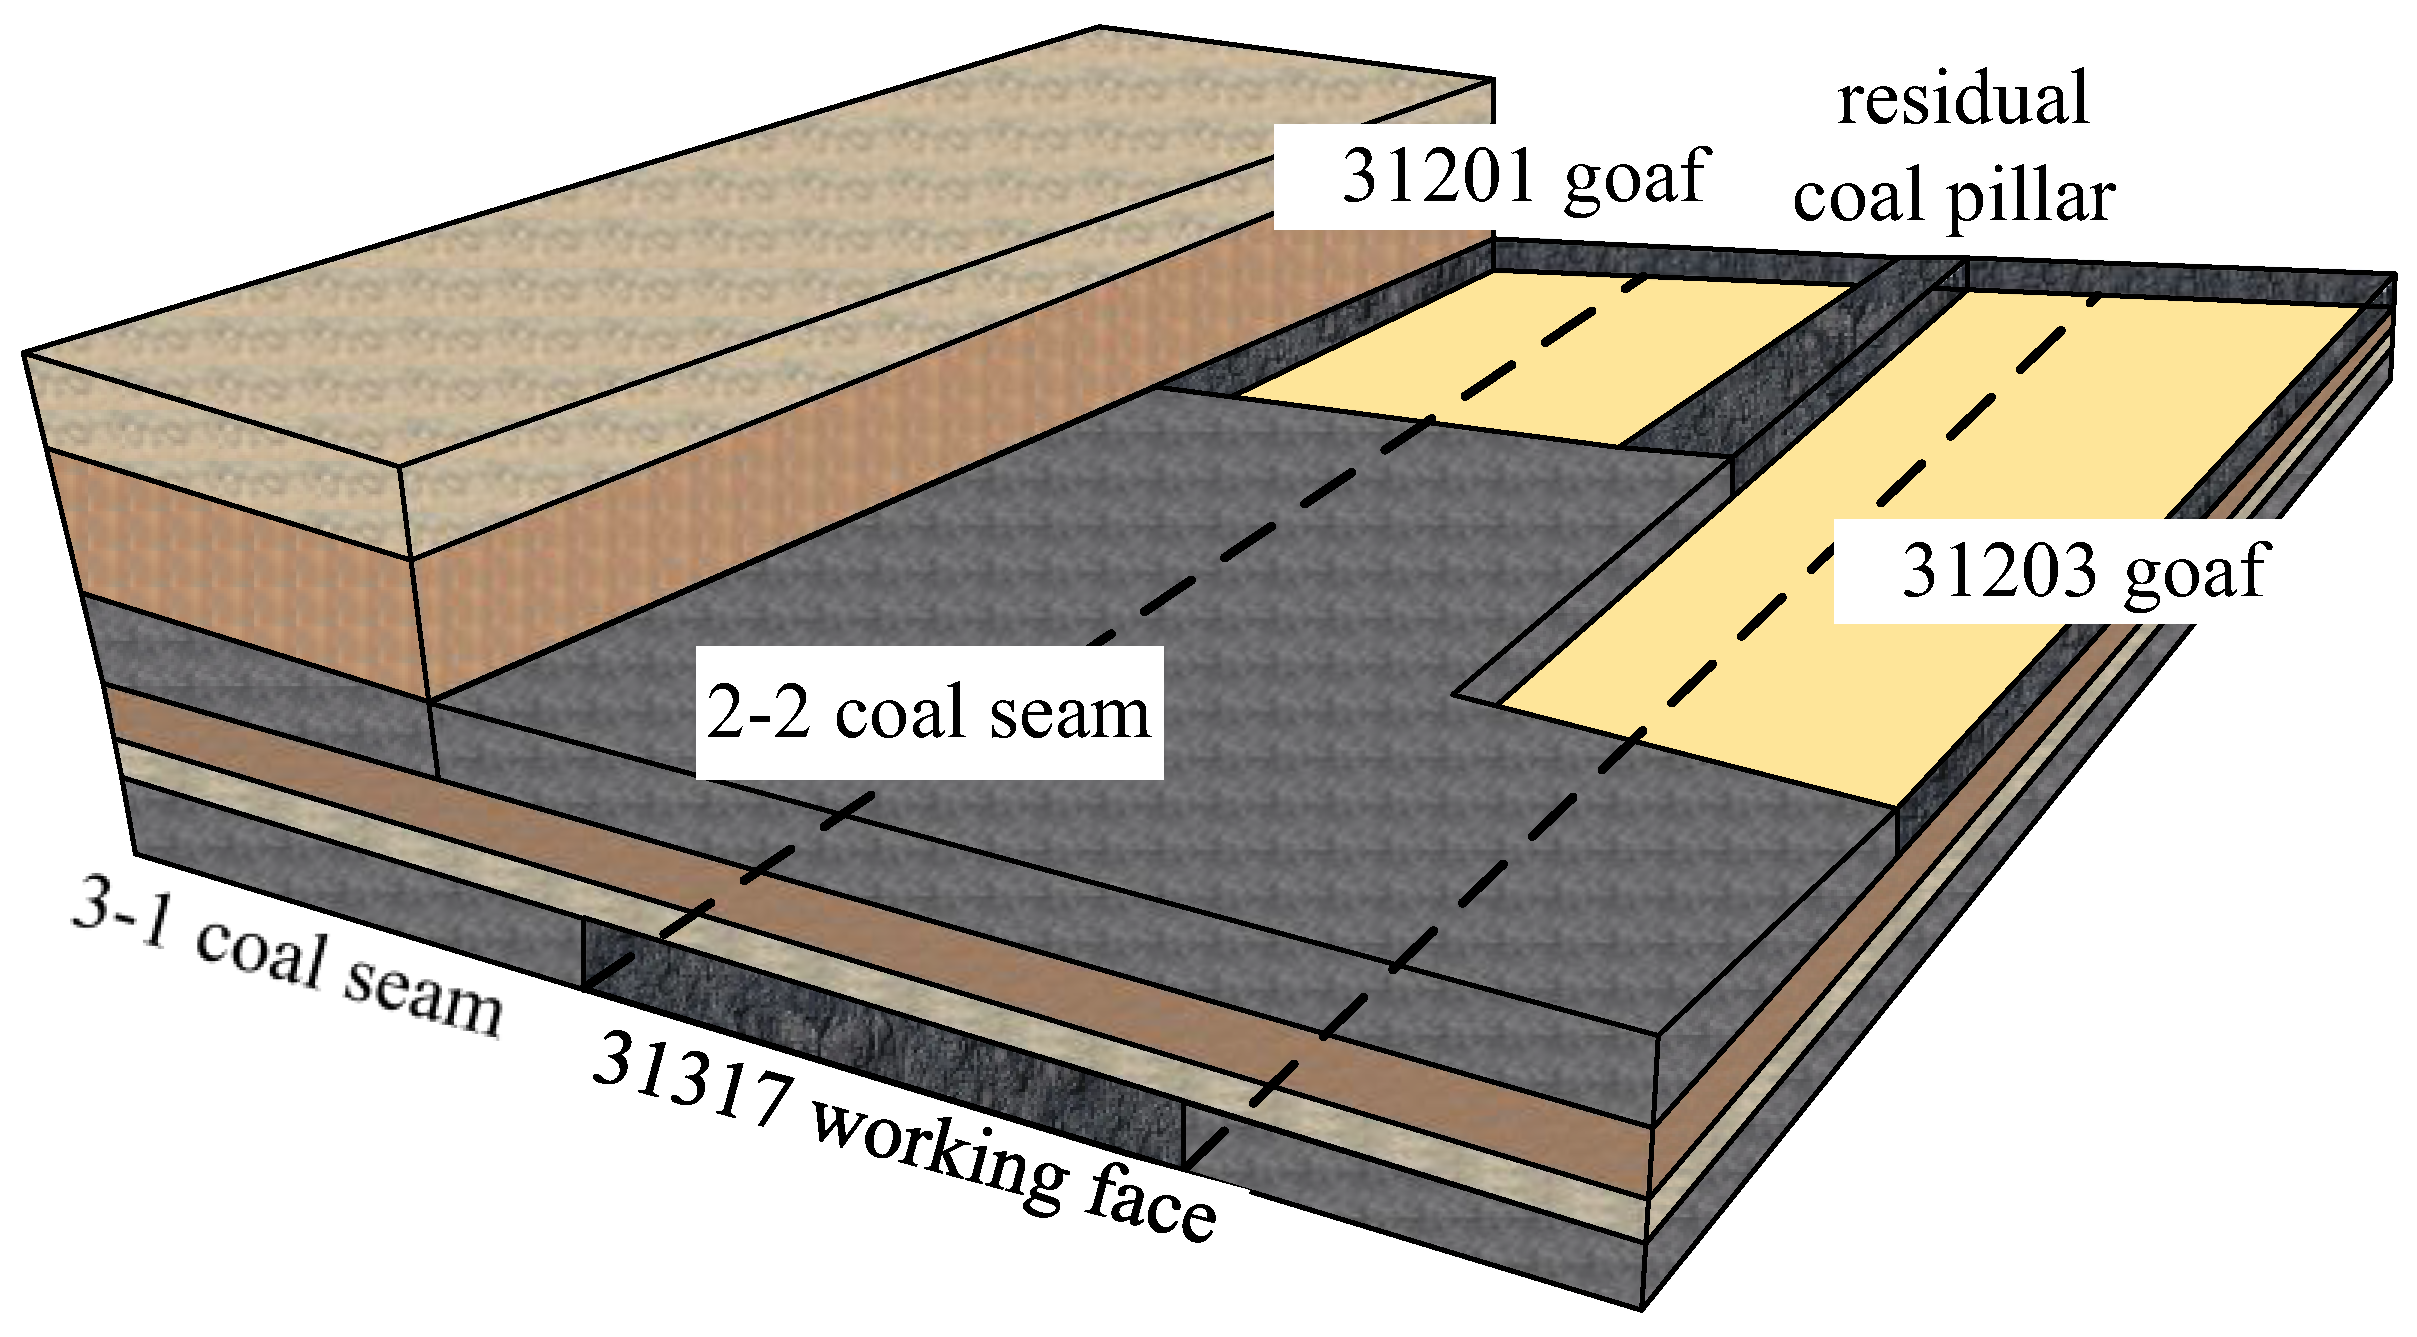
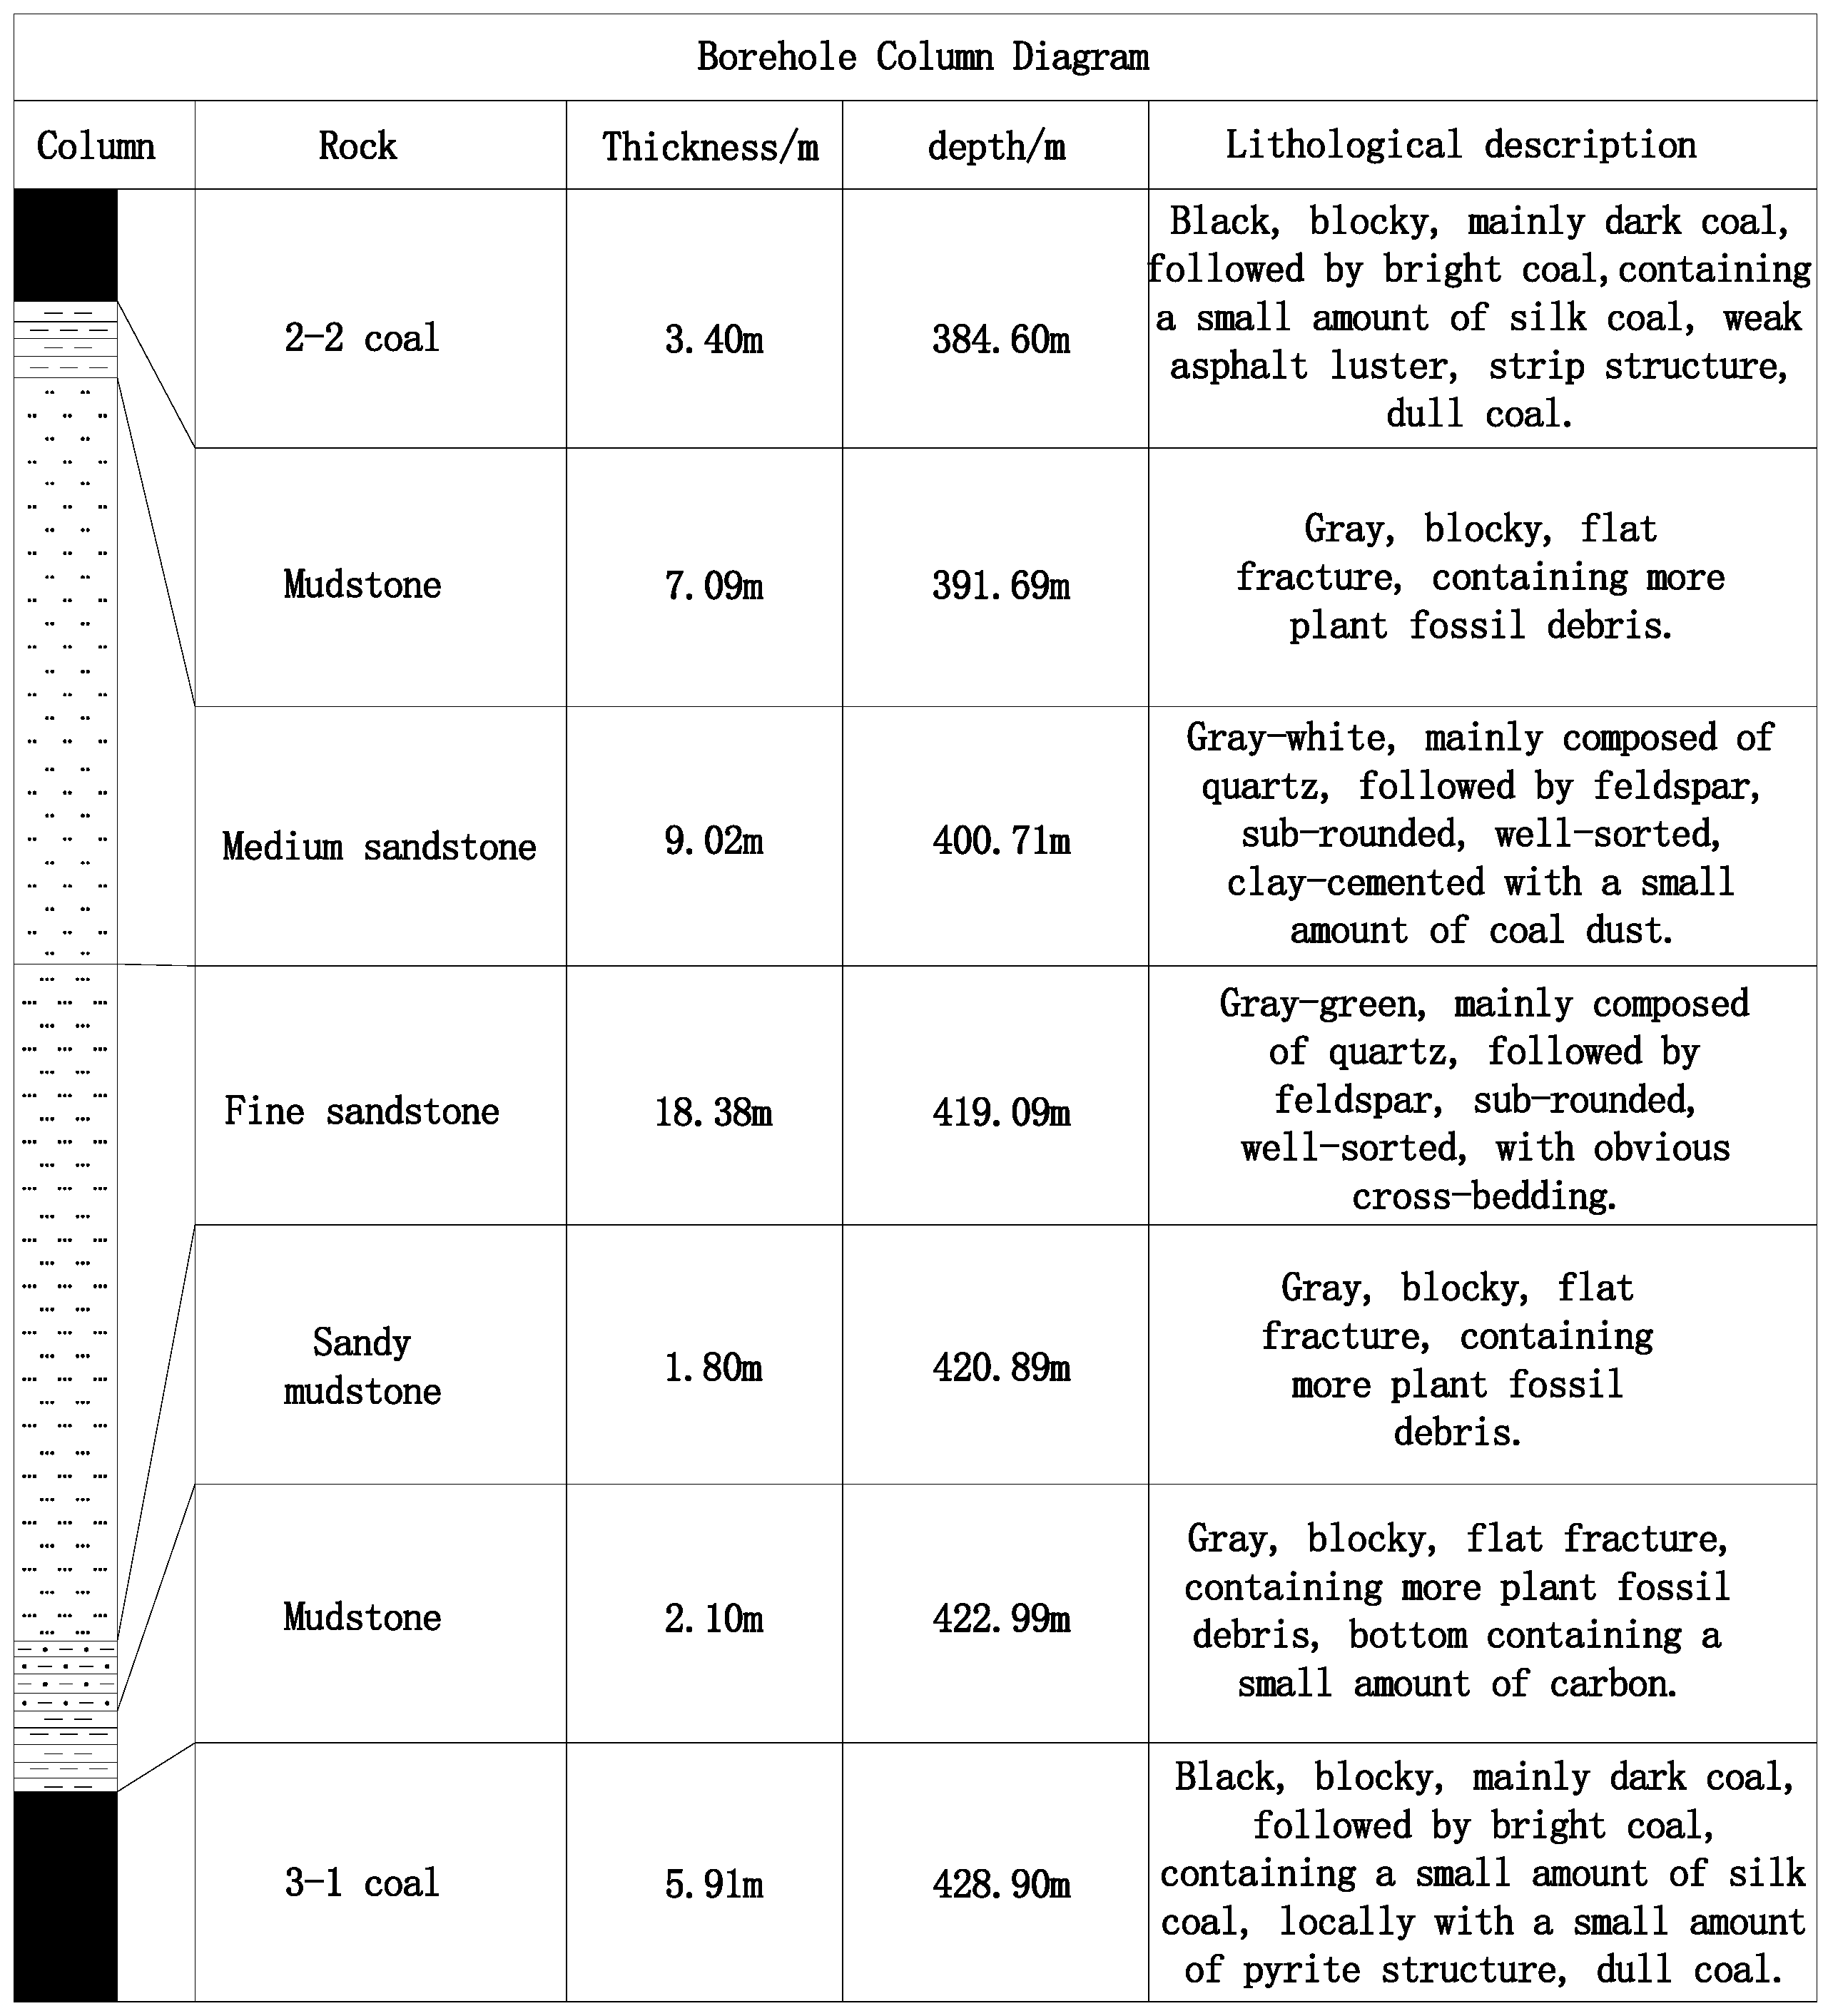
The main mining coal seams of the Chahasu coal mine are 2-2 and 3-1. The 3-1 coal seam passes through the goaf and double roadway residual coal pillar influence area of the 2-2 coal seam. The time and space relationship of the 2 and 3 coal seam working faces is shown in Figure 1, and the mining engineering plan is shown in Figure 2. The 2-2 coal seam is buried at a depth of 384.6 m, with an average thickness of 3.40 m. The 3-1 coal seam is buried at a depth of 428.90 m, with an average thickness of 5.91 m. The dip angle is 1–3°, and the coal pillar width of the section is 30 m. The interlayer thickness is 38.39 m, of which the upper key layer is 9.02 m medium-grained sandstone, and the lower key layer is 18.38 m fine-grained sandstone. The borehole columnar diagram is shown in Figure 3. The 31201 working face mining completion was in 2015, the 31203 working face mining completion was in 2016, and the 31317 working face started mining in 2022.
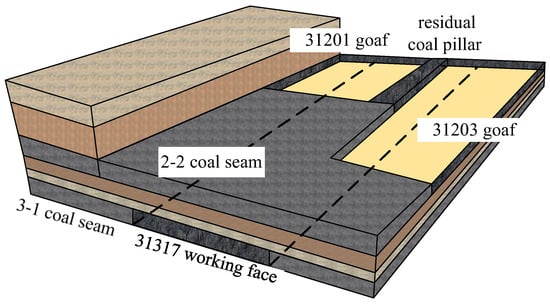
Figure 1.
Schematic diagram of the spatiotemporal relationship of the coal seam group mining face.
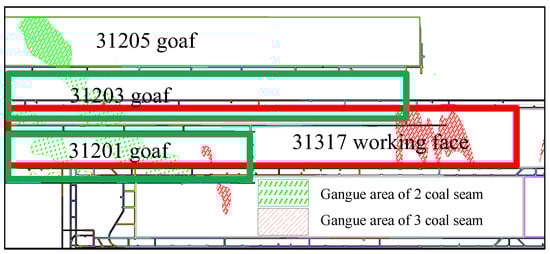
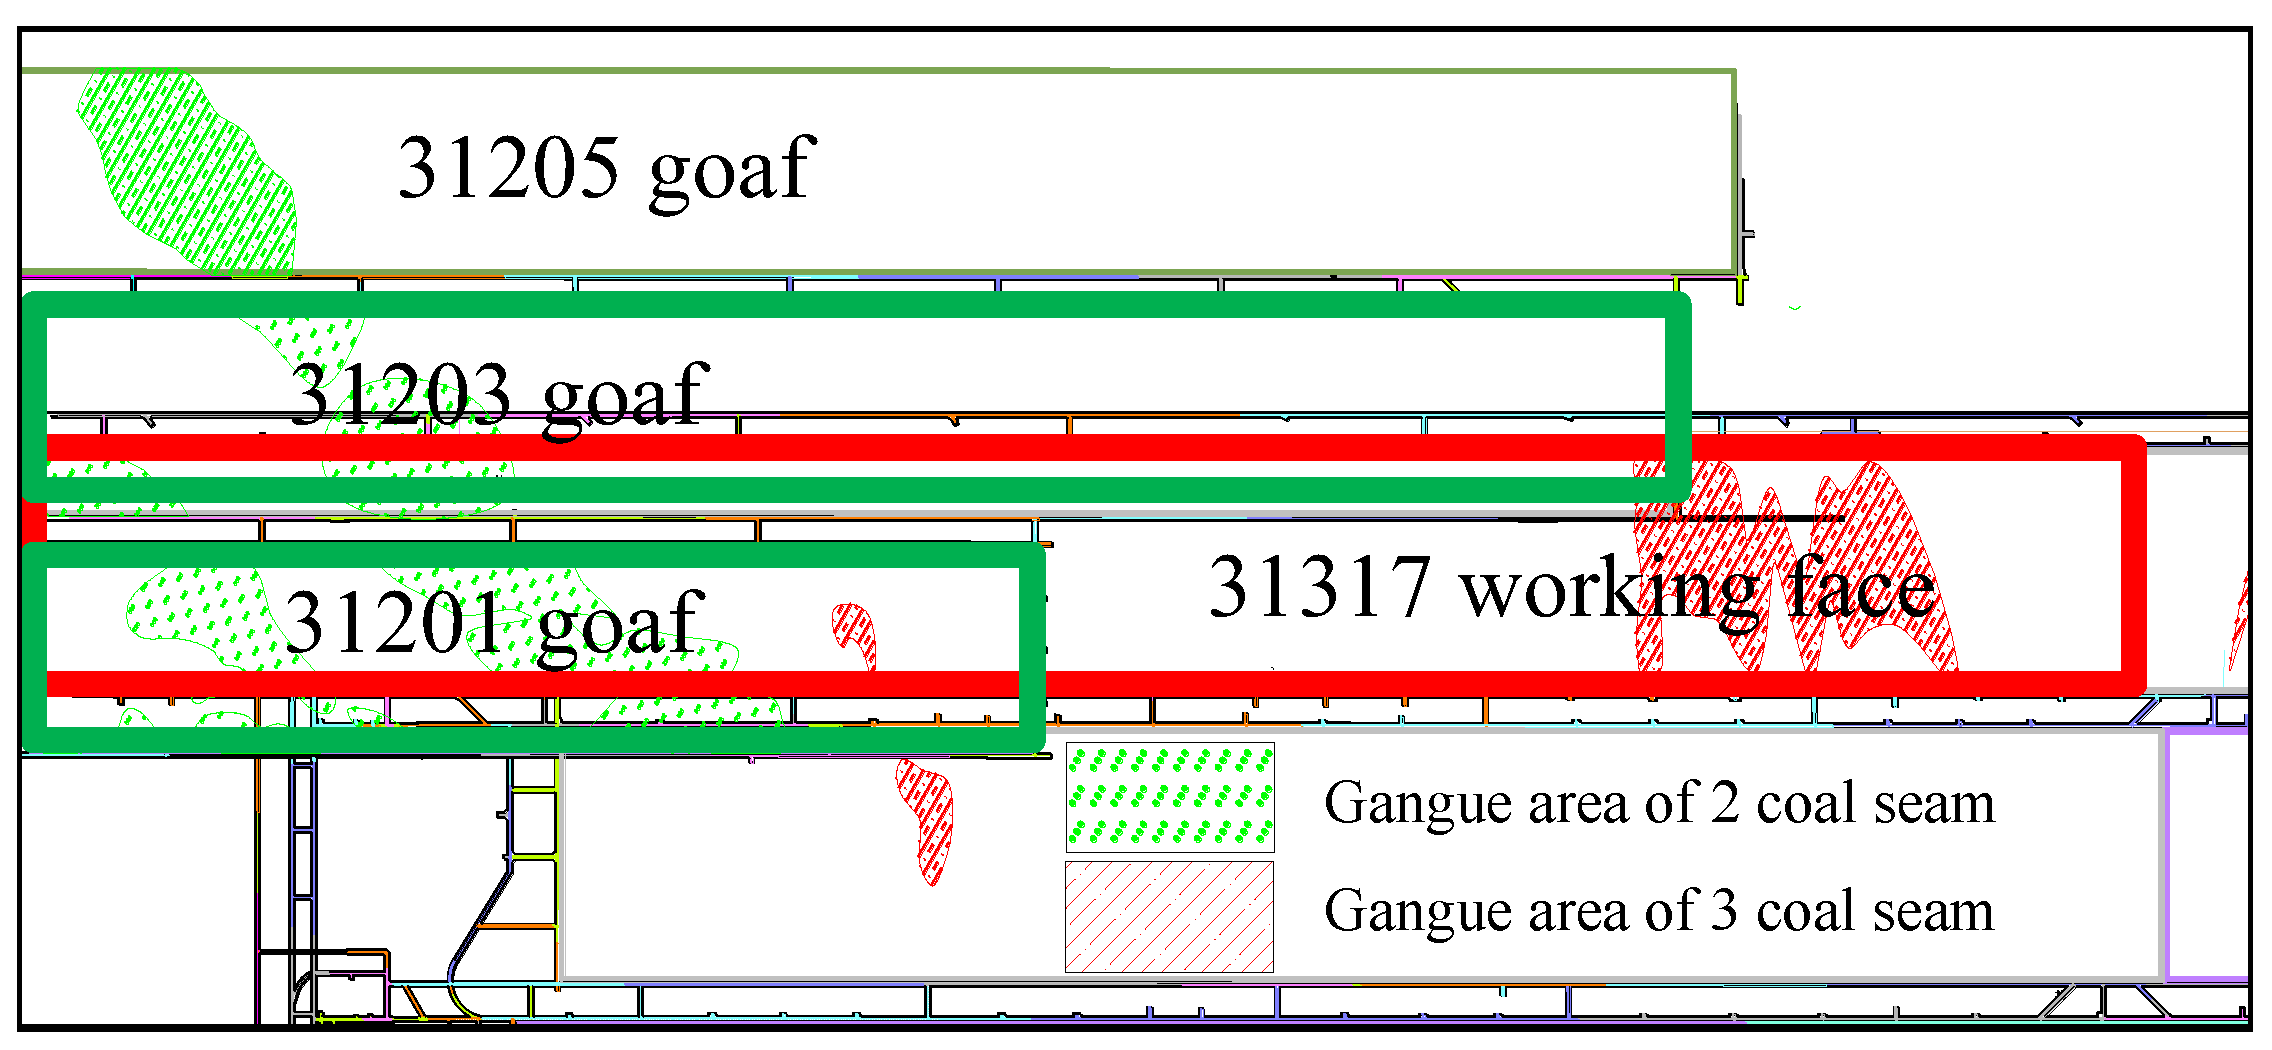
Figure 2.
Mining engineering plan.
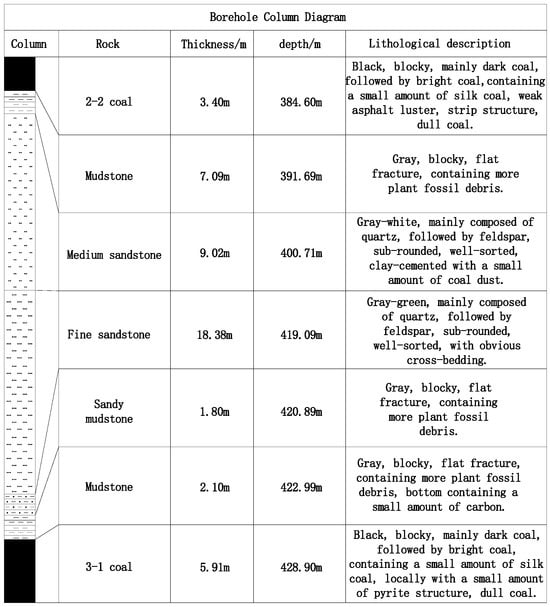
Figure 3.
Description of coal and rock seams.
When the 31317 working face and its subsequent working faces advance through the influence area of the coal pillar left by the 2-1 coal mining area, the middle part of the working face shows a significant increase in mine pressure and a sudden abnormal pressure. The reasons are analyzed as follows: first, the remaining coal pillar forms a high-stress concentration area and continues to propagate downward, and the accumulated pressure is rapidly released during the recovery process of the working face, increasing the working resistance of the hydraulic support; second, when the working face advances under the remaining coal pillar, the overlying rock structure of the mining area that has been moved and stabilized is broken again, and the remaining coal pillar rotates and becomes unstable with the key rock layer above the interlayer, forming a dynamic load; and third, the overlying structure of the working face breaks at the hanging roof, forming a “slanted step rock beam” structure [21], causing strong mine pressure disasters, such as support crushing, roof leakage, etc.
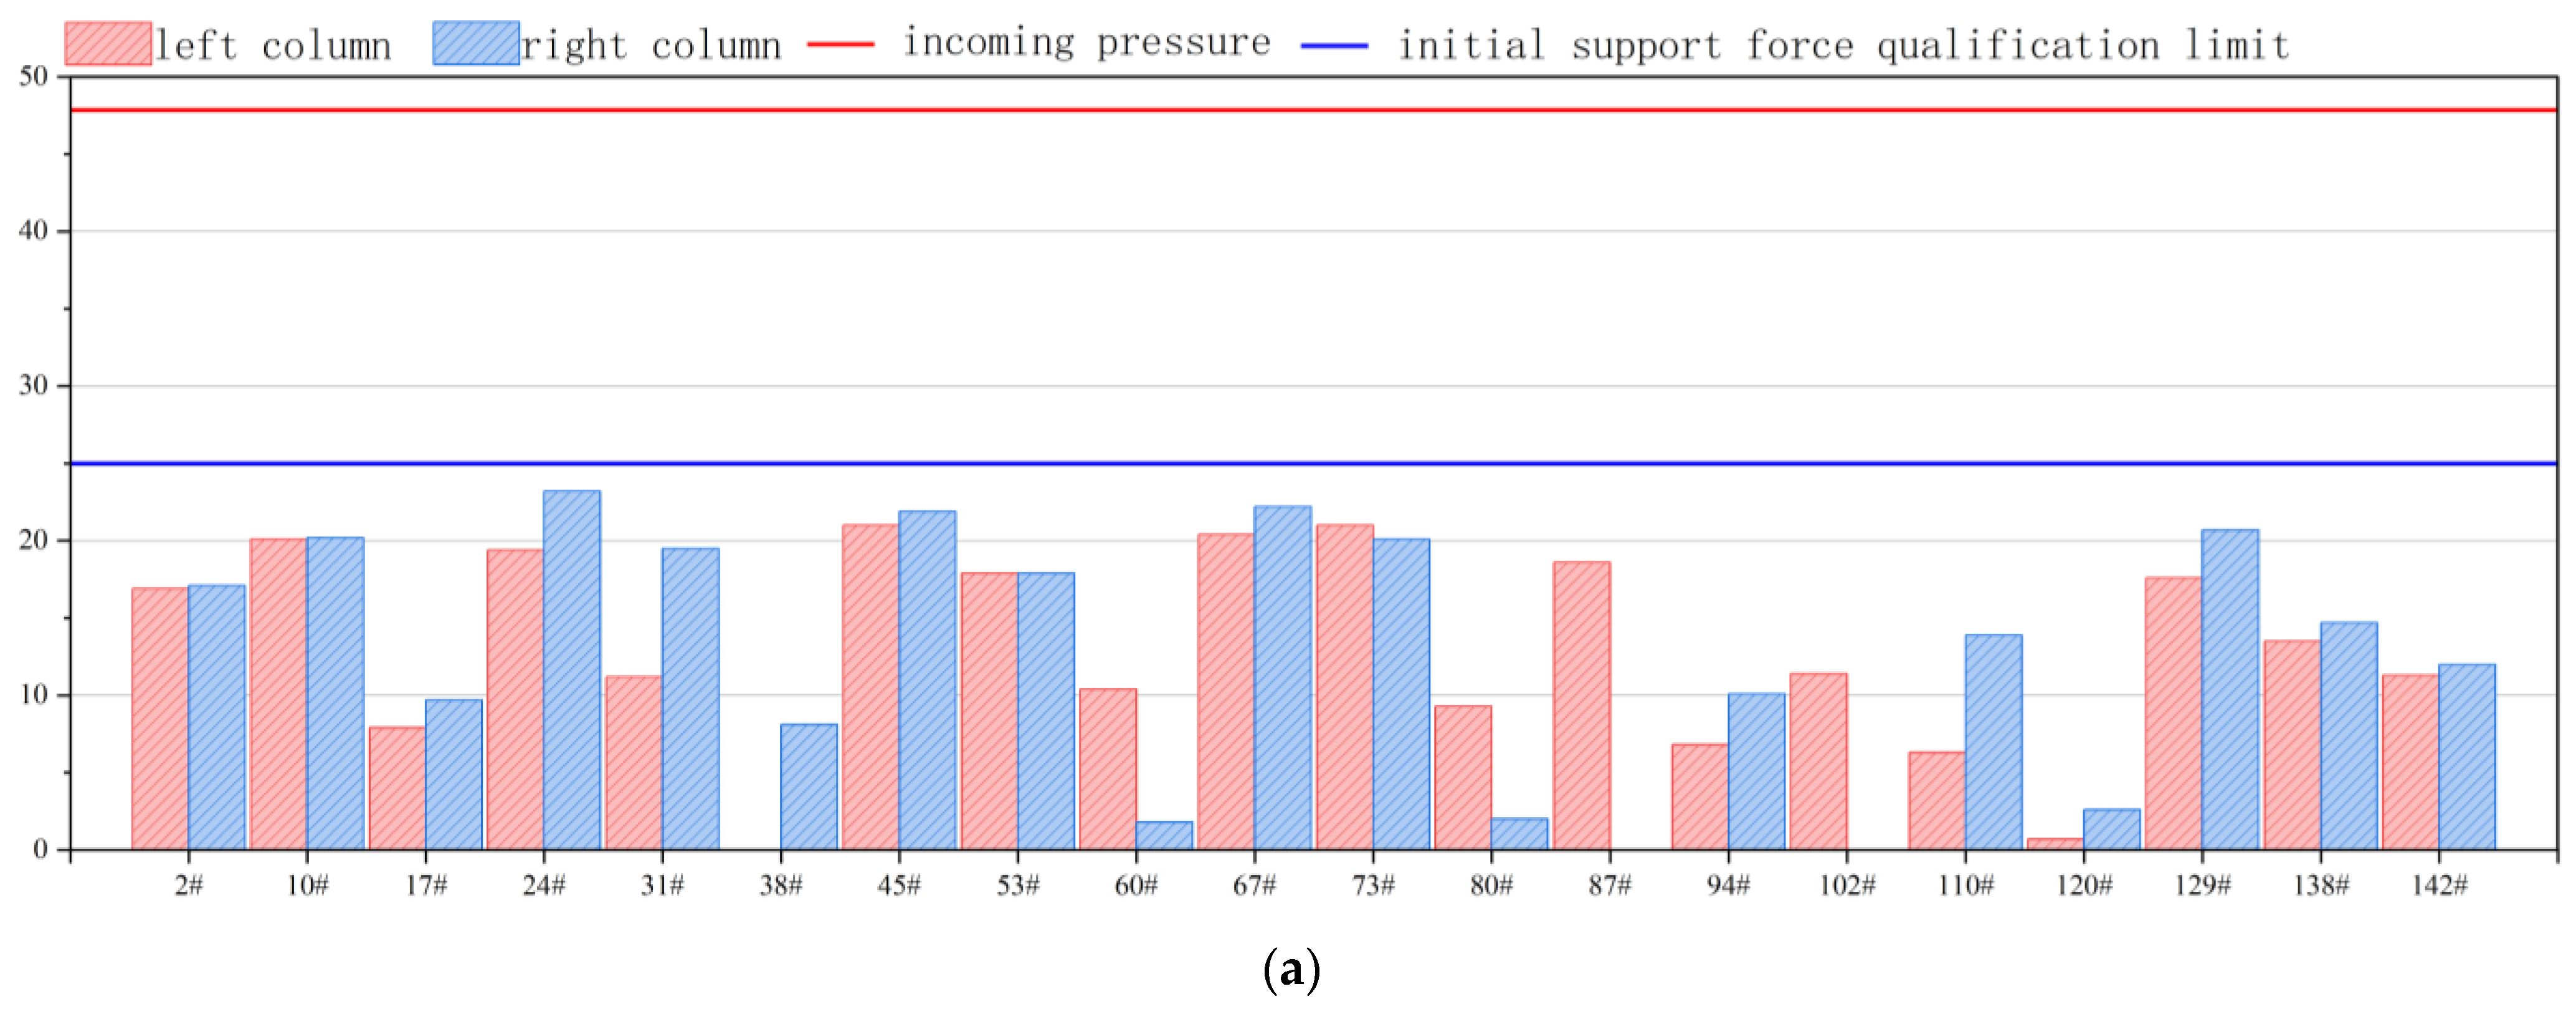
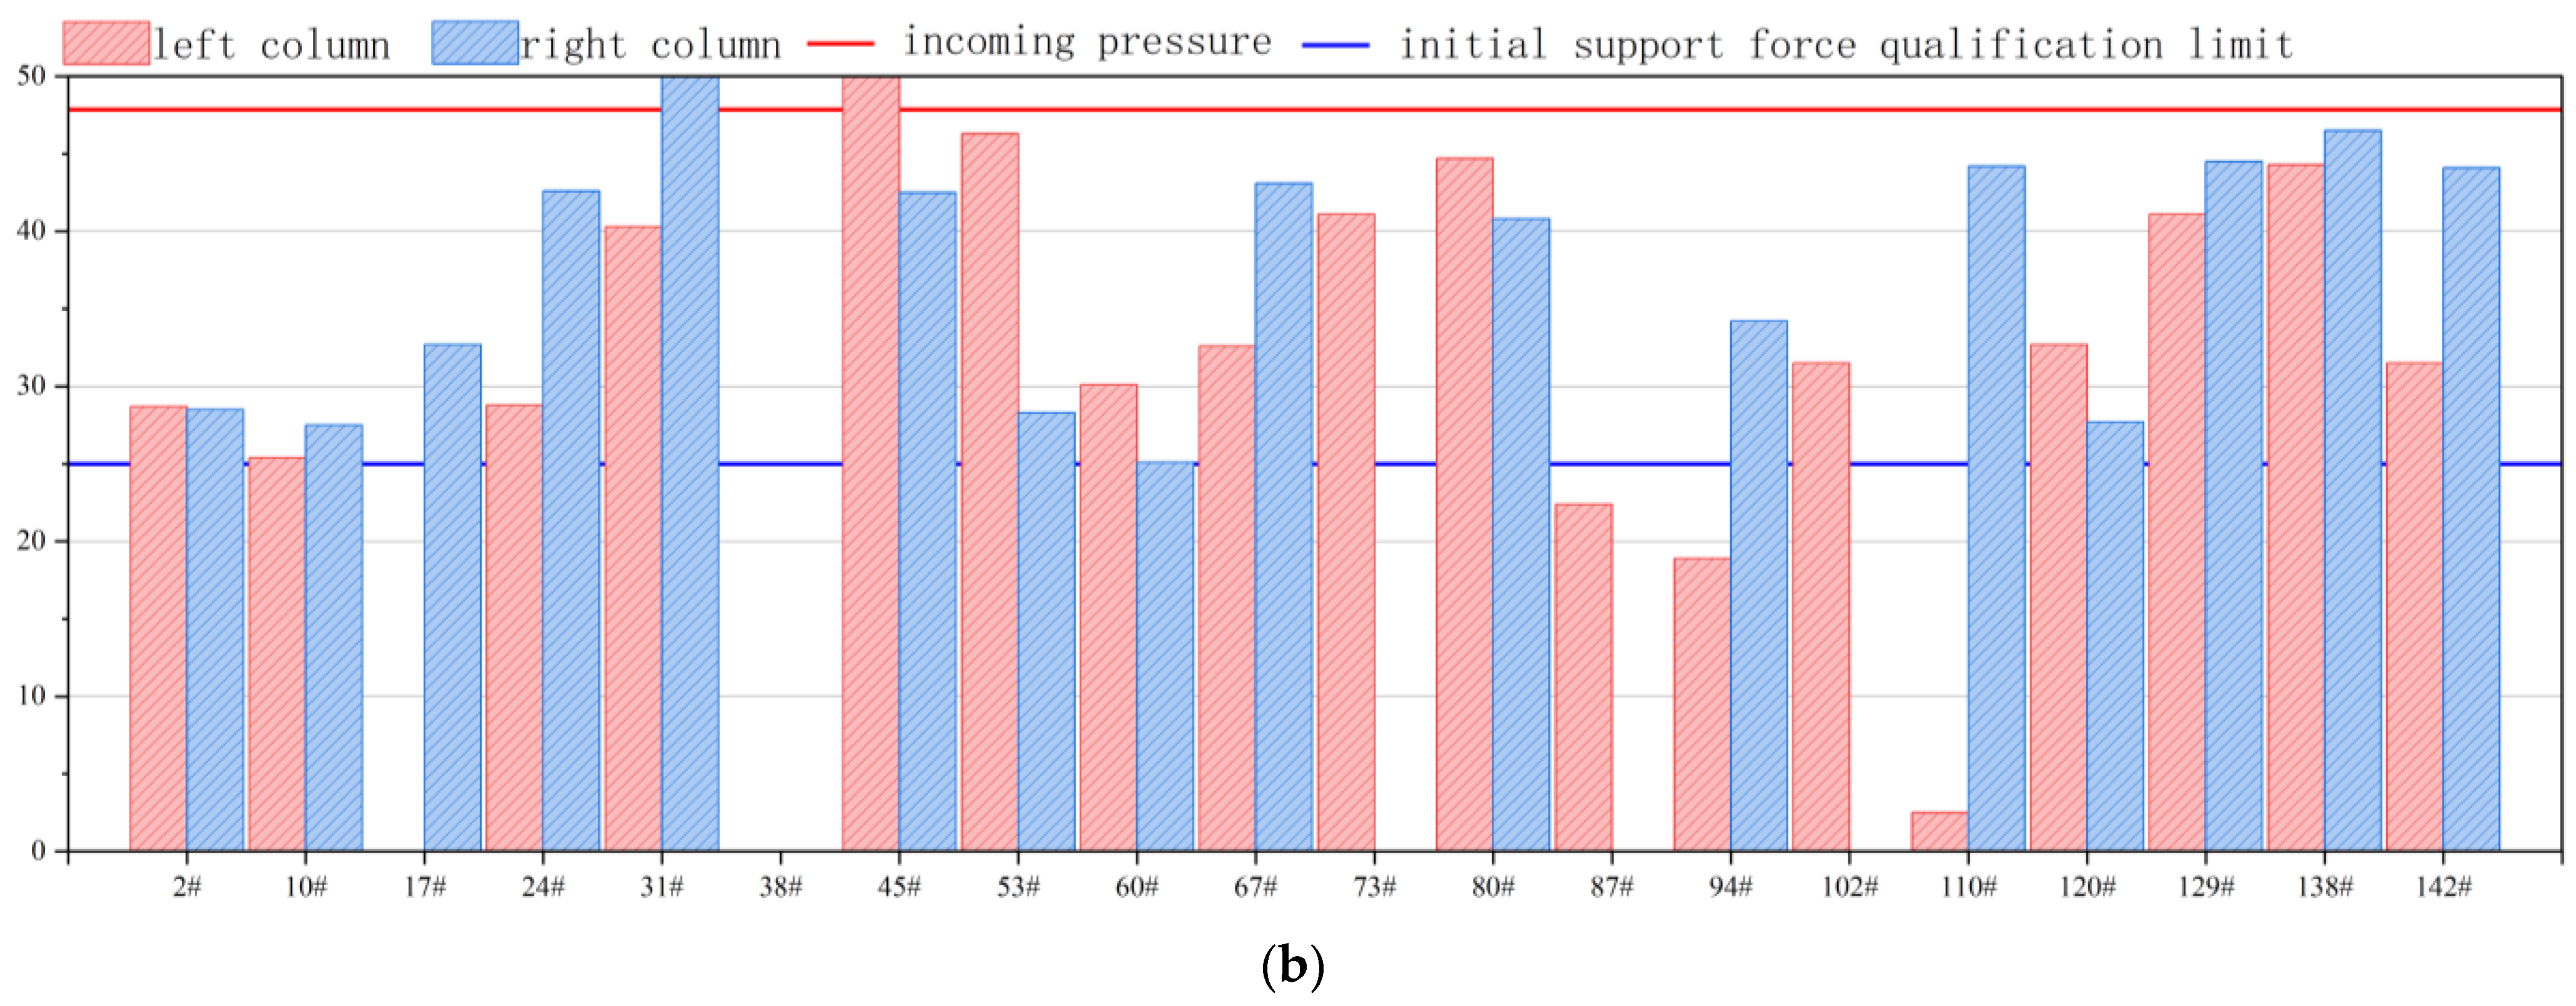
At present, the online monitoring system of the hydraulic support working resistance can monitor the current mine pressure intensity in real time but cannot analyze the mine pressure intensity at the end of pressure. The average working resistance and its average variance of the support are used as the pressure determination index of the pressure analysis system, which has hysteresis and cannot analyze whether it is under pressure in real time. The support resistance change characteristic as the mining completion criterion can be used to analyze the current mining pressure intensity, but the abnormal mining pressure shows a rapid increase in resistance [13]; as shown in Figure 4, the support resistance increases by 80% within the fastest 4 h. For special geological locations, such as mining areas, remaining coal pillars, and structural fracture zones that cause abnormal mine pressure, the current working face mine pressure analysis system cannot achieve a timely early warning, and abnormal pressure causes disaster to threaten personnel and equipment.
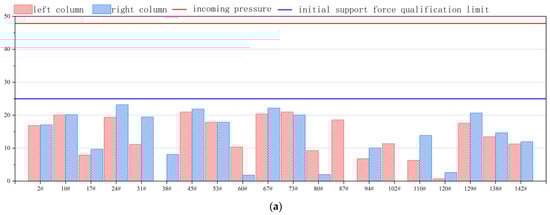
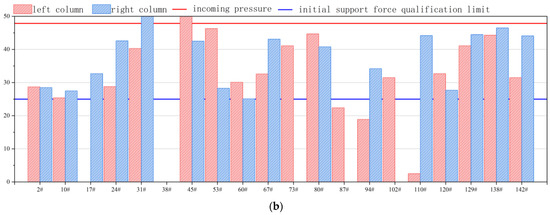
Figure 4.
Hydraulic support resistance monitoring graph of 31317 mining face before and after weighting: (a) Pre-pressure hydraulic support resistance data; (b) post-pressure hydraulic support resistance data.
3. Stress Transfer Law of Remaining Coal Pillars in the Underlying Coal Seam
3.1. Bearing-Transmission Mechanical Model of Remaining Coal Pillars under Dynamic and Static Loads
Mining disturbance causes a roof collapse and movement; the bending stiffness of the low-key rock layer is much lower than that of the high-thick key rock layer and breaks to form key blocks. The rock layer movement does not affect the stability of the high-thick rock layer, according to the effective area theory, and the crack band separation zone arch structure has a certain self-stability. The residual coal pillar bears the roof weight of the upper coal seam to the high-thick hard rock layer [22]. The schematic diagram of residual coal pillar bearing is shown in Figure 5, and the area of effective roof load on the residual coal pillar is S:
where S is the area of effective roof load acting on the residual coal pillar (m2) and d is the width of the coal–rock pillar (m).
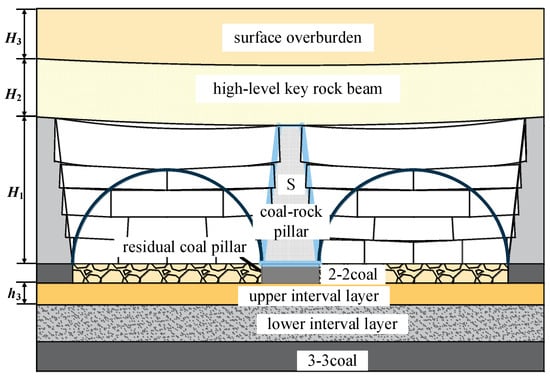
Figure 5.
Schematic diagram of residual coal pillar bearing.
The concentrated force Fl on the residual coal pillar after the stability of the overlying strata movement above the goaf is as follows:
where Fl is the concentrated force on the residual coal pillar (N) and γ is the average bulk density of the strata within the bearing range of the coal–rock pillar (N/m3).
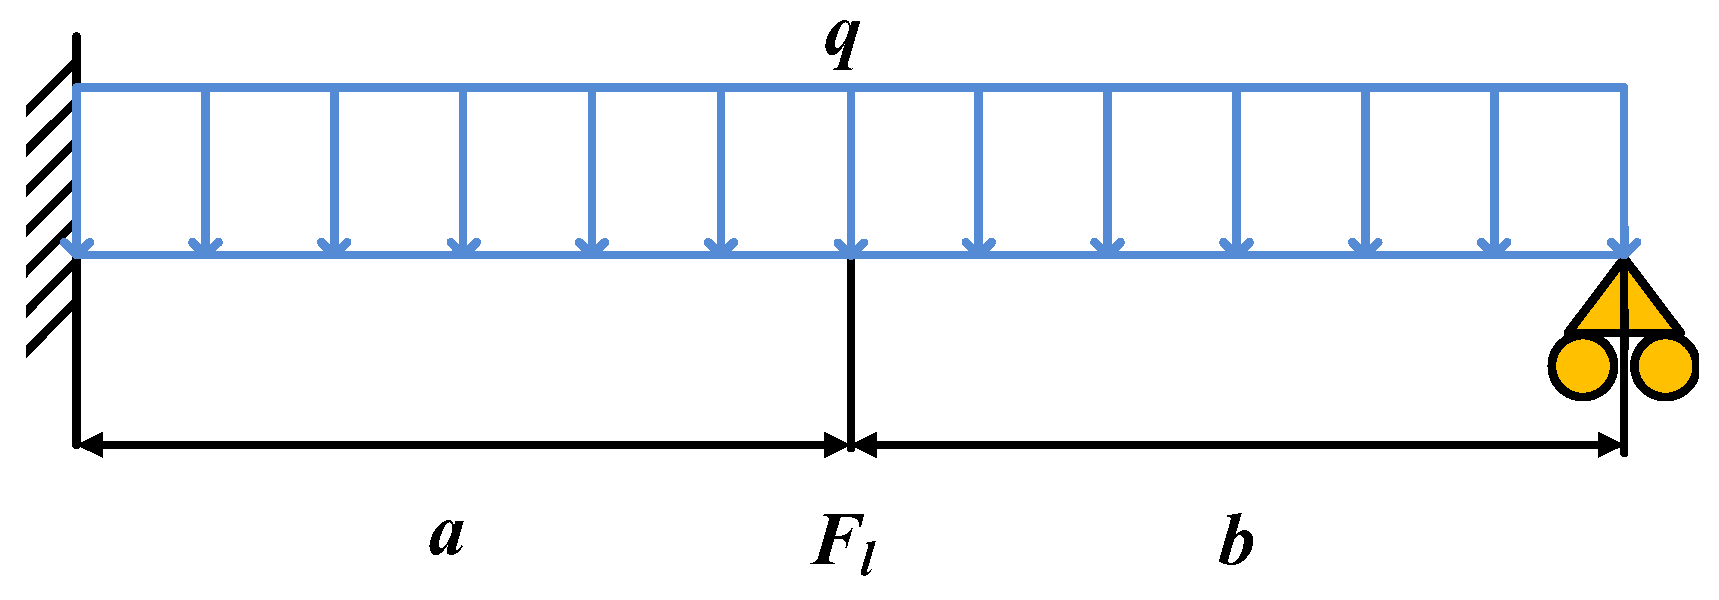
The high-thick rock layer bears the load of the upper rock layer by itself and bends and sinks to apply a static load to the rock pillar system composed of coal pillars and the upper rock body (hereinafter referred to as coal–rock pillars). The mining time on both sides of the coal–rock pillar is different, and the high-thick key rock layer is simplified as a rigid rock beam with one end fixed and one end simply supported, which is the mechanical model of the coal–rock pillar bearing system, as shown in Figure 6.

Figure 6.
Coal–rock pillar bearing system mechanical model.
The high-level key rock beam mainly bears the surface overburden and is simplified by the uniform load q:
where H3 is the height of the surface overburden (m) and a, b are the distances from the coal–rock pillar to the fixed end and the simple end of the high-level key layer rock beam, respectively (m).
The high-level key rock beam satisfies the deflection-moment equation:
where E is the deflection of the high-level key rock beam (m), M is the bending moment of the high-level key rock beam (N/m), E is the elastic modulus of the beam (GPa), I is the moment of inertia of the beam section (m4).
The bending moment M expression of the high-level key rock beam is as follows:
The concentrated load σs of the high-level key rock layer on the coal–rock pillar can be simplified as the concentrated force Fs:
where H2 is the height of the high-level key rock beam (m).
Assuming that the underlying rock layer under the high-level thick rock layer is a semi-infinite body, the point load σs′ formed by the concentrated force Fs acting on any point M below can be simplified as the concentrated force Fs′ as follows:
where Fs′ is the concentrated force (N), z is the vertical distance from point M to the concentrated force F1 (m), r is the distance from point M to the concentrated force F1 (m).
Therefore, the additional static concentrated stress F1 generated by the residual coal pillar is as follows:
where H1 is the height of the coal–rock pillar (m).
Considering that when the lower coal seam pushes and mines over the residual coal pillar, the overlying rock collapses again, and the upper interval layer that bears the residual coal pillar rotates and breaks and causes an impact; the accumulated elastic strain energy We is as follows [23]:
where ν is the Poisson’s ratio of the basic roof, L is the distance of roof breakage of the upper interval layer (m), h2 is the height of the upper interval layer (m).
The velocity of the broken rock block of the upper interval layer is as follows:
where m is the mass of the broken rock block of the basic roof (kg) and V is the velocity of the broken rock block of the basic roof (m/s).
According to the conservation of momentum, the dynamic load impact force caused by the broken rock block of the basic roof on the lower rock layer is as follows:
where Qm is gravity of broken rock block of basic roof (N) and t is impact time (s).
After the rotating and breaking of the basic roof bearing residual coal pillar, overlying rock moves and balances again, the stress transfer path reconnects to the residual coal pillar, and it still can transfer concentrated stress downward. The additional concentrated force F caused by residual coal pillar in upper coal seam to working face recovery is as follows:
3.2. Numerical Simulation of Stress Transfer Law of Residual Coal Pillars in Multi-Seam Mining
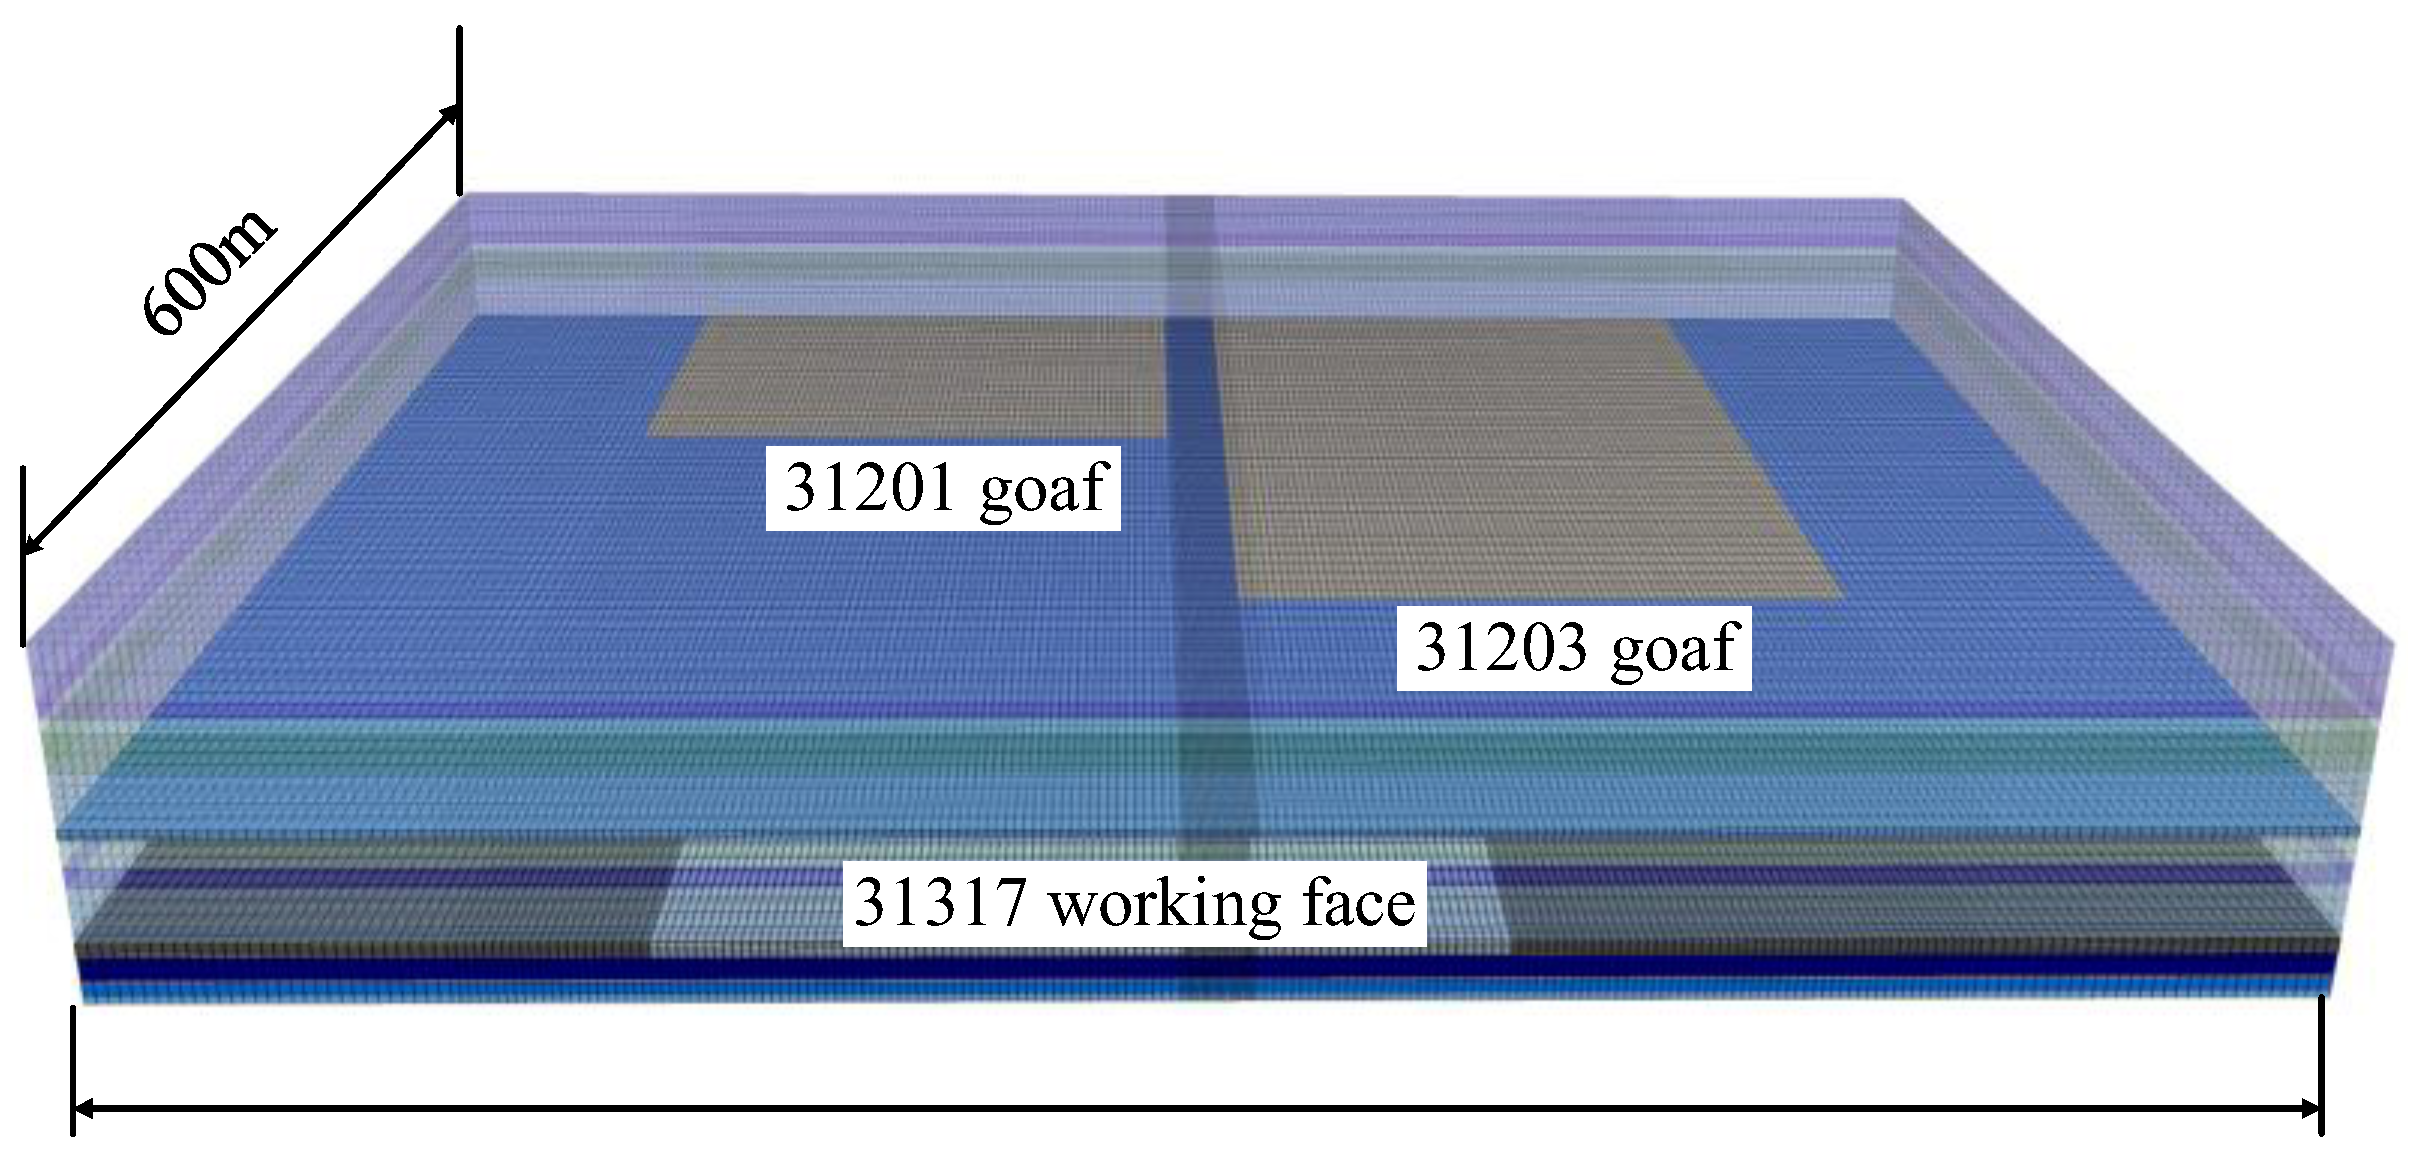
According to the engineering geological conditions of the 31317 mining face, a FLAC3D numerical model was established, with the model size of length × width × height being 745 m × 600 m × 128 m, as shown in Figure 7. The four vertical planes and the lower plane of the model were set as displacement boundaries, which restricted the movement along their normal directions. The upper plane of the model was a stress boundary. The weight of the rock layer that was not simulated above the model was applied to the upper plane of the model in the form of a uniform load, with a magnitude of 8.1 MPa.

Figure 7.
Model establishment.
The Mohr–Coulomb constitutive model was used to simulate the original rock stress field and the mining of the 31201, 31203, and 31317 working faces. During the calculation process, every 500 steps, the collapsed zone elements that had undergone plastic failure were identified and corrected to the double-yield constitutive model. Finally, the stress transfer law of the residual coal pillars in the 2-2 coal seam goaf during the mining of the 3-1 coal seam was obtained.
Considering the complexity of the rock mass in the underground engineering of the coal mine, the mechanical parameters of the coal and rock samples were obtained through laboratory tests and used as initial values. The mechanical parameters were calibrated by using the test results of the surrounding rock loosening circle after the roadway excavation until they matched the macroscopic failure characteristics of the engineering rock mass in the field. After multiple parameter matching and debugging, the numerical model parameters of each rock layer were determined, as shown in Table 1.

Table 1.
Physical and mechanical parameters of coal and rock in numerical model.
After the mining of the upper coal seam was completed, the roof collapsed and broke, gradually filling and compacting the goaf. The collapsed gangue gradually moved and stabilized, and the mechanical properties improved. The mechanical parameters of the goaf model were obtained with the Salamon formula, and the double-yield model was used to simulate the strain hardening process of the goaf gangue material [24].
where σ was the vertical stress of the caved rock mass (MPa), E0 was the initial tangent modulus of the rock mass (GPa), εv was the strain of the caved rock mass under vertical stress, was the maximum strain after the rock mass expands and breaks.
where bf was the expansion coefficient of the caved rock mass.
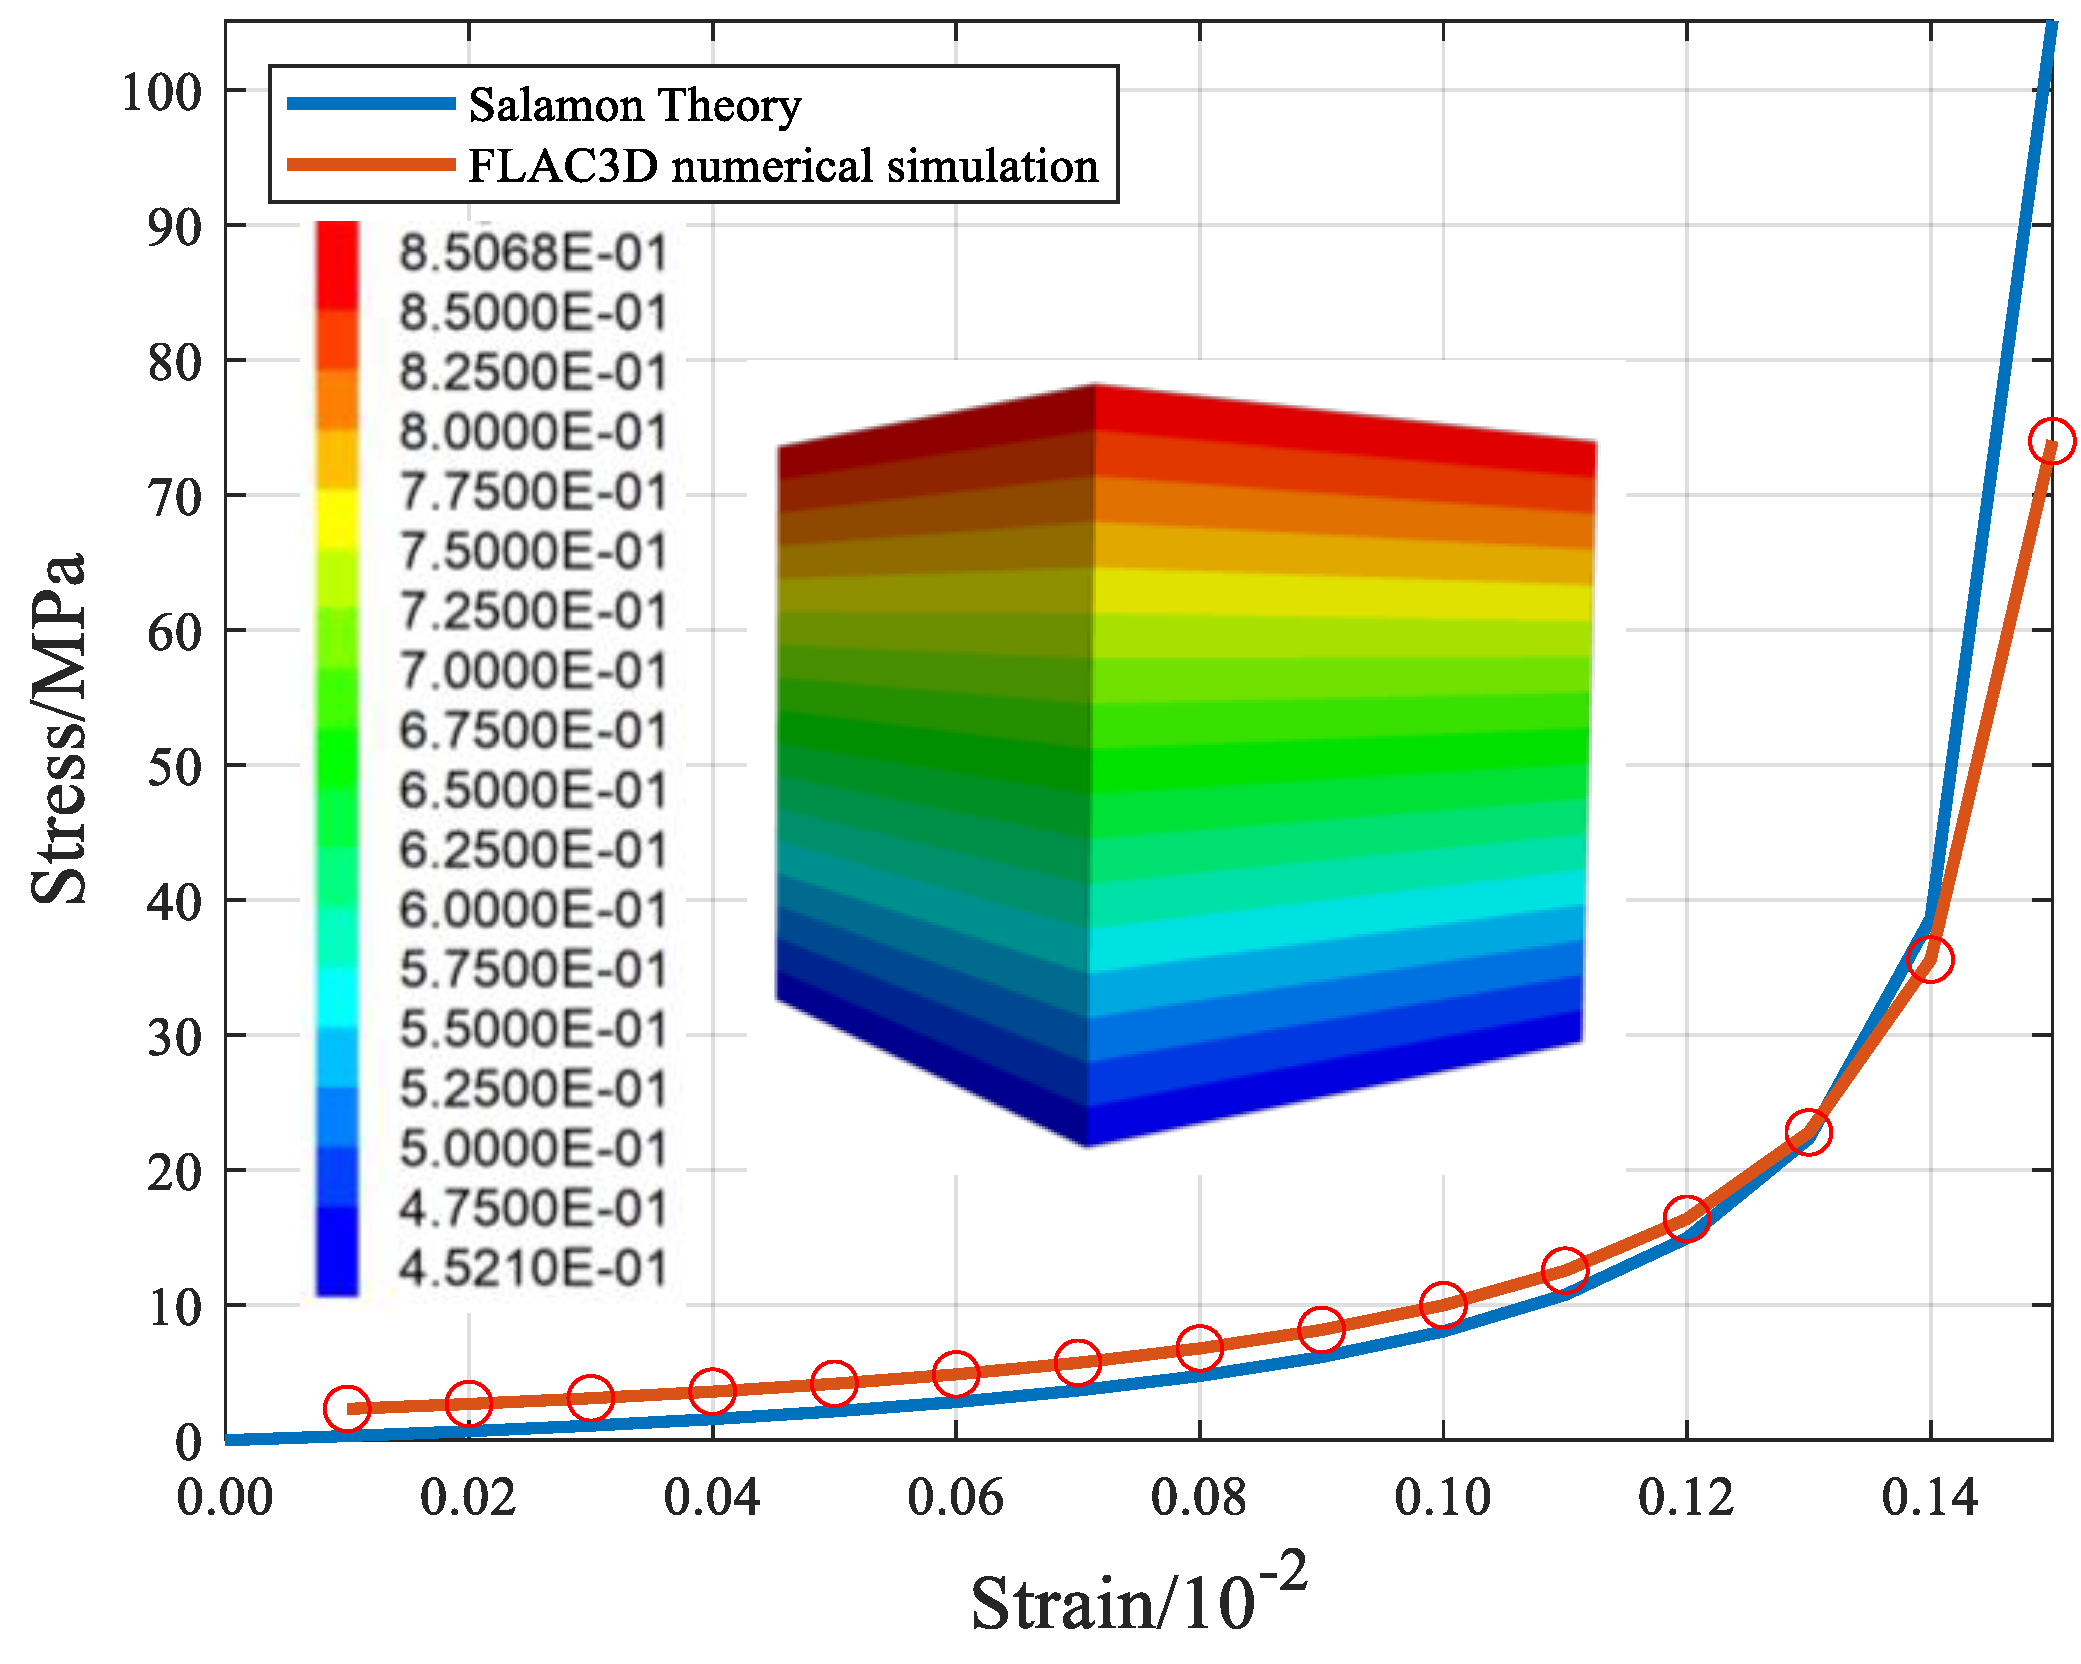
The model working face mined the 3-1 coal seam with a mining height of 5.9 m. The direct roof mainly consisted of medium-strength rock layers, such as sandy mudstone, fine sandstone, and medium sandstone. The expansion coefficient was 1.17, and the average compressive strength was 32.30 MPa. According to the empirical formula, the height of the caving zone was 12.62 m, the tangential modulus was 95.39 MPa, and the maximum strain was about 0.15. Substituting into Equation (13), the Salamon model was obtained for the simulation of the caved rock mass. At the same time, the trial-and-error method was used to load the unit rock mass multiple times and analyze its stress–strain characteristics until the simulation curve matches the theoretical curve, as shown in Figure 8. The calibrated parameters are shown in Table 2.

Figure 8.
Stress–strain relationship of goaf gangue with double-yield model.
Table 2.
Salamon model parameters table.
According to the aforementioned boundary conditions and physical and mechanical parameters, the numerical model was assigned, and the original rock stress field and 31201, 31203, 31317 working face mining were simulated using the Mohr–Coulomb constitutive model. During the operation process, every 500 steps identified the collapsed zone unit that had undergone plastic damage, corrected it to the double-yield constitutive model, and finally obtained the stress transfer law of the residual coal pillar in the goaf of seam 2-2 when seam 3-1 was mined.
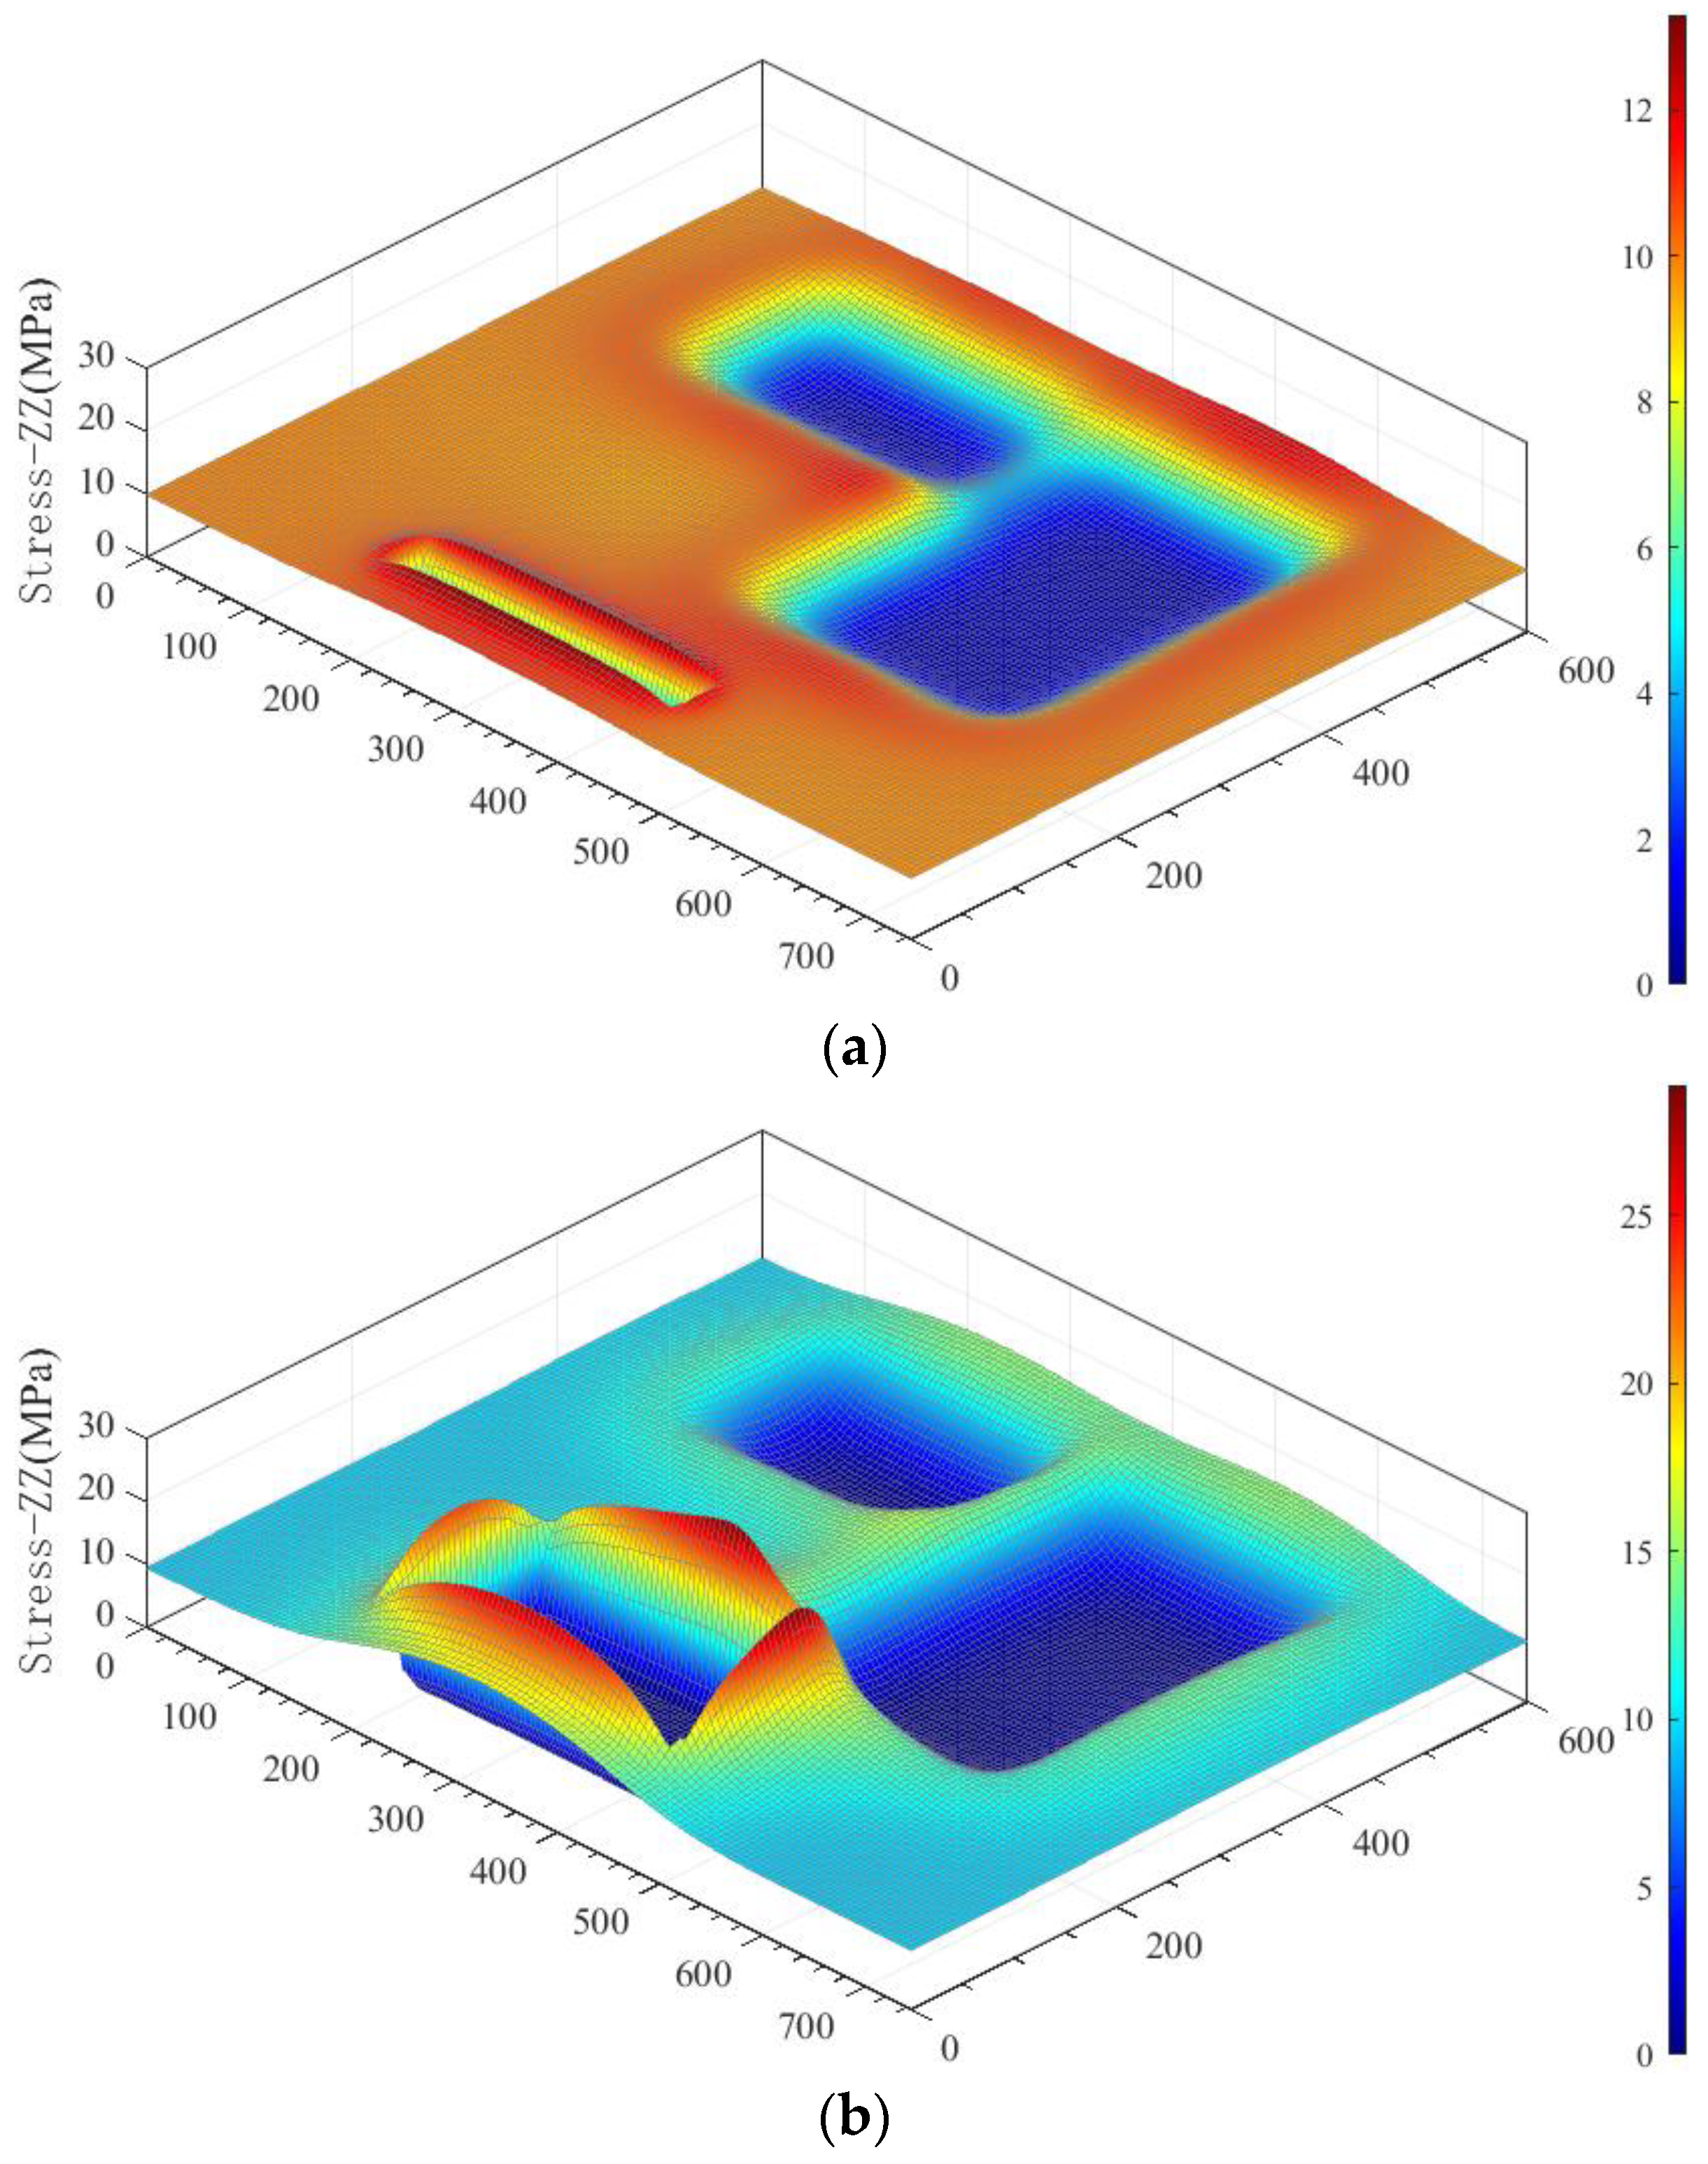
After seam 2-2’s 31201 and 31203 working faces were excavated, the residual coal pillar (width 30 m) transferred support pressure to seam 3-1’s roof. When 31317 mining face advanced to a distance of 30 m from the 31203 goaf, it began to be affected by the 31203 goaf. The advanced stress increase zone and 31203 mining field boundary stress increase zone were connected. The roof stress was 13.05 MPa, and the stress increase coefficient was 1.33, as shown in Figure 9a.
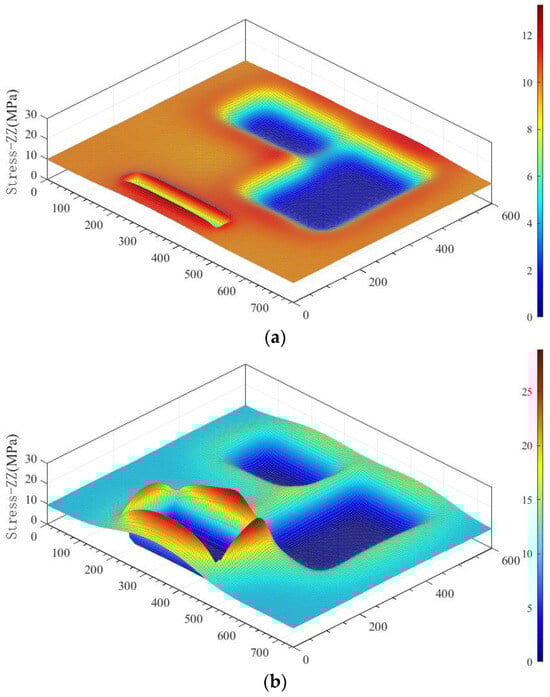
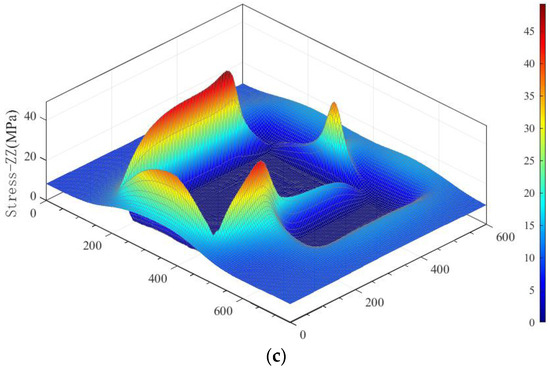
Figure 9.
Roof stress evolution law during lower seam mining: (a) advance distance from goaf of seam 2-2’s working face no.31203:20 m; (b) advance distance from goaf of seam 2-2’s working face no.31203:0 m; (c) advance distance from goaf of seam 2-2’s working face no.31201:0 m.
When the 31317 comprehensive mining face advanced to the 31203 goaf, the advanced stress was as high as 23.82 MPa, and the stress increase coefficient was 2.43, as shown in Figure 9b. When the 31317 working face advanced to the spatial overlap area of the 31203 goaf, the stress increased rapidly. However, due to the existence of thick and high-strength sandstone between the seams, the plastic zone expansion range was small.
When the 31317 comprehensive mining face continued to advance to the 31201 goaf, it was located directly below the section residual coal pillar. The advanced stress peak value was 37.80 MPa, and the stress increase coefficient was 3.8, as shown in Figure 9c. The influence range of residual coal pillar connects seam 3-1’s section of the coal pillar, and the high-stress concentration range expanded. The upper and lower seam coal pillars are always in a high-stress area. Under this state, coal pillars are prone to deformation and damage, inducing large-scale coal pillar instability. When entering a residual coal pillar, the sandstone interlayer supported its overlying rock layer to form a large high-stress area and caused serious damage to the coal body in front of the working face of seam 3-1. The residual coal pillar was affected by lower seam working face mining and rotated unstably with an interlayer basic roof, causing an impact load and transferring it to the lower seam. A suspended roof cut easily into a coal wall fracture, causing abnormal mine pressure from the lower seam working face recovery and resulting in a pressure frame accident.
During the lower working face mining process, when passing the overlying residual coal pillar area, the working face pressure increased significantly. Before the working face entered the coal pillar, the overlying residual coal pillar influence form was mainly static pressure; after the working face entered the coal pillar, the overlying residual coal pillar influence form was mainly dynamic pressure.
4. Analysis of Abnormal Pressure on the Mining Face Based on Cluster Analysis
4.1. Abnormal Pressure Clustering Algorithm Based on K-Means++
The working resistance data of the hydraulic support are the most intuitive quantitative feature that reflect the roof pressure on the mining face. The cluster analysis of unsupervised learning can divide the hydraulic support working condition feature data set that cannot be obtained with human observation into different classes or clusters. The data objects in the same cluster have similarity and can characterize the roof’s abnormal pressure with time and space features.
The k-means++ algorithm is an improved algorithm for the randomness of the initial centroid selection of k-means algorithm, which leads to a misclassification. When randomly selecting the k + 1 th cluster center, there is a higher probability of choosing data points that are farther away from the previous k cluster centers.
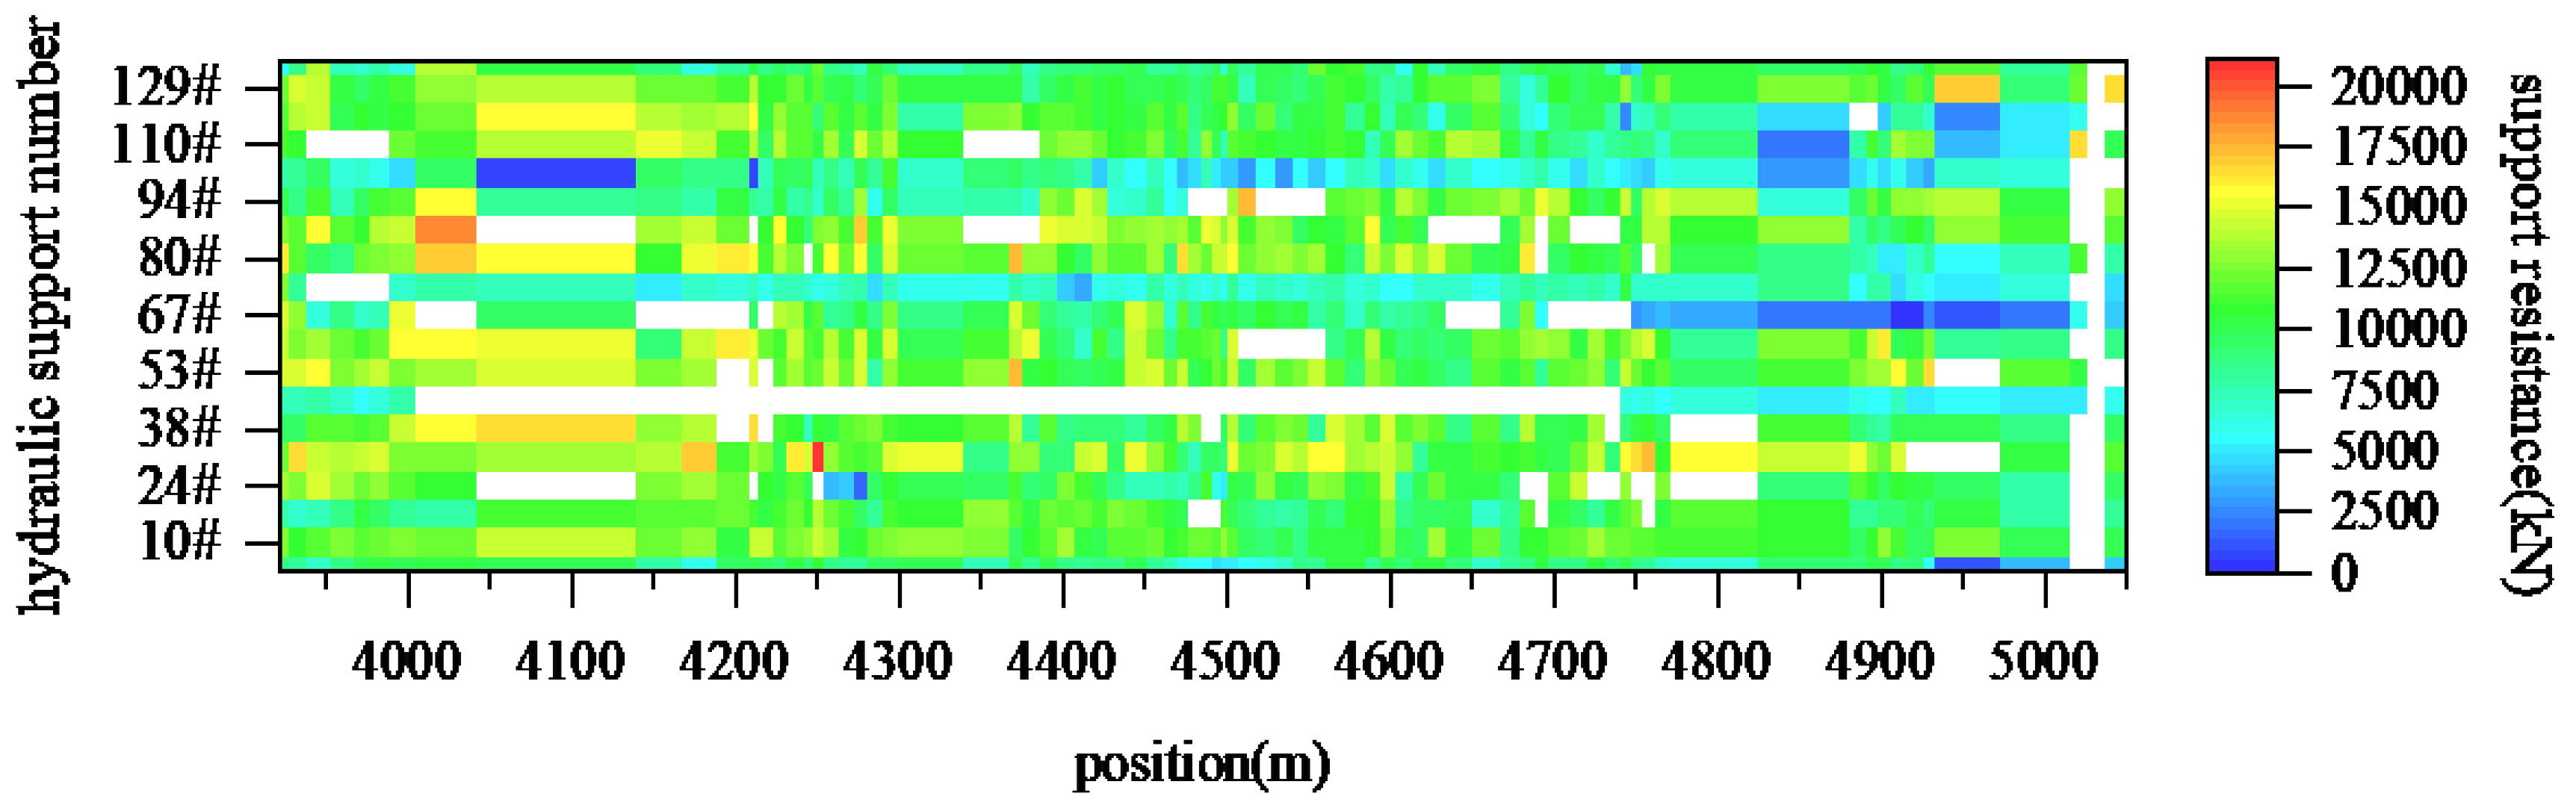
Considering the validity of the working face area data, for the hydraulic support average working resistance data with n samples, the working face full-area pressure grid unit with the hydraulic support number and mining advance as coordinates is used as the sample data set. Part of the data set is shown in Table 3. The 1483 working resistance data of the hydraulic support in the working face collected during mining are plotted in the cloud map, as shown in Figure 10.
Table 3.
Part of the 31317 working face area pressure sample data set.
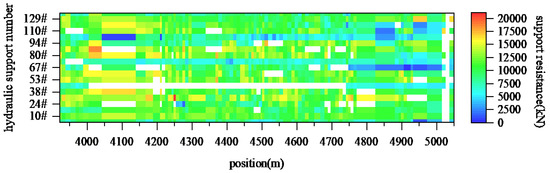
Figure 10.
Cloud map of hydraulic support original data.
Use the k-means++ algorithm to classify the types of pressure, as follows:
- (1)
- Randomly select one grid unit in the whole area of the working face with the bracket number and the backhaul footage as coordinates as the initial cluster center P1; first, calculate the Euclidean distance dij between each grid and the current existing cluster center, then calculate the probability of each grid being selected as the next cluster center; finally, select the next cluster center according to the roulette method; repeat the previous step until k cluster centers Pk are selected.
- (2)
- Taking k cluster centers as reference points, calculate the distance dij between the remaining samples and the previous k cluster centers one by one and use it as an indicator of similarity between them; assign the site to the data cluster where the reference point Pk with the smallest distance is located.
- (3)
- For each data cluster, recalculate its cluster center, and repeat steps (2) and (3) until the cluster center position no longer changes.
4.2. Optimal Clustering Number K Value Determination for Abnormal Pressure
In a k-means++ clustering analysis calculation, first, the clustering number k is provided; whether k value is correct will directly affect the clustering effect. According to empirical classification, the possible minimum value kmin and maximum value kmax of clustering number k can be estimated. The silhouette coefficient is a common indicator to evaluate the validity of clustering number selection, which measures the compactness and separation of data points when forming clusters. The value range of the silhouette coefficient is between −1 and 1. The closer the silhouette coefficient s(k) is to 1, the better the data points are connected with their own clusters and separated from other clusters significantly [25].
The abnormal pressure types of the 31317 comprehensive mining face in the Chahasu coal mine may include the following:
(1) Residual coal pillars in over-mining area
During the process of advancing the 31317 comprehensive mining face, it passed over the 31201 and 31203 comprehensive mining face mining areas successively. After passing over the 31203 comprehensive mining face mining area, it was affected by a 30 m residual section coal pillar, and periodic pressure caused changes, which directly manifested in a shortened periodic pressure step distance, increased periodic pressure duration step distance, and increased working resistance value of working face hydraulic support. Possible clustering clusters are the cutting eye of the over-mining area and residual coal pillar (two classes).
(2) Square breaking
Every time the comprehensive mining face pushes to a square position (the advancing length is equal to the length of this working face) ±50 m, the mine pressure shows stronger on the working face, and there are bottom cracks, roof breaking, and coal wall flaking on the working face. The 31317 comprehensive mining face pushed to the 31315 mining area square position affected by the 31315 mining area lateral hanging roof. The square position of this working face overlaps with that of the upper section working face mining area as a “double square” influence area, and the mine pressure is more intense. Possible clustering clusters are in the square position of this working face, square position of upper section working face mining area, and double square position (three classes).
(3) Passing through strip fracture zone
During the backhaul process of the 31201 comprehensive mining face, the strip fracture zone was exposed, which penetrated through the 31201 and 31317 interlayer layers and affected the range from the 31317 comprehensive mining face cutting eye, 3264–4314 m. The possible clustering cluster involves passing through the strip fracture zone (one class).
In addition to the above-mentioned clustering clusters, there are two classes of future pressure and periodic pressure. The optimal clustering number k can only take positive integers. Therefore, the k value may vary in [2,8]. Each k value in variation range is taken to calculate the corresponding clustering validity evaluation function s(k); for the calculation results, see Table 4.
Table 4.
Silhouette coefficient s(k).
When k = 6, s(k) takes the value 0.74391, closest to 1, so the optimal clustering number for 31317 comprehensive mining face pressure is 6.
4.3. Pressure Analysis of Backhaul Working Face Based on K-Means++ Clustering Algorithm
The footage position of the single bracket hydraulic support is taken as feature 1 and the working resistance value as feature 2; the clustering number is six for the clustering analysis pressure type. On the basis of separately clustering the analysis each hydraulic support, it is integrated to form the whole area clustering analysis result of the working face. For the single bracket hydraulic support clustering result, see Figure 11.
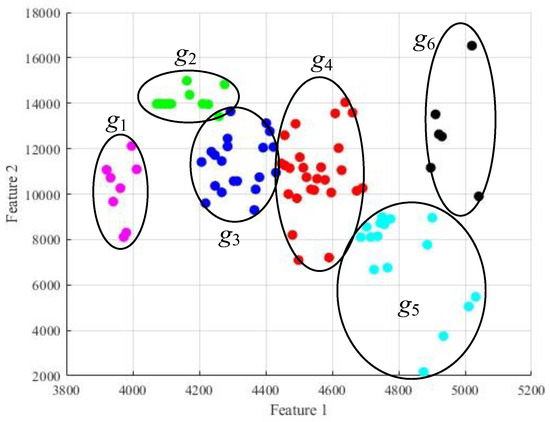
Figure 11.
Clustering result of #110 hydraulic support.
From the clustering result, it can be seen macroscopically that classification clusters have obvious periodicity, and the width of each class period maps onto the horizontal coordinate axis length at about 200 m, indicating that a high-level key layer fracture forms large pressure; the fracture distance is 200 m. Referring to the mining engineering plan, g1 is located in the strip fracture zone, and the g2 position is about to enter the residual coal pillar.
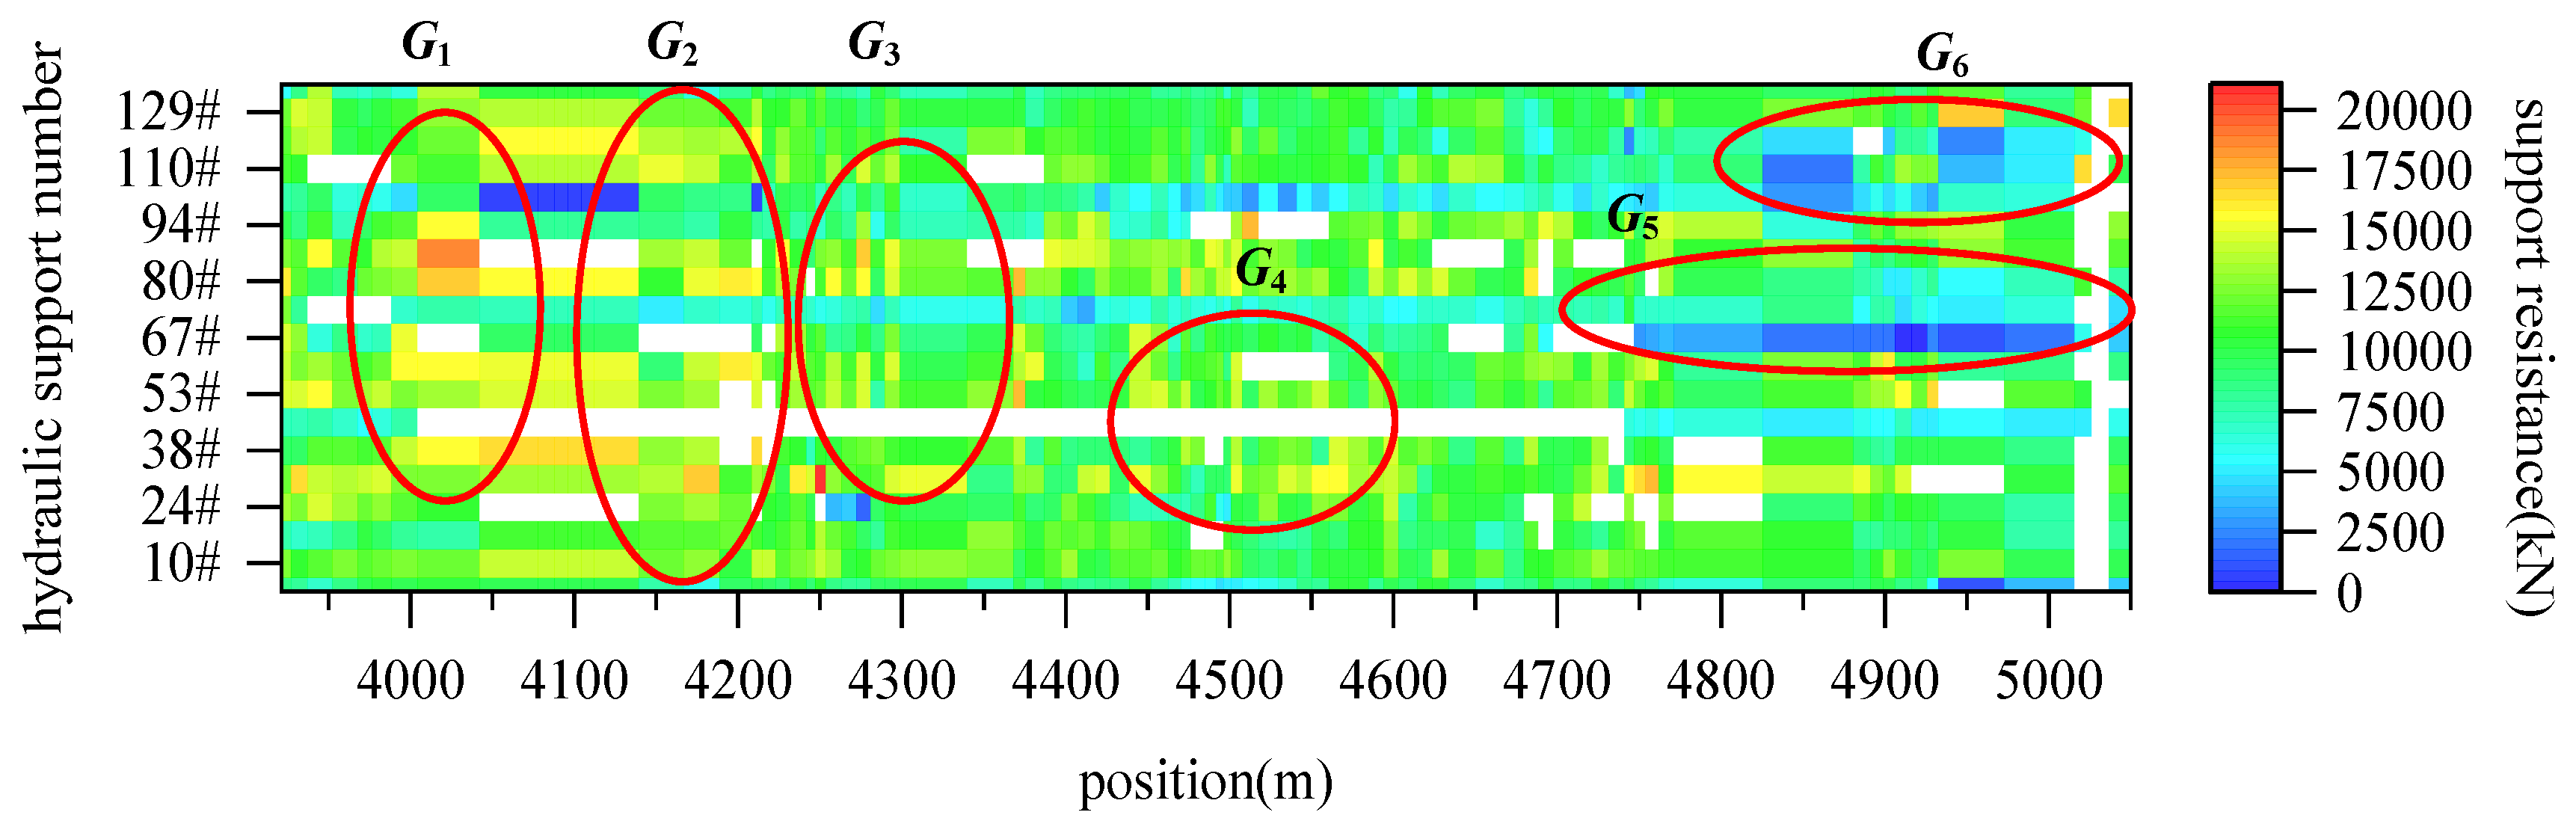
To integrate the clustering analysis result of all hydraulic supports of backhaul working face, the analysis of the whole area clustering of the backhaul working face is unified; the clustering result is shown in Figure 12. From the figure, it can be seen macroscopically that the working face pressure area shows periodic aggregation distribution characteristics; six aggregation areas, G1 to G6, appeared. The aggregation area shape is elliptical.

Figure 12.
Clustering analysis of 31317 comprehensive mining face pressure.
According to geological report of the Chahasu coal mine, the 31317 comprehensive mining face exposed the strip fracture zone when advancing 3921.4–4392.4 m. The length of the 31317 comprehensive mining face is 285 m, and the square position of this working face is 3990 m, 4275 m, 4560 m, 4845 m, 5130 m. The square position of the upper section working face is 3765 m, 4050 m, 4335 m, 4620 m, 4905 m.
According to the clustering result analysis working face pressure characteristics, the clustering area G1 footage is 3821.4–4011.8 m, the middle hydraulic support working resistance is mostly more than 13,000 kN, the G1 area is due to strip fracture zone, the position of this working face is square, and the high-level basic roof fracture superposition caused abnormal pressure display. The G2 area is located at 4027.0–4274.2 m, and the middle hydraulic support working resistance is up to 15,000 kN; in addition, it is affected by the strip fracture zone and high-level basic roof fracture. The advancing position is under the residual coal pillar and in a period of entering the residual coal pillar, causing the hydraulic support working resistance to rise sharply. The G3 area was only affected by the strip fracture zone and high-level basic roof fracture, the abnormal pressure value was relatively reduced, and the middle hydraulic support working resistance part was more than 13,000 kN. The G4 area was only affected by the square position of this working face, and the middle hydraulic support part was more than 13,000 kN. The G5 and G6 areas are classification clusters obtained by calculating data outlier classification, the data abnormal reason is the hydraulic support emulsion pipeline leakage, and the support resistance was reduced. The calculation results show that the clustering characteristics conform to the actual production situation.
5. Modeling and Analysis of Abnormal Pressure Prediction on Mining Face Based on Hydraulic Support Working Condition Data
5.1. Bilinear Interpolation of Mining Pressure Data Set
Due to the performance defects of the mining pressure monitoring equipment and the influence of the harsh underground environment, there are often situations where the corresponding data are not collected due to the failure of the monitoring equipment or the transmission line, which causes the loss of mining pressure monitoring data. The blank area in Figure 12 is the missing data area. If the missing data are not interpolated, it will directly affect the accuracy of the mining pressure prediction results or even cause errors in the mining pressure prediction results. Therefore, before predicting the mining pressure data, it is necessary to interpolate the missing mining pressure data [26].
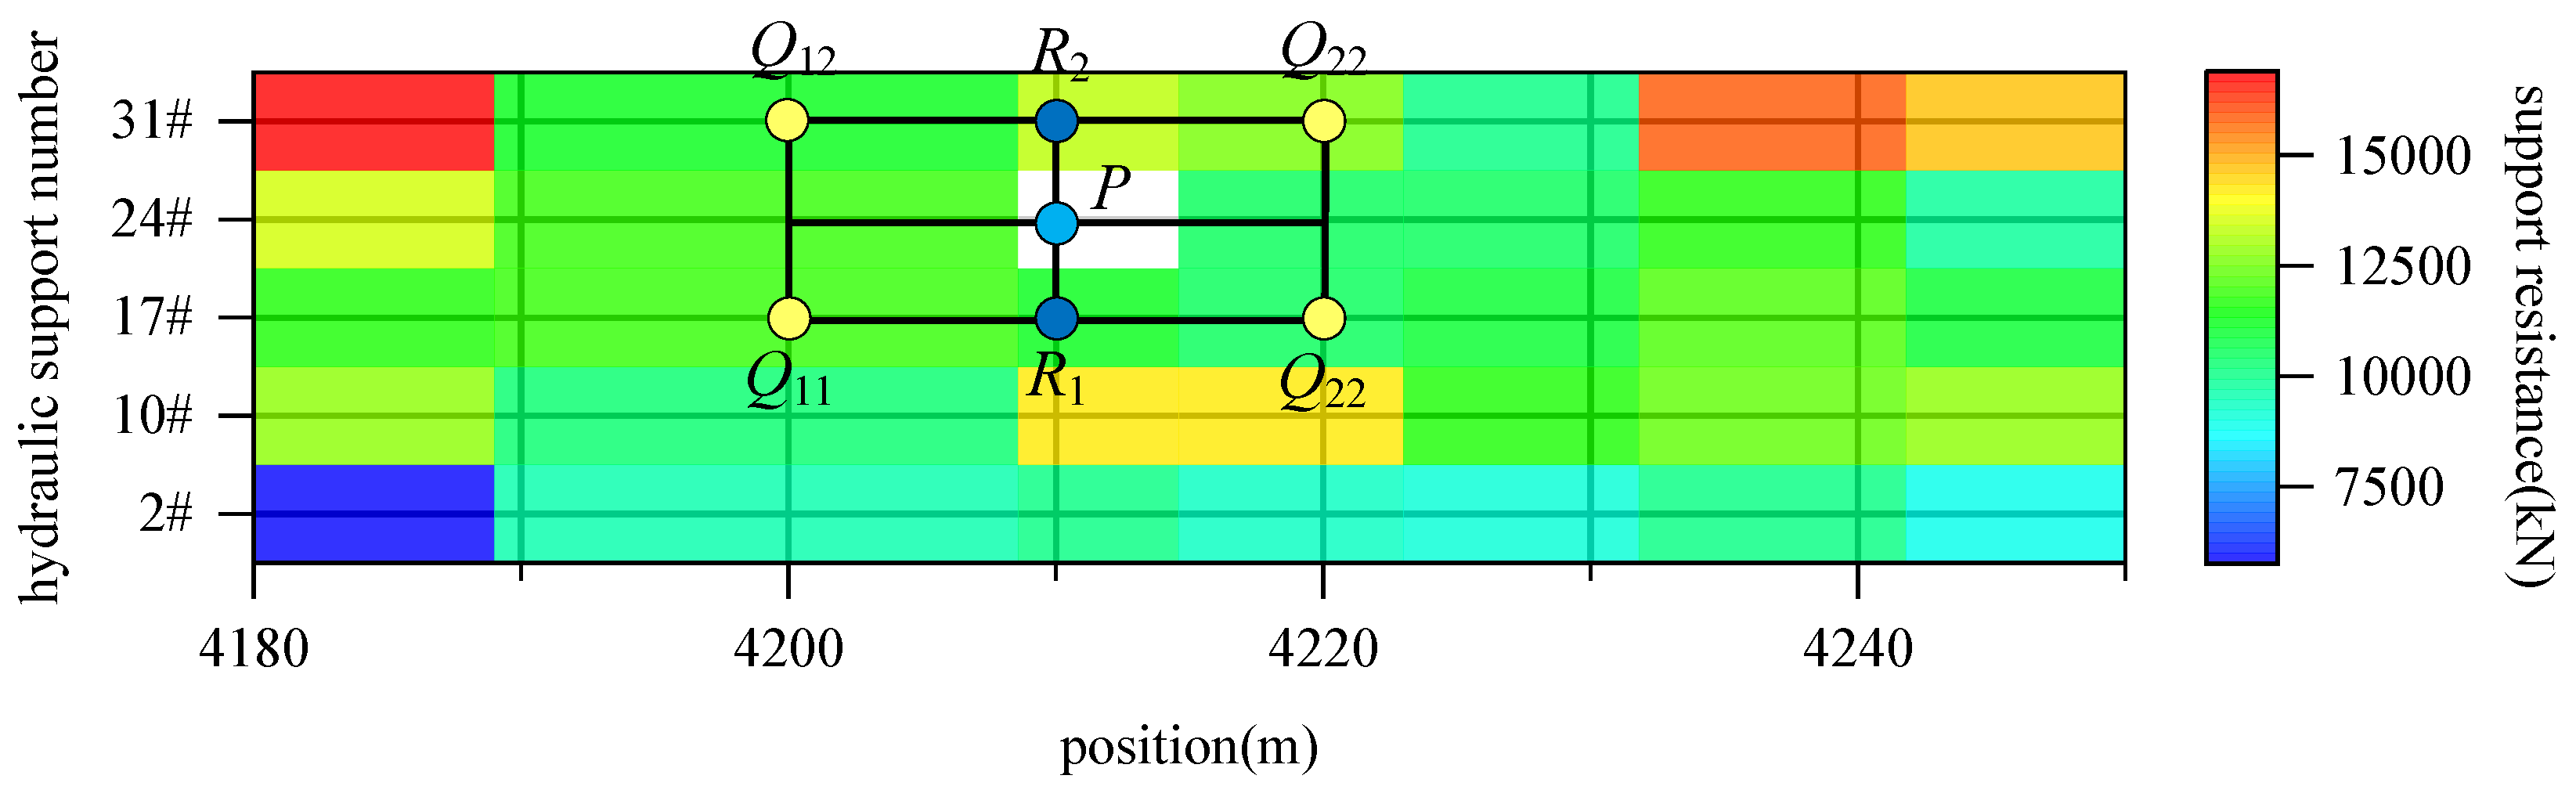
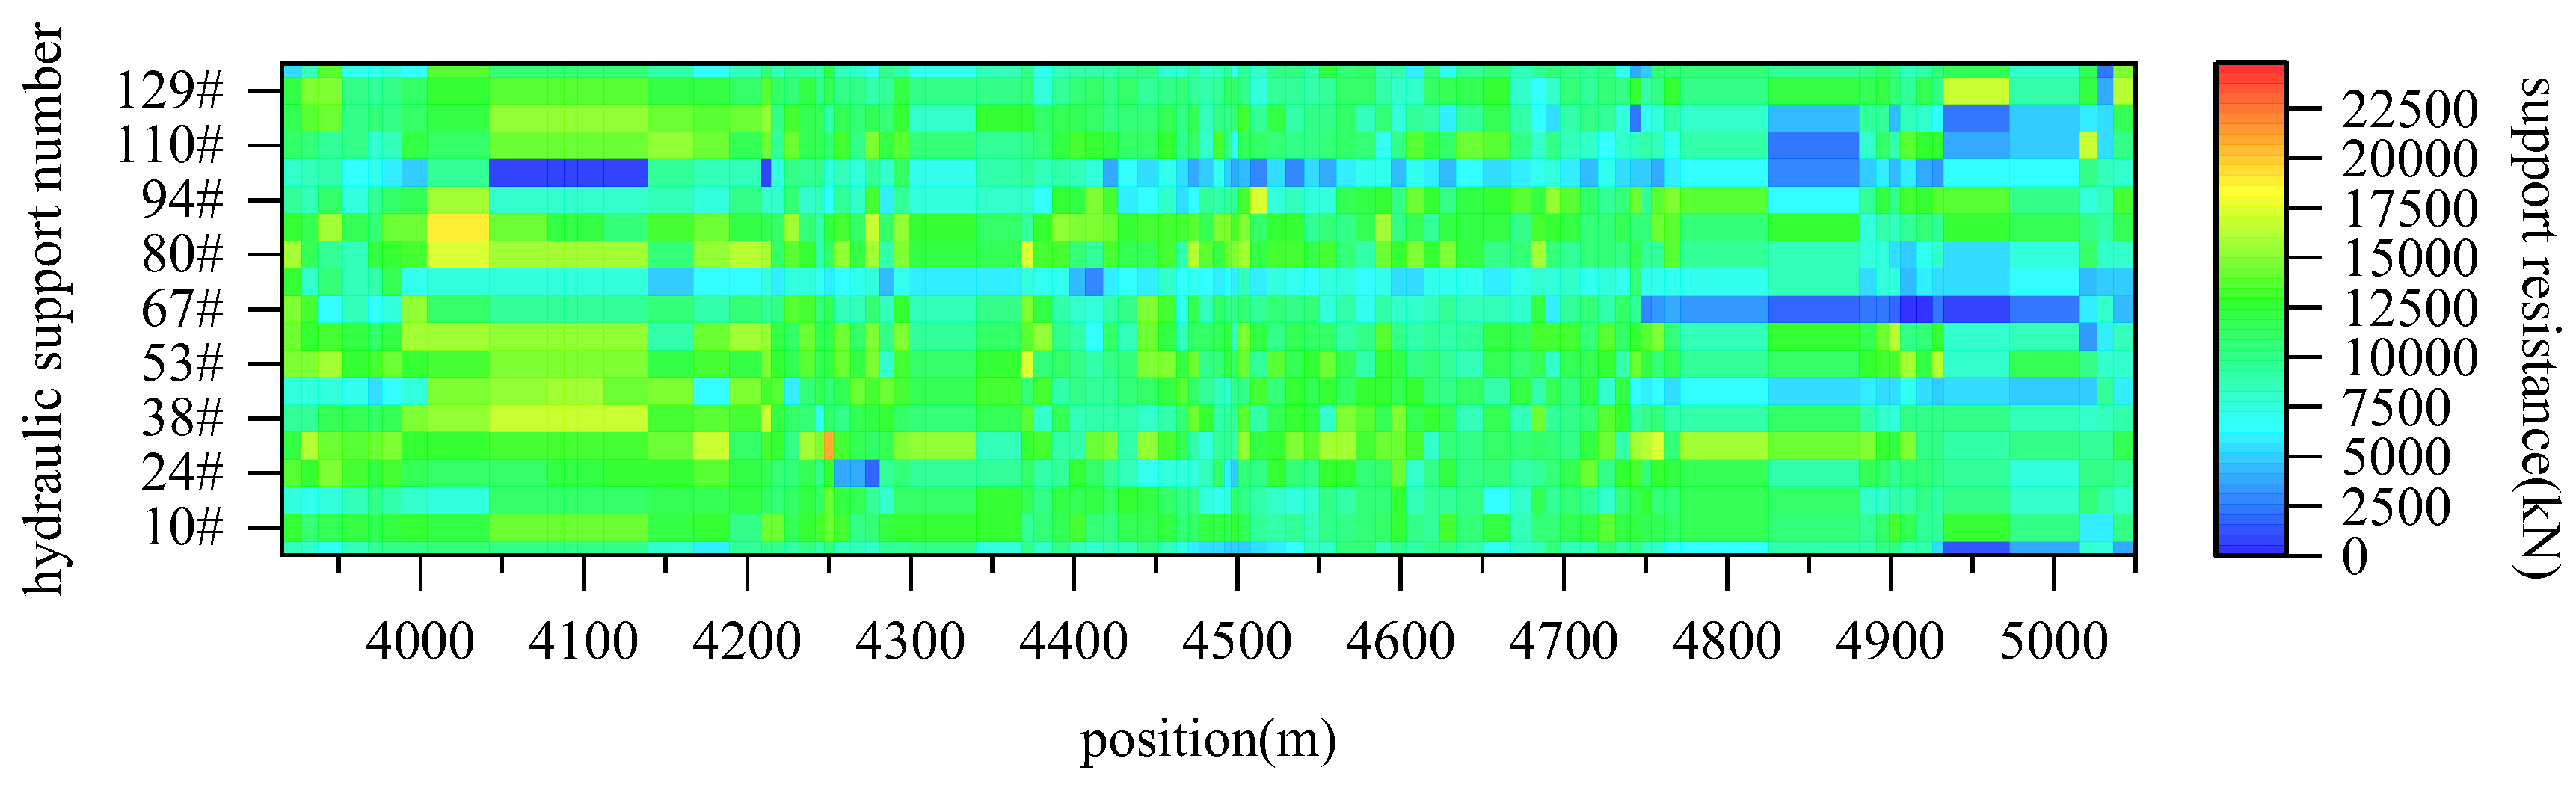
A bilinear interpolation is a combination of linear interpolation in two directions. The working face full-area pressure function P(x,y) has known function values at Q11 = (x1,y1), Q12 = (x1,y2), Q21 = (x2,y1) and Q22 = (x2,y2), performs linear interpolation twice in the x-axis direction to obtain R1 = (x,y1) and R2 = (x,y2), and performs a linear interpolation once in the y-axis direction to obtain P(x,y). Due to the special nature of edge line data, P(x,y) is used to replace Qij = (xi,yj) for the calculation. The principle of the bilinear interpolation of the mining pressure data is shown in Figure 13. After bilinear interpolation preprocessing, there are 1672 data points. The pressure of the whole area of the working face after the interpolation is shown in Figure 14.
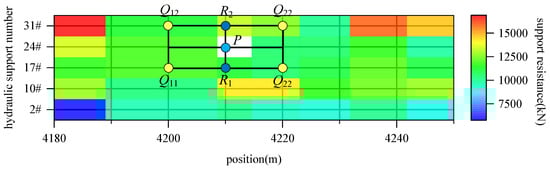
Figure 13.
Principle of bilinear interpolation of mining pressure data.
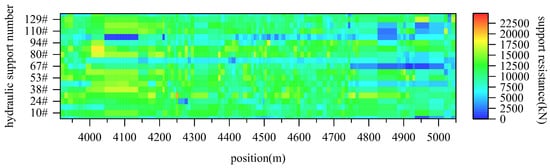
Figure 14.
Cloud map of working face full-area pressure after bilinear interpolation.
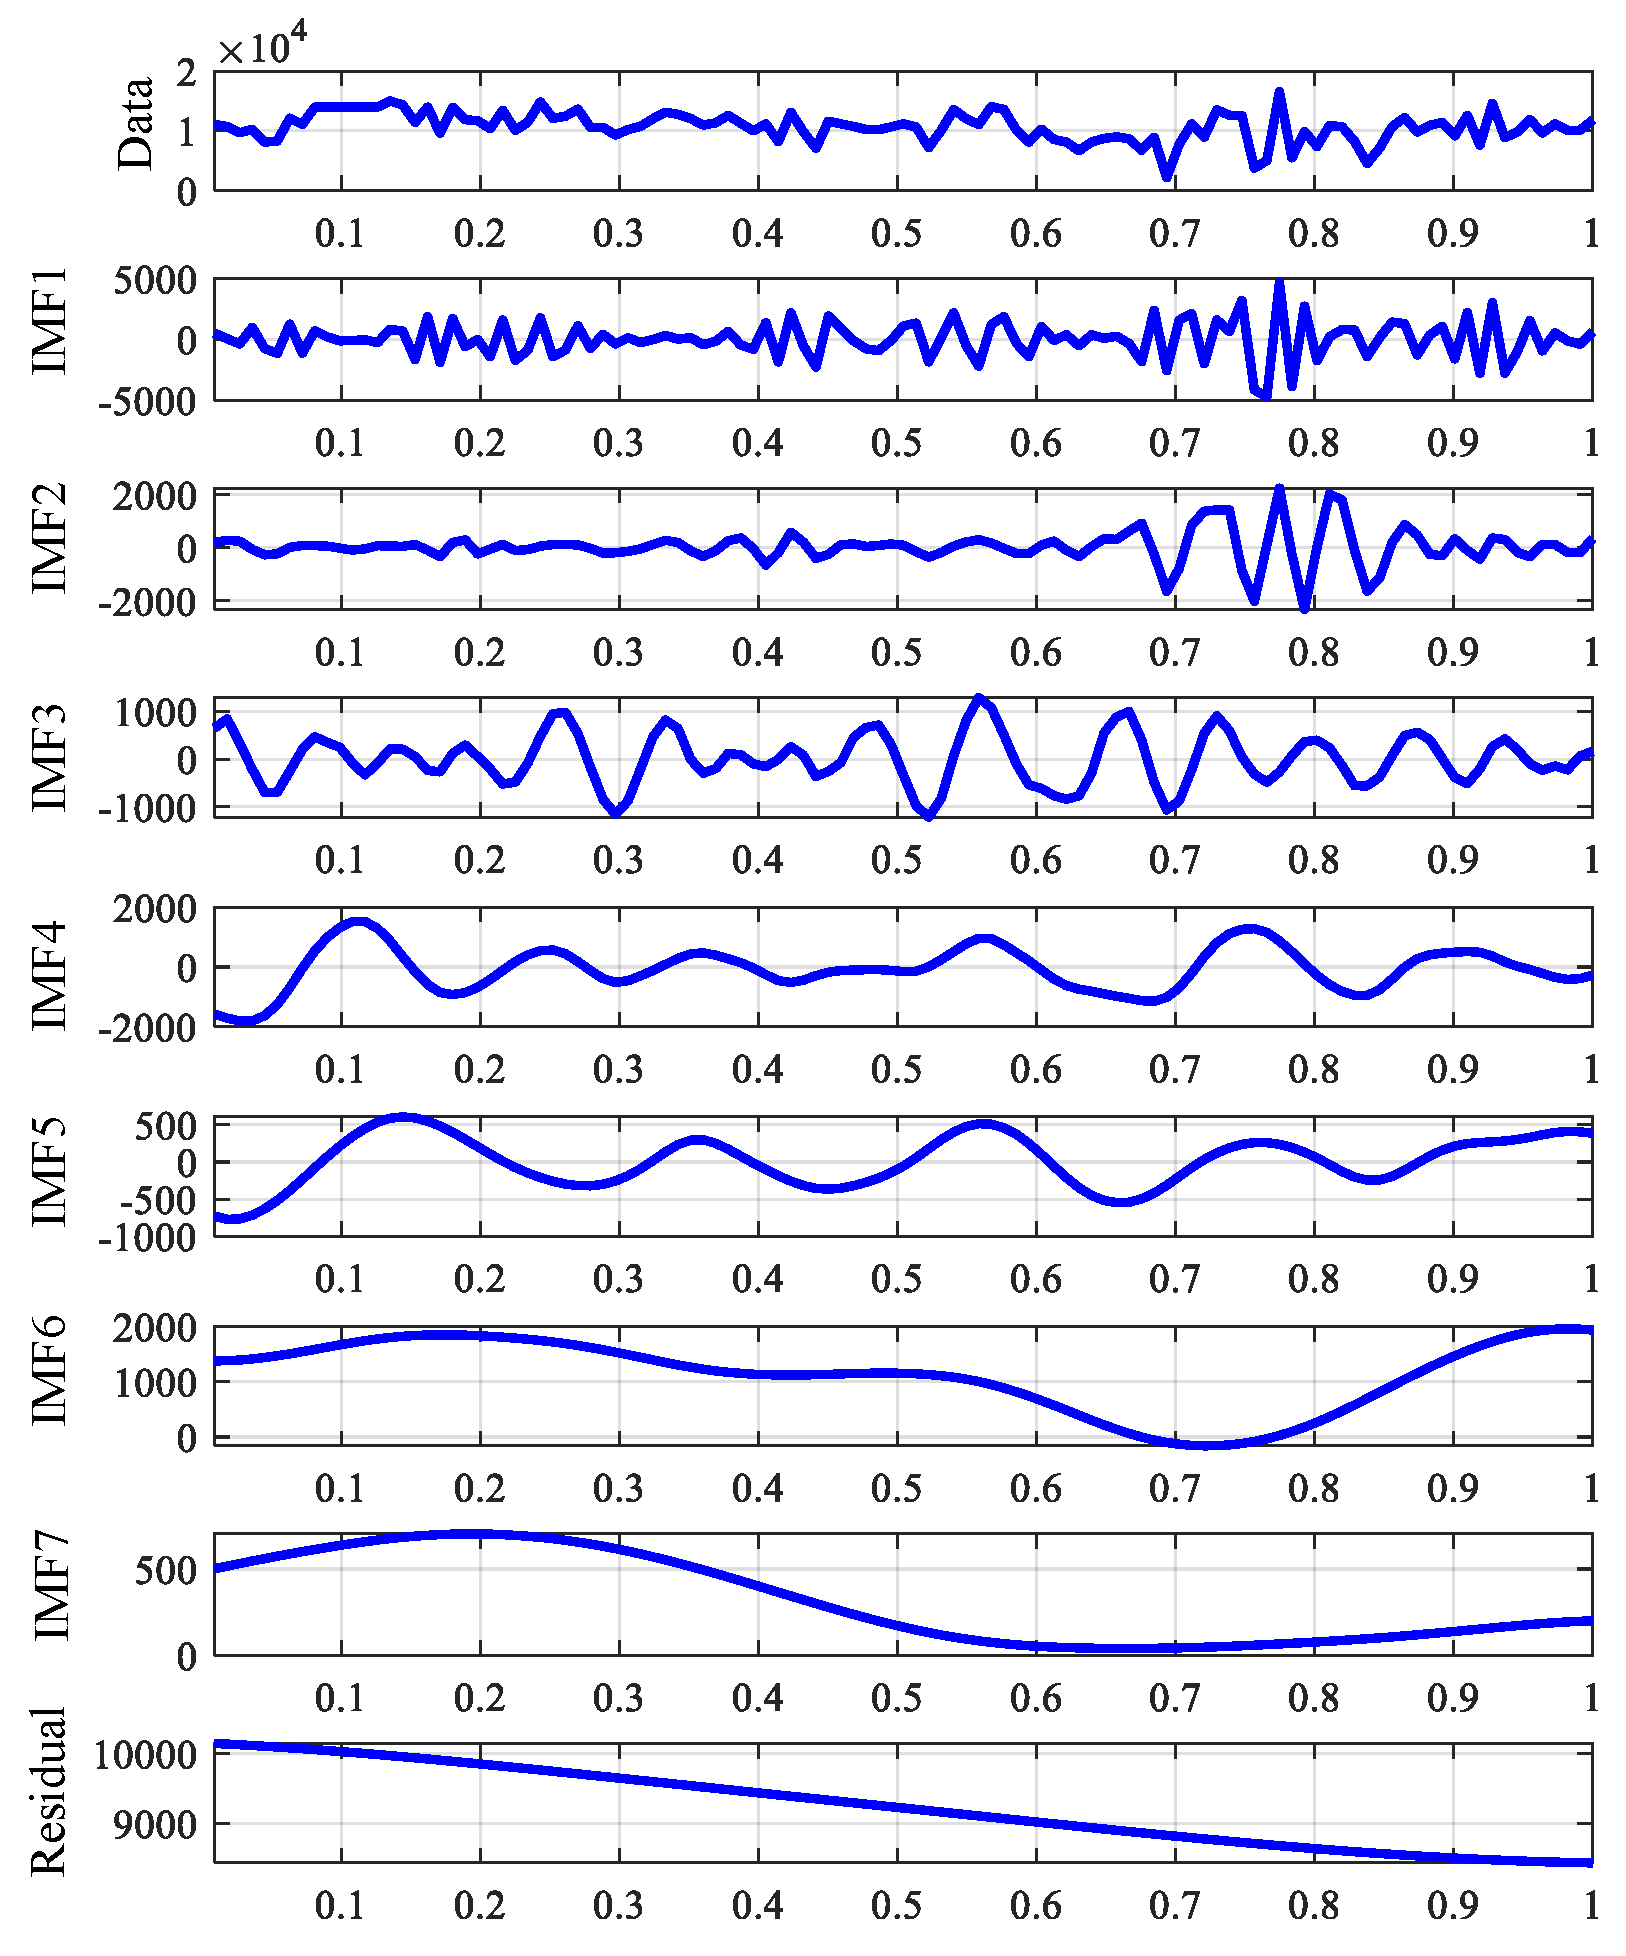
5.2. CEEMDAN Decomposition Denoising of Mining Pressure Time Series
The bilinear interpolated mining face pressure has an obvious time–space uniformity, and the working resistance of the hydraulic support also has time sequence characteristics. Observing the working resistance characteristics of hydraulic support during 31317 comprehensive mining face advance process, MPTS (Mining Pressure Time Series) arranged in time order is non-stationary and has strong nonlinearity and volatility, and the prediction difficulty is large.
The CEEMDAN adaptive noise complete ensemble empirical mode decomposition can realize the decomposition of the intrinsic mode function and residual signal of working resistance and solve the problem of the nonlinearity and strong fluctuation of hydraulic support working resistance data. The steps of the CEEMDAN algorithm are as follows:
- (1)
- Add white noise to MPTSP(t) and decompose it to obtain the first intrinsic mode function IMF component c1 and residual r1.
- (2)
- Add white noise to the residual r1 and decompose it to obtain the second intrinsic mode function IMF component c2 and residual r2.
- (3)
- Repeat step (2) until the kth residue can no longer be decomposed.
After the CEEMDAN algorithm decomposition, denoising MPTS did not discard the IMF component containing valid information but discarded more noise; the denoised IMFc7 component tends to be stable, as shown in Figure 15.
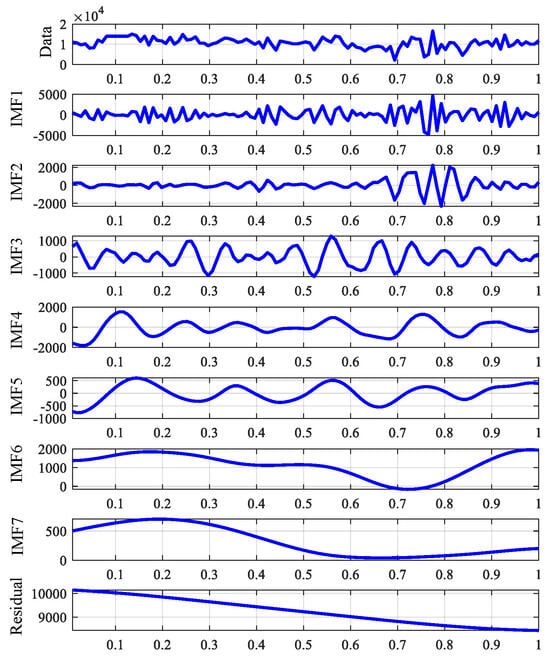
Figure 15.
CEEMDAN decomposition of each IMF component.
5.3. Mining Face Pressure Prediction Based on Transformer Algorithm with Multi-Head Attention Mechanism
The deep learning model Transformer, based on a self-attention mechanism, has a strong modeling ability for time series data and has good applications in the natural language processing field, including machine translation, text summarization, question answering system, etc. [27]. When using the Transformer algorithm to predict hydraulic support working resistance data on the mining face, the steps are as follows:
- (1)
- Import each IMF component with time sequence characteristics after CEEMDAN algorithm decomposition denoising, realize a sequence-to-sequence prediction of each component sequence through a multi-head attention mechanism, feedforward network, and linear calculation.
- (2)
- Accumulate and synthesize multiple predicted IMF component sequences to obtain hydraulic support working resistance prediction results.
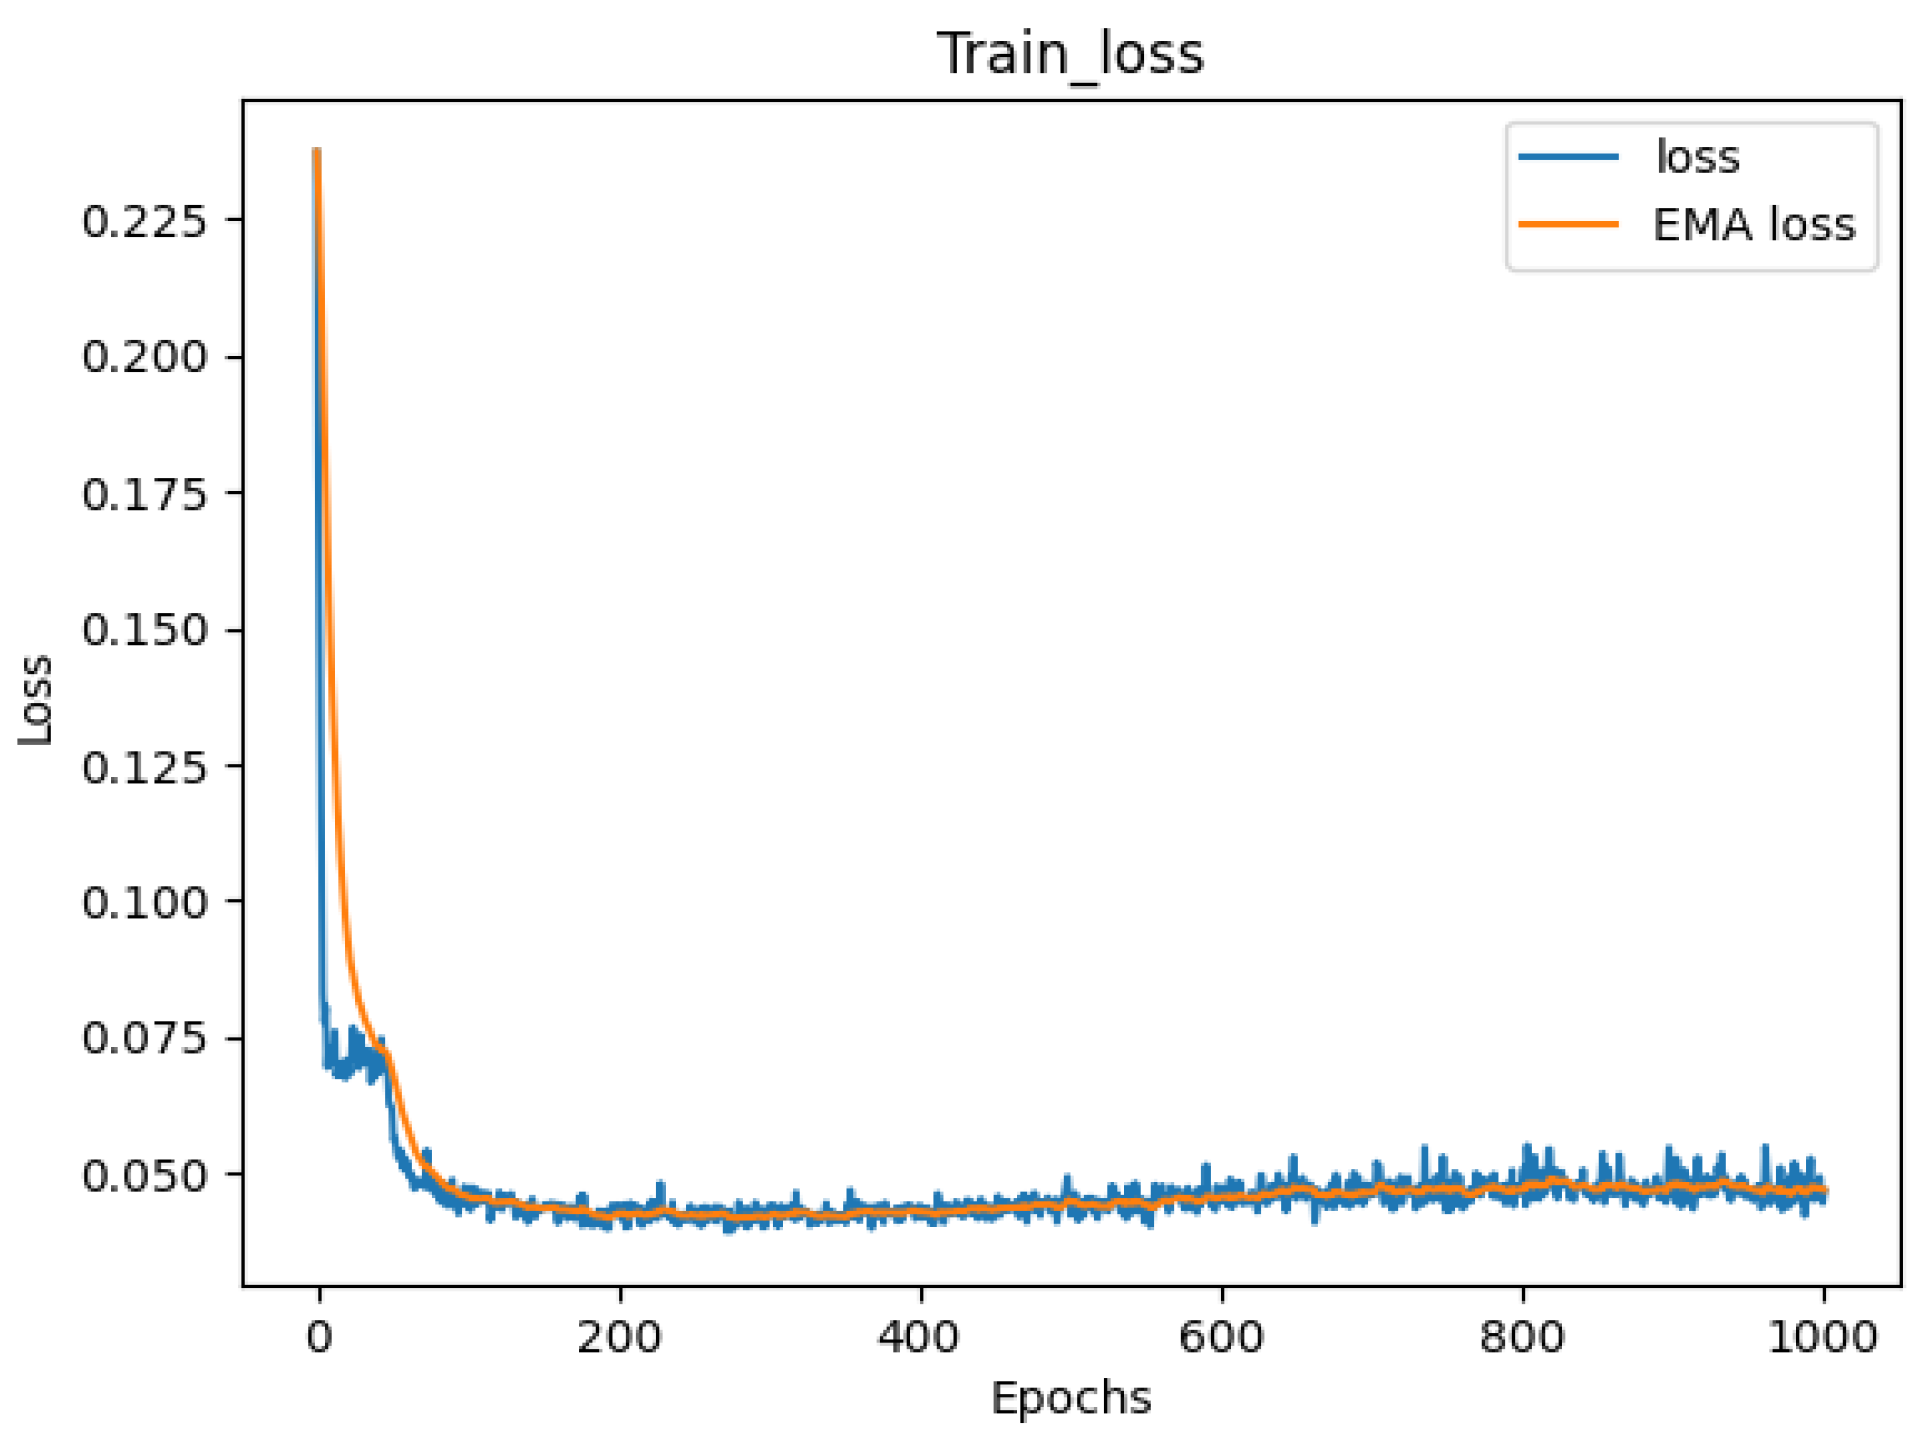
As can be seen from Figure 16, the sliding average loss value (EMA loss) shows a monotonic decreasing trend, and the loss value is reduced to 0.049 after 61 rounds of complete training. The working resistance curves of hydraulic supports 53#, 80#, 110#, and 129# in the 31317 comprehensive mining face are predicted as shown in Figure 17.
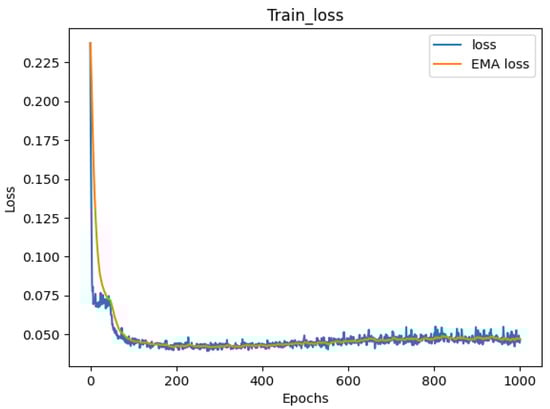
Figure 16.
Prediction model loss-iteration curve.
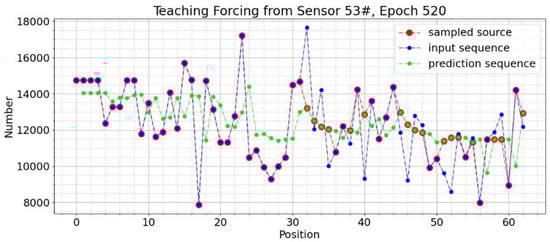
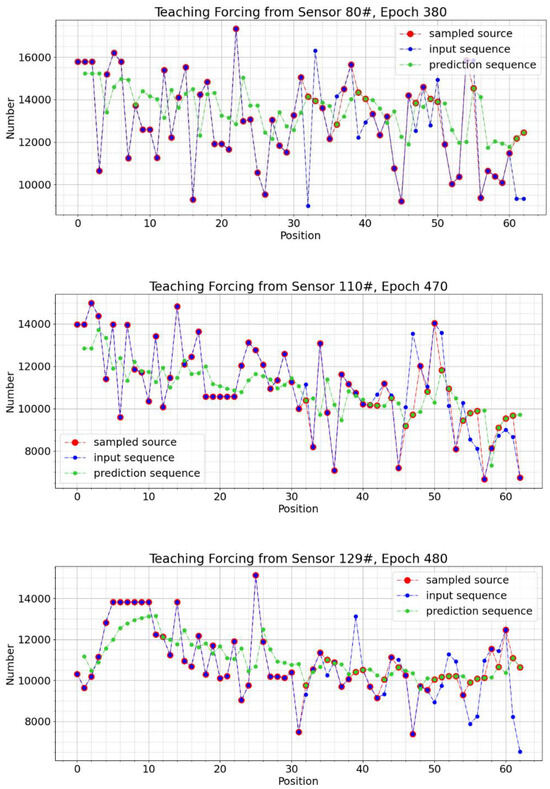
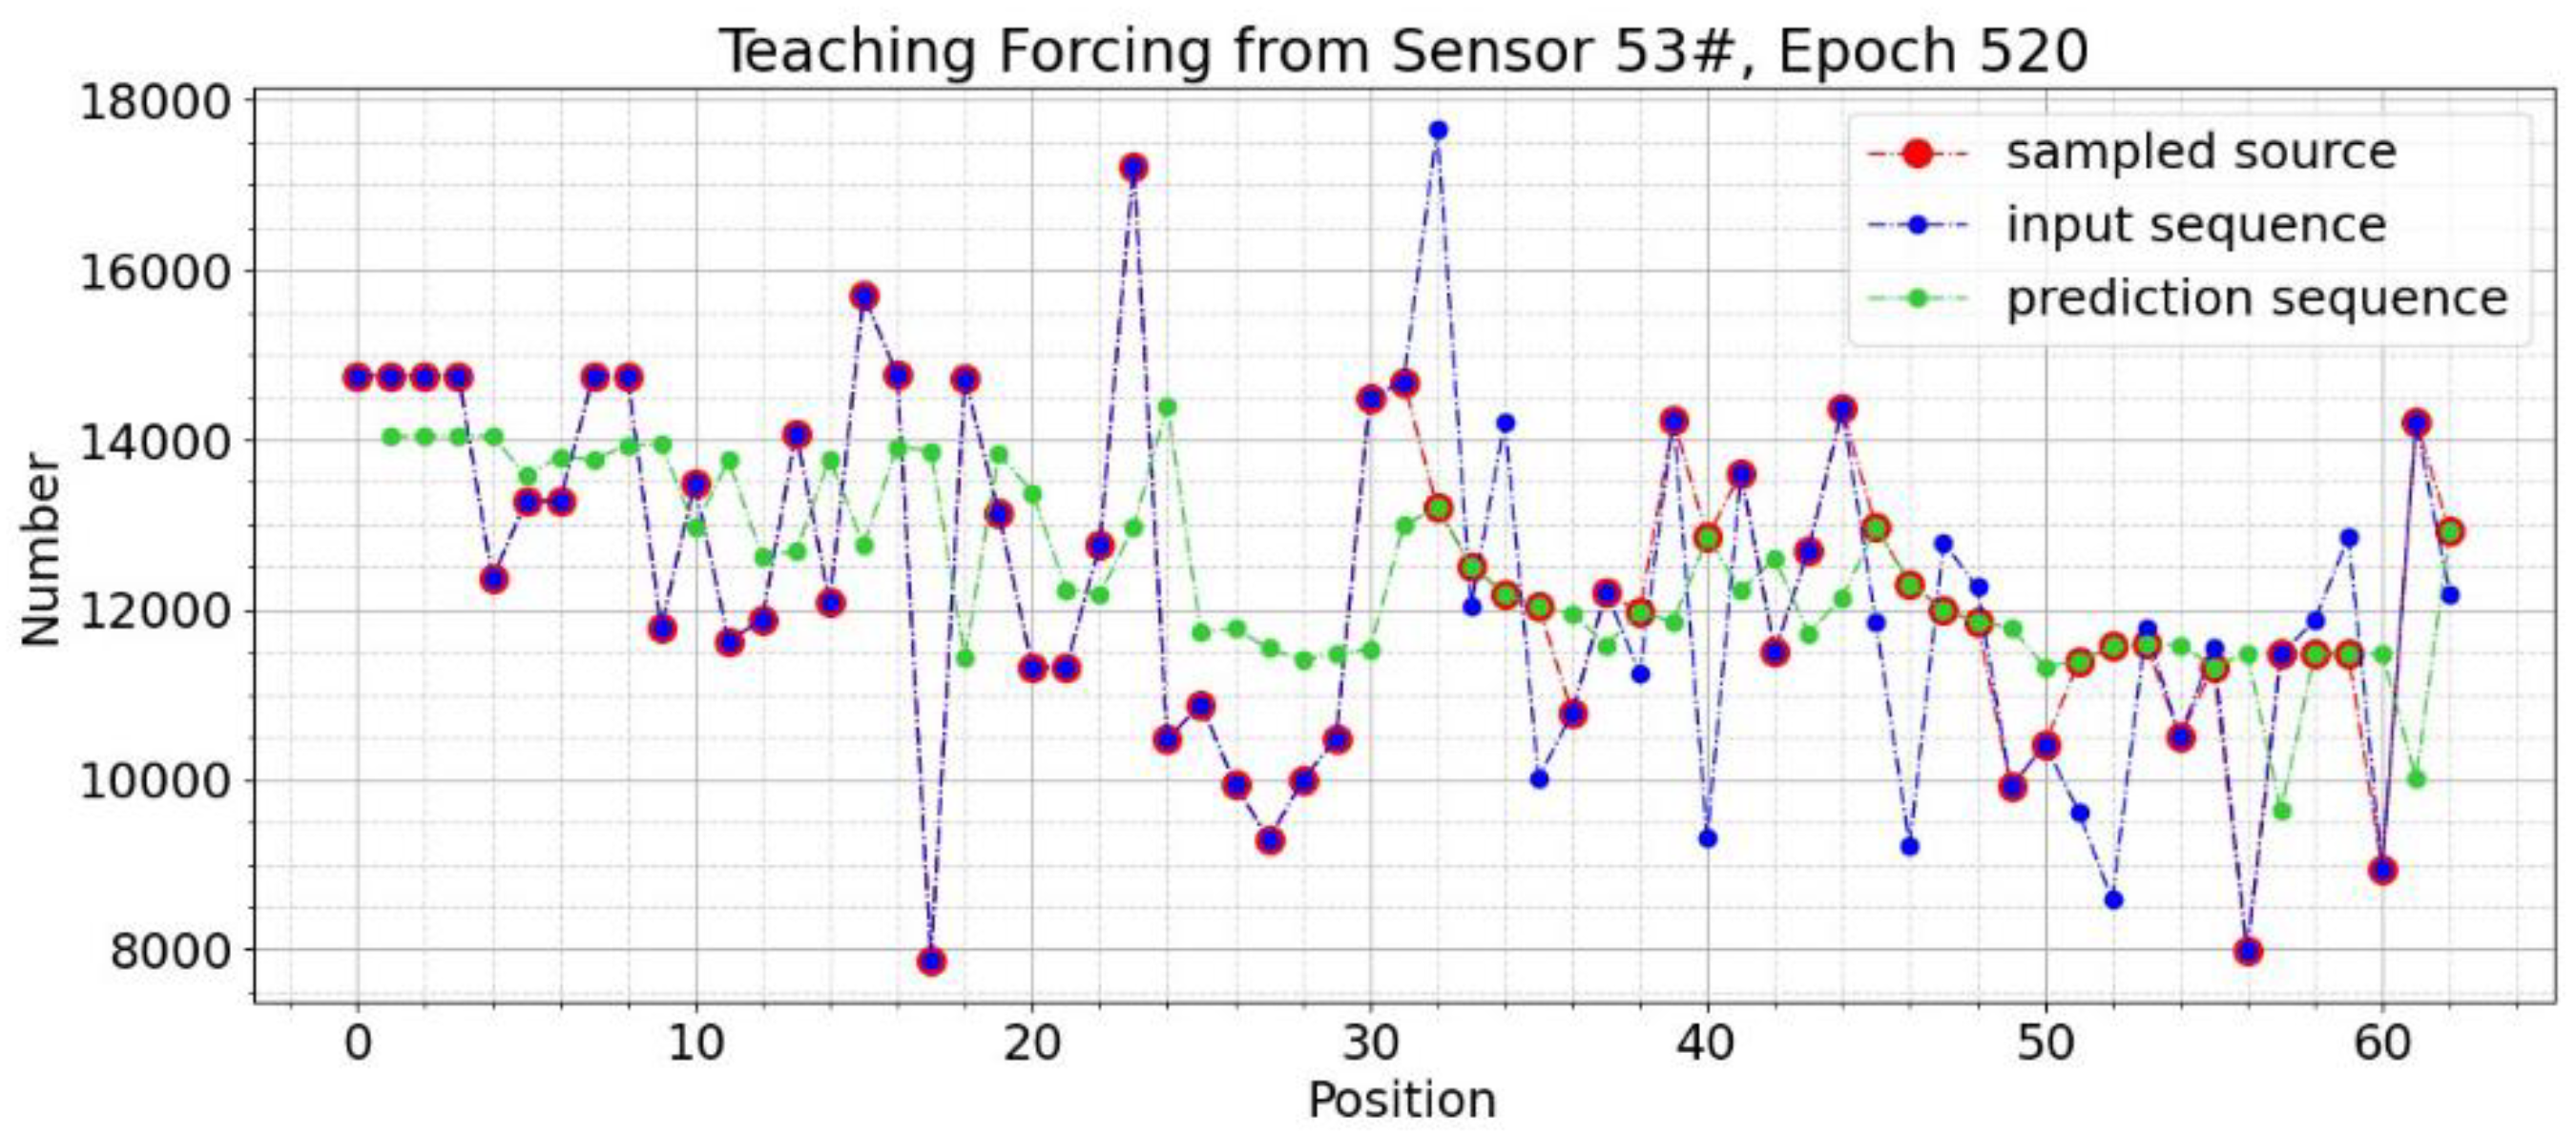
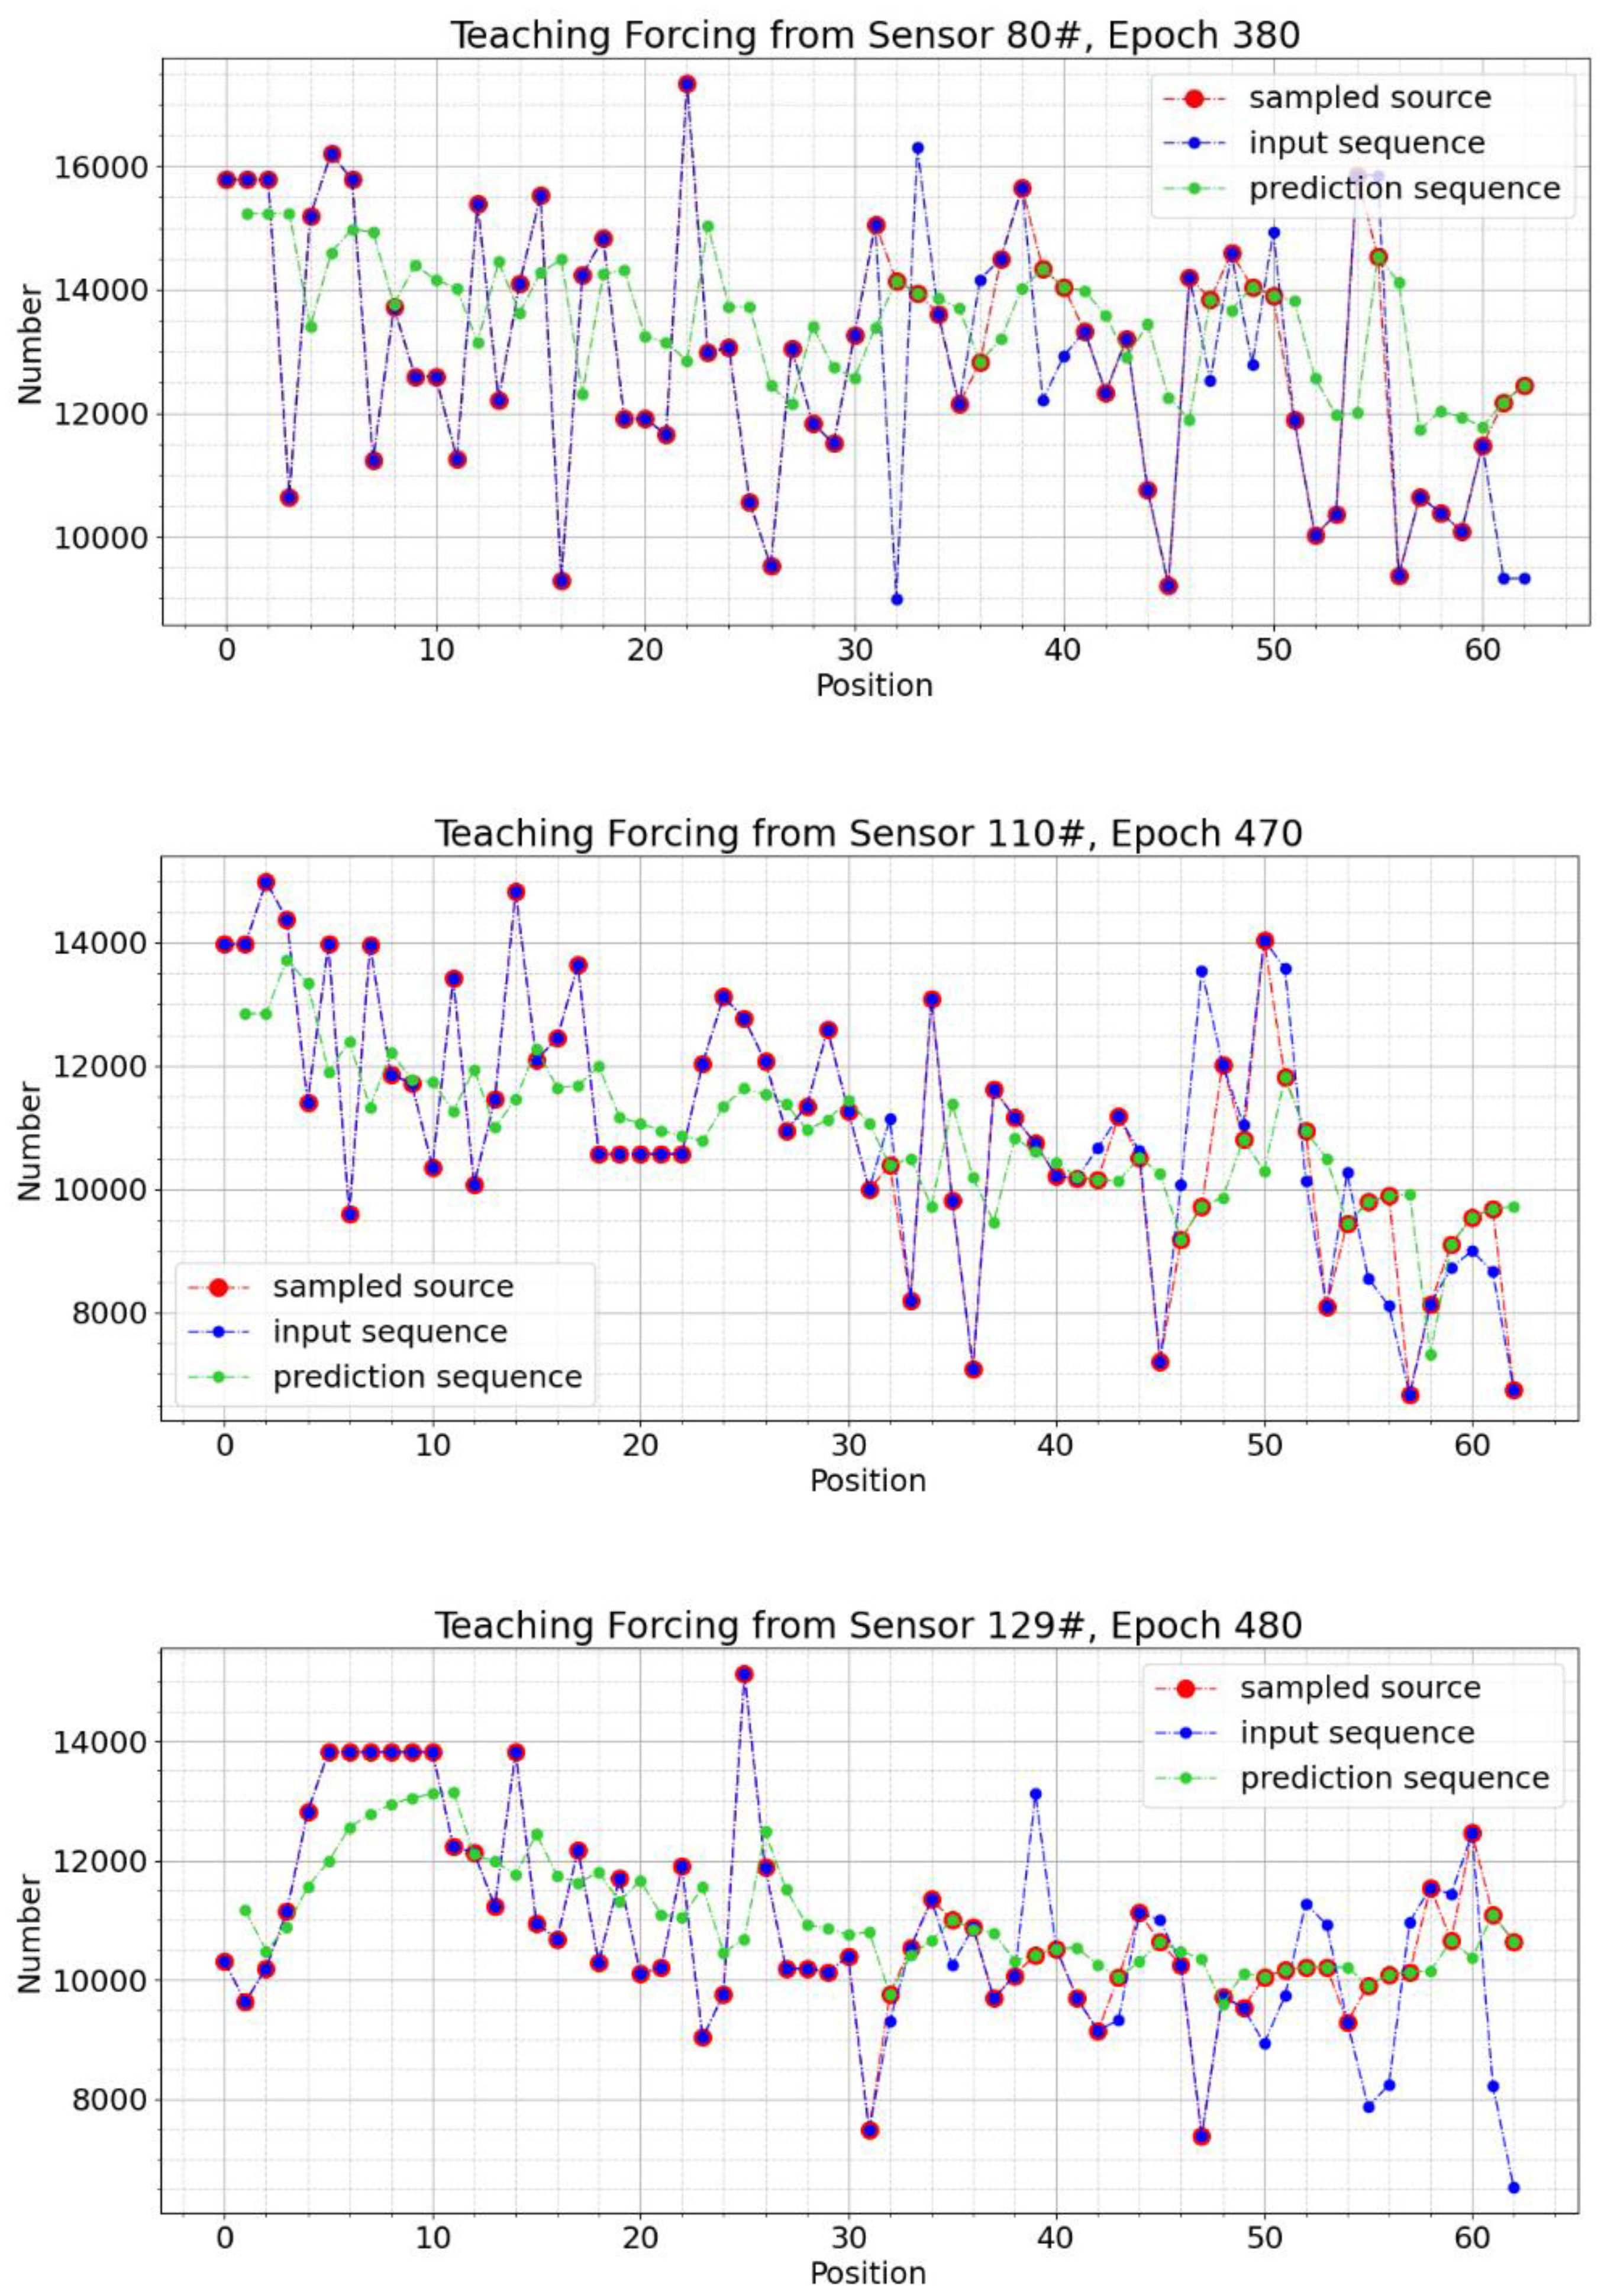
Figure 17.
Prediction output result of single hydraulic support advance measurement line.
MAE is a common evaluation metric for hydraulic support working resistance predictions, which can accurately reflect the difference between the MPTS predicted value and the actual value, that is, the accuracy of the prediction. The specific calculation method is shown in Formula (15).
In the formula, N is the sample number, and yi is the actual value of the sample number. represents the predicted value of the i-th sample.
By calculating the average MAE of all samples in the test set, the overall performance of the prediction results is evaluated, as shown in Table 5. The results show that, in the four experimental groups with a prediction sequence length of 23, the MAE values are all lower than 2000 kN, and the prediction results are accurate.
Table 5.
Test set MAE value.
5.4. Abnormal Pressure Clustering Reconstruction Based on Hydraulic Support Working Condition Data Prediction
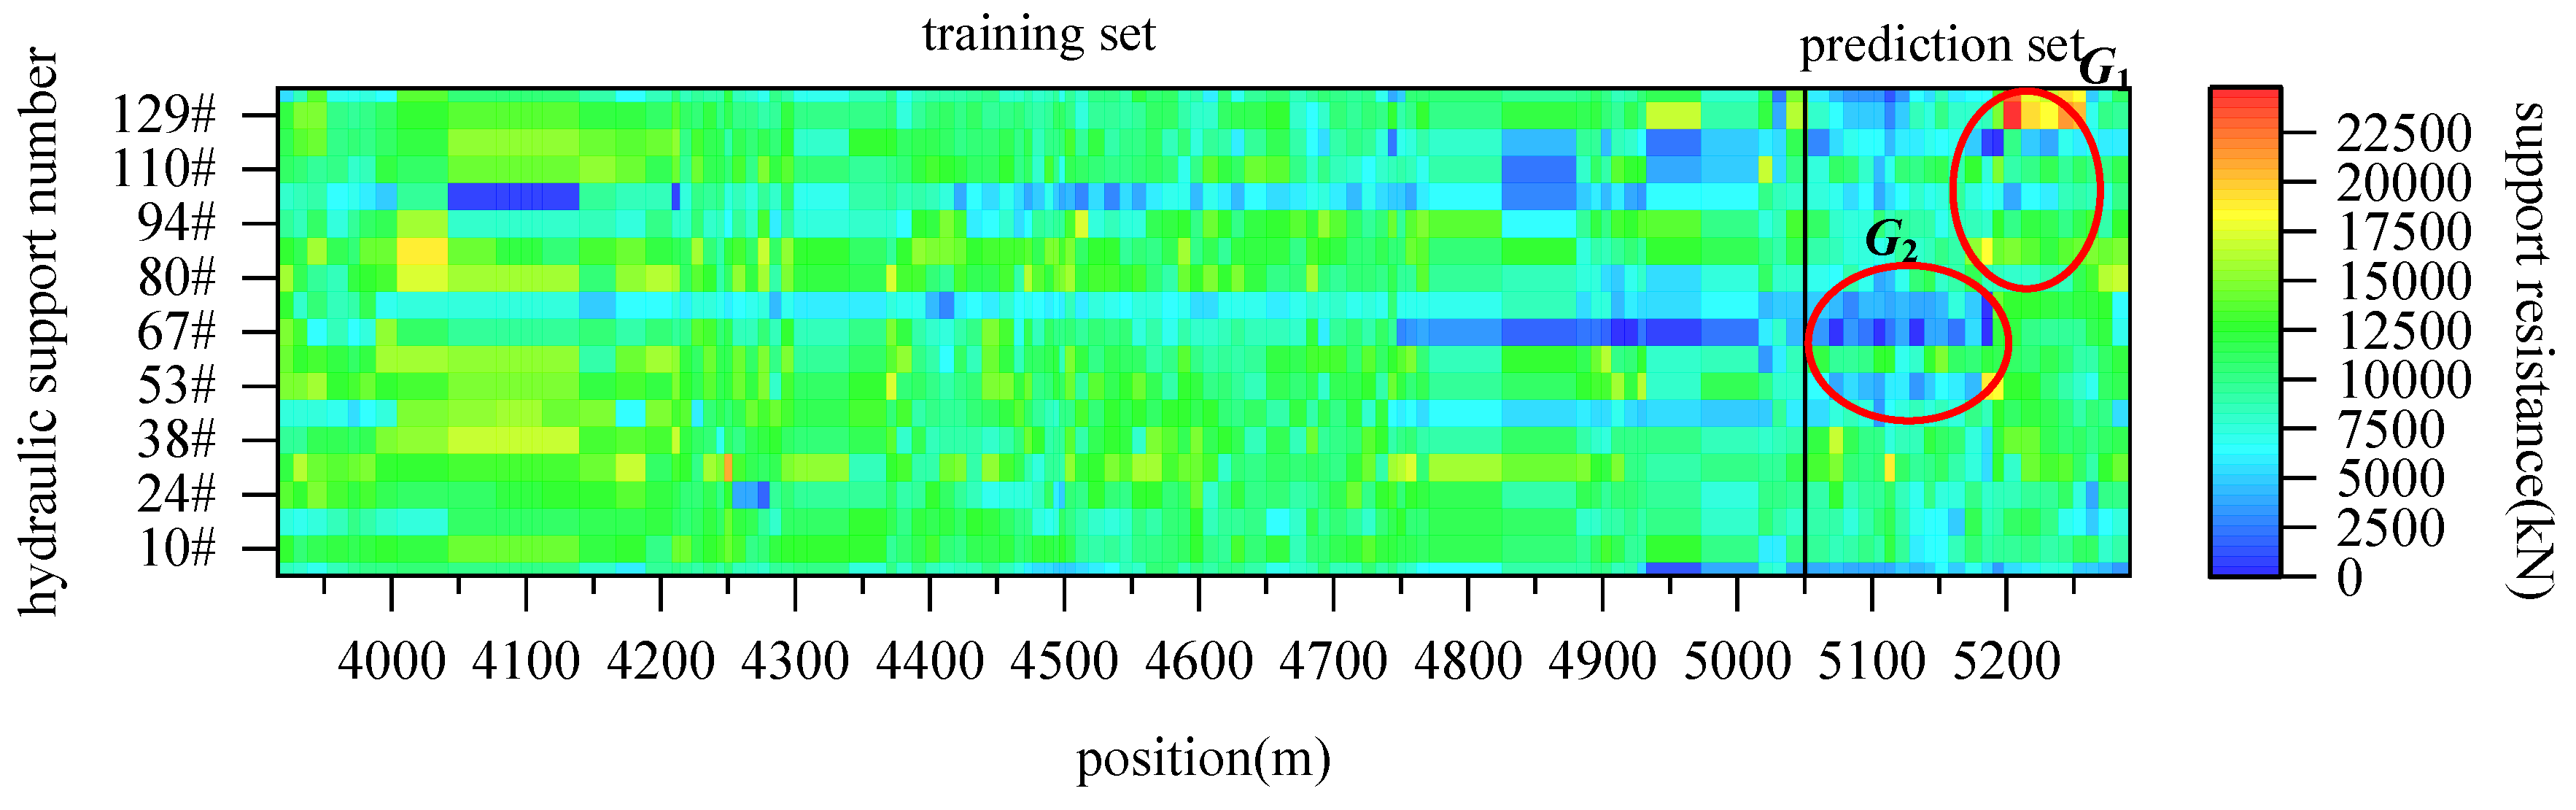
The output mining face full-area hydraulic support working resistance prediction value, the cluster analysis of the mining face full-area abnormal pressure type, the output after the cluster analysis 31317 comprehensive mining face abnormal pressure, and the abnormal pressure clustering reconstruction based on the hydraulic support working condition data prediction are overlapped; see Figure 18.
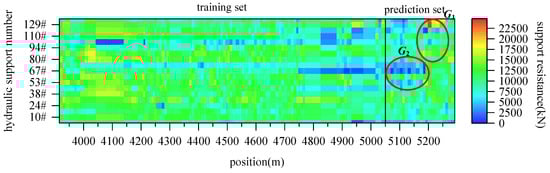
Figure 18.
The 31317 comprehensive mining face abnormal pressure clustering reconstruction based on hydraulic support working resistance data prediction.
The 31317 comprehensive mining face advanced to 5130 m when passing the 18th square of this working face. According to the clustering analysis reconstruction of the predicted MPTS, the clustering number of the predicted MPTS is 2, divided into G1 and G2 areas. The G1 area lags behind the square area, and the prediction results indicate that abnormal pressure may still occur in the 80#–120# hydraulic support after passing the square, and management personnel should take corresponding measures to deal with abnormal pressure in advance. The G2 area is caused by a hydraulic support supply system leakage, resulting in pressure loss and abnormal working resistance.
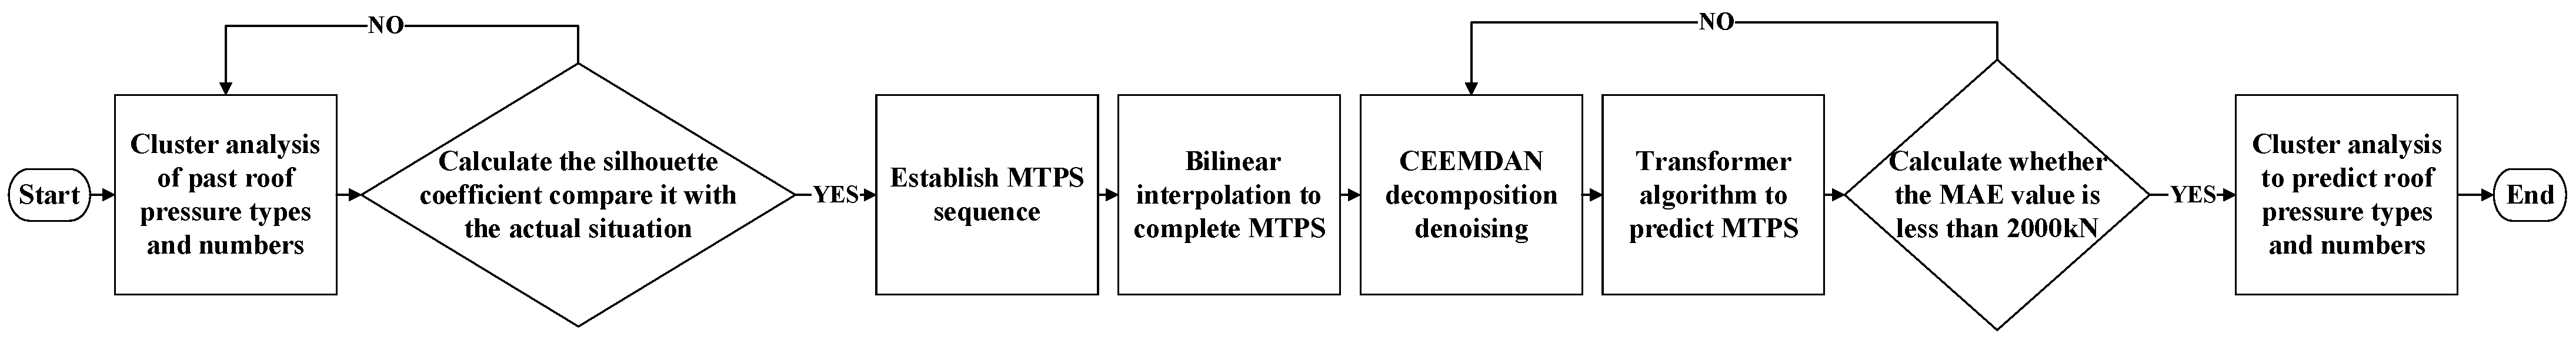
In summary, the cluster reconstruction prediction and early-warning method of abnormal mine pressure in the working face under the legacy coal pillar is briefly described as follows: 1. Cluster the analysis of the past roof pressure types and numbers. 2. Establish the MTPS sequence. 3. Perform a bilinear interpolation to complete MTPS. 4. Perform CEEMDAN decomposition denoising. 5. Use the Transformer algorithm to predict MTPS. 6. Cluster the analysis to predict the roof pressure types and numbers in the area. These steps are shown in Figure 19.

Figure 19.
Flowchart of abnormal mine pressure cluster reconstruction prediction method.
5.5. Abnormal Pressure Disaster Evaluation Analysis
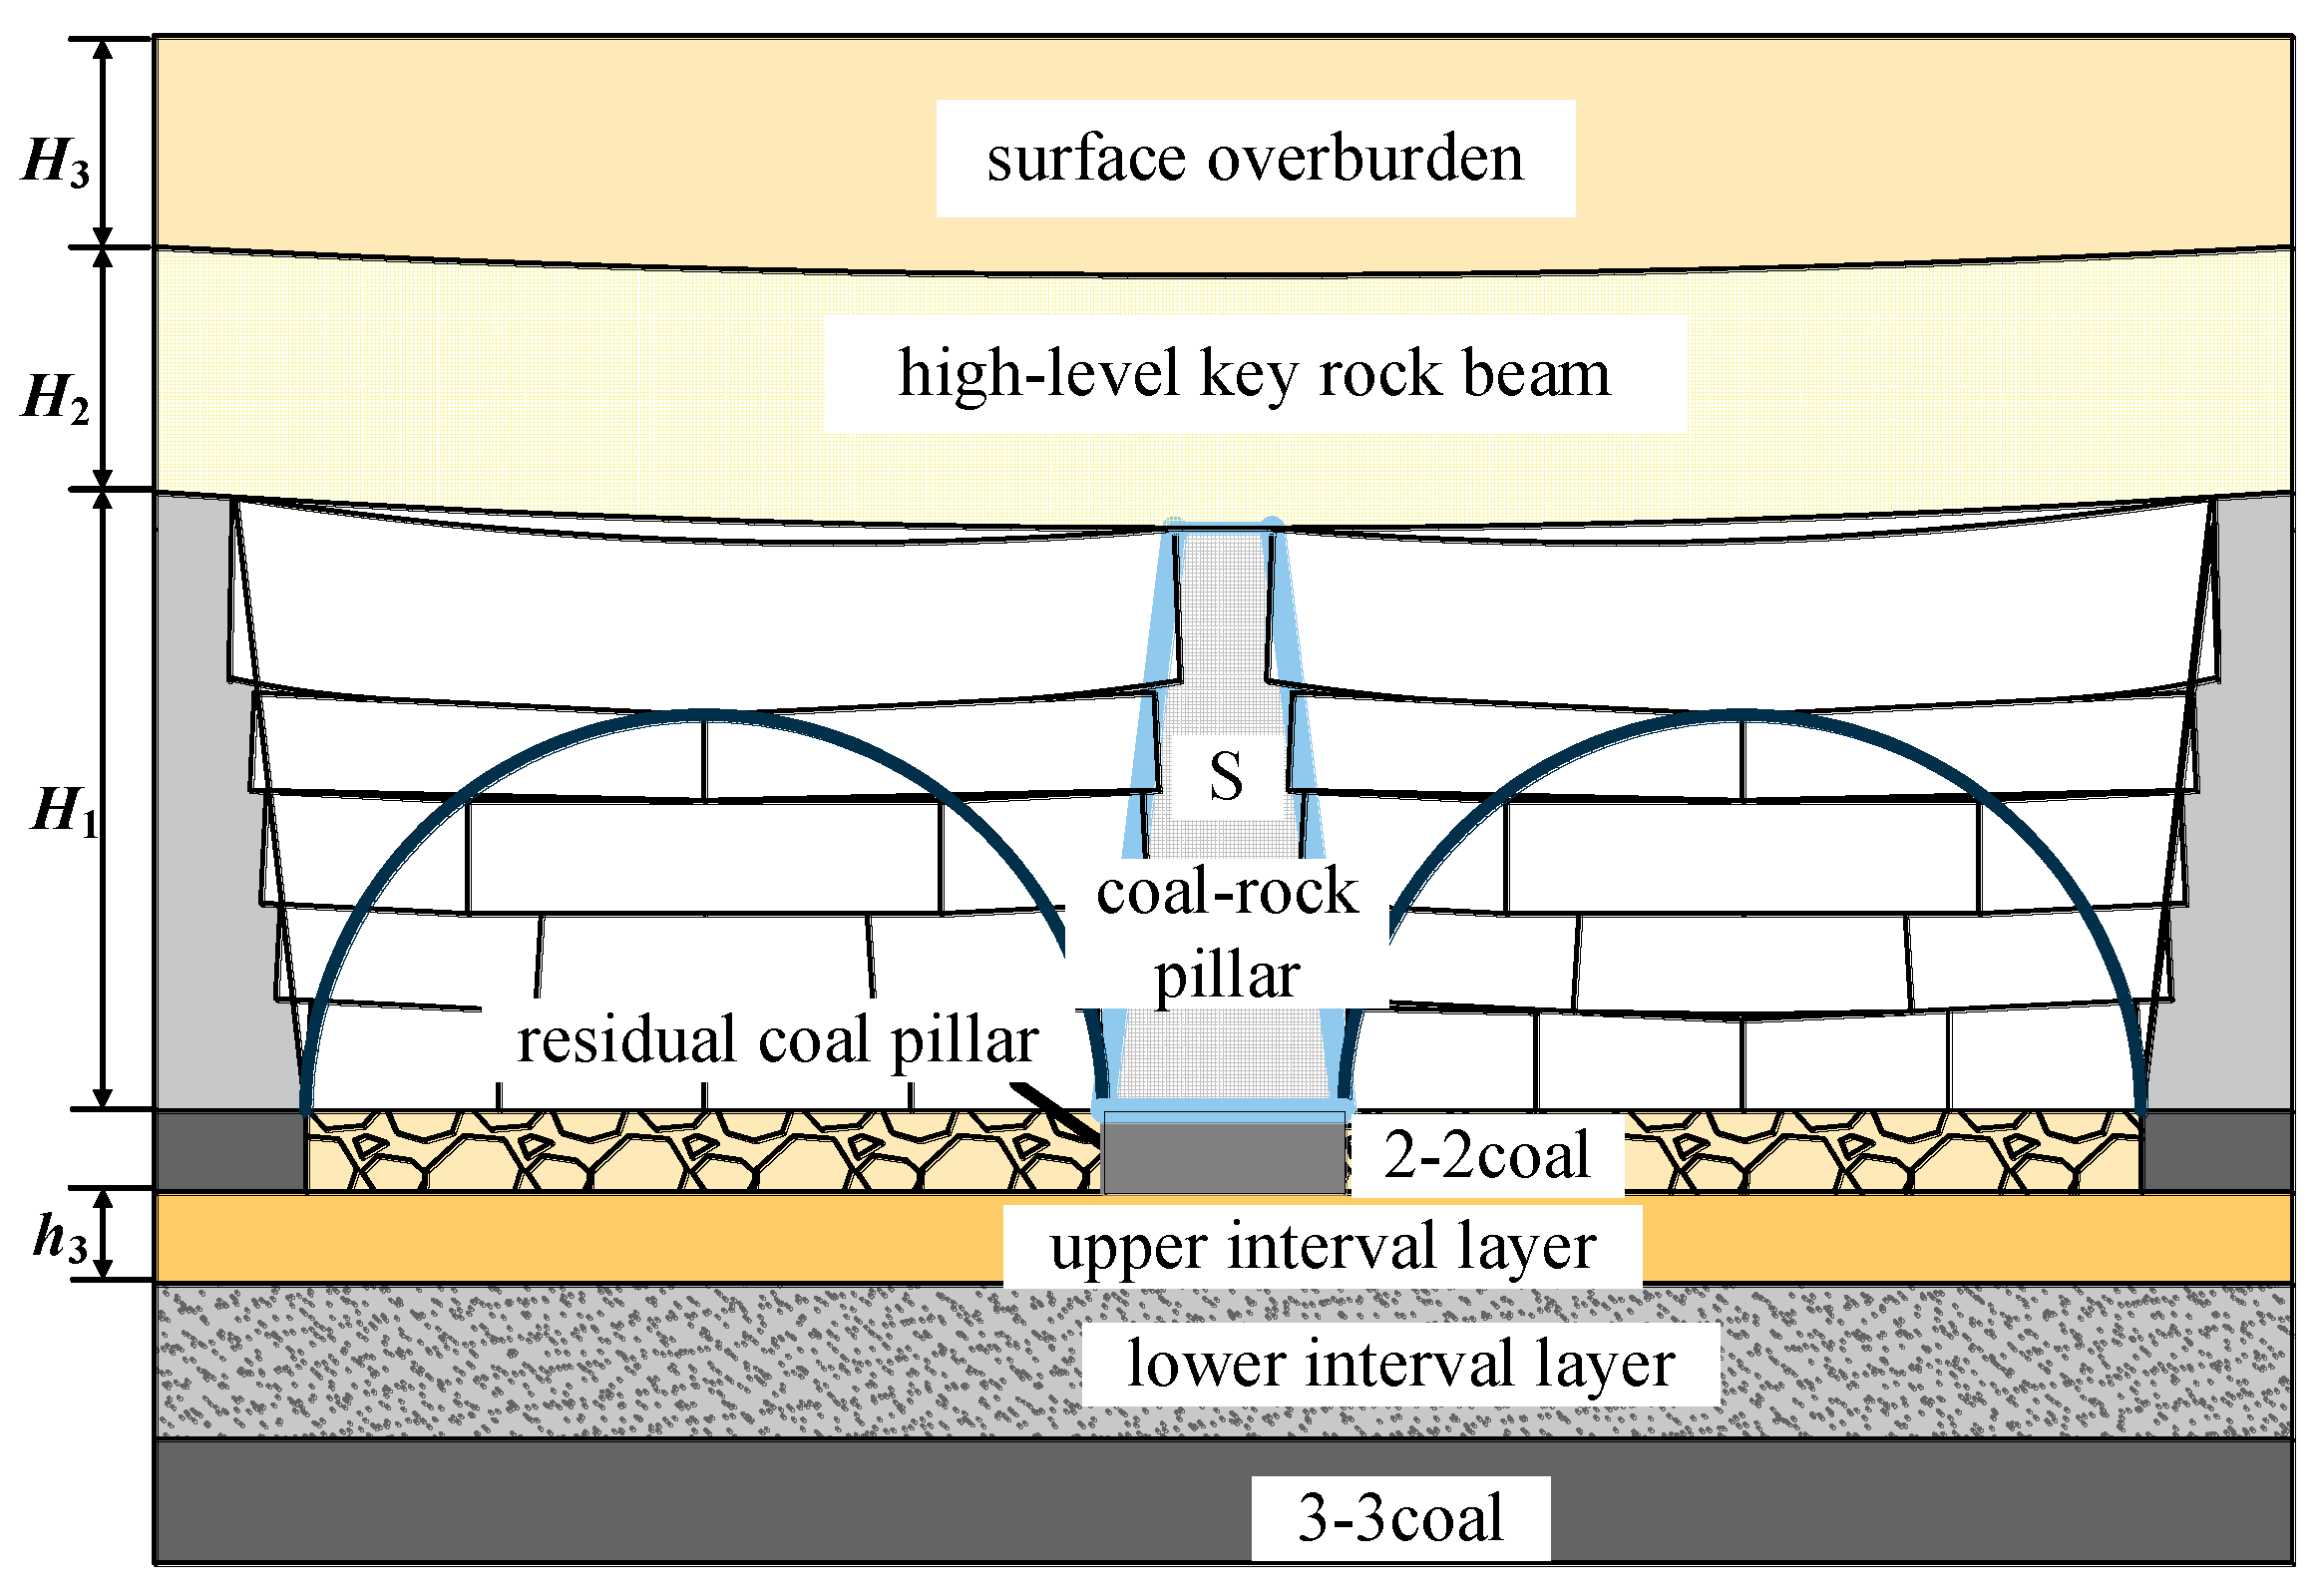
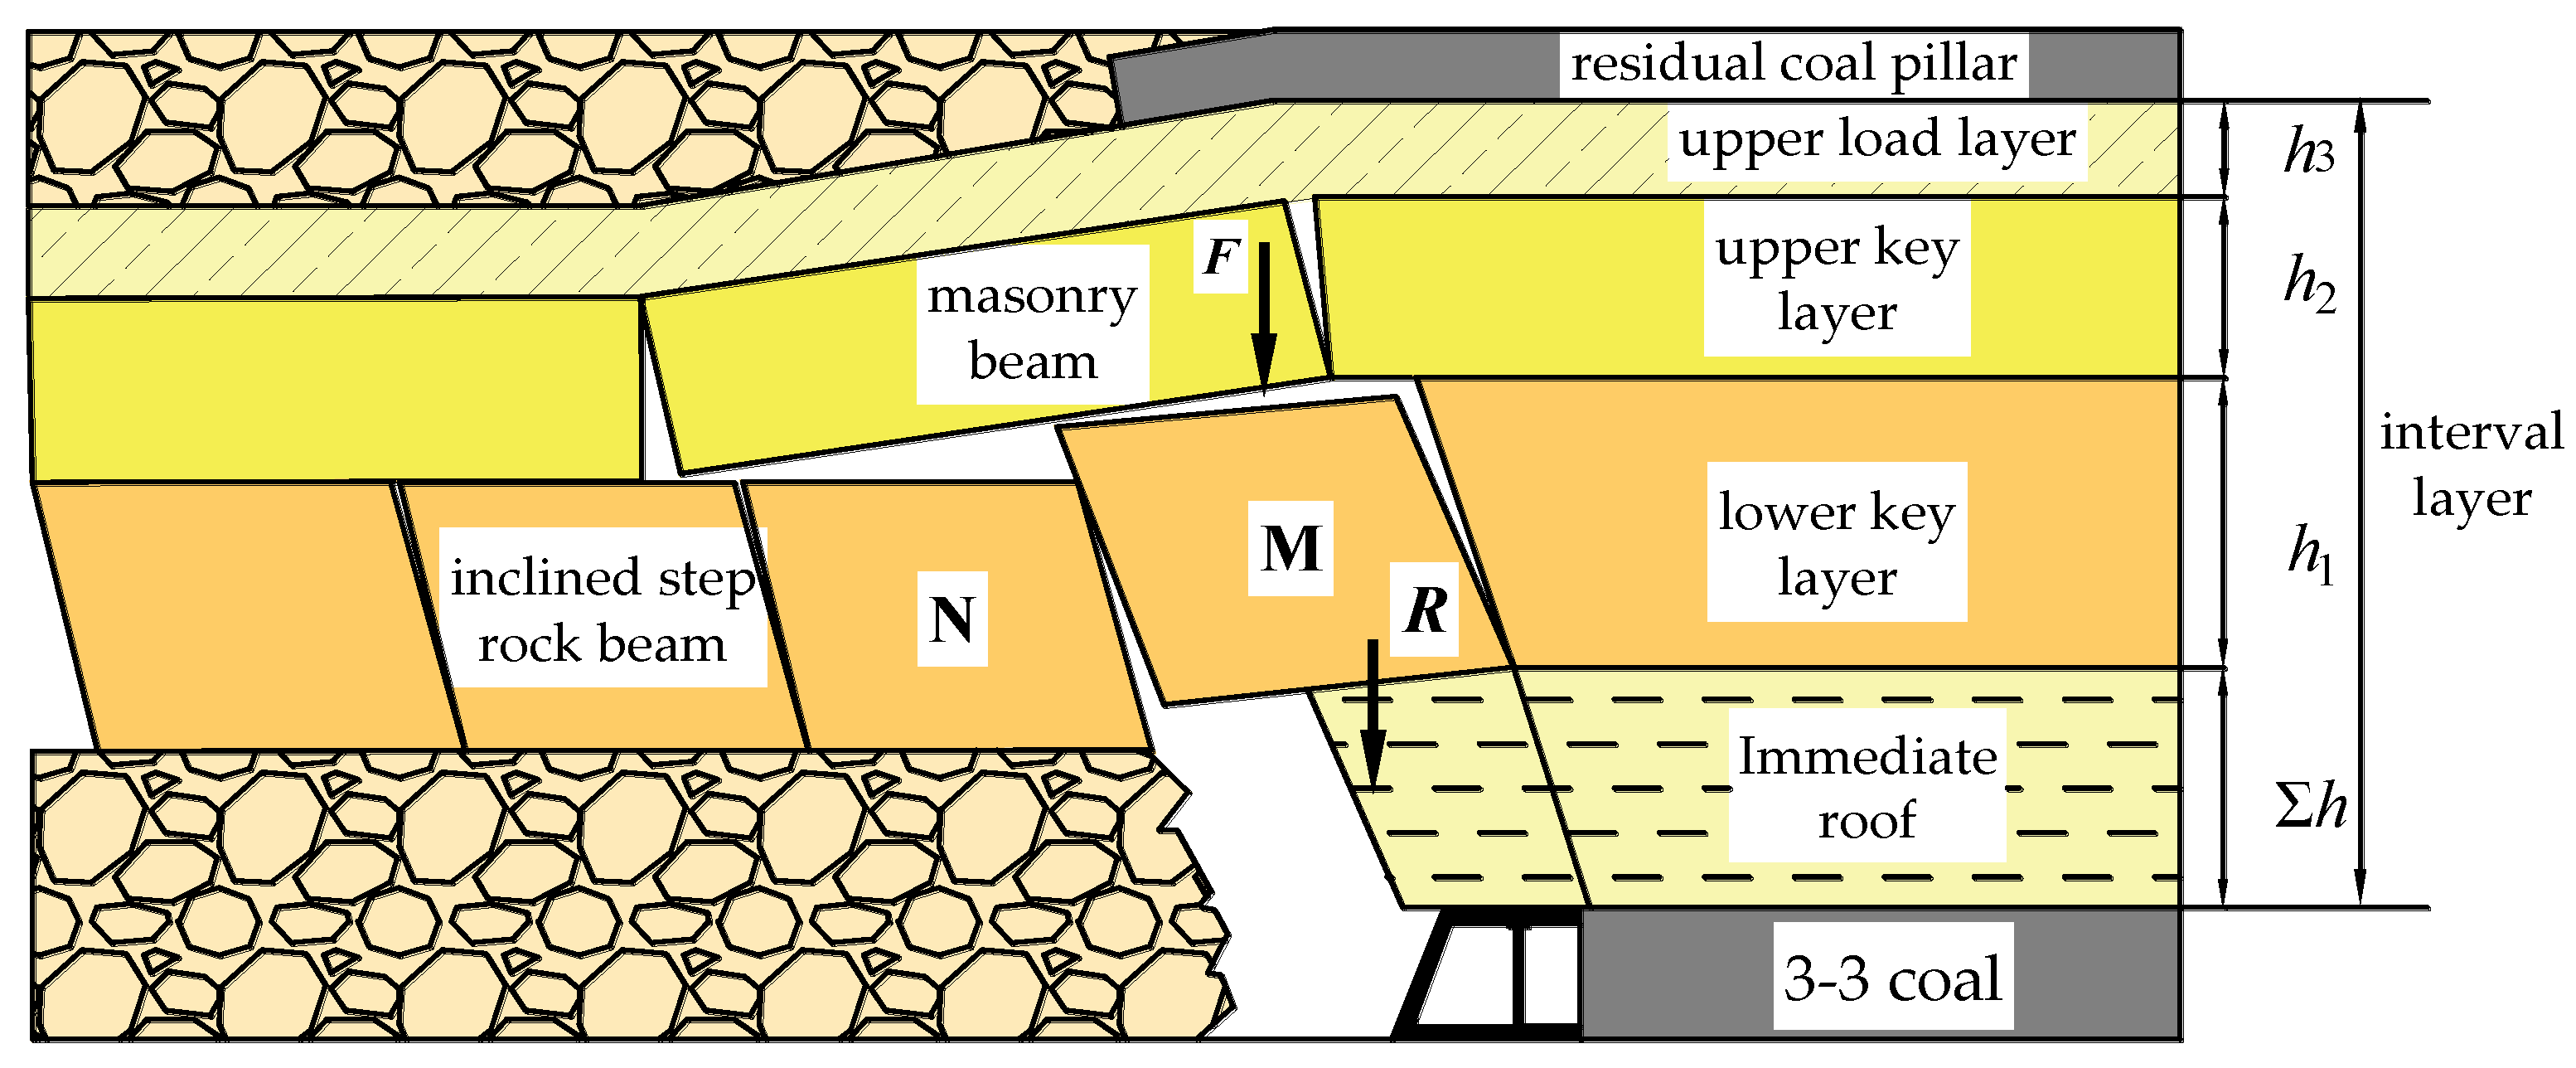
The lower key layer of the interval layer breaks alone to form an “inclined step rock beam” structure, and the upper key layer forms a “masonry beam” structure [21]. The periodic instability of the structure is a fundamental reason for the strong pressure from the lower coal seam working face. Referencing the typical shallow buried coal seam roof structure theory, a collapsed roof in the upper coal seam can be simplified as a uniform load acting on the interval layer. The double key layer roof structure model is shown in Figure 20. Considering the additional stress F correction of the residual coal pillar’s block sliding force R, the support load consists of immediate roof weight W and the step rock beam structure applied load. A reasonable support resistance of the working face is as follows:
where W is the weight of the interval layer (kN), ∑h is the thickness of the immediate roof (m), lk is the support control top distance (m), R is the sliding force of the step rock beam M block (kN), lb is the support width (m), is the volume force of the immediate roof (kN/m3).
where is the contact surface height, (m); tan is the friction factor; is the friction angle between the rock blocks (°); is the key layer volumetric force (kN/m3); h1 is the thickness of the lower key layer (m); L1 is the length of the inclined step rock beam block (m); and L2 is the length of the masonry beam (m).
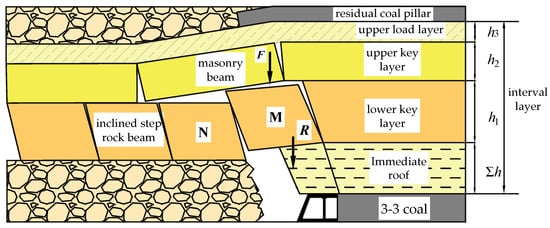
Figure 20.
Shallow-buried single-key layer near distance lower coal seam roof structure.
The masonry beam rock block M1 and the overburden self-weight P0 are determined by the following formula:
where KG is the load transfer factor and h3 is the thickness of the upper load layer (m).
According to Formulas (16)–(20), the reasonable support resistance can be determined.
The calculation parameters of the Chahasu Coal Mine 31317 comprehensive mining face are as follows: a = b = 285 m, d = 30 m, H1 = 294 m, H2 = 40 m, H3 = 10 m, H4 = 44.3 m, g = 2500 N/m3, E = 10 GPa, n = 0.2, h1 = 18 m, h2 = 9 m, h3 = 7 m, lb = 1.95 m, lk = 5.12 m, Sh = 3.9 m, = 22 kN, = 26 N, L1 = 12 m, L2 = 24 m, a = 0.33, m2 = 5.9 m, f = 0.15, KG = 0.4.
After the calculation, the additional concentrated static force caused by the remaining coal pillar is 960 kN, the impact force is 7500 kN, and the additional concentrated resultant force is 8460 kN, and after being absorbed and reduced by the lower rock layer, the pressure acting on the hydraulic support of the working face is 1946 kN.
The Chahasu Coal Mine 31317 comprehensive mining face uses a ZY21000/30/63D shield support, the rated working resistance is 21,000 kN, and the additional concentrated stress caused by the remaining coal pillar is 2000 kN. The hydraulic support working resistance prediction value of the backhaul working face entering the g1 area reaches 23,000 kN, and the backhaul working face is prone to abnormal pressure disaster.
In order to prevent the abnormal pressure caused by the backhaul working face in the remaining coal pillar influence area from causing the backhaul working face pressure frame accident, when the hydraulic support predicted working resistance is greater than 19,000 kN, measures should be taken to speed up the backhaul working face advancement speed and quickly pass through the abnormal pressure area.
6. Conclusions
(1) During the advancement of the mining face, the static and dynamic loads of the coal pillar in the upper coal seam residual section are transmitted downward, causing abnormal pressure on the mining face. By calculating the effective bearing static stress of the residual coal pillar, the bending deformation pressure static stress of the key rock layer, and the impact dynamics of the hard rock rotation instability of the coupling interval layer of the residual coal pillar during the mining process, the dynamic and static load’s additional stress of the residual coal pillar is superimposed to calculate the working resistance of the hydraulic support and verified by the FLAC3D numerical simulation with the double-yield model.
(2) Combining the possible types of abnormal pressure that may occur in the 31317 fully mechanized mining face of the Chahasu Coal Mine in the Shendong Mining Area, including over-mining voids, over-residual coal pillars, the facing in this mining face, the facing in the upper-section mining voids, double facing, and the over-strip breaking zone and their mutual superposition causing abnormal pressure, based on the k-means++ clustering analysis algorithm to calculate the clustering validity function to obtain the optimal classification number k = 6, the whole area of the mining face is intelligently divided into abnormal pressure zones.
(3) The time and space features of the mining face are deeply extracted, a bilinearly interpolation is performed to complete the two-dimensional spatial data of the mining face in the missing area of mine pressure data, a mine pressure time series MPTS is established based on CEEMDAN–Transformer deep learning method to predict MPTS prediction values for the whole area of the mining face, and the algorithm modeling reconstruction analysis of abnormal pressure for the whole area of the mining face is clustered. This paper successfully predicts that after 18 times of facing in this mining face residual coal pillar area, there will be one abnormal pressure in the 80#–129# hydraulic support, and when the working resistance of hydraulic support is greater than 19000 kN, the abnormal pressure will cause a disaster. The method proposed in this paper based on a mine pressure data prediction clustering reconstruction analysis of abnormal pressure provides a new direction and guidance for an abnormal mine pressure prediction analysis of a mining face.
Author Contributions
Conceptualization, H.H.; methodology, H.H.; software, H.H., Y.L. and G.H.; validation, Y.L. and Q.X.; investigation, H.H.; data curation, K.L.; writing—original draft preparation, H.H.; writing—review and editing, Q.Y. and X.L.; supervision, X.L.; project administration, Q.Y. and Y.L.; funding acquisition, Q.Y. All authors have read and agreed to the published version of the manuscript.
Funding
This study was funded by Jiangsu Province Science and Technology Department, grant number BK20220024.
Data Availability Statement
This study involves coal mining data, which, due to its sensitive nature, cannot be made publicly available. In accordance with relevant regulations and security policies, we are unable to provide public access or downloads for these data. We are committed to safeguarding the security and privacy of coal mining data and will comply with applicable laws and regulations. If there are any legitimate requests or opportunities for collaboration regarding the data, please contact us through the designated organization or contact person for further information.
Conflicts of Interest
The authors declare that they have no conflicts of interest.
References
- Tan, Y.; Ma, Q.; Liu, X.; Elsworth, D.; Qian, R.; Shang, J. Study on the disaster caused by the linkage failure of the residual coal pillar and rock stratum during multiple coal seam mining: Mechanism of progressive and dynamic failure. Int. J. Coal Sci. Technol. 2023, 10, 14–45. [Google Scholar] [CrossRef]
- Liu, W.; Yang, K.; He, X.; Zhang, Z.; Xu, R. Mechanism and Control Technology of Rockburst Induced by Thick Hard Roof and Residual Coal Pillar: A Case Study. Geofluids 2023, 2023, 3523592. [Google Scholar] [CrossRef]
- Das, A.J.; Mandal, P.K.; Paul, P.S.; Sinha, R.K. Generalised Analytical Models for the Strength of the Inclined as well as the Flat Coal Pillars using Rock Mass Failure Criterion. Rock Mech. Rock Eng. 2019, 52, 3921–3946. [Google Scholar] [CrossRef]
- Bai, J.; Feng, G.; Wang, S.; Qi, T.; Yang, J.; Guo, J.; Li, Z.; Du, X.; Wang, Z.; Du, Y.; et al. Vertical stress and stability of interburden over an abandoned pillar working before upward mining: A case study. Roy. Soc. Open Sci. 2018, 5, 180346. [Google Scholar] [CrossRef] [PubMed]
- He, X.; Zhao, Y.; Yang, K.; Zhang, C.; Han, P. Development and formation of ground fissures induced by an ultra large mining height longwall panel in Shendong mining area. Bull. Eng. Geol. Environ. 2021, 80, 7879–7898. [Google Scholar] [CrossRef]
- Li, Z.; Fan, J.; Feng, G.; Qi, C.; Zhang, J. A New Method for Identifying Coal Pillar Instability Based on Energy and Stress Correlation Characteristics and Its Engineering Application. Minerals 2023, 13, 1507. [Google Scholar] [CrossRef]
- Zhang, M.; Jiang, F.X.; Li, J.Z.; Jiao, Z.-H.; Hu, H.; Shu, C.-X.; Gao, H.-J. Stability of coal pillar on the basis of the co-deformation of thick rock strata and coal pillar. Rock Soil Mech. 2018, 39, 705–714. [Google Scholar]
- Bai, J.W.; Shi, X.D.; Feng, G.R.; Qi, T.Y.; Li, Z. A new method for evaluating chain failure of residual coal pillars and its application in the upward mining. J. Min. Saf. Eng. 2022, 39, 643–652+662. [Google Scholar]
- Wang, Z.; Li, J.; Lin, L.; Liu, B.; Ushakov, I. Mesoscopic study on instability characteristics of residual coal pillars–roof system based upon domino effect in pillar goaf. Géoméch. Geophys. Geo-Energy Geo-Resour. 2023, 9, 109. [Google Scholar] [CrossRef]
- Wu, W.; Feng, G.; Yu, X.; Bai, J.; Wang, X.; Zhao, X. Investigation into Pressure Appearances and Hydraulic Fracturing Roof-Cutting Technology in Mining Working Face under Residual Pillars: A Case Study. Energies 2023, 16, 3914. [Google Scholar] [CrossRef]
- Molaei, F.; Rahimi, E.; Siavoshi, H.; Afrouz, S.G.; Tenorio, V. A Comprehensive Review on Internet of Things (IoT) and its Implications in the Mining Industry. Am. J. Eng. Appl. Sci. 2020, 13, 499–515. [Google Scholar] [CrossRef]
- Qi, C. Big data management in the mining industry. Int. J. Miner. Met. Mater. 2020, 27, 131–139. [Google Scholar] [CrossRef]
- Cheng, J.; Wan, Z.; Peng, S.S.; Zhang, H.W.; Xing, K.K.; Yan, W.Z.; Liu, S.F. Technology of intelligent sensing of longwall shield supports status and roof strata based on massive shield pressure monitoring data. J. China Coal Soc. 2020, 45, 2090–2103. [Google Scholar]
- Zhao, Y.X.; Yang, Z.L.; Ma, B.J.; Song, H.H.; Yang, D.H. Deep learning prediction and model generalization of ground pressure for deep longwall face with large mining height. J. China Coal Soc. 2020, 45, 54–65. [Google Scholar]
- Gao, X.; Hu, Y.; Liu, S.; Yin, J.; Fan, K.; Yi, L. An AGCRN Algorithm for Pressure Prediction in an Ultra-Long Mining Face in a Medium–Thick Coal Seam in the Northern Shaanxi Area, China. Appl. Sci. 2023, 13, 11369. [Google Scholar] [CrossRef]
- Dong, J.; Xie, Z.; Jiang, H.; Gao, K. Multiple regression method for working face mining pressure prediction based on hydraulic support monitoring dataset. Front. Earth Sci. 2023, 11, 1114033. [Google Scholar] [CrossRef]
- Ezugwu, A.E.; Ikotun, A.M.; Oyelade, O.O.; Abualigah, L.; Agushaka, J.O.; Eke, C.I.; Akinyelu, A.A. A comprehensive survey of clustering algorithms: State-of-the-art machine learning applications, taxonomy, challenges, and future research prospects. Eng. Appl. Artif. Intell. 2022, 110, 104743. [Google Scholar] [CrossRef]
- Javaid, M.A.; Harrison, J.P. Heterogeneity of in situ stress: A Review. IOP Conf. Series Earth Environ. Sci. 2021, 833, 012058. [Google Scholar] [CrossRef]
- Chen, Y.Q.; Liu, C.Y.; Liu, J.R.; Yang, P.J.; Lu, S.; Wei, J.K. Study on support pressure continuity classification and mine pressure characteristics by unifying spatiotemporal characteristics modelling. J. Min. Saf. Eng. 2021, 38, 1–11. [Google Scholar]
- Chen, Y.; Liu, C.; Liu, J.; Yang, P.; Lu, S. Case Study on Dynamic Identification of Overburden Fracture and Strong Mine Pressure Mechanism of Isolated Working Face Based on Microseismic Clustering. Sustainability 2022, 15, 436. [Google Scholar] [CrossRef]
- Huang, Q.X.; Cao, J.; He, Y.P.; Wang, B. Classification of shallow buried close seams group and support resistance determination. J. Min. Saf. Eng. 2018, 35, 1177–1184. [Google Scholar]
- Jiang, J.Q.; Zhang, P.P.; Qin, G.P.; Xu, B. Analysis of destabilized fracture and microseismic activity of high-located main key strata. Rock Soil Mech. 2015, 36, 3567–3575. [Google Scholar]
- Wang, J.C.; Wang, Z.H.; Tang, Y.S.; Li, M.; Chang, K.L.; Gong, H.; Xu, G.L. Experimental study on mining-induced dynamic impact effect of main roofs in deeply buried thick coal seams with weakly consolidated thin bed rock. Chin. J. Rock Mech. Eng. 2021, 40, 2377–2391. [Google Scholar]
- Xia, Z.; Yao, Q.; Meng, G.; Xu, Q.; Tang, C.; Zhu, L.; Wang, W.; Shen, Q. Numerical study of stability of mining roadways with 6.0-m section coal pillars under influence of repeated mining. Int. J. Rock Mech. Min. Sci. 2021, 138, 104641. [Google Scholar] [CrossRef]
- Chowdhury, K.; Chaudhuri, D.; Pal, A.K. An entropy-based initialization method of K-means clustering on the optimal number of clusters. Neural Comput. Appl. 2021, 33, 6965–6982. [Google Scholar] [CrossRef]
- Gang, S.; Feng, W.; Xiuyou, W.; Hao, W.; Jing, C. Application Research on Cubic Spline Interpolation Based on Particle Swarm Optimization in Mine Pressure Missing Data. In Proceedings of the 2011 International Conference on Information Management, Innovation Management and Industrial Engineering, Shenzhen, China, 26–27 November 2011; pp. 87–90. [Google Scholar]
- Vaswani, A.; Shazeer, N.; Parmar, N.; Uszkoreit, J.; Jones, L.; Gomez, A.N.; Kaiser, Ł.; Polosukhin, I. Attention is all you need. Adv. Neural Inf. Process. Syst. 2017, 30, 6000–6010. [Google Scholar]


Disclaimer/Publisher’s Note: The statements, opinions and data contained in all publications are solely those of the individual author(s) and contributor(s) and not of MDPI and/or the editor(s). MDPI and/or the editor(s) disclaim responsibility for any injury to people or property resulting from any ideas, methods, instructions or products referred to in the content. |
© 2024 by the authors. Licensee MDPI, Basel, Switzerland. This article is an open access article distributed under the terms and conditions of the Creative Commons Attribution (CC BY) license (https://creativecommons.org/licenses/by/4.0/).