Article

Study on Drying of Seaweeds and Importance of Glass Transition and Stabilization

1
Department of Energy and Process Engineering, Norwegian University of Science and Technology, Kolbjørn Hejes vei 1b, 7491 Trondheim, Norway
2
School of Engineering, University of Southern Queensland, Springfield 4300, Australia
3
SINTEF Energy Research, 7034 Trondheim, Norway
4
Seaweed Solutions AS, 7018 Trondheim, Norway
5
Seaweed Energy Solutions, 7491 Trondheim, Norway
*
Author to whom correspondence should be addressed.
Processes 2024, 12(2), 373; https://doi.org/10.3390/pr12020373
Submission received: 23 November 2023 / Revised: 5 February 2024 / Accepted: 7 February 2024 / Published: 12 February 2024

Abstract

:
In this study, the thermal transition of seaweed Saccharina latissima (raw and blanched) during drying and quality stabilization was considered in view of understanding physico-chemical changes, color changes, sorption changes and thermal property changes with respect to drying kinetics. The variations in the effective moisture diffusivity coefficient with shrinkage changes and temperature lie between 1.0 and 5.0 × 10⁻¹⁰ m2 s−1 (raw) and 0.5 and 3.6 × 10⁻¹⁰ m2 s−1 (blanched), respectively. Noticeable physical and chemical changes were observed during longer drying times, especially in the case of blanched seaweeds. At the temperature of 38.0 °C, a more yellow-colored product was obtained from raw form input materials. The blanched seaweeds accumulated moisture in a linear manner with an increase in the relative humidity of the drying air in the range of 20.0~80.0%, which resulted in high level of hysteresis between the sorption and desorption behavior. Shrinkage changes during the drying of blanched and raw samples were also calculated. The thermal stabilization of raw and blanched forms started at different initial moisture contents showed changed glass transition phenomena during a wide range of temperature sand one melting endotherm between 141.9 and 167.9 °C. Some glass transitions were driven by the presence of water-soluble contents in the material. The dried seaweeds at low temperatures showed a partial glassy state and an amorphous/crystalline state. This study evaluated the effects of process parameters on the properties of dried product.

1. Introduction

Long-term sustainable management of marine resources leads to more studies related to materials like seaweeds. The number of people looking for products from sustainable sources is increasing, and with that respect seaweeds has a higher marketability, providing close to 30 million tons and a market value of EUR 6–7 billion (95% coming from Asia) in the present-day market. Japanese kelp, Gracilaria and Wakame are commonly available industrial species. Out of the total harvest, 36% is consumed as direct food, and the remainder is consumed as additives or to produce chemical compounds [1]. The most popular seaweed varieties used as a food are Kombu and Royal Kombu [2].
Important advantages and the promising potential of the European industry depend on avoidance of three things, which are limited to agriculture: land, water and fertilizers [3]. The different climate zones available along the long coastline of Europe provide immense potential for diverse and sustainable seaweed cultivation. At the same time, the question of quality stabilization during distribution and retail appears to be being gradually solved.
Removal of moisture is the common way to preserve and stabilize the seaweed, and the majority is sold as dried product [4]. Dehydration is a method for improving keeping quality of material as an end product or product used for subsequent operations. Drying is also possible for seaweeds. Solar and natural drying are cost-effective; however, they end up with a water content of up to 50.0% on dry basis (d.b.) depending on the climate conditions during drying [5]. The high air relative humidity (RH) under natural conditions limits the dehydration of products.
Seaweeds have high absorption ability and, as a result, they can uptake moisture from the air under alterations in relative humidity [6]. Moreover, the ambient air can be at a relatively high temperature, which may negatively influence the rheological and biochemical properties of dried seaweeds. Thus, the uncontrollable drying process of natural drying may reduce the quality level of dried seaweeds.
Problems with sanitation and hygienic product handling can also occur in such a drying process. Commonly used natural drying methods take 5~7 days [7]. Drying in open air is suitable only when the seaweed is used as input for the hydrocolloid industry, feed additives and fertilizers. However, to prevent contamination, it is not advisable to apply natural drying as a safe or clean method for seaweed preparation for foods. The demand from consumers who are concerned about quality and safety depends on the drying method used. Also, material exposure at elevated temperatures adversely affects the main constituents [8]. The following are the required characteristics of safe seaweed drying:
  • Stable mild temperature and humidity in the drying process. Of course, higher temperatures will reduce the drying time, but at the same time they will reduce the polysaccharides, and decompose components.
  • A shorter dehydration time is advisable to limit enzymatic reactions [9]. Reduced temperatures are preferable, which help in material extraction [10,11].
The aims of this study were understanding the thermal transition behavior of seaweed during quality stabilization through lower-temperature drying of the material after the frozen stage and the implementation of the findings into sustainable processes. Seaweed harvesting happens within few days and the majority of biomass collected is hard to process while avoiding quality degradation during the time permitted (Figure 1).

2. Materials and Methods

2.1. Material

Seaweed (Saccharina latissimi) was cultivated in farms in Sør-Trøndelag (Norway) for one year. Collection was carried out in 3 days to maintain quality and reduce the extent of biofouling. Harvested material was collected on mesh (75–150 kg) and submerged in seawater at the farm up to 1 week before subsequent operations. Discolored and broken seaweed was taken as bad quality seaweed and was removed by inspection and sorting. The seaweed was weighed out into 2.0 kg portions and packed into vacuum bags with high moisture diffusion transfer properties and subjected to freezing at −46 °C for 20–25 min. Bags were placed into cardboard boxes and placed at −18 °C similarly to the method used in [12].

2.2. Experiment Description

Material was thawed at +5.0 °C in a refrigerated chamber to maintain quality and then was divided into two groups: one was subjected to blanching (hot water (100.0 °C) for 1.0 min) and the remainder was subjected to no processing. Temperature was maintained by using a bath with steam and hot water connections. After adding the samples, they remained in the bath for 1 min before taking them out to prevent cooking. The blanched seaweeds were immediately cooled in water at 5.0 °C to halt the cooking process. Removal of moisture was carried out by drying the samples in a drying chamber with air circulation at the Process Engineering Department at Norwegian University of Technology, Trondheim, Norway. The relative humidity of the air was maintained by the standard method: cooling down the air below the dew point, dehumidification and subsequent drying.
The following parameter changes were applied to the drying experiment:
  • Air temperature changes: 10, 25 and 38 °C.
  • Different layers: 1, 2 and 3 layers. In the drying chamber on shelves in the same direction as the air flow.
  • Relative humidity was at 16.0 ± 4.0% for the drying air.
  • Velocity of drying medium: 1.5 ± 0.5 m s−1.
  • Drying was terminated when moisture content reached the range 20.0~10.0% d.b.

2.3. Drying Behaviour

For this purpose, a simple Newton model [13], i.e., Equation (1), was used:
M R = e x p ( k t )
where k—drying constant, min−1; t—drying time, min; and MR—moisture ratio.
A more precise way to understand the moisture exchange by the moisture diffusivity is by using Fick’s 2nd law [14] of diffusion (infinite slab), shown in Equation (2):
M R = 8 π n = 0 1 ( 2 n + 1 ) 2 e x p ( ( 2 n + 1 ) 2 π 2 D e f f t 4 ( h ) 2 )
where Deff—effective diffusivity, m2 s−1; t—drying time, sec; h—half-thickness of material layer; and n—number (35 was taken for case to increase accuracy and it permits maximum possible terms).
To obtain a more accurate picture, Equation (2) includes the half-thickness of product h, which is a variable during drying. This is related to the shrinkage of the product and considered in the case of seaweeds, especially for blanched seaweeds. The moisture diffusivity with shrinkage was calculate using a modification of the analytical solution of Fick’s 2nd law using Equation (3) [15]:
Y t Y e Y 0 Y e = 8 π n = 0 1 ( 2 n + 1 ) 2 e x p ( ( 2 n + 1 ) 2 π 2 D e f f . s h r k t 4 ( h ) 2 )
where Deff.shrk is the effective moisture diffusivity with shrinkage, m2 s−1, and Y is the ratio of moisture content, MR, kg kg−1 d.b., to the volume of the sample, m3.

2.4. Sorption and Desorption Properties with Temperature

The final moisture content of food products is an important parameter known as the equilibrium moisture content, and depends on the relative humidity and temperature of the drying air. It is needed in the design of processes and storage conditions in food engineering operations. Sorption behavior was determined for blanched and raw seaweeds at three temperatures. Additional experiments were carried out to determine the desorption isotherms for raw and blanched materials at 25.0 °C/20.0% RH to understand the influence of drying process on structure (via hysteresis). Then, the water activity (aw) of the samples was obtained using AquaLab 4x (AquaLab, Pullman, WA, USA). The moisture of samples was determined by drying at 105 °C [16] until the last samples were dried to the same moisture content.
Sorption isotherms were calculated by equilibration of the dried samples (1.0 g) in a laboratory climatic chamber (KMF 240, Binder, Tuttlingen, Germany) maintaining a certain mode continuously (temperature ±0.1 K; RH ±1.5%) until the weight of the sample stabilized (±0.001 g). Relative humidity was altered in the range between 20.0 and 80.0%. The same procedure was used for preparation of the samples with different moisture contents for differential scanning calorimetry (DSC) investigation. When the weight was stabilized, the dry basis (d.b.) was determined by drying at 105 °C according to [16] (drying oven DryLine, VWR, Oslo, Norway).

2.5. DSC Analysis

Differential scanning calorimetry was carried out in a DSC Q 2000 (TA Instruments, New Castle, DE, USA) comprising a liquid nitrogen cooling system. The heat capacity was calibrated with sapphire in the range −150.0~180.0 °C. Helium was used as the purge gas at 25 mL min−1, according to the TA Instrument’s recommendations. The reference sample taken was an empty hermetically sealed aluminum pan.
The particle size of the blades (1–2 mm effective diameter) was used for DSC tests, with the aim to understand the real transitions that happened in the blade. Thus, the analysis gives information about phase changes in different compounds, as they naturally occur in the seaweeds during drying. The samples of particles between 3.0 mg and 20.0 mg were placed in pans (aluminum) with hermetic lids. The pans were pressed with a Tzero® DSC Sample Encapsulation Press (TA Instruments, Newcastle, DE, USA). The pans were introduced to the DSC cell by an autosampler. The samples were cooled and equilibrated for 5 min at −150.0 °C with the cooling rate 10.0 °C min−1. Then, the samples were heated up to 150.0 °C (depending on the higher moisture content) at the heating rate of 10.0 °C min−1. Samples with a high moisture content (higher than 25.0% w.b.) were cooled (10.0 °C min−1) and equilibrated for 15 min at −50.0 °C before cooling down to −150.0 °C. This prevented cold crystallization during scanning. After, they were heated up to 80 °C at the heating rate of 10.0 °C min−1.

2.6. Glass Transition

This was carried out with TA Universal Analysis 2000 version 4.5A software (TA Instruments). Glass transition was determined by observation of parameters such as the onset (Tgo), end (Tge) and inflection (Tgi) points. It was observed that the glass transition in samples with a high moisture content is relatively low. So, the inflection point was determined as a negative peak of the derived heat flow curve [17].
The incipient melting point, T’m, was detected by analyzing the DSC heating curve for raw and dried seaweeds [17]. The method includes an observation of the temperature derived from the DSC heating curve. The incipient point of melting appears where the linear trend of the derived heat flow shows several marginal shoulders, plateaus and peaks. The freezing point was estimated as the minimum value of the ice melting endothermic peak on the DSC heat flow curve.

2.7. Unfreezable Water

Unfreezable water was observed using the DSC melting curve from the incipient point of melting [17]. The following empirical equation [18] was used for correction purposes (Equation (4)):
Lice = 333.5 + 2.05 × T − 4.19 × 10 − 3T2
where Lice is latent heat of fusion and T is temperature.
Ice fraction (Xice, kg) for each sample was calculated as the ratio of melting enthalpy difference ( H m e l t i n g , i ) and latent heat of fusion using Equation (5). This equation describes the variation in the heat of fusion with temperature.
X i c e = i = T m i = T f H m e l t i n g , i L i c e , i
The amount of unfreezable water was given as the difference between total water content and ice content.

2.8. Data Analysis—Statistics

Analysis of variance (ANOVA) was used for data analysis. The difference in least square means was checked for significance at p < 0.05. Experimental points were performed in six parallels, except for desorption isotherm determination, where each point was a single experiment.
Regression analysis was performed with the DataFit 8.1 software program (Oakdale Engineering). Statistics of regression were expressed by F-Ratio, Prob(F) and R2.

3. Results and Discussion

3.1. Chemical Composition of Seaweeds

This was measured by analytical laboratory Kystlab preBIO, Frøya. It was found that the protein content was 13.2%, and it was in the common range of 3.0 to 15.0% for brown seaweeds [19]. It was reported that aquaculture seaweeds from Damariscotta bay (USA) had a protein content of 6.87% d.b. [20]. Salt (NaCL) content was very high in the Norwegian cultivated seaweeds due to the washing process in seawater. It is important to note that the age of the Saccharina biomass was not determined in the above-mentioned studies.
The carbohydrate and ash contents of Norwegian sugar kelp were almost the same as those of aquaculture kelp from USA (53.36% and 37.79% d.b., respectively) but showed a difference when compared with wild sugar kelp from Scotland (63.1% and 31.7%). The carbohydrates in Saccharina latissima are represented by alginate, mannitol, cellulose and laminarin. The available research for cultivated Norwegian sugar kelp reports that the mannitol and laminarin contents are in the ranges between 3.0 and 7.0% and 0.2 and 0.9% d.b., respectively [21]. Such deviation was explained by differences in the depth of cultivation of the seaweeds. These compounds belong to storage carbohydrates since they are utilized as an energy source during winter for new tissue growth [20].

3.2. Effect of Pretreatment with Drying

The blanching process used alternated the color parameters (p < 0.05). The brown-olive color of seaweeds (naked-eye perception) changed to green, the hue increased by 12 and the chrominance changed by 71.0% (see Table 1). In the first year, Saccharina latissima contained the following major pigments: chlorophyll a, fucoxanthin, chlorophyll c and violaxanthin [22]. The green color was caused by washing or decomposition of fucoxanthin pigment during the blanching process [23,24].
It was found that the pigment chlorophyll is more stable against the treatments used. The lightness parameter of the dried raw samples was higher than that of the dried blanched samples (p < 0.05). This was the result of deposition of salts or other water-soluble compounds on the surface of the dried blades, creating a highly reflective layer. Chrominance also showed a higher value (p < 0.05) for dried raw seaweeds.

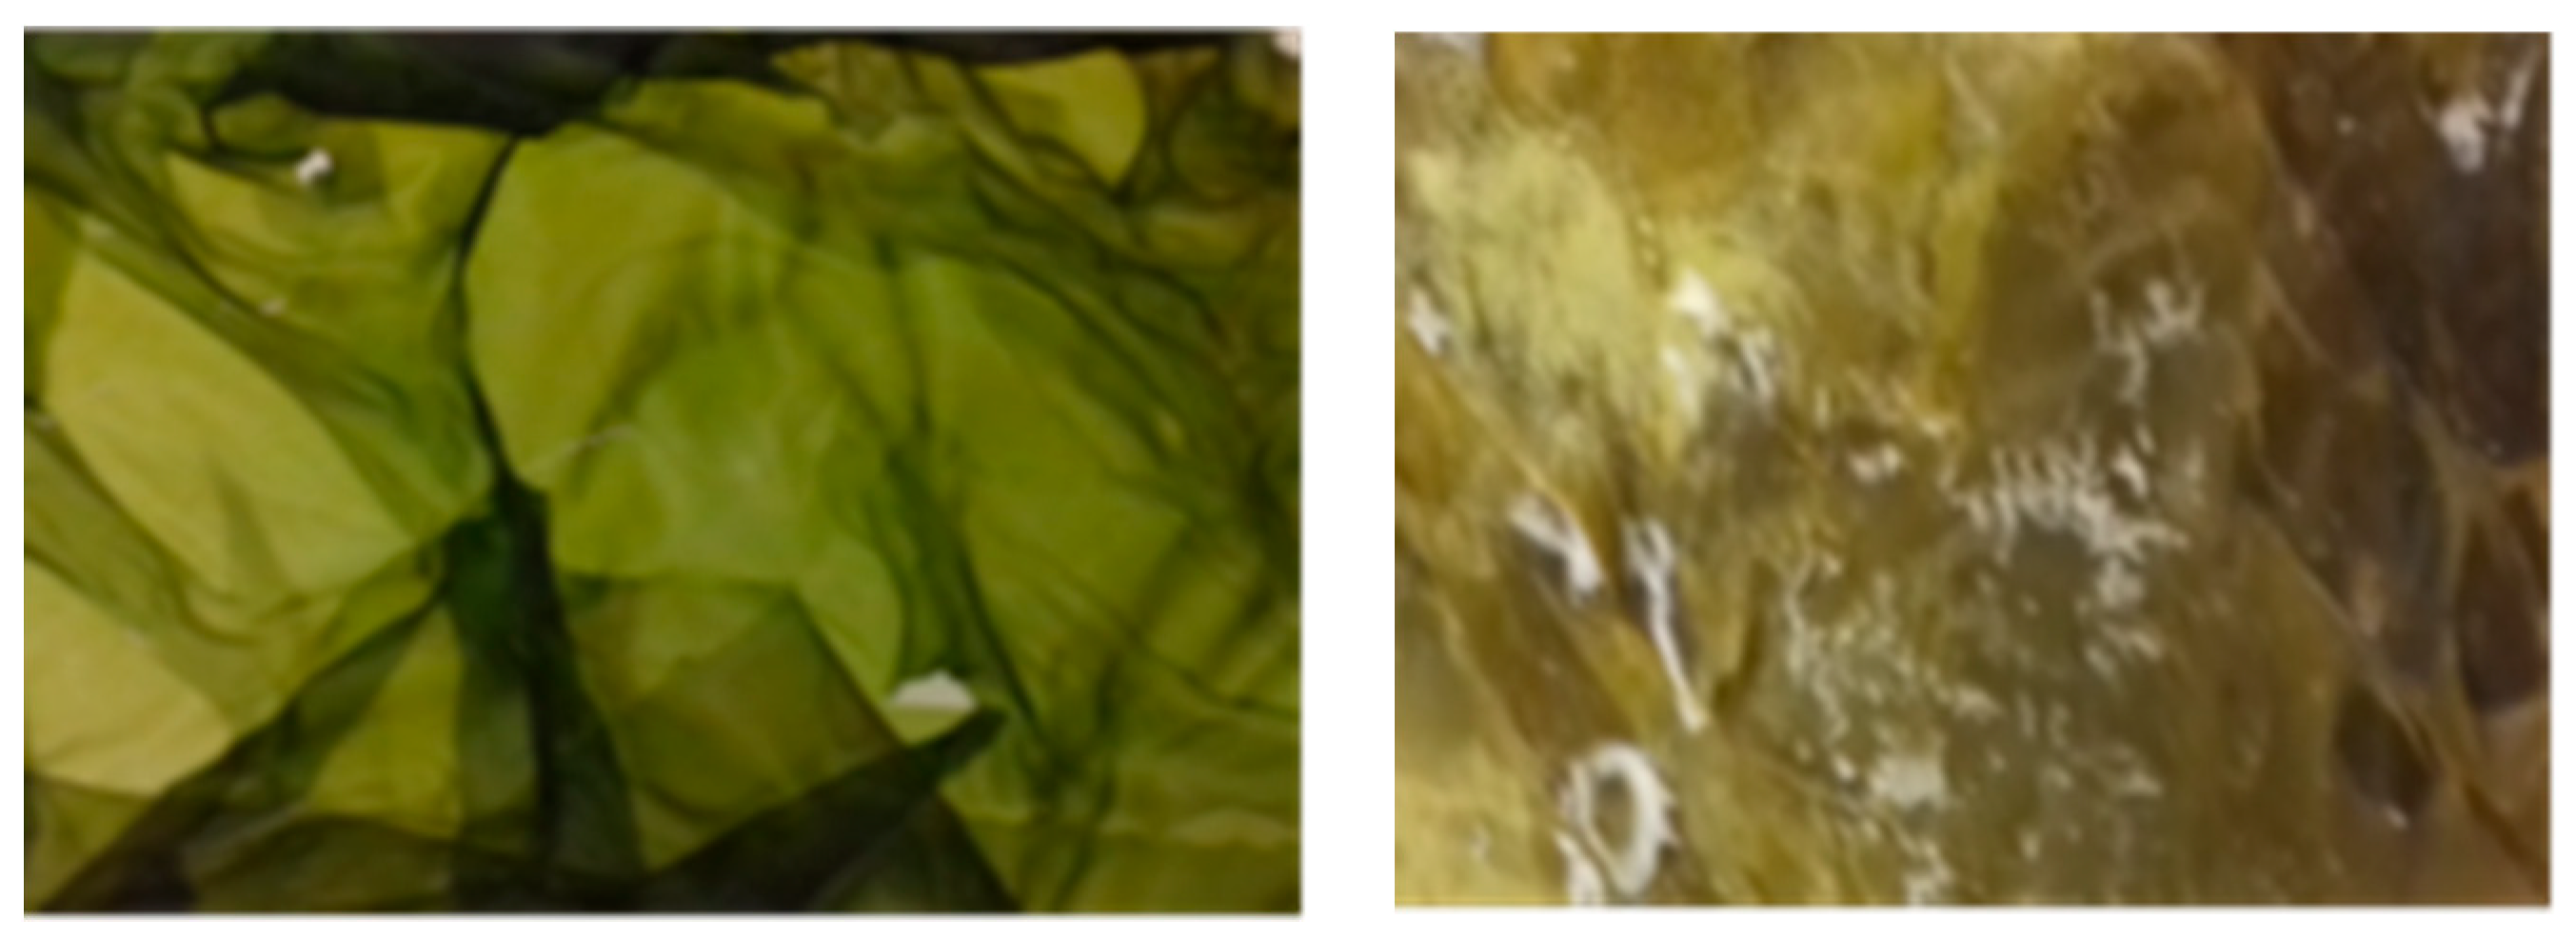
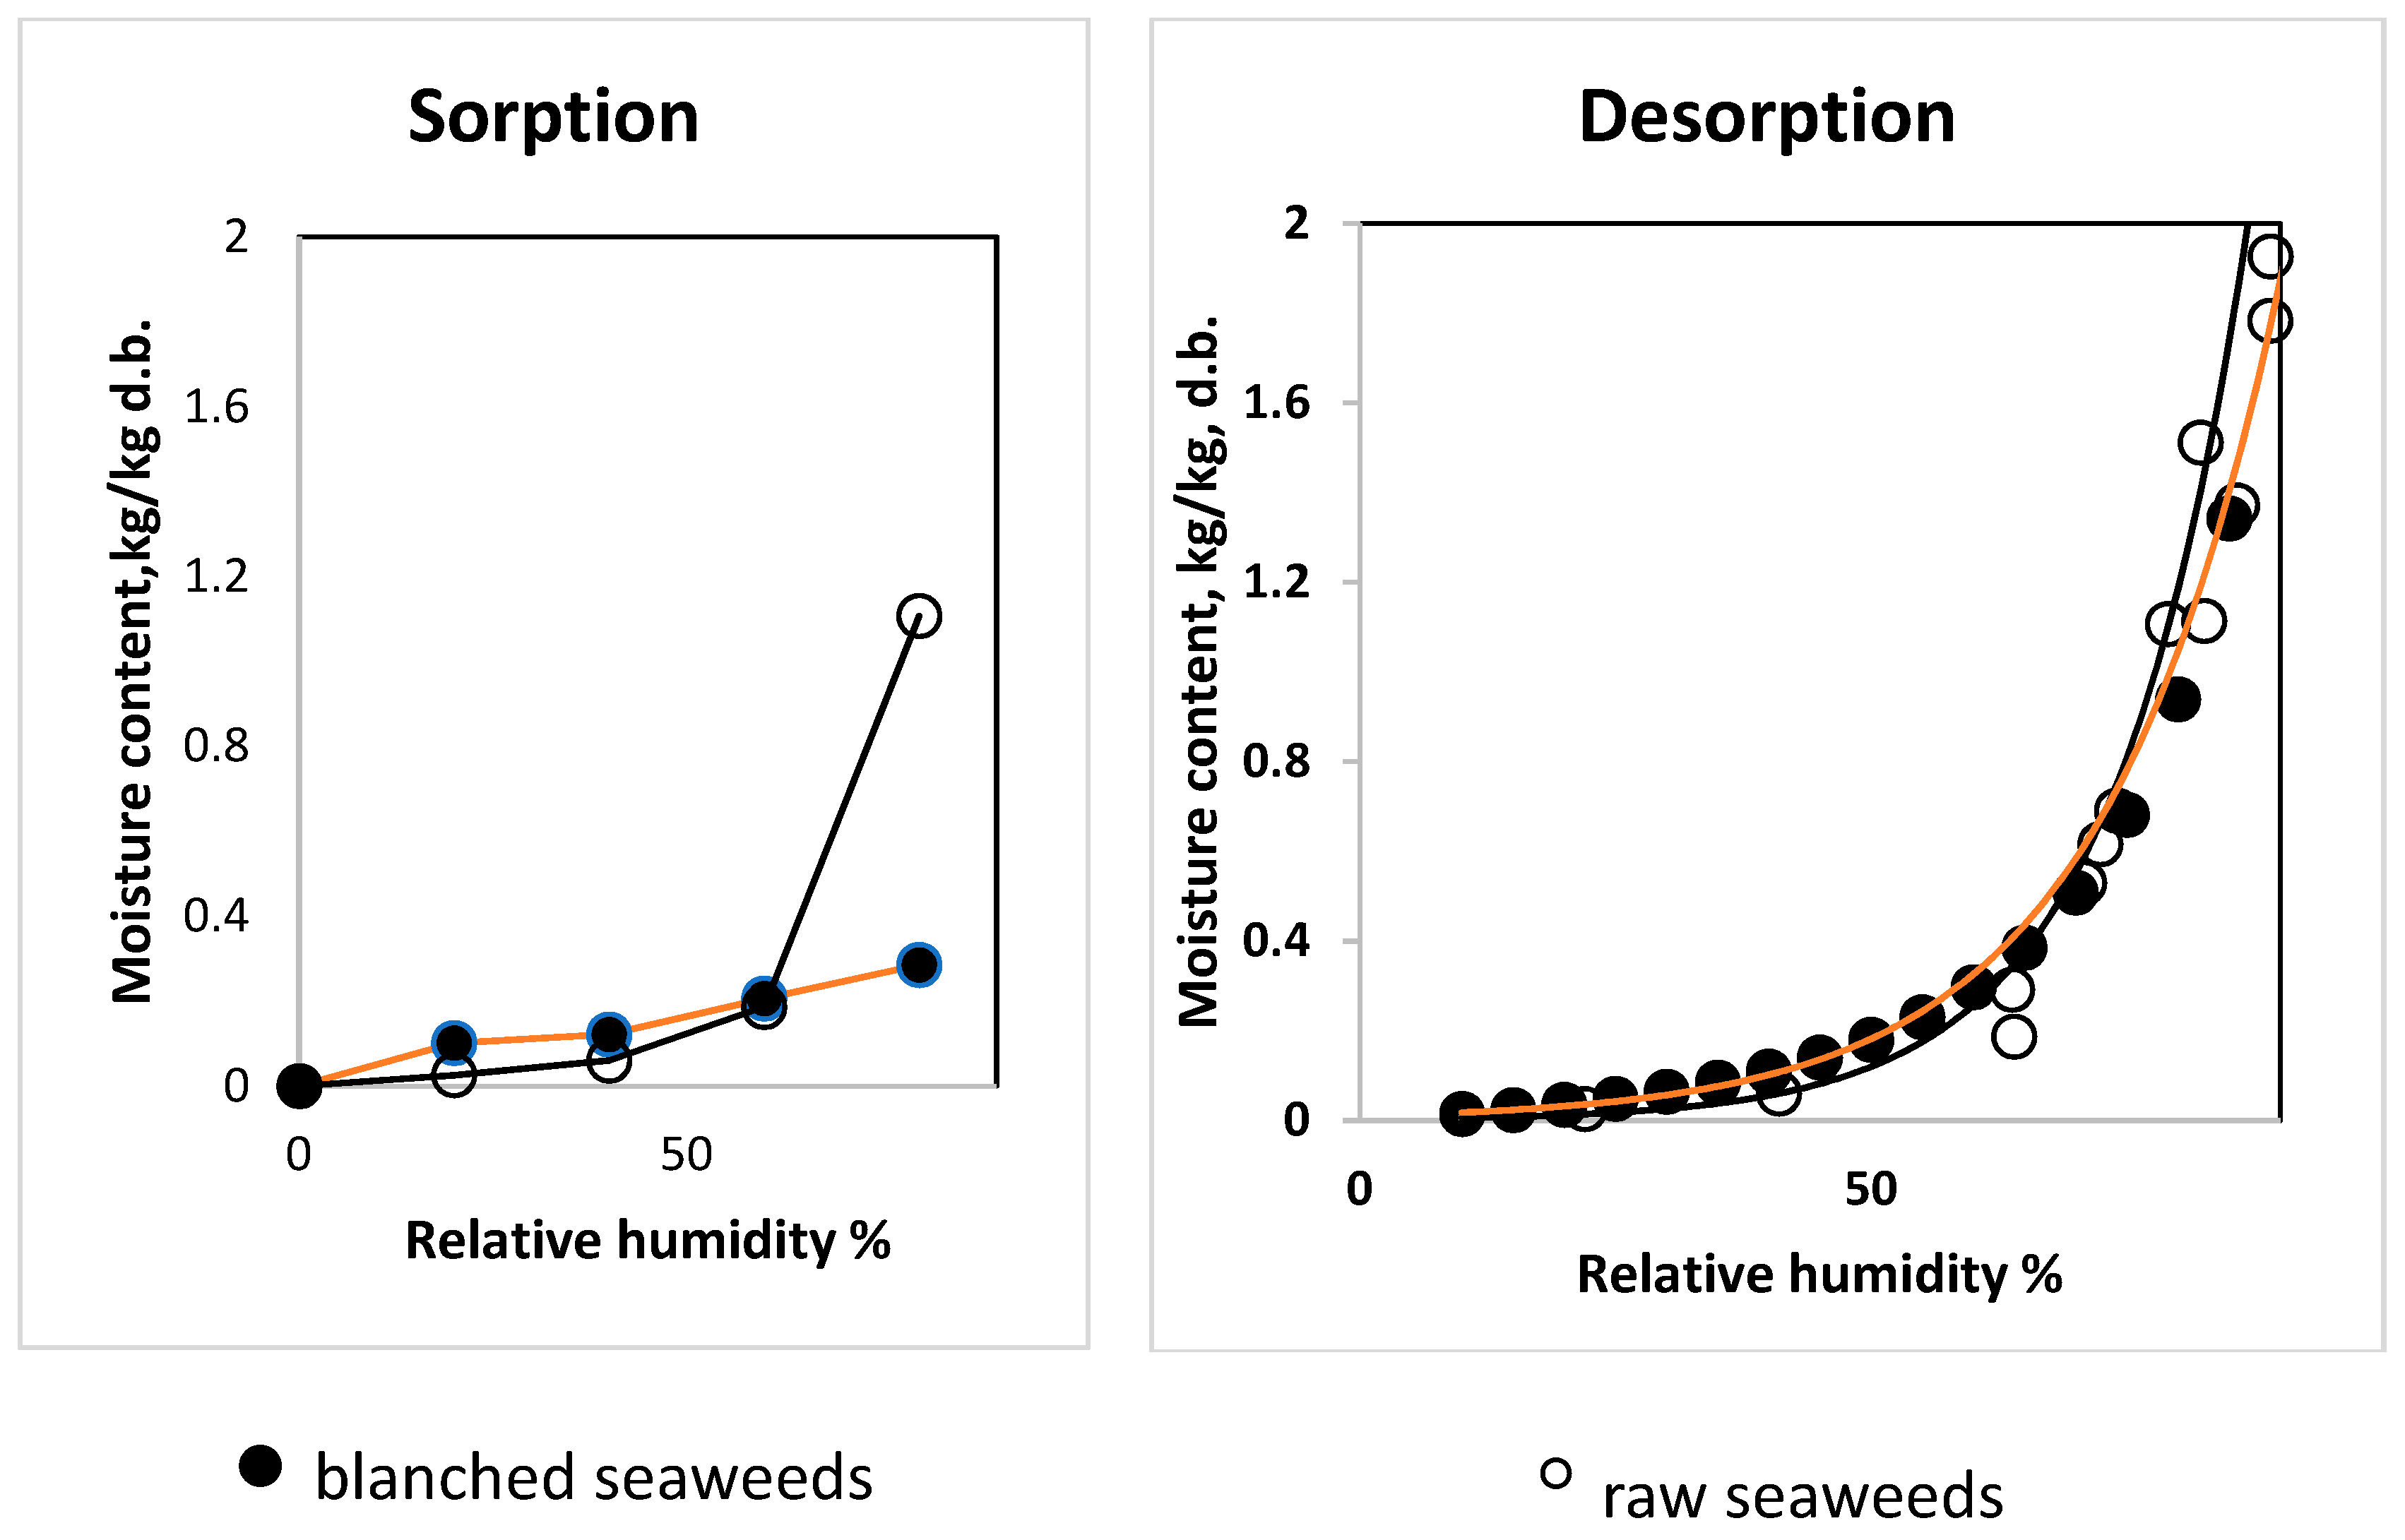
3.3. Influence of Blanching on Sorption–Desorption Characteristics of Saccharina latissimi

The equilibrium moisture content of foods with respect to the relative humidity and temperature of air is essential for the design of drying processes and storage conditions. Sorption behavior was determined for blanched and raw samples at all temperatures. Additional experiments were performed to determine the desorption isotherms for both types at 25.0 °C with the aim of understanding the influence of the drying process on structure.
The raw and blanched seaweeds showed different behavior during the absorption of moisture. Figure 2 shows such behavior at 25 °C. The blanched seaweeds demonstrated a higher accumulation of water when compared with the raw seaweeds at low values (from 20.0 to 40.0% RH. But the trend was different at 60.0% relative humidity. An increase in relative humidity to 80% resulted in a change of moisture in raw seaweed at this temperature, and the blanched seaweed showed a linear trend in the range of RH 20~80%. It is interesting to note that the increase in the equilibrium moisture content of the dried blanched seaweeds was approximately 1% d.b. in the range between 20 and 40% RH. At the same time, raw seaweeds showed an increase in water content by two times in the same RH range. The temperature range 10.0~38.0 °C did not show an effect on the sorption characteristics of blanched seaweeds in the range between 20.0 and 80% RH (p > 0.05). At the same time, the sorption properties of raw seaweeds at 80% RH were significantly lower at the temperature of 10 °C when compared with 25.0 and 38.0 °C (p < 0.05), while at RH in the range between 20.0 and 60.0% the sorption of water was higher at 10.0 °C (p < 0.05). Similar behavior was observed for the red alga Gracilaria in the temperature range 5 to 40 °C [6] and brown seaweed Fucus vesiculosus in the temperature range from 5 to 65 °C [25]. One study determined the sorption behavior at 20.0 °C using powdered sugar kelp (age and harvesting season was not clarified) [19]. The increase in moisture content at higher relative humidity values in all above-mentioned studies showed the influence of carbohydrate compounds in the seaweeds (sugar dissolution). We cannot fully support this statement, considering that the authors referred to research devoted to fruits (mango, pineapple, grape, etc.). The sharp increase in the equilibrium moisture content of raw seaweed at 80% and the relatively low water absorption at a relative humidity below 60.0% may be due to the hygroscopic nature of salts, which occupy a significant share among other compounds. The salt concentration in raw seaweeds was determined at 14.4% d.b., while the blanched seaweeds were salt-free. The study of sorption–desorption of salt–protein mixtures showed the same trend of a sharp increase in moisture content at RHs higher than 75.0% [26].
To consider the influence of alginate on the high sorption capacity of water, we can refer to recent investigations of the moisture sorption properties of sodium alginate (low viscosity) [27] and 0.45 M/G alginate films [28]. There was not any sharp increase in moisture content at a relative humidity of 80.0%. The moisture content did not exceed 0.3 kg kg−1 d.b. at 80.0% relative humidity and 25.0 °C. These values are very close to the values of the blanched seaweeds (0.285 (0.008) kg kg−1 d.b.), while the raw seaweeds showed sorption over 1.0 kg kg−1 d.b. moisture content under the same conditions. Mannitol and cellulose have low water sorption characteristics. Thus, we consider that the application of any of the water sorption models for raw seaweeds does not have any physical relevance until more extensive study is performed in this area.
The desorption isotherms (25 °C) are compared in Figure 2. It is shown that the hysteresis phenomenon was lower for raw seaweed, while the blanched seaweed showed a significant difference. This may have been due to broken cell membranes during freezing and blanching and the water-soluble compounds being washed out and replaced by free water. Significant irreversible shrinkage was obvious during the drying process of the blanched samples.

3.4. Shrinkage Analysis of Samples during Dewatering

Changes in thickness with moisture ratio are expressed as relative values due to the high variation in thicknesses within different parts of the seaweed blade. The thickness decrease was more significant for blanched compared to raw seaweeds (p < 0.05). Raw seaweeds retain their thickness much longer during moisture removal when compared with blanched seaweed. The first observations of the thickness decreasing were observed at an MR of 0.6 and 0.8 for raw and blanched seaweeds, respectively.
The blanching process did not influence the blade’s thickness significantly, and it remained in the same range as for raw seaweeds from 0.08 (±0.02) mm on edges of Saccharina’s blade to 0.7 (±0.1) mm in the middle. At the same time, the moisture content increased from 0.89 (±0.05) kg kg−1 w.b before blanching to 0.95 (±0.05) kg kg−1 w.b. after blanching. Drying resulted in a significant volume change for raw and blanched seaweed, while the surface areas only reduced by 20.0~25.0%.
Decreasing volume (thickness) during convective drying at 25.0 °C can be expressed by simple regression Equation (6):
b o b i = a ( 1 + c × M R i )
where b—thickness of seaweed’s blade, mm; and a and c are empirical parameters, a = 4.615 and 6.039 and c = 5.594 and 6.470 for raw and blanched seaweed, respectively. The quality parameters of the regression equation were obtained as R2 > 0.95, F(Ratio) > 458, Prob(F) = 0.

3.5. Drying Kinetics of Seaweeds

The drying kinetics were investigated for raw and blanched materials. The raw seaweeds started at a moisture content of 900 (50.0)% d.b., which is a relatively high value when compared with other materials commonly used in convective dehydration. The high water content may be due to the life span of seaweeds: they were harvested at the first year of growth on the aquaculture site. Such seaweeds are consumed in salads, as snacks, in soups, etc. The blades of luminaria were thin, and did not have any parasites or sedimentations. The blanching process decreased dry matter, most likely due the significant loss of salt and other water-soluble compounds during blanching. Thus, the water content of the blanched seaweeds was found to be 2079.0 (±100.0)% d.b.
The kinetics are shown in Figure 3 at the temperature of 25.0 °C for different layers. Moisture removal of raw seaweed was much faster than blanched. This may be due to the higher moisture content and changes in structure. The increasing temperature accelerated the dewatering of seaweeds for both raw and blanched, and the highest dewatering rate was observed at 38 °C.
The characteristics were modelled by the Newton model, Equation (1), given below:
MR = exp(−kt)
where k—drying constant, min−1.
The model parameters for all drying cases shown were R2 > 0.98; Prob(F) < 0.000014; F(Ratio) > 700. Their drying coefficient k was in the range 0.013~0.0077 min−1 for all temperatures and variations in thickness. If the drying process has a similar influence on the drying kinetics, the coefficient k can be normalized with respect to the thickness of the layers. Equation (1) was introduced with respect to the number of layers:
M R = e x p ( k n o r m z t )
where z is a dimensionless empirical coefficient with the number of layers or the thickness of the layer.
The parameter z is equivalent to the square of the number of layers or the thickness of layers. Also, z was found to be 6 for three layers of seaweeds; this was because of a high variation in the seaweed’s blade thickness, volume reduction and the development of a moisture gradient. The model coefficients for blanched seaweed were determined to be 1, 2 and 4 for one, two and three layers, respectively. The large decrease in thickness during drying influenced this parameter. Even short-term changes can affect its composition. The drying constant was increasing with the temperature and its value was 2–3 times higher for raw seaweeds compared with blanched.
Direct application of Fick’s law (Equation (2)) overestimated the MR value in the beginning of the process (from 1.0 to 0.5 MR, approx.) and underestimated it at the end of drying. Thus, the effective moisture diffusivity coefficient does not reflect the real situation. Shrinkage should be considered; see Equation (3). Thus, the empirical decrease in seaweed blade thickness, Equation (6), was used to modify Equation (8):
x τ b τ x e b e x 0 b 0 x e b e = 8 π n = 0 1 ( 2 n + 1 ) 2 e x p ( ( 2 n + 1 ) 2 π 2 D e f f . s h r k τ 4 ( b o 2 ) 2 )
Direct application of Equation (5) gives an overestimation of drying kinetics in the beginning of the process (from 1.0 to 0.5 MR) and an underestimation at the end of drying. The volume changes were considered in the case of seaweeds, especially for blanched. The decrease in the thickness can be evaluated by simple model Equation (9).
bo/bi = a(1 + n × MR)
where “a” and “n” are empirical parameters: a = 4.615 and 6.039 and n = 5.594 and 6.470 for raw and blanched seaweeds, respectively. Quality of regression equation: R2 > 0.95, F(Ratio) > 458, Prob(F) = 0.
The thickness of blades varied from 0.25 mm (0.05) to 0.08 (0.03), which presented difficulties for the mathematical description of the drying process. The thicker part is situated in the mid-section of the blade (leaf) and the thinner part is on the edges. The average trend of decrease in thickness was used in this study, Figure 3. The change in thickness with respect to moisture content (Equation (5)) can be used to calculate moisture diffusivity with respect to shrinkage, Equation (7) [29].
Equation (8) was successfully applied in the range of MRs from 0.6 to 0.1 for raw seaweed and from 0.8 to 0.1 for blanched seaweed. For higher moisture ratios, Equation (2) can be implemented. The average values of effective moisture diffusivity with respect to shrinkage increased with temperature and reached the highest value of 3.5 × 10⁻¹⁰ m2 s−1 at 38.0 °C. The effective moisture diffusivity of blanched seaweeds was relatively low. There was no statistical difference (p > 0.05) between Deff.shrk for raw and blanched seaweed at 10 and 38 °C due to high standard deviations of the results.
In food plant materials, a salted product shows lower moisture diffusivity than an unsalted material. In our study, osmotic dehydration or/and a higher degree of shrinkage influenced the mass transfer. The results of this study were similar to those of a recent study on Saccharina latissima [19], where the effective moisture diffusivity was determined at 2.95 × 10⁻¹⁰ m s−1 at 40.0 °C and 25.0% RH. A study devoted to the drying of Fucus vesiculosus determined an effective moisture diffusivity at 1.04 × 10⁻¹⁰ m2 s−1 for 35.0 °C 30.0% RH and 2 m s−1 [25].
The blanching process reduced the dry matter, most likely due the significant leaching of salt and other water-soluble compounds (most likely mannitol). The moisture content of the blanched seaweeds was found to be 2079% d.b.

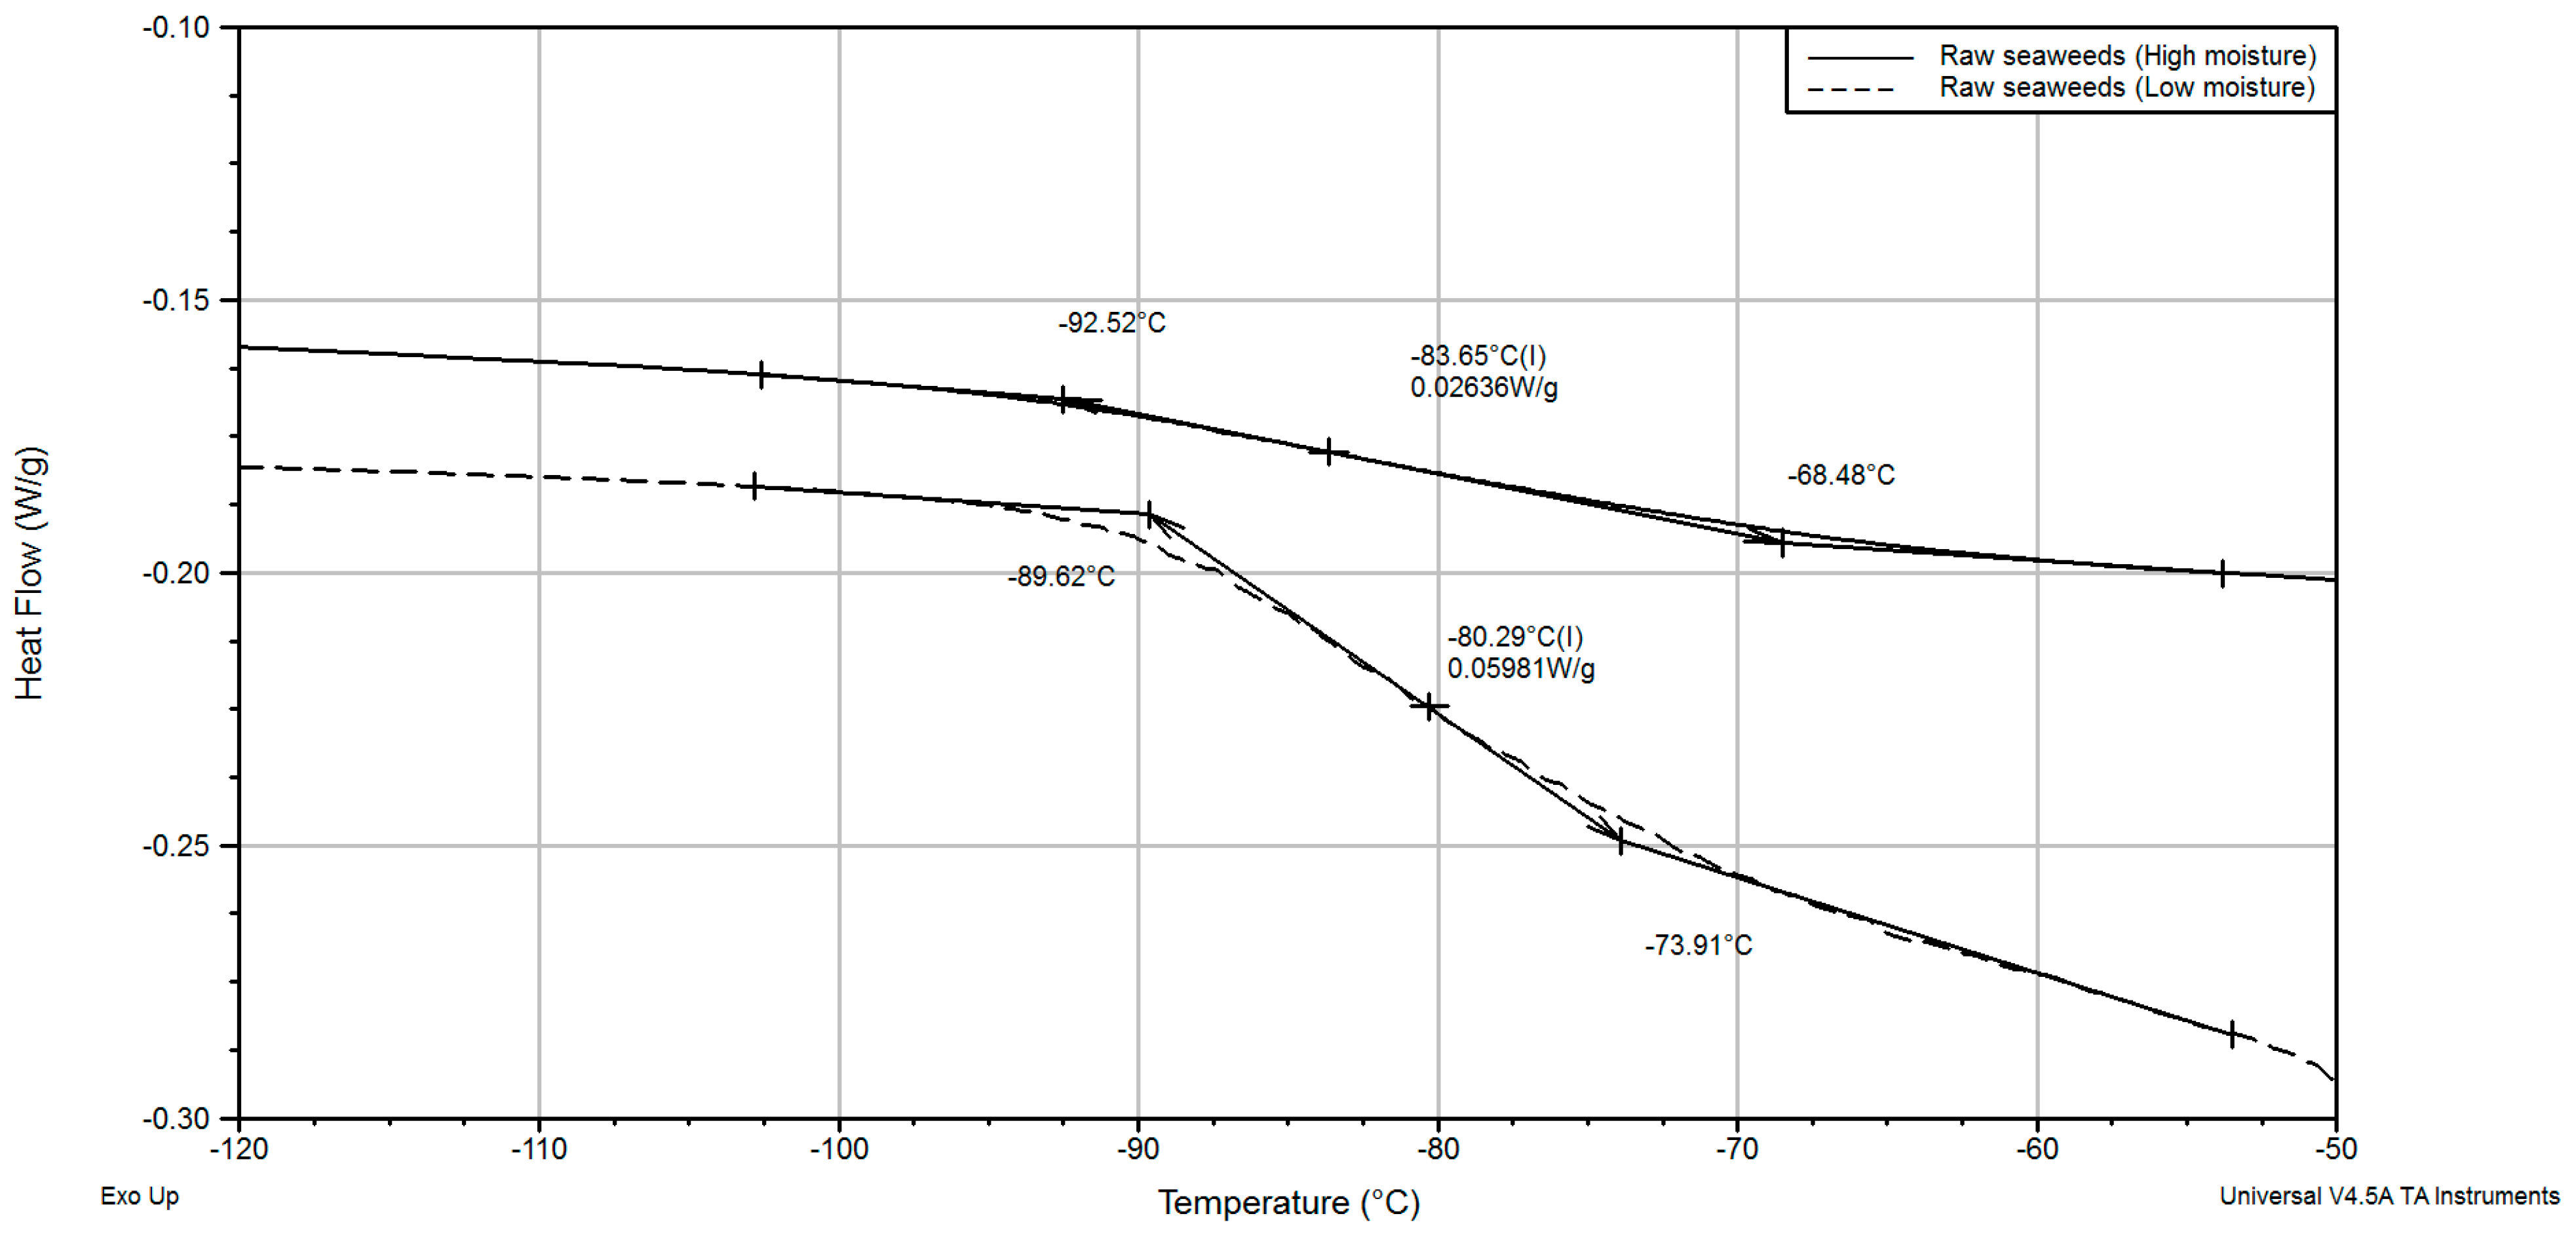
3.6. Thermal Transitions

Knowledge of the state of raw and dried material is very important for understanding the process that happens during convective drying. The compounds in foods can be in several states depending on their nature, temperature and moisture content: crystalline, amorphous and glassy states. Mucilage from the seaweed surface (mucus), obtained as soon as this substance covered surface of the seaweed particles, was analyzed together with raw and blanched seaweeds. It was observed that blanching resulted in a loss of dry matter.
In published research, seaweeds (Irish Brown) showed a diffusivity of 12.2 × 10⁻⁷ m2 s−1 during dehydration [29], which is higher than a diffusivity between 10−9 and 10−12 m2 s−1 [29]. However, this study is in agreement with a recent study [30] where moisture diffusivity was 2.95 × 10⁻¹⁰ m s−1 at 40.0 °C and 25.0% RH.
Table 1 represents information on the thermal transition of raw and blanched seaweeds with different moisture contents. Samples with moisture content below 25.0% did not show any crystallization phenomena in the temperature range −150.0~+100.0 °C. Glass transition was detected in a high-moisture raw seaweed sample (from 35.3 to 85.7% w.b.) in the temperature range −97.0~−73.8 °C. It was observed that the glass transition in those samples was very weak, as observed from the heat flow curve. The glass transition behaviors on the heat flow curve for low- and high-moisture seaweeds are shown in Figure 4. It can be seen that the glass transition step is extended over wide temperature range and it is not so clear for seaweeds with a high moisture content.
Several second-order transitions (glass transitions) were determined in a wide temperature range between −40.0 and 140.0 °C for the dried raw seaweeds with a moisture content below 20.0% w.b., Table 1. An example of such transitions (they are subsequently numbered from (1) to (4)) is shown on Figure 5. The appearance of many glass transitions for low-water-content foods has been reported in research publications [31]. These were due to changes in blends and the thermal history of the sample. Also, immiscible compounds form maximal-freeze concentrations, leading to several glass transitions [32]. The four phase transitions can be explained by the different types of compounds in brown seaweeds, which can undergo glass transition at certain conditions: carbohydrates (alginate, mannitol, cellulose and laminarin) and proteins. These components are not mixed with each other homogeneously in cells and tissues due to natural reasons. The possible presence of crystallization inhibitors, other than salts, can make this process even more complicated [33].
The low-temperature glass transition (1), the medium-temperature glass transition (3) and the high-temperature glass transition (4) depended on the moisture content in the samples. Water acts as plasticizer and decreases the glass transition temperature [34]. Dried blanched seaweeds did not show transitions (1) and (3), while they were detected in vacuum freeze-dried mucus of seaweeds, Figure 5. It is possible that transitions (1) and (3) were influenced by water-soluble compounds (salts, mannitol, laminarin, etc.), because dried blanched seaweeds revealed only transitions (2) and (4).
The temperature of the glass transition was strongly dependent on water and agreed with classic theory. Seaweeds, either blanched or washed in fresh water, did not show second-order transition at temperatures from −150.0 to + 150.0 °C. It is possible that the water-soluble compounds formed are responsible for the maximal-freeze concentration, while other compounds were not. After blanching, the concentration of the compounds, which can form a maximal-freeze concentrated solution, became negligibly small and the glass transition could not be detected by the applied method.
Low-temperature melting peaks (Tf1) were detected for raw seaweed samples with high and low moisture contents, Figure 6. This happens due to the melting of crystallized solutions of soluble compounds and water: salts and carbohydrates. At the same time, a low-temperature melting peak and incipient points of melting were detected at significantly lower temperatures (−45.0 and −55.0 °C) for rehydrated samples when compared with fresh. The reason for such behavior is not clear; it is probably related to some structural changes during drying.
Larger differences were found in incipient melting points between raw and washed (blanched) seaweeds. Raw seaweeds showed T’m at −40 °C, and the incipient point of melting for blanched and washed seaweeds was in the range −20.0 to −17.0 °C. The melting peak of blanched seaweeds was very narrow and located in the vicinity of 0.0 °C, Figure 6. The shape of the peak and its position are more common for the freezing of free (pure) water rather than the freezing of foods. It was evident that even short-term pretreatment totally removed some compounds or reduced their concentrations so significantly that they had no influence on the melting profile or freezing point.
A typical state diagram represents the freezing and glass transition curves. The freezing curve represents the influence of the solid matter on the lowering freezing point. It was obtained from the data of the freezing point of samples with different moisture contents. The decreasing trend of the freezing point was modeled with the modified Clausius–Clapeyron equation for food [35], Equation (10):
δ = −βMwln(1 − xsBxs1 − xsBxs + Rxs)
The glass transition curve shows the effect of solid content on glass transition temperature and was modeled with the Gordon–Taylor equation [36], Equation (11):
Tgi = xsTgi·s + kxwTgi·wxs + kxw
The inflection glass transition points values were used for modeling. The parameters of the models are introduced in Table 2 and Figure 5.
The medium glass transition (2) was detected irrespective of moisture content in the dried raw and dried blanched seaweeds. It should be noted that second-order transitions (1), (2) and (3) were smooth and their onset and end points were determined in a wide temperature range. However, the high-temperature transition (4) appeared as a classical step on a heat flow curve with a relaxation event.
In addition, two glass transitions were determined in raw seaweeds and fresh seaweed mucus at ultra-low temperatures (when the maximal-freeze concentration was formed), Figure 6,. While the blanched seaweeds did not show any second-order transition in the temperature range between −150.0 and −17.0 °C (end of freezing point), low-temperature glass transitions were detected in high-moisture raw seaweed samples (from 35.3 to 88.7% w.b.) in a temperature range between −97.0 (onset) and −73.8 °C (end) and −64.0 (onset) and −54.0 °C (end). The seaweed’s mucus showed two strong glass transitions at relatively higher temperatures when compared with raw seaweeds. It was shown that the glass transition in the samples was very weak. In a previous similar study by [20], only one glass transition event was shown.
Another thermal event, which was determined by DSC analysis of dried seaweeds, was the endothermic melting peak in the temperature range between 141.9 and 167.9 °C (partly visible on, upper right corner, heat flow of dried raw seaweeds). This can be explained by the melting of crystalline mannitol, which is one of the compounds of Saccharina latissima. The melting points of D-mannitol are influenced significantly by crystal polymorphism (including the thermal history of samples) and salt inclusions: the additional amounts of NaCl can reduce the melting point of D-mannitol form 167.0 °C to 150.0 °C [37]. The melting temperature fluctuated in the above-mentioned temperature range from sample to sample even within the same sample group, which means that compounds are not distributed uniformly within the blade area (surface and inner parts) during drying.
Thus, the phase transition events in seaweeds during drying are complicated due to the high variety of compounds. The dried seaweeds are partly in a glassy state, a partly amorphous and crystalline, when dried at low drying temperatures (air temperature between 10.0 and 38.0 °C). It can be concluded that crystallization and glassy matrix formation take place during the drying process, while some will remain in an amorphous state even at low moisture contents. The influence of the glassy state on the shrinkage of the seaweeds is a question for further investigation. However, it is possible to conclude that the water-soluble components of seaweeds are transformed to the glassy state during low-temperature drying.

4. Conclusions

The drying behavior of brown seaweeds, both raw and blanched, were investigated in a temperature range of 10.0 to 38.0 °C. The dehydration process of raw seaweeds took less time when compared with blanched due to the higher effective moisture diffusivity and lower initial moisture content in raw seaweeds. The effective moisture diffusivity with respect to shrinkage was found in the range between 0.5 and 5.0 × 10⁻¹⁰ m2/s. Thus, the drying of blanched seaweeds is a more energy-consuming process when compared with the drying of raw seaweeds.
Also, a high degree of shrinkage was detected when drying blanched seaweeds. At the same time, the drying process of raw seaweeds strongly depended on the RH of the drying air due to the hygroscopicity of salts. The sorption characteristics of blanched seaweeds did not show a sharp increase in moisture content at high RH. The findings contribute to the understanding of the drying and glass transition of seaweeds and have practical value for the evaluation and improvement of drying systems.
The investigation of different drying methods of seaweeds and the effect of temperature is important for further applications and helpful for potential climate change mitigation strategies.

Author Contributions

Conceptualization, T.M.E.; Formal analysis, M.B., M.S. and I.P.; Investigation, I.T.; Writing—review & editing, W.S. All authors have read and agreed to the published version of the manuscript.

Funding

This research received no external funding.

Data Availability Statement

Data are contained within the article. If someone interested ask from Authors any further information.

Conflicts of Interest

Author Michael Bantle, Maren Sæther and Inna Petrova were employed by the company SINTEF Energy Research and Seaweed Energy Solutions. The remaining authors declare that the research was conducted in the absence of any commercial or financial relationships that could be construed as a potential conflict of interest.

Nomenclature

aempirical coefficient
awwater activity, -
bthickness of seaweed blade, mm
C*chrominance (CIE L*C*h* color scale)
cempirical coefficient
Dcoefficient of diffusivity, m2 s−1
d.b.dry basis, kg kg−1
DSCdifferential scanning calorimeter
hhalf-thickness of seaweed layers, m
h*hue angle (CIE L*C*h* color scale), °
kdrying constant, min−1
MRmoisture ratio, -
RHrelative humidity of air, %
Yratio of MR to volume of sample m−3
Emelting energy, kJ
Imass of ice, kg
Llatent heat, kJ kg−1
Ttemperature, °C
w.b.wet basis
xmass fraction kg kg−1
Subscript
bbound water
ffreezing
llipid
mmelting
pprotein
wwater

References

  1. FAO. The State of World Fisheries and Aquaculture: Opportunities and Challenges; FAO: Roma, Italy, 2014. [Google Scholar]
  2. Chopin, T. Seaweed aquaculture provides diversified products, key ecosystem functions Part II. Recent evolution of sea weed industry. Glob. Aquac. Advocate 2012, 14, 24–27. [Google Scholar]
  3. Radulovich, R. Massive freshwater gains from producing food at sea. Water Policy 2011, 13, 547. [Google Scholar] [CrossRef]
  4. Forster, J.; Radulovich, R. Chapter 11—Seaweed and food security A2—Tiwari, Brijesh K. In Seaweed Sustainability; Troy, D.J., Ed.; Academic Press: San Diego, CA, USA, 2015; pp. 289–313. [Google Scholar]
  5. Phang, H.-K.; Chu, C.-M.; Kumaresan, S.; Rahman, M.M.; Yasir, S.M. Preliminary study of seaweed drying under a shade and in a natural draft solar dryer. Int. J. Sci. Eng. 2015, 8, 10–14. [Google Scholar] [CrossRef]
  6. Lemus, R.A.; Pérez, M.; Andrés, A.; Roco, T.; Tello, C.M.; Vega, A. Kinetic study of dehydration and desorption isotherms of red alga Gracilaria. LWT-Food Sci. Technol. 2008, 41, 1592–1599. [Google Scholar] [CrossRef]
  7. Fudholi, A.; Othman, M.Y.; Ruslan, M.H.; Yahya, M.; Zaharim, A.; Sopian, K. Design and testing of solar dryer for drying kinetics of seaweed in Malaysia. In Proceedings of the 4th WSEAS International Conference on Energy and Development-Environment-Biomedicine, Corfu Island, Greece, 22–25 July 2010. [Google Scholar]
  8. Chan, J.C.C.; Cheung, P.C.K.; Ang, P.O. Comparative Studies on the Effect of Three Drying Methods on the Nutritional Composition of Seaweed Sargassum hemiphyllum (Turn.) C. Ag. J. Agric. Food Chem. 1997, 45, 3056–3059. [Google Scholar] [CrossRef]
  9. Gupta, S.; Cox, S.; Abu-Ghannam, N. Effect of different drying temperatures on the moisture and phytochemical constituents of edible Irish brown seaweed. LWT-Food Sci. Technol. 2011, 44, 1266–1272. [Google Scholar] [CrossRef]
  10. Hahn, T.; Lang, S.; Ulber, R.; Muffler, K. Novel procedures for the extraction of fucoidan from brown algae. Process Biochem. 2012, 47, 1691–1698. [Google Scholar] [CrossRef]
  11. Pangestuti, R.; Kim, S.-K. Chapter 6—Seaweed proteins, peptides, and amino acids A2—Tiwari, Brijesh K. In Seaweed Sustainability; Troy, D.J., Ed.; Academic Press: San Diego, CA, USA, 2015; pp. 125–140. [Google Scholar]
  12. Ignat IEikevik, T.M.; Petrova, I.; Michael, B. Investigation of influence of pre-treatment and low temperature on drying kinetics, sorption isotherms, shrinkage and color of Brown seaweeds (Saccharina latissima). In Proceedings of the International Drying Sysmposium, Valencia, Spain, 11–14 September 2018. [Google Scholar]
  13. Lewis, W.K. The rate of drying of solid materials. Ind. Eng. Chem. 1921, 13, 427–432. [Google Scholar] [CrossRef]
  14. Crank, J. Mathematics of Diffusion; Clarendn Press: Oxford, UK, 1975. [Google Scholar]
  15. Arévalo-Pinedo, A.; Murr, F.E.X. Kinetics of vacuum drying of pumpkin (Cucurbita maxima): Modeling with shrink age. J. Food Eng. 2006, 76, 562–567. [Google Scholar] [CrossRef]
  16. AOAC. Association of Official Analytical Chemists, 19th ed.; AOAC: Arlington, VA, USA, 2012. [Google Scholar]
  17. Tolstorebrov, I.; Eikevik, T.M.; Bantle, M. Thermal phase transitions and mechanical characterization of Atlantic cod muscles at low and ultra-low temperatures. J. Food Eng. 2014, 128, 111–118. [Google Scholar] [CrossRef]
  18. Riedel, L. Chemie Ingenieur Technik; Wiley: Hoboken, NJ, USA, 1954; Volume 26, ISSN 0009-286X. [Google Scholar]
  19. Fleurence, J. Seaweed proteins. Trends Food Sci. Technol. 1999, 10, 25–28. [Google Scholar] [CrossRef]
  20. Sappati, P.K.; Nayak, B.; van Walsum, G.P. Effect of glass transition on the shrinkage of sugar kelp (Saccharina latissima) during hot air convective drying. J. Food Eng. 2017, 210, 50–61. [Google Scholar] [CrossRef]
  21. Schiener, P.; Black, K.D.; Stanley, M.S.; Green, D.H. The seasonal variation in the chemical composition of the kelp species Laminaria digitata, Laminaria hyperborea, Saccharina latissima and Alaria esculenta. J. Appl. Phycol. 2015, 27, 363–373. [Google Scholar] [CrossRef]
  22. Tønder, T. A Study of the Seasonal Variation in Biochemical Composition of Saccharina latissima. Master’s Thesis, Norwegian University of Science and Technology, Trondheim, Norway, 2014. Available online: http://hdl.handle.net/11250/245494 (accessed on 24 December 2023).
  23. Hallerud, C.B. Pigment Composition of Macroalgae from a Norwegian Kelp Forest. Master’s Thesis, Norwegian Uniwersity of Science and Technology, Trondheim, Norway, 2014. Available online: http://hdl.handle.net/11250/238838 (accessed on 24 December 2023).
  24. Fung, C.A.Y. The Fucoxanthin Content and Antioxidant Properties of Undaria Pinnatifida from Marlborough Sound, New Zealand. Master’s Thesis, Auckland University of Technology, Auckland, New Zealand, 2012. [Google Scholar]
  25. Mise, T.; Ueda, M.; Yasumoto, T. Production of fucoxanthin-rich powder from Cladosiphon okamuranus. Adv. J. Food Sci. Technol. 2011, 3, 73–76. [Google Scholar]
  26. Moreira, R.; Chenlo, F.; Sineiro, J.; Arufe, S.; Sexto, S. Water sorption isotherms and air drying kinetics of Fucus vesiculosus brown seaweed. J. Food Process. Preserv. 2017, 41, e12997. [Google Scholar] [CrossRef]
  27. Lioutas, T.S.; Bechtel, P.J.; Steinberg, M.P. Desorption and adsorption isotherms of meat-salt mixtures. J. Agric. Food Chem. 1984, 32, 1382–1385. [Google Scholar] [CrossRef]
  28. Xiao, Q.; Tong, Q. Thermodynamic properties of moisture sorption in pullulan-sodiumalginate based edible films. Food Res. Int. 2013, 54, 1605–1612. [Google Scholar] [CrossRef]
  29. Olivas, G.I.; Barbosa-Cánovas, G.V. Alginate–calcium films: Water vapor permeability and mechanical properties as affected by plasticizer and relative humidity. LWT-Food Sci. Technol. 2008, 41, 359–366. [Google Scholar] [CrossRef]
  30. Onwude, D.I.; Hashim, N.; Janius, R.B.; Nawi, N.M.; Abdan, K. Modeling the thin-layer drying of fruits and vegetables: A review. Compr. Rev. Food Sci. Food Saf. 2016, 15, 599–618. [Google Scholar] [CrossRef]
  31. Figueroa, Y.; Guevara, M.; Perez, A.; Cova, A.; Sandoval, A.J.; Muller, A.J. Effect of sugar addition on glass transition temperatures of cassava starch with low to intermediate moisture contents. Carbohydr. Polym. 2016, 146, 231–237. [Google Scholar] [CrossRef]
  32. Gaikwad, A.N.; Wood, E.R.; Ngai, T.; Lodge, T.P. Two calorimetric glass transitions in miscible blends containing Poly(ethylene oxide). Macromolecules 2008, 41, 2502–2508. [Google Scholar] [CrossRef]
  33. Izutsu, K.; Yomota, C.; Aoyagi, N. Inhibition of mannitol crystallization in frozen solutions by sodium phosphates and citrates. Chem. Pharm. Bull. 2007, 55, 565–570. [Google Scholar] [CrossRef]
  34. Tolstorebrov, I.; Eikevik, T.M.; Bantle, M. A DSC study of phase transition in muscle and oil of the main commercial fish species from the North-Atlantic. Food Res. Int. 2014, 55, 303–310. [Google Scholar] [CrossRef]
  35. Chen, C.S. Effective molecular weight of aqueous solutions and liquid foods calculated from the freezing point depression. J. Food Sci. 1986, 51, 1537–1539. [Google Scholar] [CrossRef]
  36. Gordon, M.; Taylor, J.S. Ideal copolymers and the second-order transitions of synthetic rubbers in non-crystalline copolymers. J. Appl. Chem. 1952, 2, 493–500. [Google Scholar] [CrossRef]
  37. Telang, C.; Suryanarayanan, R.; Yu, L. Crystallization of D-mannitol in binary mixtures with NaCl: Phase diagram and polymorphism. Pharm. Res. 2003, 20, 1939–1945. [Google Scholar] [CrossRef]
Figure 1. Blanched (left) and raw seaweed (right).
Processes 12 00373 g001
Figure 2. Sorption and desorption isotherms of raw and blanched seaweeds at 25 °C.
Processes 12 00373 g002
Figure 3. Drying curves.
Processes 12 00373 g003
Figure 4. Glass transition temperature modelling.
Processes 12 00373 g004
Figure 5. Comparison of melting peaks of raw and blanched seaweeds. The freezing point for blanched seaweeds was measured by standard methods for pure substances. The above graph shows inflection glass transition points. Charts were produced using a standard system.
Processes 12 00373 g005
Figure 6. Heat flow variation with temperature.
Processes 12 00373 g006
Table 1. Thermal transitions in raw and blanched seaweeds and seaweed mucus.
Sample TypeMoisture Contnet,
kg kg−1 d.b.
Glass Transition, Inflection Point,
°C
Melting of Mannitol, °C
1234
Low moisture content
Raw seaweeds, dried at 105.0 °C0.00335.44n.d.120.45n.d.-
Raw seaweeds, dried at 105.0 °C0.02347.31n.d.118.56n.d.-
Raw seaweeds, dried at 38.0 °C0.03920.3852.1496.98139.91-
Raw seaweeds, dried at 38.0 °C0.0605.5655.3288.83135.25-
Vacuum freeze-dried mucus0.061−5.85n.d.96.02148.02152.99
Vacuum freeze-dried mucus0.065−7.29n.d.96.99139.75166.13
Vacuum freeze-dried mucus0.075−7.99n.d.92.62138.88167.92
Low moisture content, equilibrated in climate chamber
Raw seaweeds, at 10.0 °C0.0792.8246.0792.92Out of range
Blanched seaweeds, at 10.0 °C0.086n.d.48.65n.d.135.74165
Raw seaweeds, at 10.0 °C0.107−0.9349.3283.16138.93156
Raw seaweeds, at 25.0 °C0.1091.5253.4385.66136.53167
Raw seaweeds, at 10.0 °C0.1170.0038.680.38136.49151.98
Raw seaweeds, at 10.0 °C0.136−0.6549.0279.52136.79153.75
Raw seaweeds, at 10.0 °C0.15−30.4152.43Out of range
Blanched seaweeds, at 10.0 °C0.15n.d.47.59n.d.124.93144.46
Raw seaweeds, at 25.0 °C0.165−26.7465.32Out of range
Raw seaweeds, at 25.0 °C0.168−30.6161.6280.56132.33-
Blanched seaweeds, dried at 25.0 °C0.171n.d.50.5n.d.120.84141.96
Blanched seaweeds, dried at 25.0 °C0.174n.d.50.9n.d.122.48140.9
Raw seaweeds, dried at 38.0 °C0.334−78.2238.9Out of range
High-moisture-content seaweeds
Raw seaweeds, dried at 38.0 °C0.874−80.54−60.01Out of range
Raw seaweeds, dried at 38.0 °C0.917−80.32−60.64
Raw seaweeds, at 25.0 °C5.541−83.65−61.91
Raw seaweeds, at 25.0 °C7.398−84.61−61.89
Raw seaweeds7.418−80.98−58.08
Raw seaweeds7.812−82.52−61.94
Raw seaweeds7.828−82.55−57.99
Raw seaweeds8.144−85.33−63.27
Raw seaweeds8.336−83.56−62.48
Raw seaweeds8.707−84.75−61.53
Seaweed mucus11.902−72.39−55.41
Seaweed mucus12.318−76.41−56.59
n.d.: Not detected.
Table 2. Parameters and coefficients of the model.
EquationStatistical AnalysisCoefficients
F-RatioProb(F)R2RB
Clausius–Clapeyron
Raw seaweeds292.5700.976.61 × 10−519.59 × 10⁻²
Blanched seaweeds229.50.000110.981.26 × 10−51.82 × 10⁻²
Gordon–Taylor
Raw seaweeds185.2700.94KTgi·s
9.58151.76
Disclaimer/Publisher’s Note: The statements, opinions and data contained in all publications are solely those of the individual author(s) and contributor(s) and not of MDPI and/or the editor(s). MDPI and/or the editor(s) disclaim responsibility for any injury to people or property resulting from any ideas, methods, instructions or products referred to in the content.

