Abstract
Granite residual soil typically forms complex pore structures and exhibits high water sensitivity due to physical and chemical weathering processes. Changes in initial compaction conditions significantly affect the mechanical and hydraulic properties of in situ granite residual soil subgrades, with these variations fundamentally related to changes in pore structure and soil–water characteristics. This study investigates the pore structure and bimodal soil–water characteristic curve (SWCC) of a compacted granite residual soil through laboratory tests and mercury intrusion porosimetry tests. Nine initial conditions were selected based on potential in situ compaction conditions of subgrades, and their effects on the pore size distribution (PSD) and SWCC were thoroughly analyzed. The results show strong correlations between bimodal pore structure and SWCC. The size and volume of inter-aggregate pores exhibit noticeable changes with initial conditions, affecting SWCC within the low and middle suction range. Conversely, the intra-aggregate pores, which constitute over 60% of the pore structures, remain nearly intact across different initial conditions, resulting in similar SWCCs within the high suction range. As the compaction energy increases, the inter-aggregate pores are compressed and lead to a higher water retention capacity. In addition, as the compaction water content increases, the SWCC becomes less sensitive to compaction energy after the aggregates in the pore structure are fully saturated. Additionally, a three-dimensional bimodal SWCC equation is proposed and validated using test data with an R2 value above 0.98. These findings offer valuable insights for the design and quality control of granite residual soil subgrades.
1. Introduction
Granite is widely distributed in two-thirds of the Earth’s crust. Due to the development of joints in granite, physical and chemical weathering can spread inward along the joints, forming thick weathering crusts [1,2]. The upper soil layer of the weathering crust on granite is known as the granite residual soil, which partly preserves the structure of granite [2,3]. Granite residual soil exhibits distinctive traits, including structural integrity, varied chemical composition, anisotropy, susceptibility to disintegration under loading, and softening upon wetting [4]. Additionally, its characteristics are significantly influenced by the properties of the parent rock, climate conditions, and degree of weathering, leading to distinct regional variations. As highway construction continues to advance, granite residual soil is increasingly utilized as subgrade fill material. However, its adverse characteristics lead to significant challenges in ensuring the long-term performance of subgrade structures.
The in situ granite residual soil subgrades are typically in an unsaturated state, where the pore water pressure within the soil is lower than the pore air pressure. When the pores are connected to the atmosphere, the pore air pressure equals the atmospheric pressure, resulting in a negative pore water pressure. The pressure difference between pore air and pore water, known as matric suction, significantly influences the properties of the subgrade [5,6]. From the perspective of unsaturated soil mechanics, the long-term performance of granite residual soil subgrade is directly related to its unsaturated shear strength and deformation characteristics, which are directly affected by the initial compaction condition, moisture variations, and fill height. Fundamentally, these properties are closely related to the pore structure and soil–water characteristics of the unsaturated soil [6,7]. Variations in compaction water content and initial dry density (i.e., the initial condition) of compacted granite residual soil subgrades result in differences in initial pore structure and initial matric suction, and thus affect hydraulic and mechanical properties [8,9,10]. The determination of SWCC equations can be further utilized to calculate the unsaturated effective stress, and quantitatively predict the mechanical behaviors of granite residual soil subgrades. Therefore, investigating the pore structure and soil–water characteristic curve (SWCC) of granite residual soil under different initial conditions can capture these effects and will be beneficial for designing and ensuring the long-term performance of granite residual soil subgrades [11,12,13].
In the past few decades, several researchers have investigated the effect of the initial conditions on the SWCC. Romero et al. [8] and Romero and Vaunat [14] found that SWCCs change obviously under different initial conditions. Ng and Pang [15,16] and Tarantino [17] investigated the effects of compaction water contents and dry densities on the SWCC and found that the influence of compaction water contents on the SWCC was more significant than the initial dry densities. Birle et al. [9] found that the effect of initial dry density was obvious when the SWCC was expressed by the degree of saturation–matric suction relationship. As the initial dry density increases, the air-entry value of the SWCC increases. In addition, the effects of the initial conditions on SWCCs can be different in different suction ranges.
With the development of microscopic structure detection techniques, it was found that the pore structure of unsaturated soils could be influenced by the initial conditions, and thus affected the SWCC [18]. To obtain the pore structure information, two methods are commonly used: the scanning electronic microscope (SEM) and mercury intrusion porosimetry (MIP) [19,20]. Through MIP tests, the pore structure characteristic can be quantitatively obtained. The pore size distribution of different soils can follow unimodal or bimodal patterns [21,22,23,24,25]. For the soil with a bimodal pore structure, the pores are commonly separated into two categories: the inter-aggregate pores correspond to a larger dominant pore size, and the intra-aggregate pores correspond to a smaller dominant pore size [8,24,25]. The inter-aggregate pores mainly change due to soil compaction, and the intra-aggregate pores change during the soil wetting–drying process [26]. The SWCC of the soil with a bimodal pore size distribution (PSD) is shown as a bimodal “s” curve [27,28,29]. Compared to a unimodal SWCC, the bimodal SWCC was more easily affected by the initial conditions and more complicated to determine [30,31,32].
Although the SWCCs for different initial conditions can be determined, respectively, its application was restricted by the lack of quantitative correlation among these SWCC equations. For this reason, researchers were devoted to propose a single equation to cover the change in SWCCs under different initial conditions. The void ratio (e) is one of the more commonly used indexes to quantify the effects of density on the SWCC, and thus the three-dimensional (3D) SWCC could be presented in the degree of saturation/matric suction/void ratio (Sr-s-e) space. Based on the Van Genuchten model [33] and Fredlund and Xing model [34], several 3D SWCC equations were proposed, as shown in Table 1 [35,36,37,38]. In addition, Wijaya and Leong [39] established a 3D SWCC equation using a transition function and the parameters can be obtained from graphic determination method. However, the equations are mainly established and validated for the unimodal SWCC, the determination of the 3D bimodal SWCC still requires further investigation.

Table 1.
Three-dimensional SWCC equations in related research.
In this paper, a high-liquid limit granite residual soil was sampled from Jiangxi, China. To address the significant variability in the compaction water content and degree of compaction of granite residual soil subgrades, nine different initial conditions were selected based on the potential in situ compaction conditions. The pore size distributions of the granite residual soil were investigated using MIP tests, and the filter paper method and vapor equilibrium method were employed to determine the bimodal SWCC. The corrections between the changes in PSD and SWCC were analyzed in detail. Based on the results, the 3D bimodal SWCC equation was proposed and validated using the test data. These findings will be valuable for the design and quality control of granite residual soil subgrades.
2. Materials and Methods
2.1. Materials
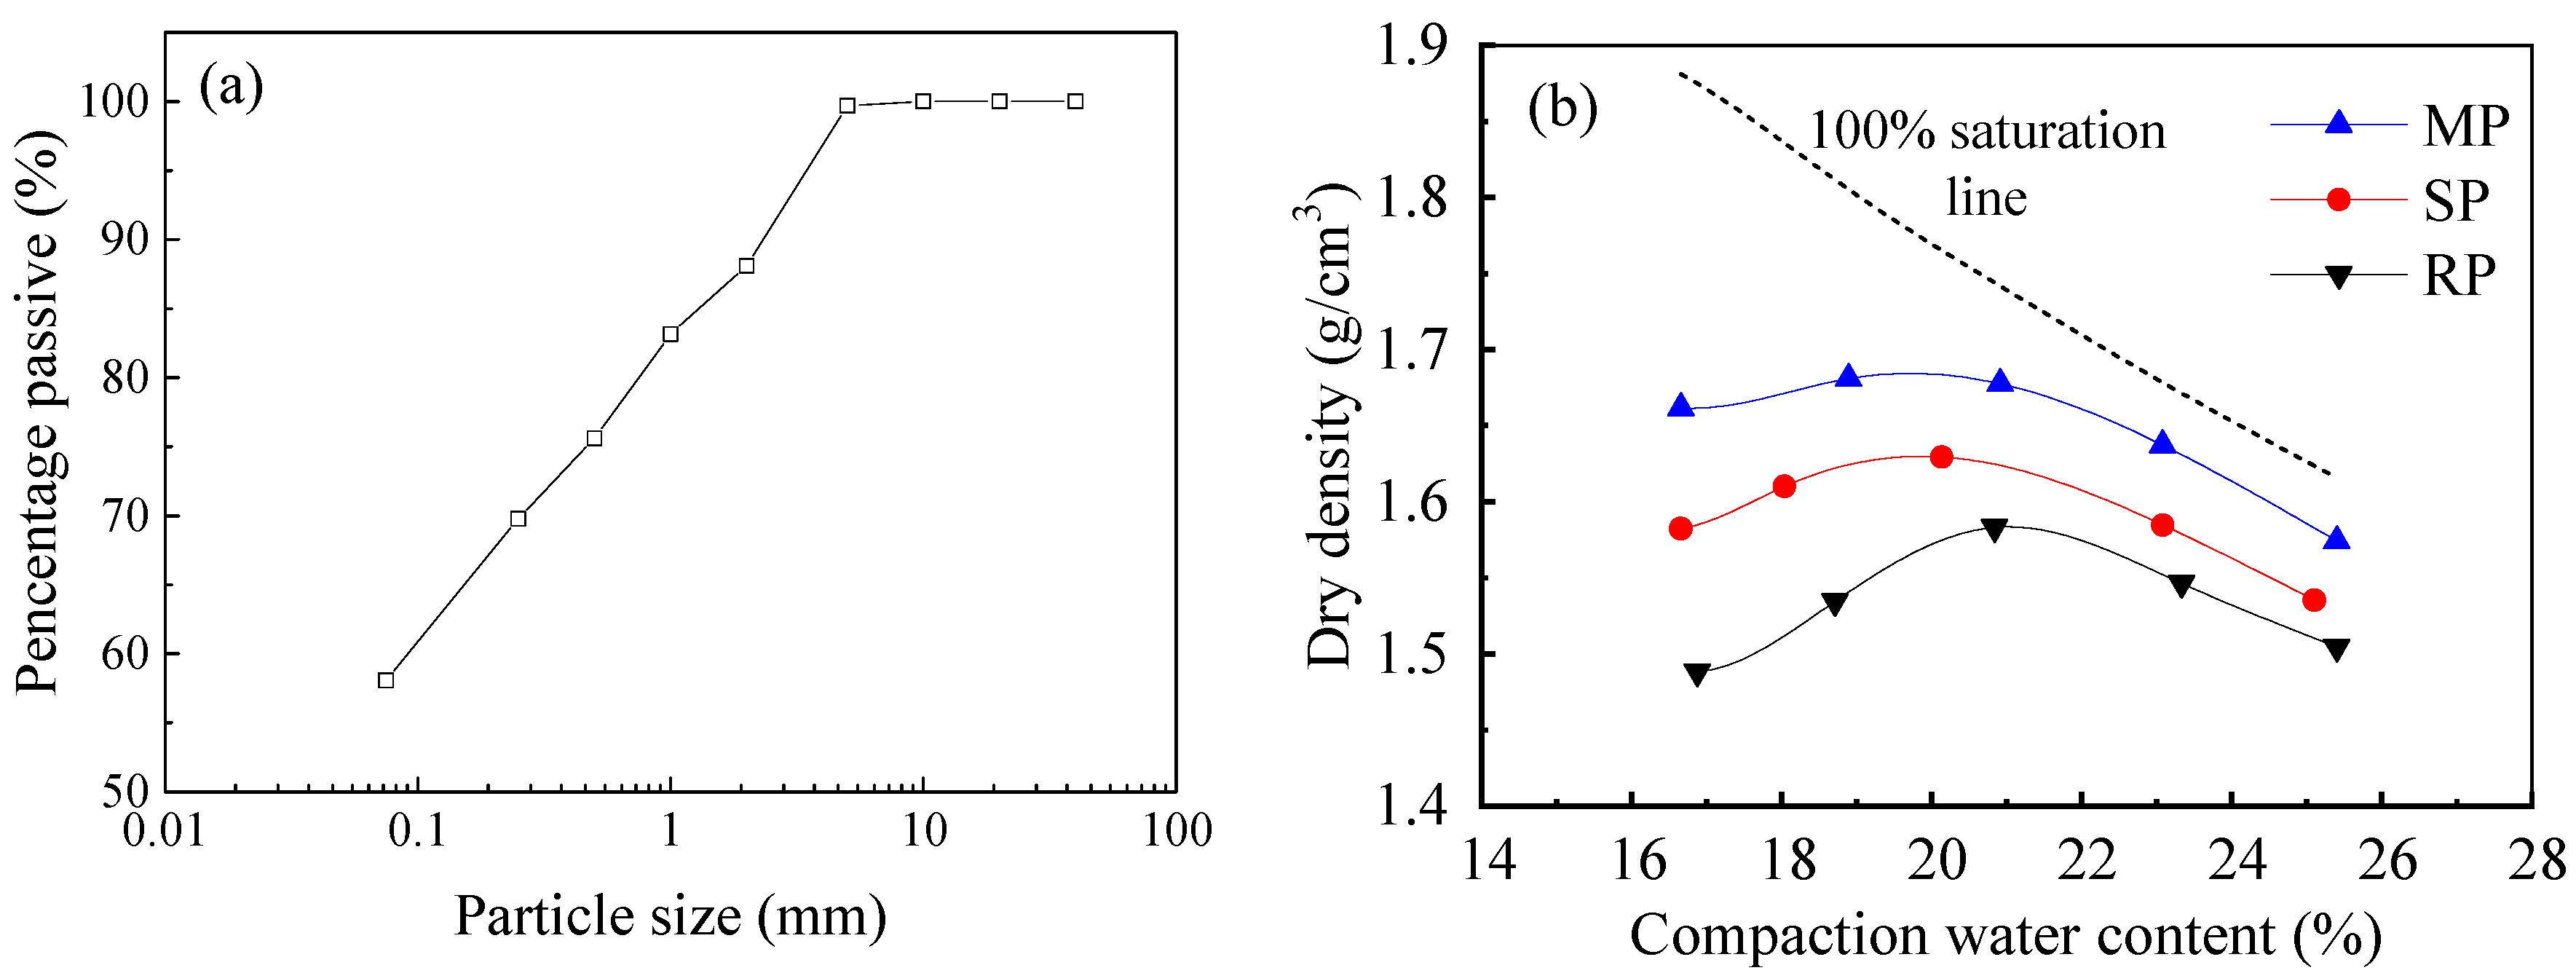
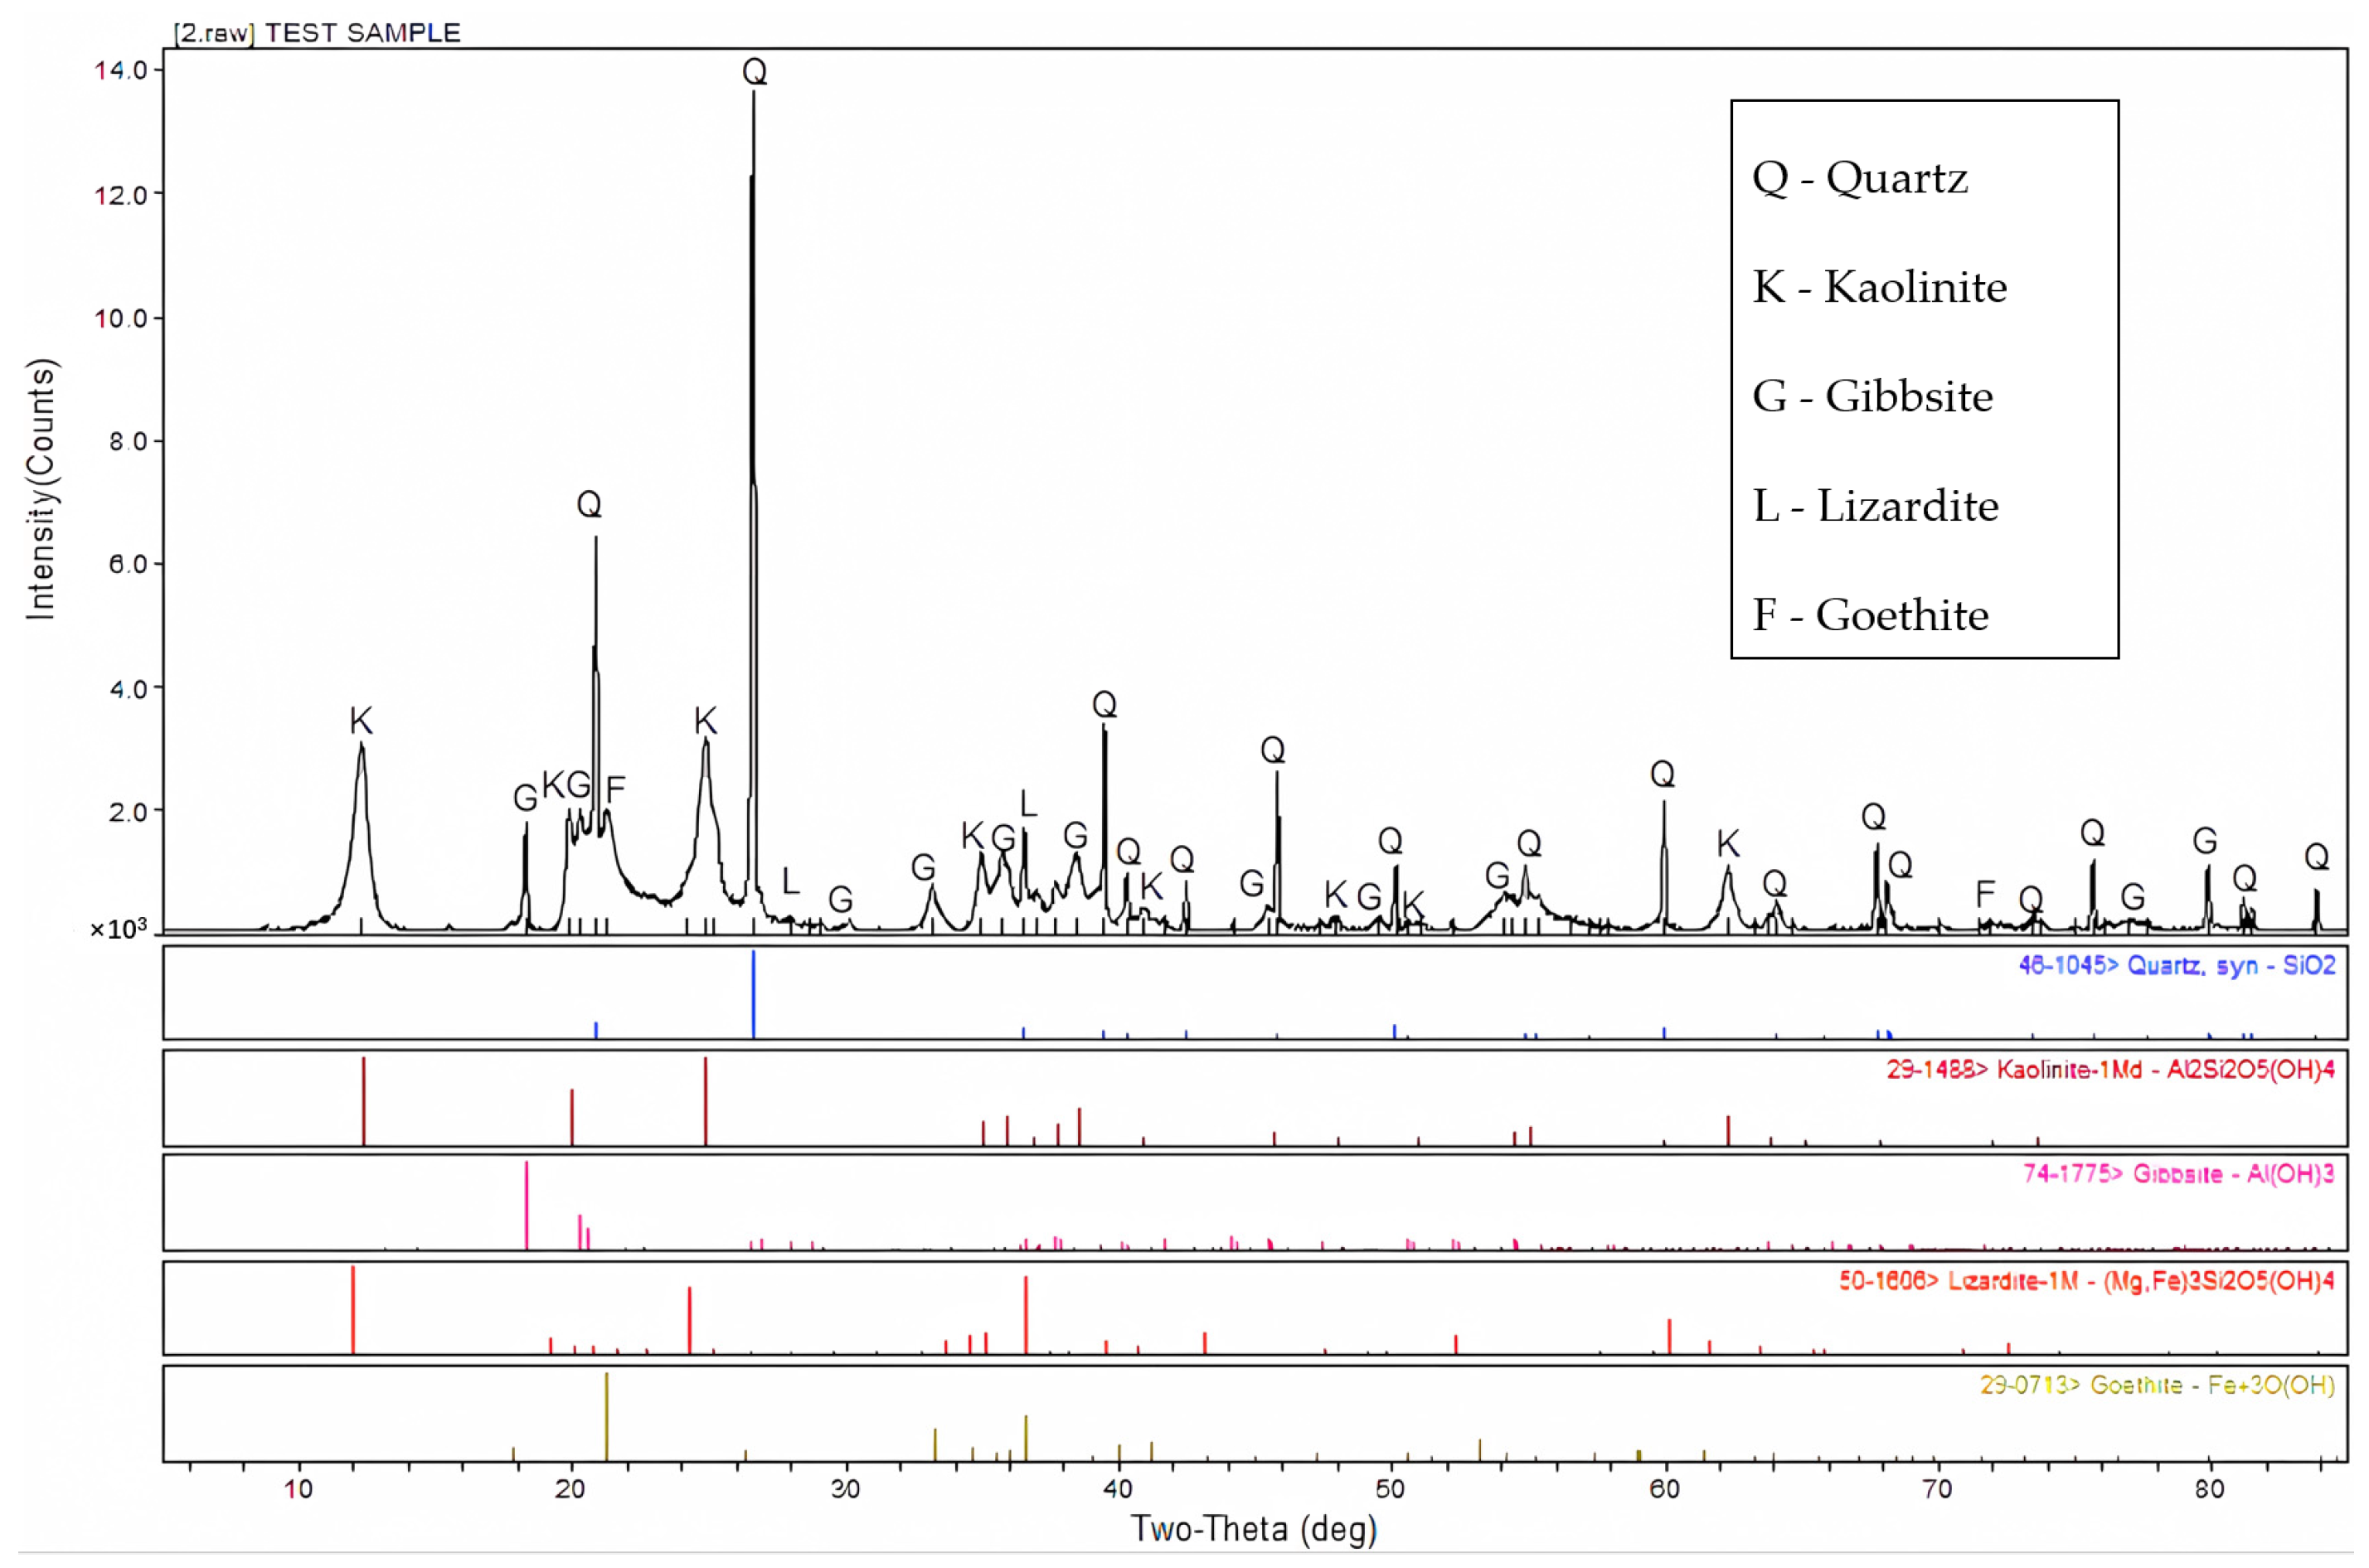
The material utilized in this study was a granite residual soil sampled from Jiangxi, China, with the grain-size distribution curve presented in Figure 1a. The physical properties of the soil were measured following Chinese standard JTG 3430-2020 (2020) [40] and are shown in Table 2. According to the Unified Soil Classification System, the tested soil was classified as a fine-grained high-liquid limit clay (CH). Also, the chemical composition of the tested granite residual soil was analyzed using X-ray powder diffraction (XRD) to obtain X-ray diffraction patterns [41,42,43]. Subsequently, semi-quantitative analysis was conducted using JADE software, as shown in Figure 2. Results indicate that the soil mainly comprises quartz and kaolinite, along with gibbsite, lizardite, and goethite.
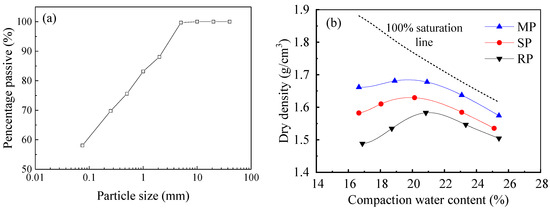
Figure 1.
(a) The grain-size distribution of tested soil and (b) the proctor curves under different compaction energies.
Table 2.
Selected physical properties of the soil.
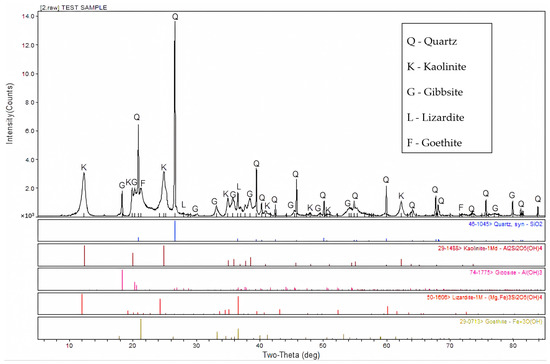
Figure 2.
The X-ray powder diffraction results of the granite residual soil.
To describe the change in the initial conditions of the compacted granite residual soil, nine different initial conditions were selected based on the proctor curves under different compaction energies, as shown in Figure 1b. The dried soil was moistened to three compaction water contents (wc) around the optimum moisture content (OMC), namely OMC − 5%, OMC, and OMC + 5%. After that, a different compaction energy was selected according to JTG 3430-2020 (2020) [40]. The soil specimen of the proctor test was compacted in five layers. For each layer, a compaction hammer with the compaction energy of 2677.2 kJ/m3 was applied for 98, 50, and 30 blows, respectively, and the proctor types were named as modified proctor (MP), standard proctor (SP), and reduced proctor (RP). To prepare test specimens, the air-dried tested soil was passed through 2 mm sieves, mixed with water to reach the compaction water content, and then statically compacted to the target dry density. The compaction water content, initial dry density, and initial void ratio of all test conditions are shown in Table 3.
Table 3.
The compaction water contents and dry densities of the tested initial conditions.
2.2. Test Method
To obtain the SWCC of tested soil, a wide range suction measurement is needed. Therefore, the SWCCs for the low–medium and high suction ranges were measured using the filter paper method and the vapor equilibrium method, respectively. The two tests were conducted under controlled temperature conditions at 20 °C. Additionally, the MIP test was conducted to investigate the pore structure of the soil under different initial conditions.
(1) Filter paper method
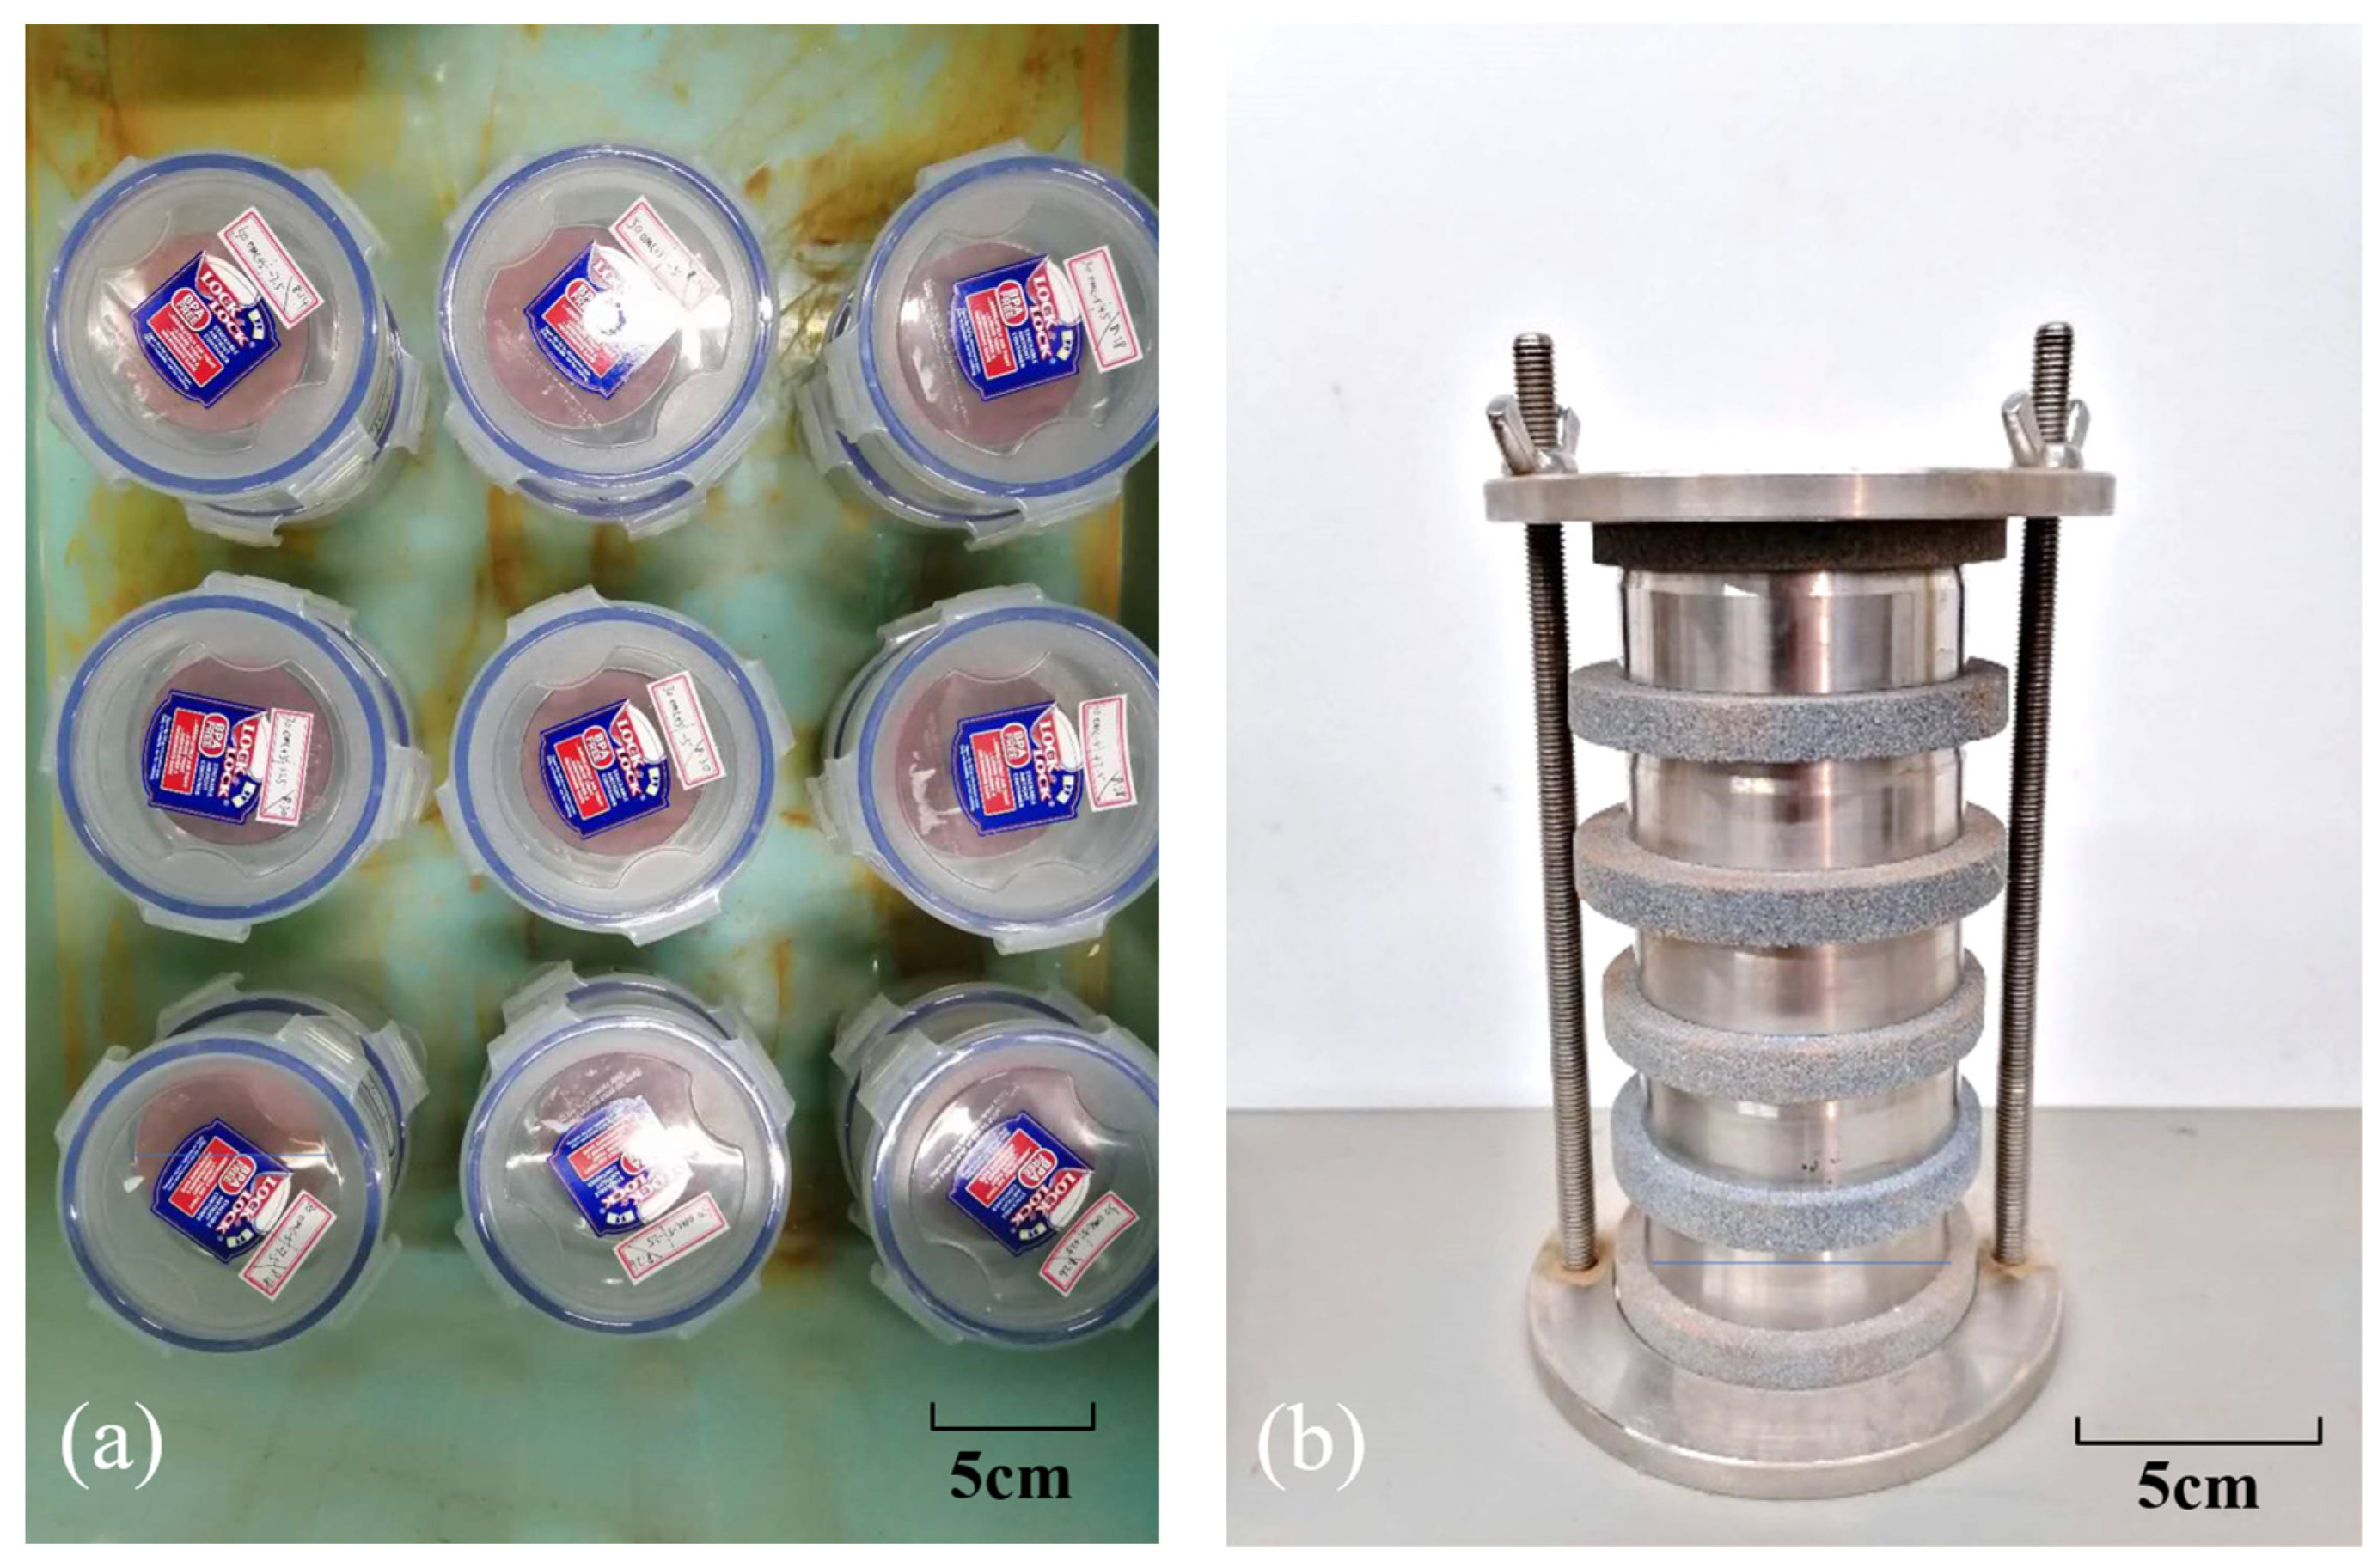
In this paper, the Whatman No. 42 filter paper with a 4.5 cm diameter was utilized. To ensure consistency in the initial conditions, the tested granite residual soil was compacted under the selected initial condition in a cutting ring measuring 6.18 cm in diameter and 2 cm in height, and was vapor-moistened or air-dried to eight different water contents around OMC, specifically OMC − 11.5%, −9.5%, −7.5%, −5%, −2.5%, +0%, +2.5%, +5%. Subsequently, a filter paper was placed between two soil specimens, and the specimens were placed inside a sealed box for 14 days to attain suction equilibrium, as depicted in Figure 3a. After that, the filter paper was weighed using an analytical balance with an accuracy of 0.0001 g. The calibration curve between the water content of the filter paper (wfp) and the matric suction (s) of soils is represented by Equation (1), following ASTM D5298-16 testing protocols [44]:
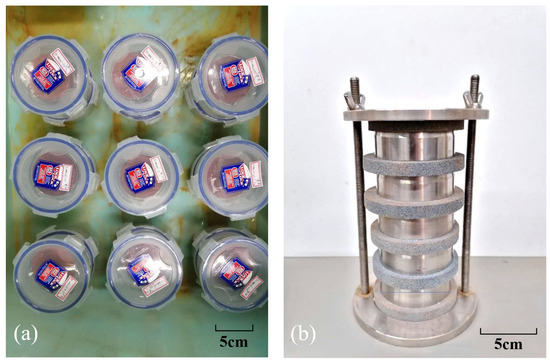
Figure 3.
(a) The placement of filter paper method and (b) the vacuum saturation fixture.
The saturated water content was determined individually using the vacuum saturation chamber (Figure 3b) to acquire the SWCC data point corresponding to zero suction.
(2) Vapor equilibrium method
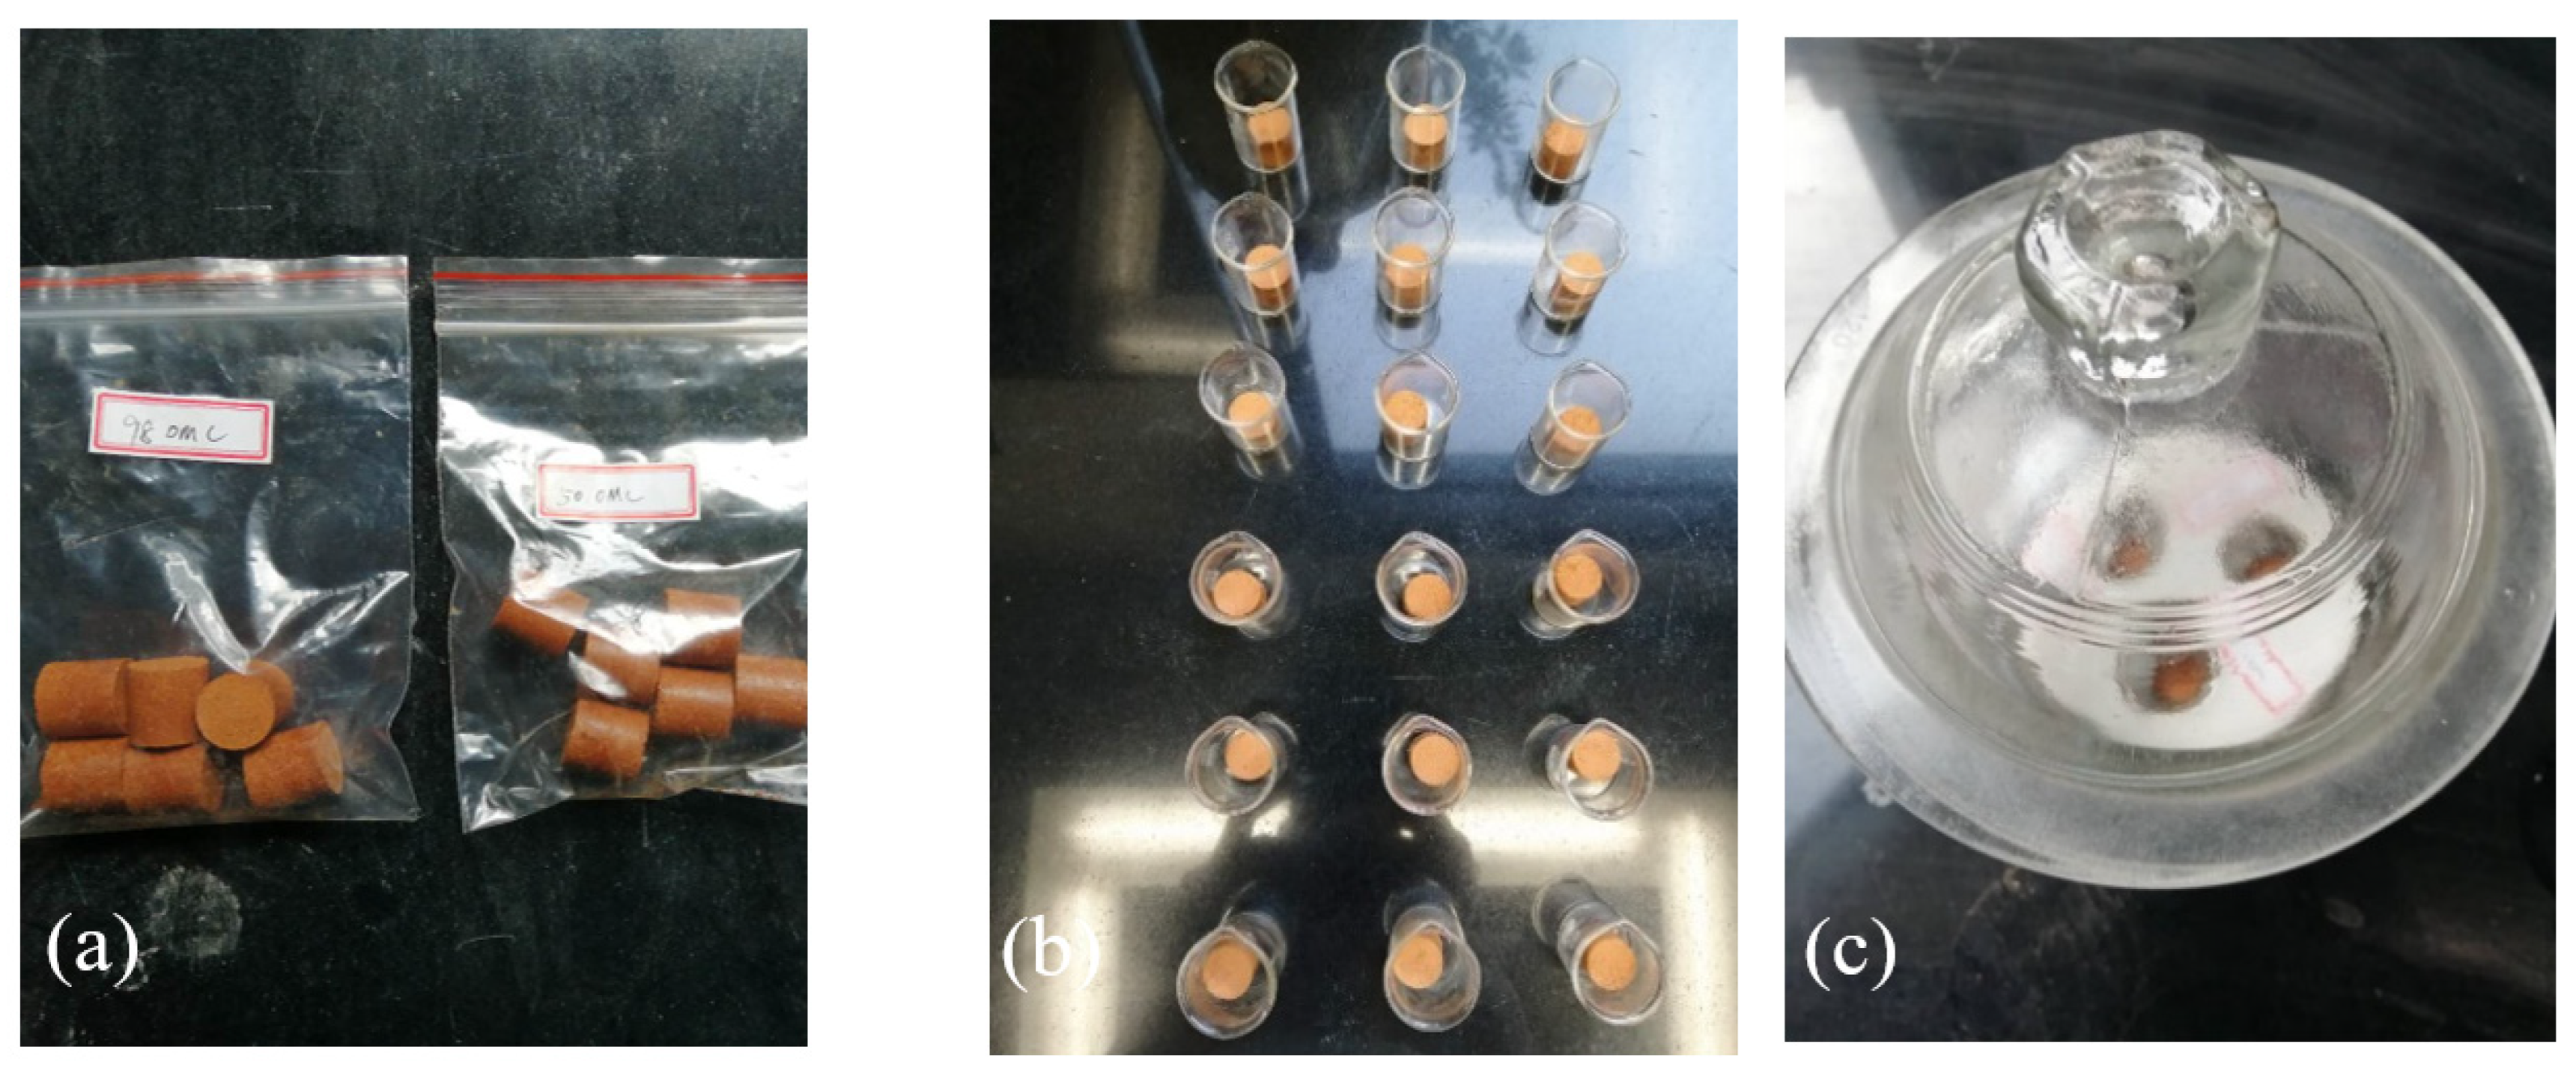
In this paper, supersaturated salt solutions were utilized to provide different relative humidity levels, and different suction values could be obtained via the vapor equilibrium process [45,46]. Five salt solutions were selected and summarized in Table 4. The test procedure is shown in Figure 4. The tested soil was compacted into a 1 cm height cylinder and was placed into a glass beaker. To create a sealed environment, a desiccator fitted with a porous disk was employed, with the specimen placed in a glass beaker suspended above the disk. The specimens were placed in the desiccators for a month to achieve vapor equilibrium. Subsequently, the change in the water content of soil specimens was measured to obtain the SWCC points.
Table 4.
Relative humidity and suction of selected salt solutions.
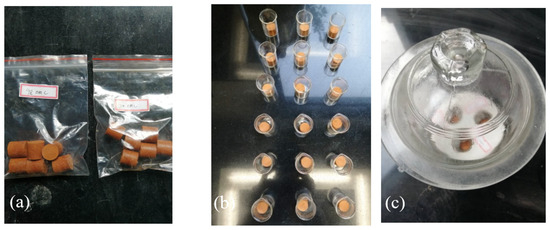
Figure 4.
(a) The compacted soil specimens, (b) the glass beaker and (c) the sealed containers containing selected supersaturated salt solutions.
(3) Mercury intrusion porosimetry test
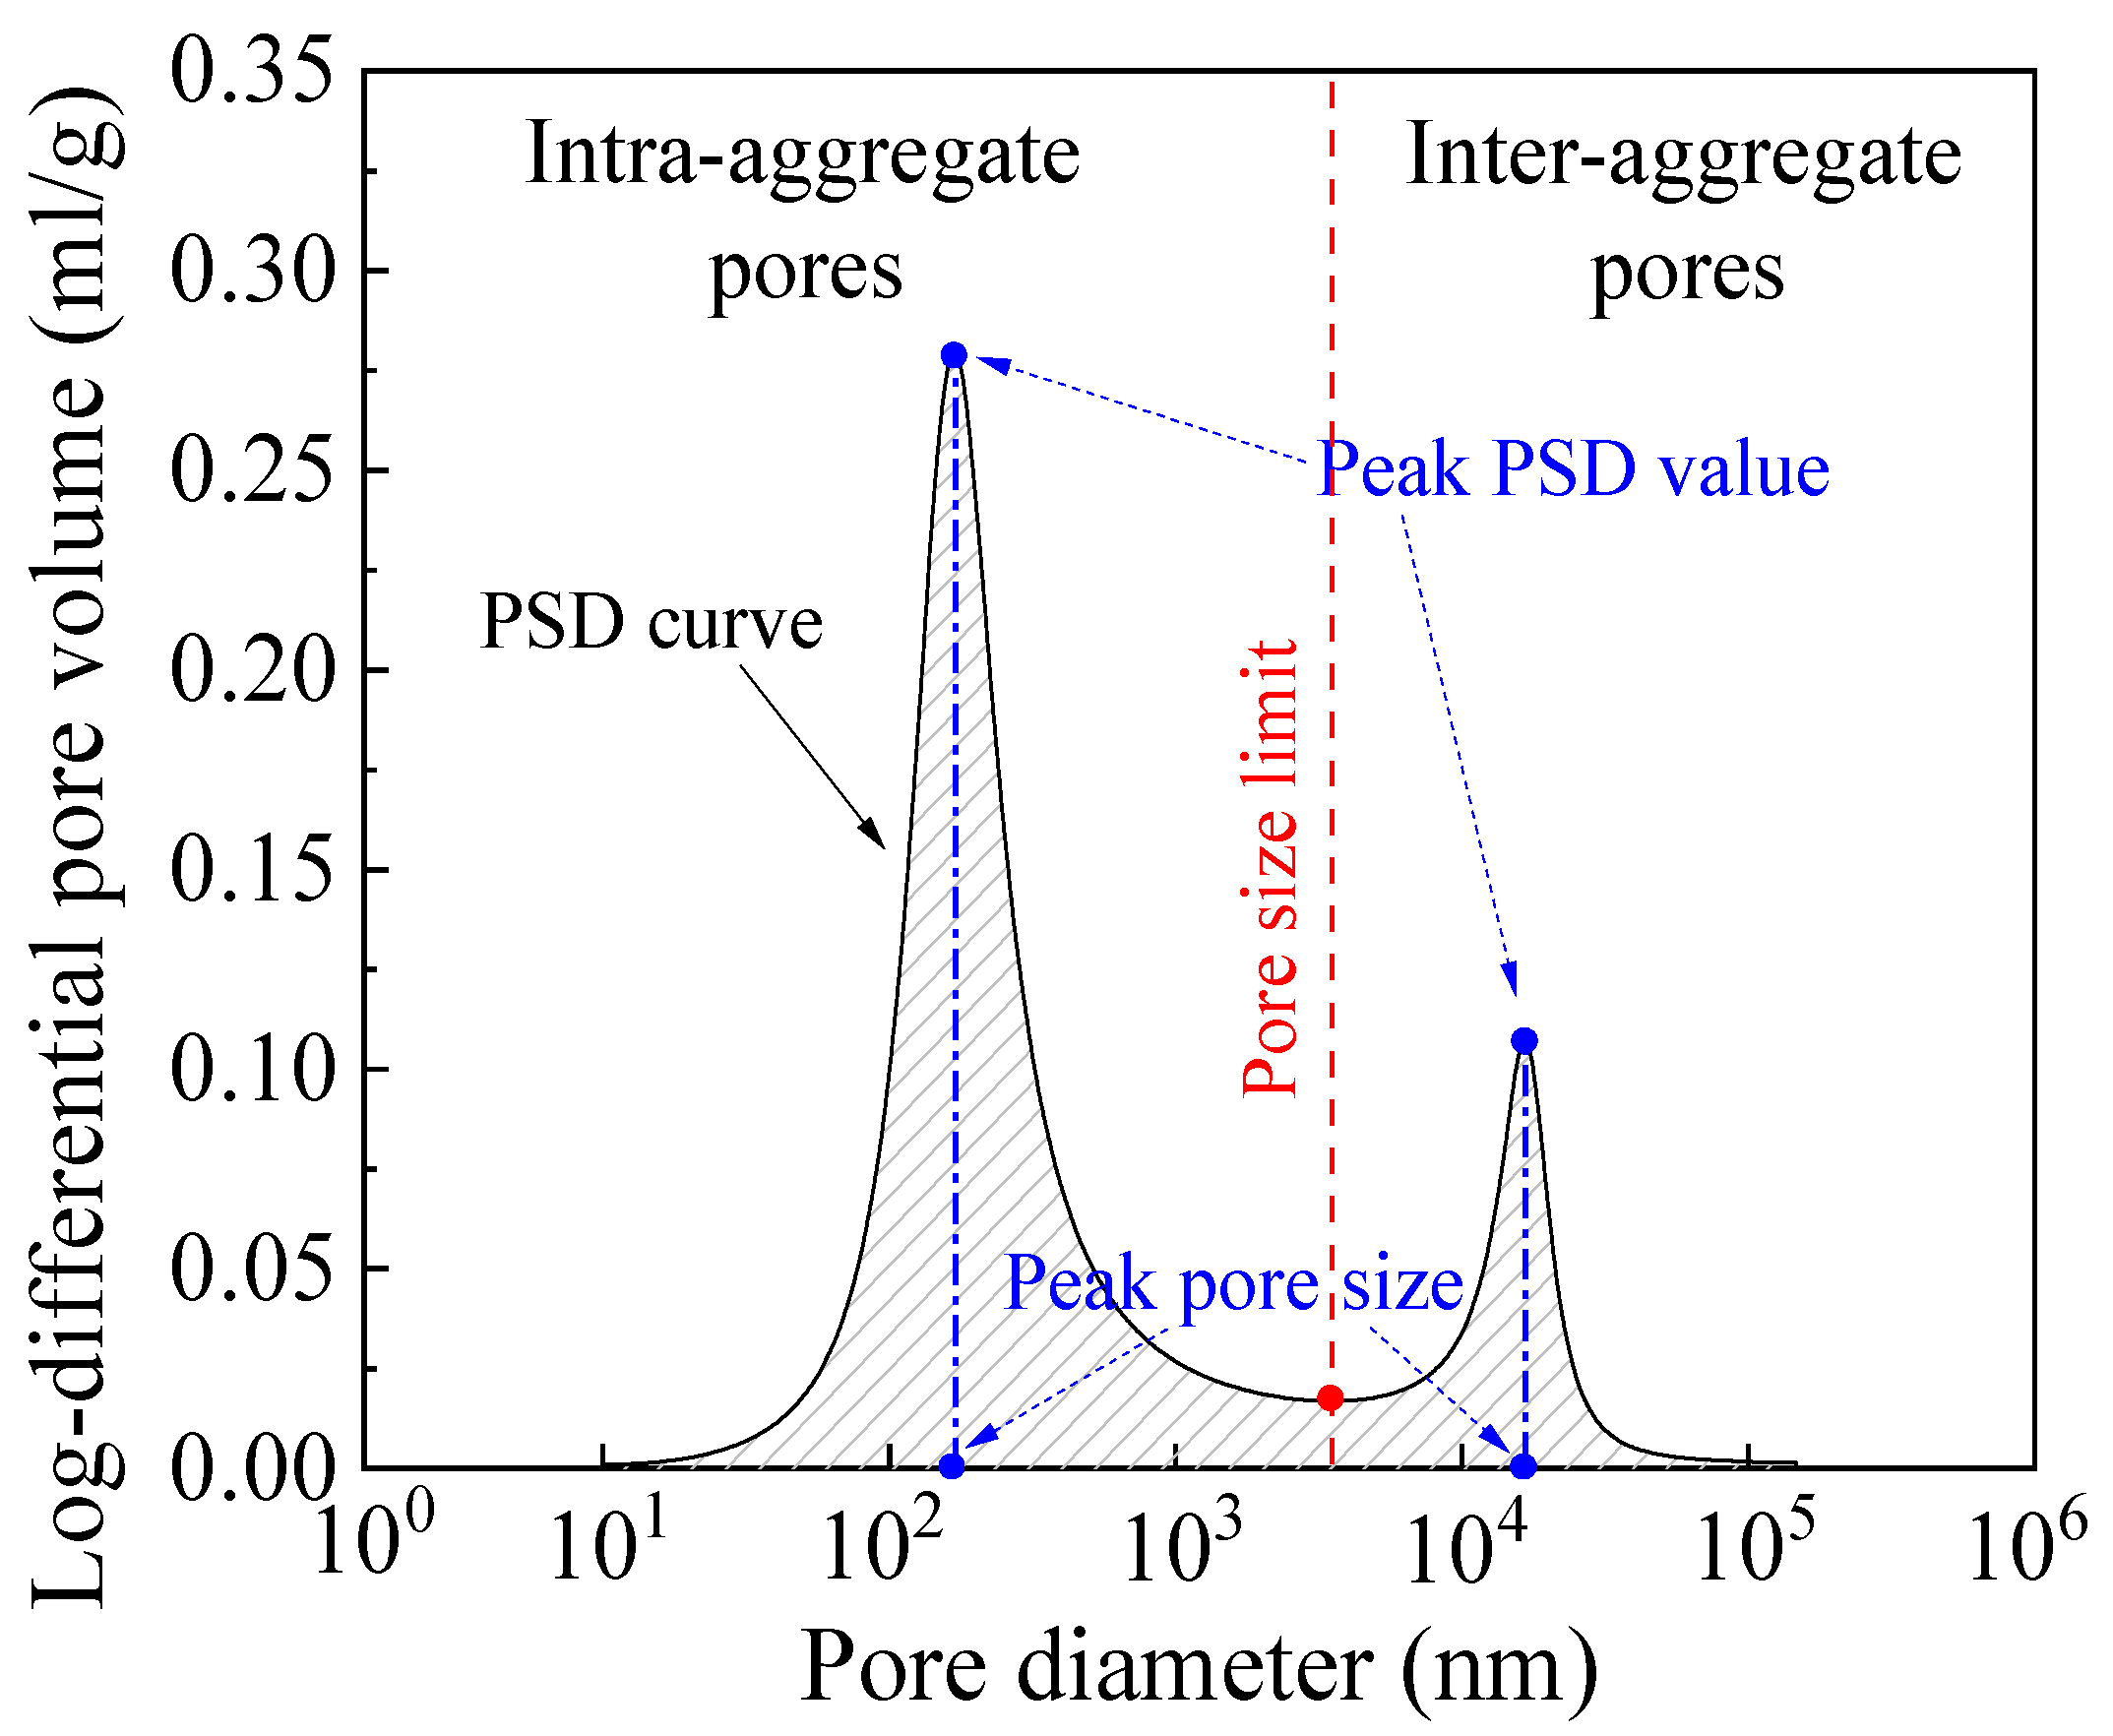
For investigating the pore structure of the granite residual soil under various initial conditions, the widely employed mercury intrusion porosimetry (MIP) test was conducted [24,25,40]. The Micromeritics AutoPore IV 9510 device (Micromeritics, Atlanta, GA, USA) with a maximum intrusion pressure of 414 MPa was used in this study. As depicted in Figure 5, the soil specimens were compacted and subsequently cut into 1 cm3 cubes to match the dilatometer dimensions. Then, the cubes underwent freeze-drying at −50 °C for 24 h to exclude moisture without altering the pore structure [24]. The dried cube was placed into a sealed dilatometer and was surrounded by mercury at a low pressure value. Then, the mercury pressure was increased step by step until it reached 414 MPa. The pore diameters (d) were recorded continuously as the mercury pressure increased, thus microstructure indexes of the tested soil, such as the cumulative intruded volume (ΣiΔVi), the cumulative intruded void ratio (ΣiΔVi/Vs), and the log-differential pore volume (−ΔVi/Δlog(di), could be obtained. The relationship between log-differential pore volume and pore diameter was named pore size distribution following related research [24,25].
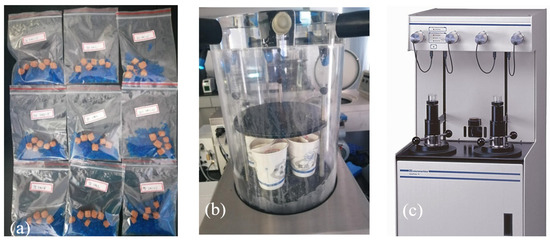
Figure 5.
(a) The soil specimens for the MIP test, (b) the freeze-drying device and (c) the MIP test device.
3. Results and Discussions
3.1. Effect of the Initial Conditions on the Pore Structure
3.1.1. Pore Size Distribution Curves
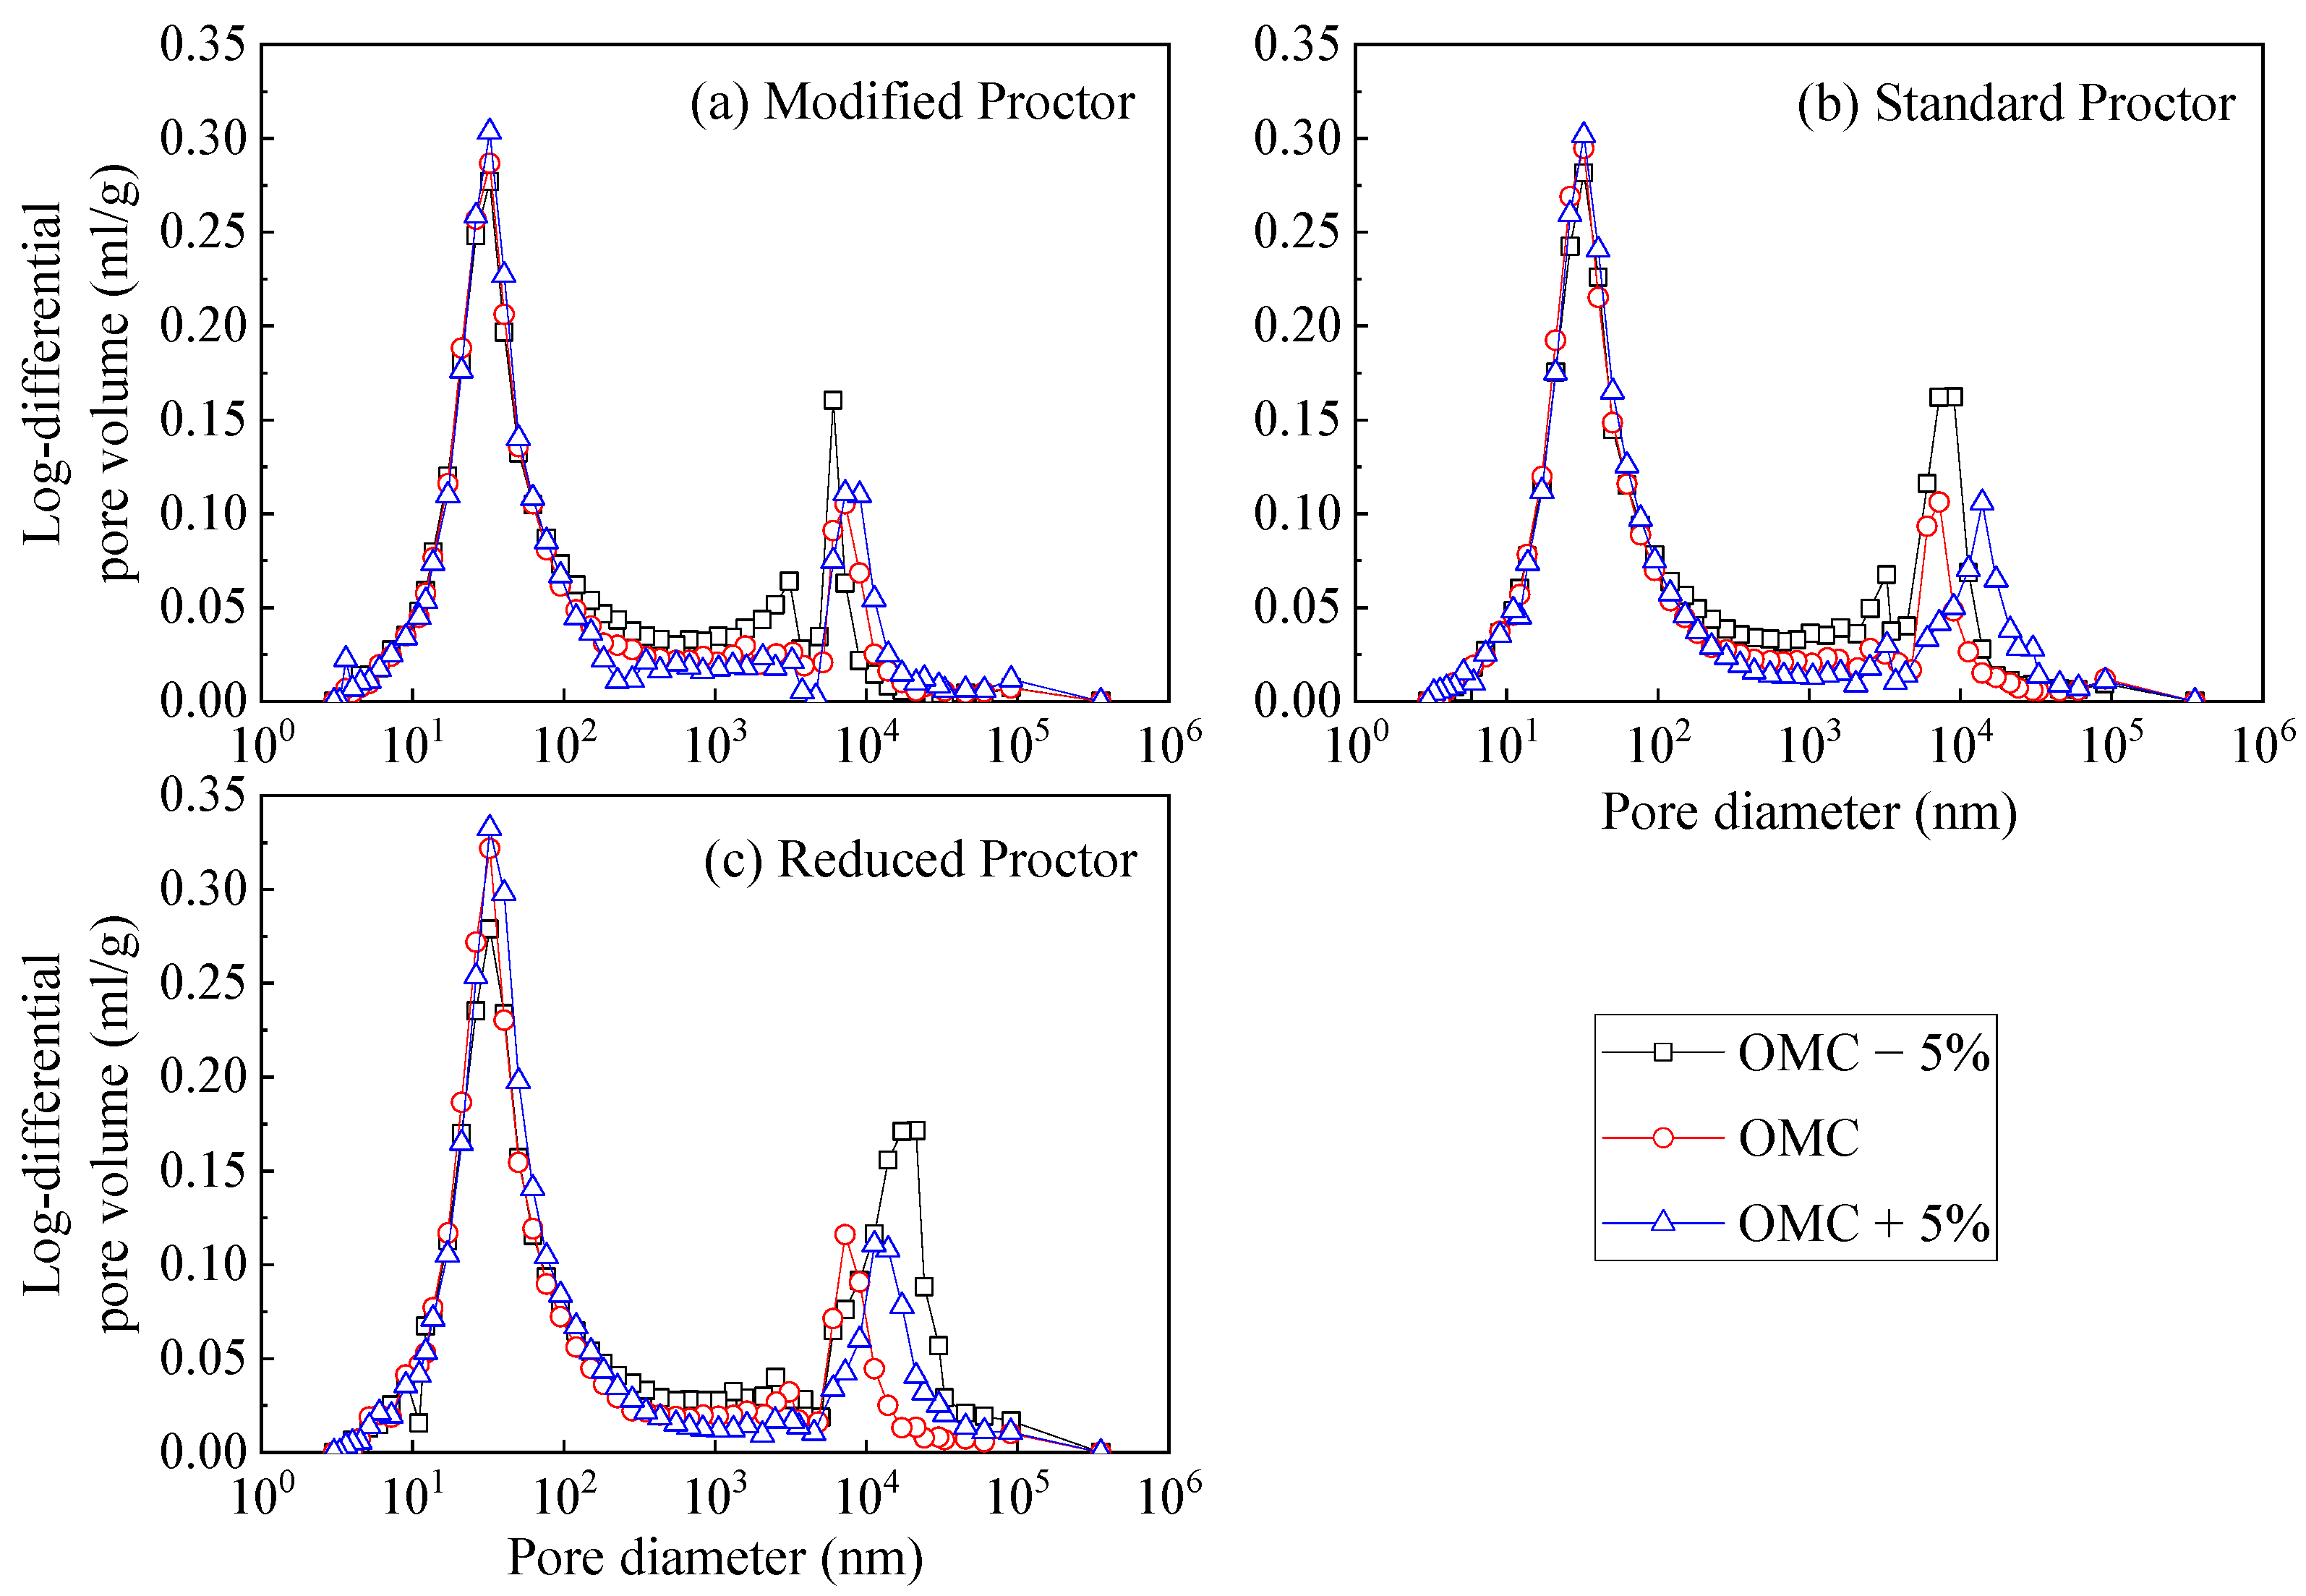
The pore size distributions of the tested soil under the nine initial conditions are depicted in Figure 6. For all the initial conditions, the soil specimens present bimodal pore size distributions. The intra-aggregate pores occupy a major part of pore structures and are nearly intact among different initial conditions. In contrast, the peak PSD value and the corresponding peak pore size of inter-aggregate pores change obviously, which is consistent with the results in related studies [47,48,49].

Figure 6.
Comparison of the pore size distribution under different proctor types: (a) modified proctor, (b) standard proctor and (c) reduced proctor.
Figure 6 shows that, for the same proctor type, the peak PSD value of inter-aggregate pores decreases as the compaction water content increases, for most cases. Compared with the specimen compacted at the dry side (i.e., wc lower than OMC) and wet side (i.e., wc higher than OMC), the specimens compacted at the optimum moisture content have the smallest peak inter-aggregate pore size and the narrowest inter-aggregate pore size distribution range. As the compaction energy decreases, the PSD curves are more easily affected by the compaction water content.
The change in inter-aggregate pores can be explained by differences in the initial void ratio. With higher compaction energy or less deviation between the compaction water content and OMC, the initial void ratio of soil specimens decreases, and thus the inter-aggregate pores were compressed due to the compaction effects [26].
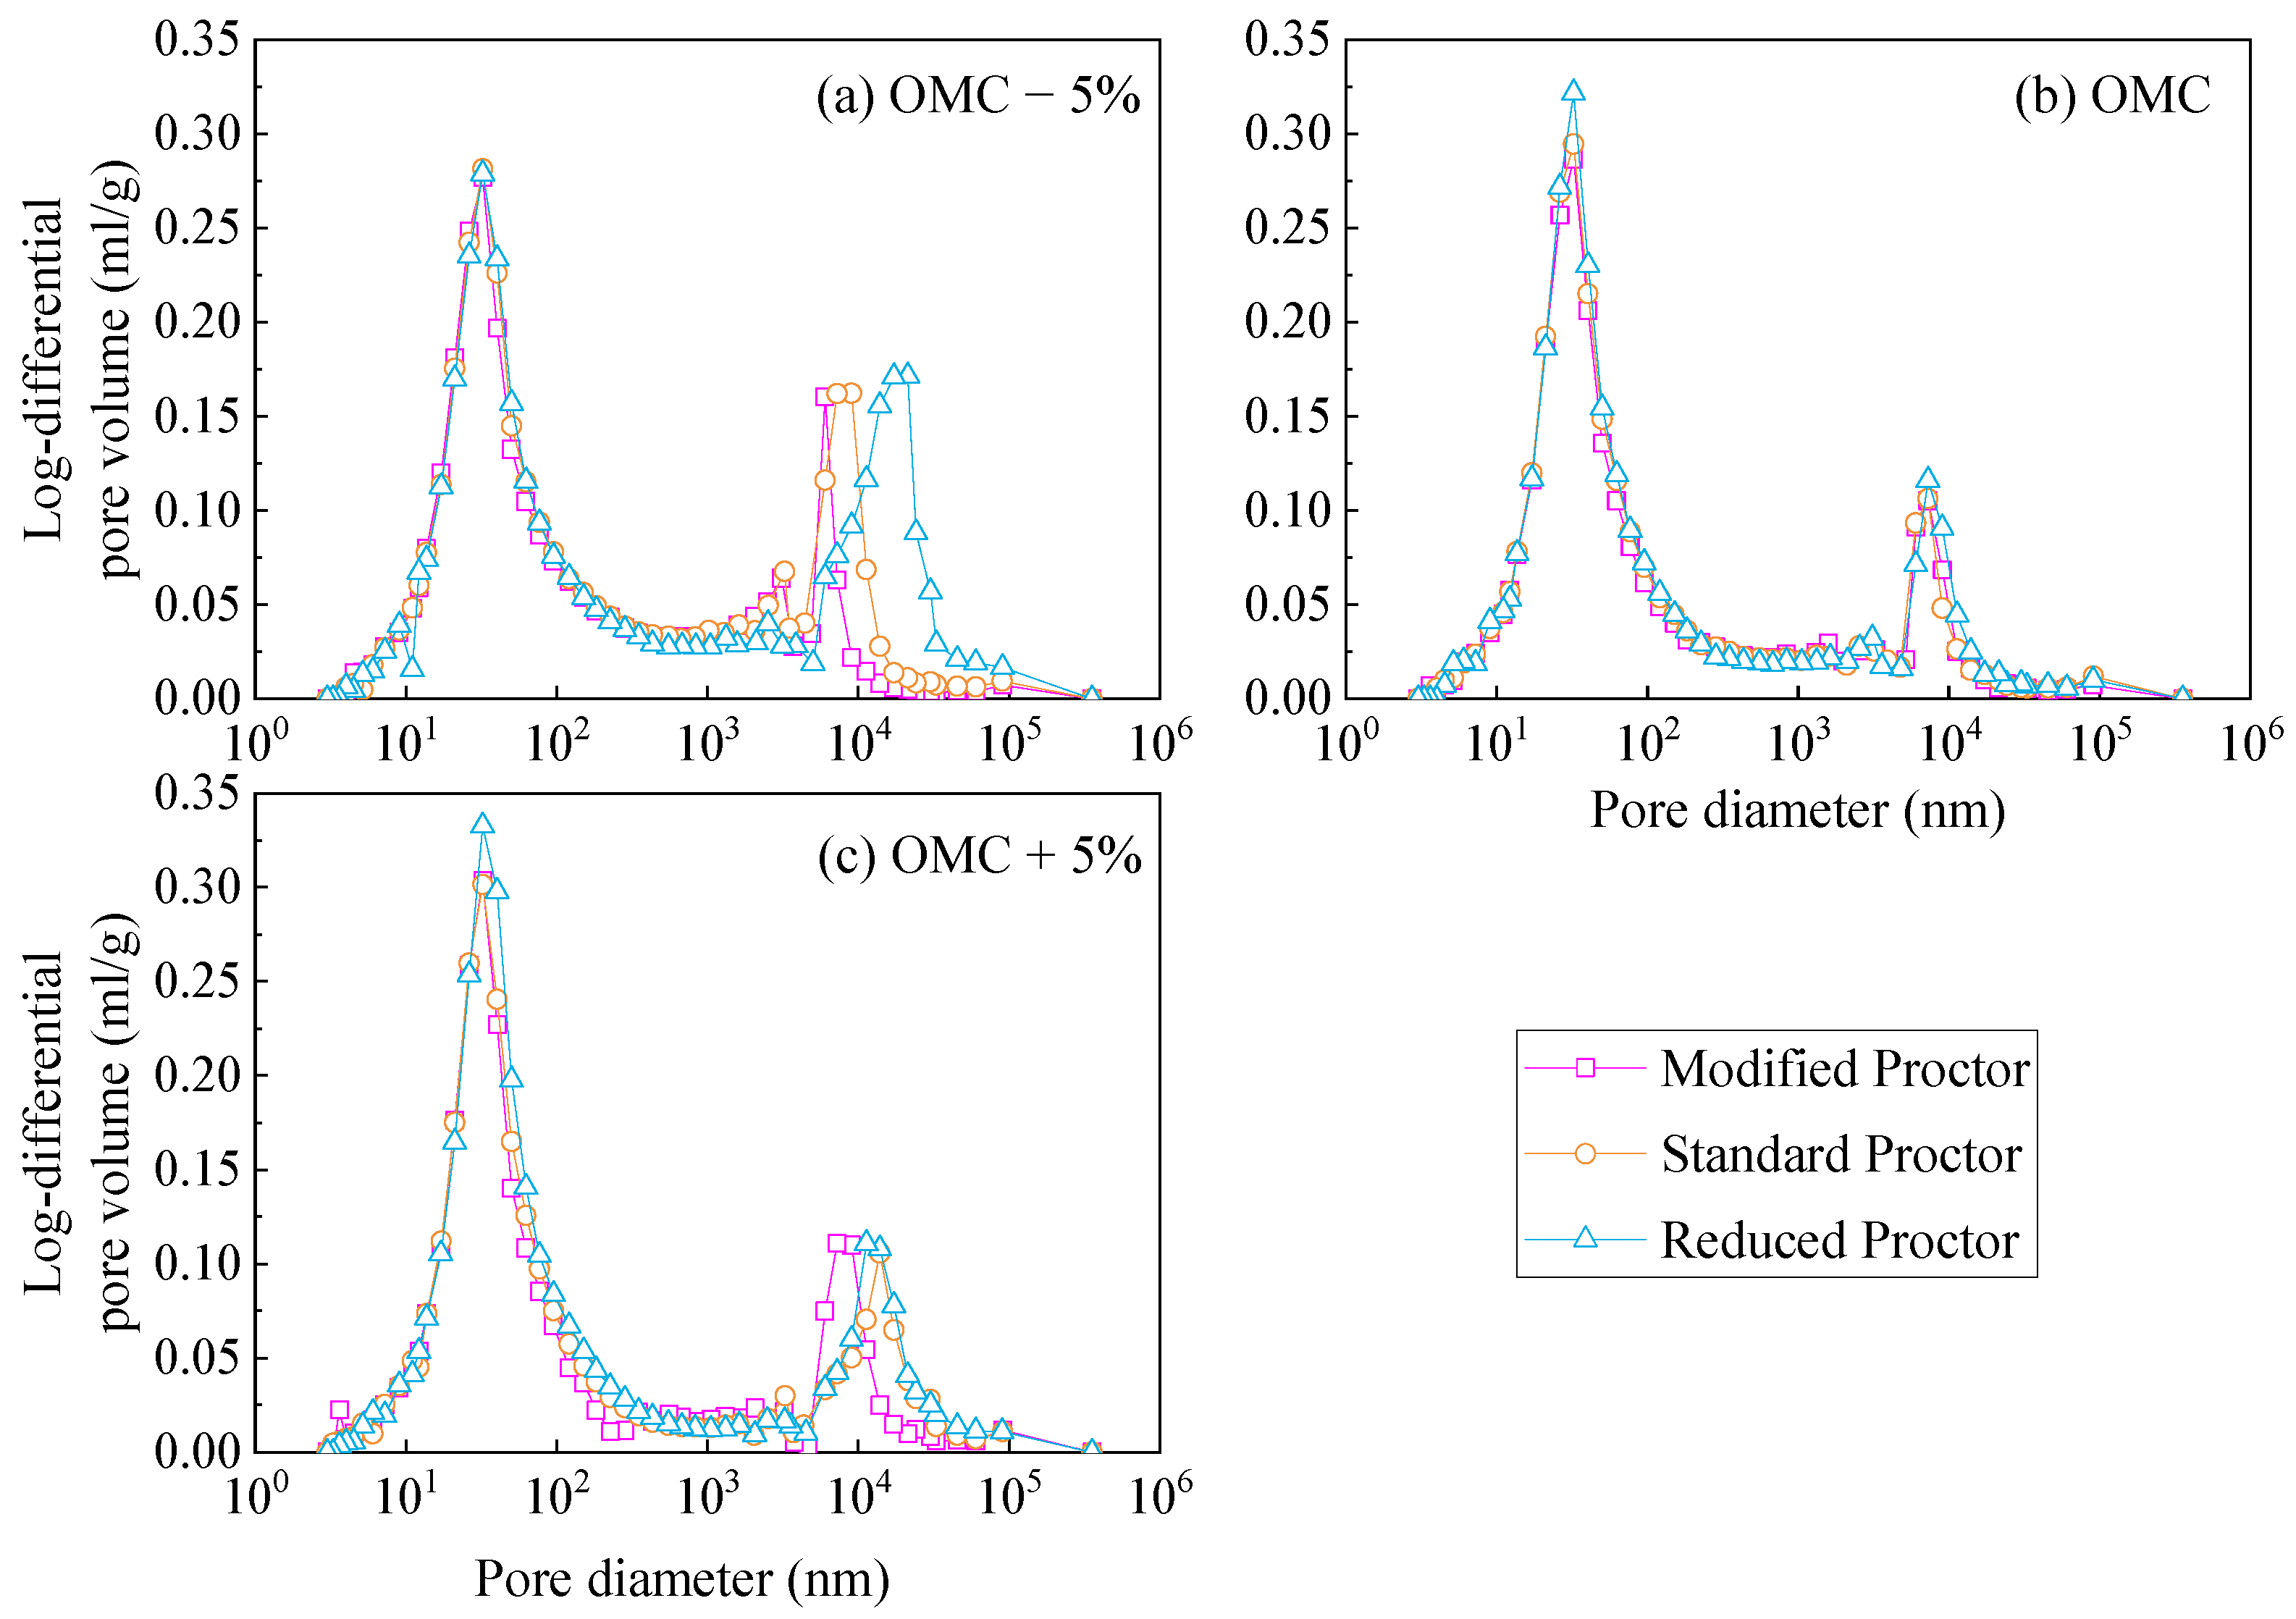
Figure 7 shows that the change in PSD is closely correlated with the compaction water content. For specimens compacted at the dry side, an increased compaction energy reduces the peak pore size and pore size distribution range. For specimens compacted at OMC, the peak PSD values change slightly, and the peak pore sizes remain unchanged. For specimens compacted at the wet side, the peak pore size decreases as the compaction energy increases, while the peak PSD values remain unchanged. Compared with specimens compacted at the dry side, the specimens compacted at the wet side are less affected by the compaction energy.
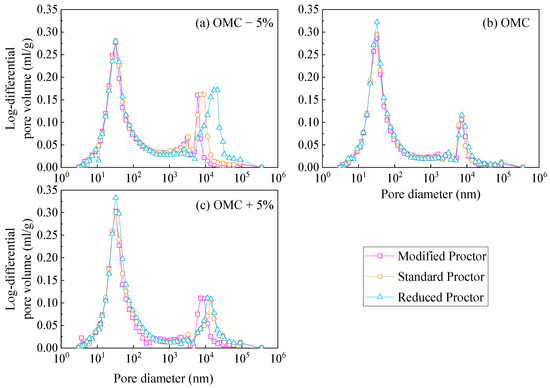
Figure 7.
Comparison of the pore size distribution under different compaction water contents: (a) OMC − 5%, (b) OMC and (c) OMC + 5%.
3.1.2. Pore Size Distribution Indexes
To quantitatively analyze the pore size distribution characteristics, the bimodal pore structure is divided into two categories, as depicted in Figure 8. The diameter corresponding to the point of zero slope on the PSD curve is chosen to separate the two pore categories, and, thus, the total void ratio measured by MIP tests (et), inter-aggregate void ratio (einter), intra-aggregate void ratio (eintra), the proportion of intra-aggregate pores (pintra) [48], and the water ratio (ew) [47] can be calculated, as expressed in Equation (2) through Equation (6).
where Vinter is the volume of inter-aggregate pores, Vintra is the volume of intra-aggregate pores, Vs is the volume of soil particles, and Vw is the volume of water.
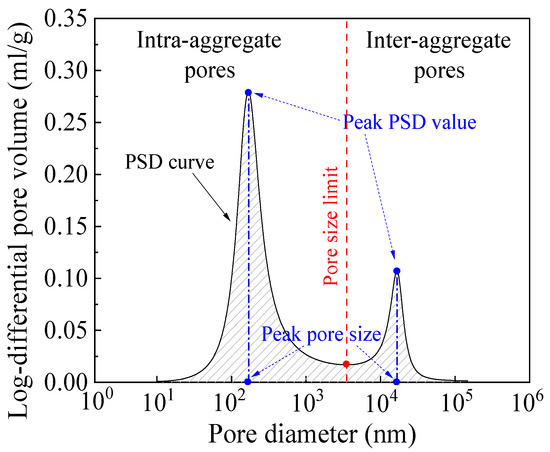
Figure 8.
Division of the pore structure based on the PSD curve.
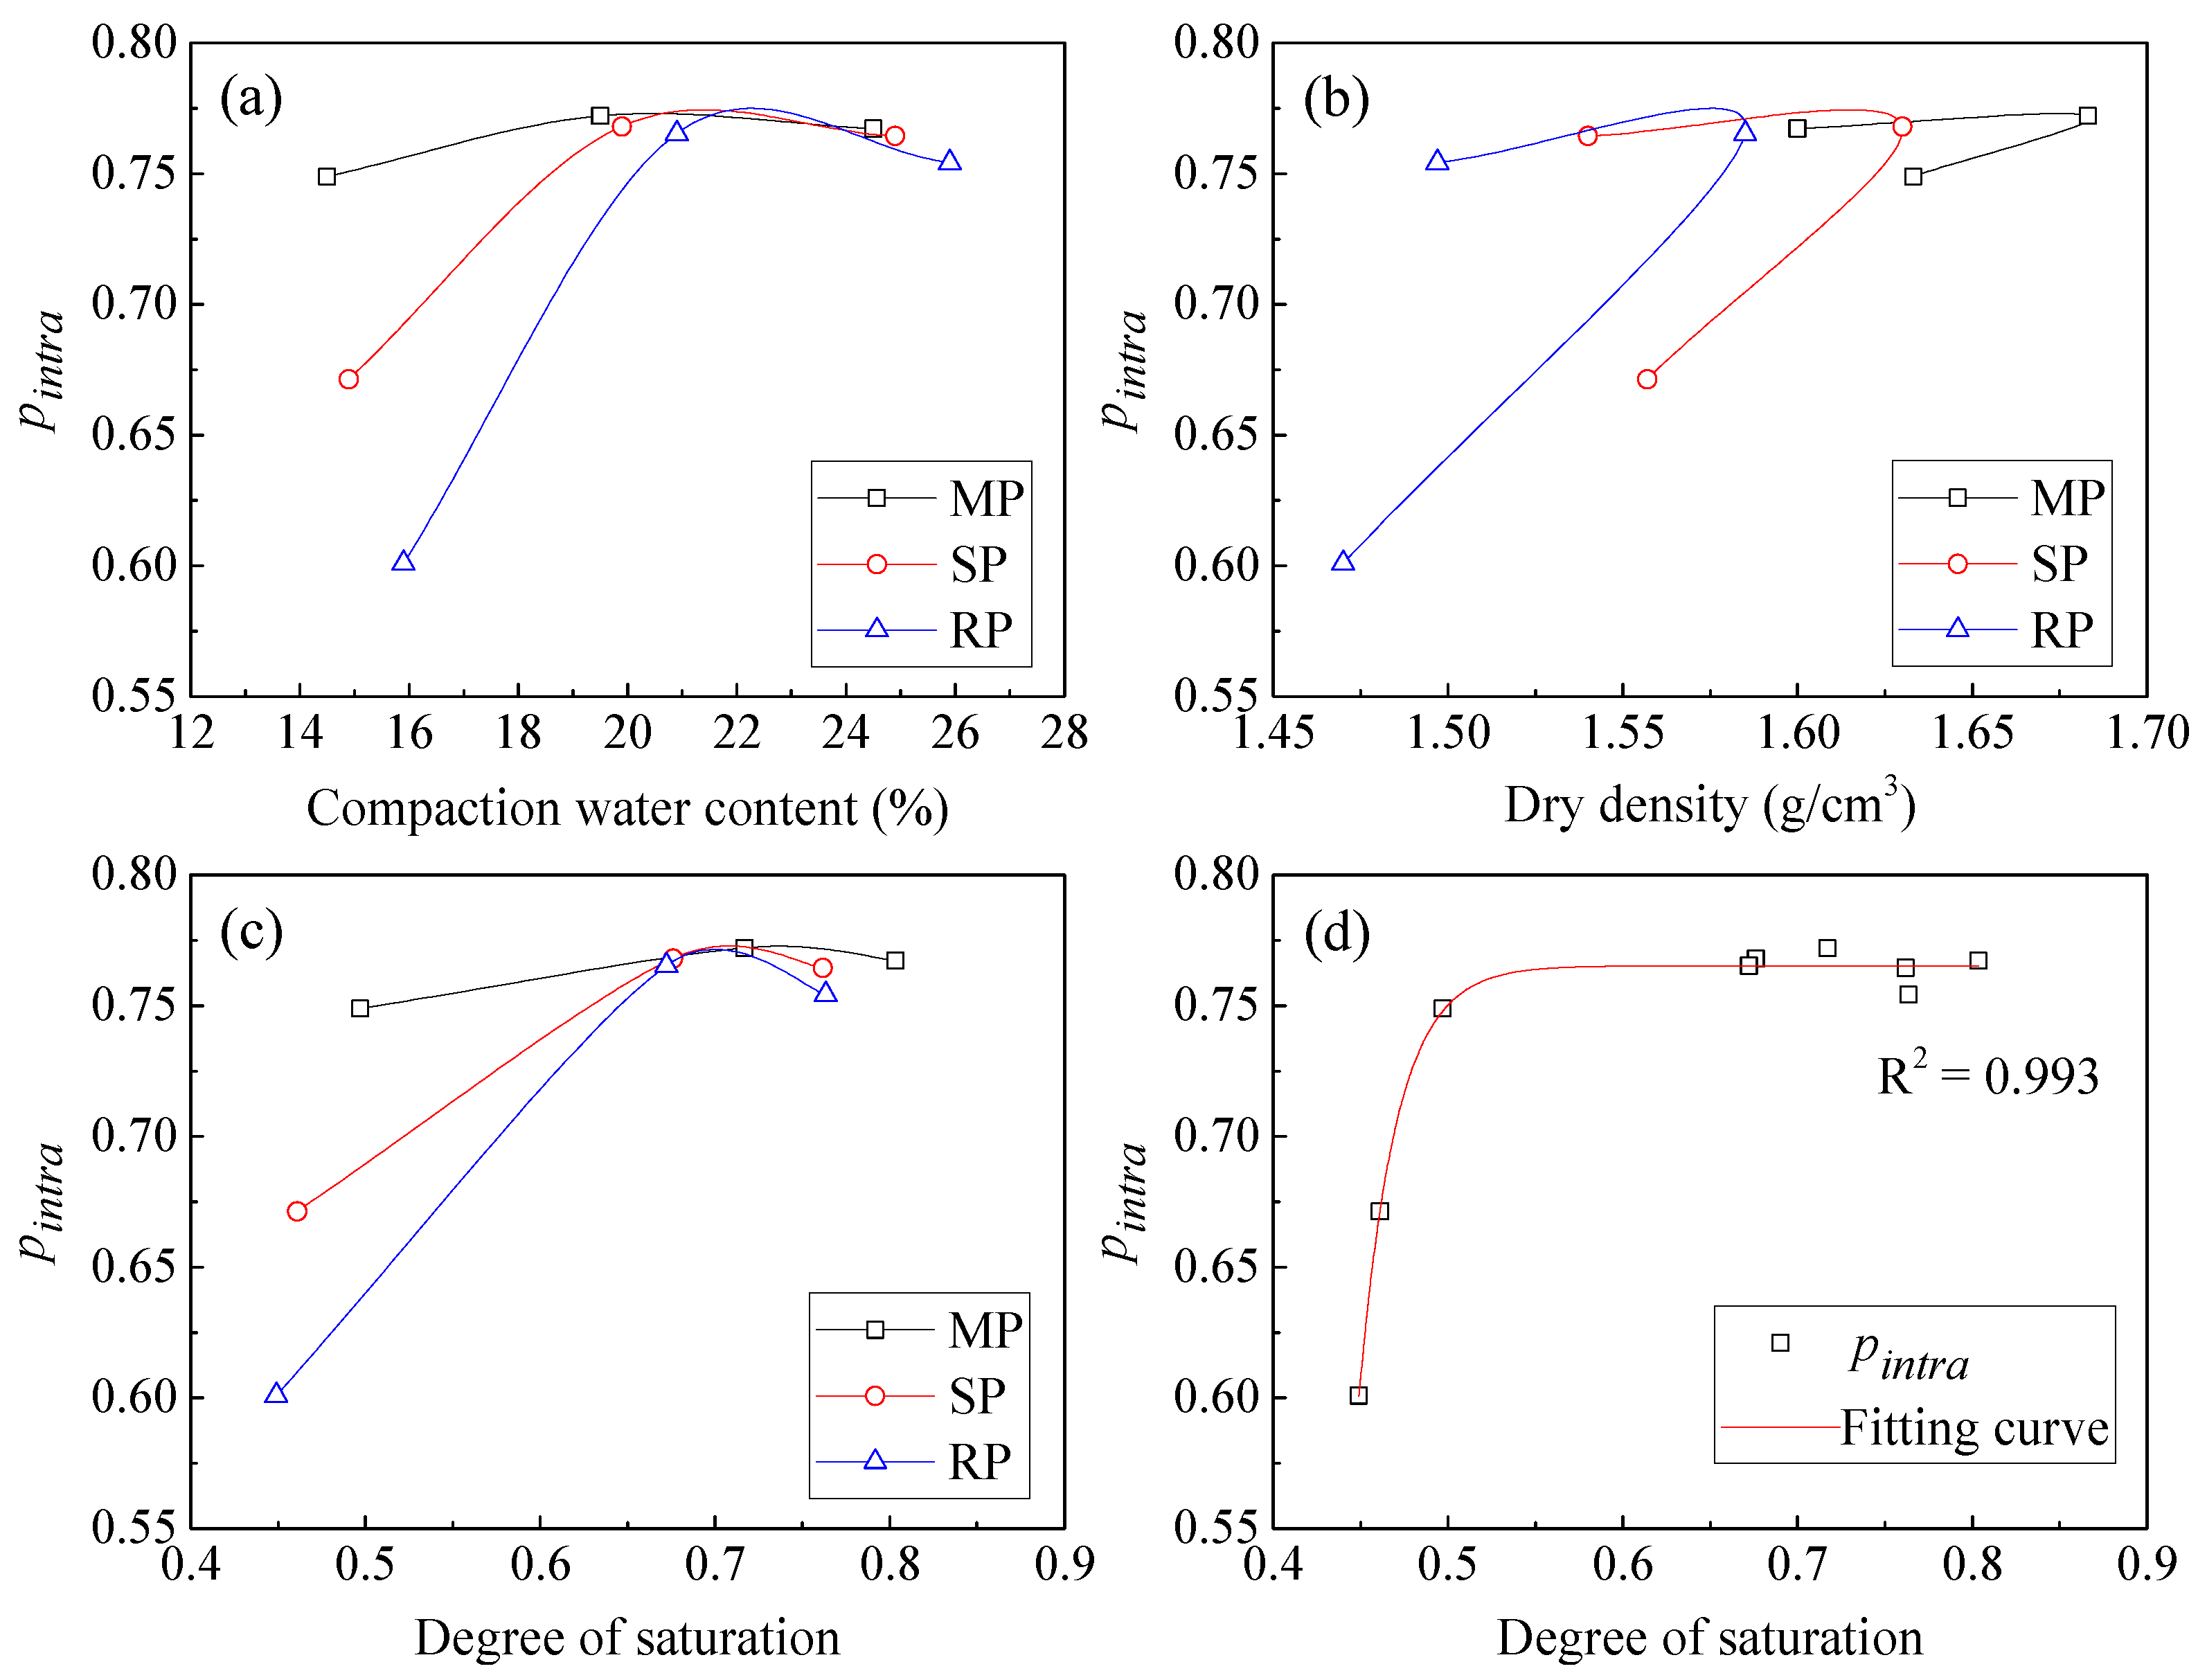
The variation of the pore size distribution among the different initial conditions can be quantitatively captured by the pintra, which can capture the proportion of nearly intact intra-aggregate pores and changeable inter-aggregate pores. To correlate PSD with the initial conditions, the pintra is compared with the compaction water contents, dry density, and degree of saturation, respectively. Figure 9a shows that the pintra values for the specimens compacted at the dry side are separated from each other, while for the OMC and OMC + 5% conditions, the pintra values are nearly independent of proctor types. Figure 9b shows that an increased compaction energy reduces the variation in pintra. In addition, soil specimens with similar dry densities have different pintra values, which verify the results in related research that the soil compacted at the dry side or wet side show different pore structures [50]. Figure 9c shows that the relationship between the degree of saturation and pintra can be described by the single-valued function, and the exponential fitting curve is depicted in Figure 9d. Thus, the pore size distribution parameter and initial condition parameter can be quantitatively correlated.
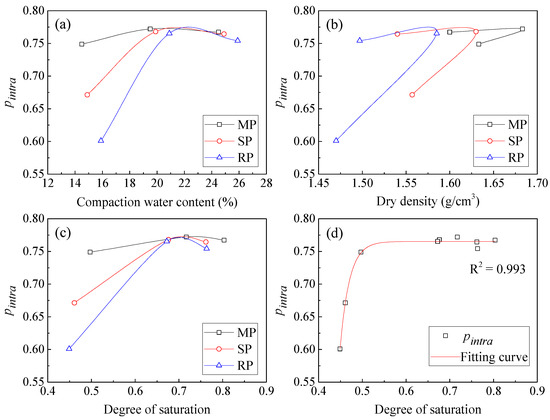
Figure 9.
Relationship between pintra and initial condition parameters: (a) compaction water content, (b) dry density, (c) degree of saturation and (d) fitting curve of pintra and degree of saturation.
To further investigate the correlation between the degree of saturation and pore structure, the filling degree of adsorbed water in intra-aggregate pores and the filling degree of capillary water in inter-aggregate pores can be quantitatively represented by the adsorbed saturation (Sr, a) and capillary saturation (Sr, c), respectively [48,51]. The two indexes are calculated by Equations (7) and (8) and are compared in Figure 9.
It can be seen from Figure 10 that the intra-aggregate pores are not saturated under OMC − 5%, while for the OMC and OMC + 5% conditions, the intra-aggregate pores are fully saturated, and the capillary water fills in the inter-aggregate pores at different degrees. As the compaction water content increases from OMC − 5% to OMC, the filling of adsorbed water affects the volume and size of the aggregates significantly, thus affecting the PSD curve and corresponding pintra significantly. Once filled into the pores, the adsorbed water forms strong contact with the soil particles and is hard to dewater by the compaction effect. Thus, the pore structure becomes stable after the Sr, a reach 1.0. As the compaction water content increases from OMC to OMC + 5%, the pore structure is also affected by the Sr, c. Since the inter-aggregate pores occupy a relatively small proportion in the pore structure of the test soil, the PSD and corresponding pintra are less sensitive to the change in compaction water content and compaction effort, compared with the dry side.
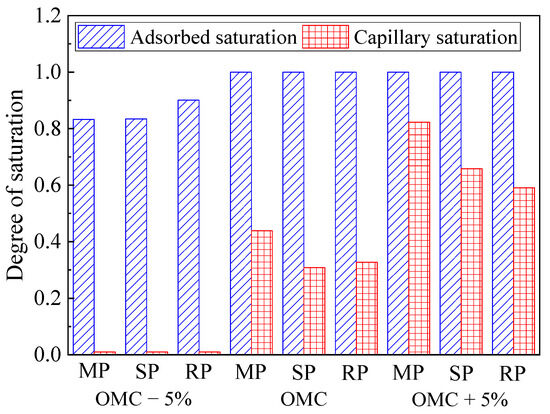
Figure 10.
Comparison of the Sr, a and Sr, c for all the initial conditions.
3.2. Effect of the Initial Conditions on the SWCC
3.2.1. Determination of the SWCC
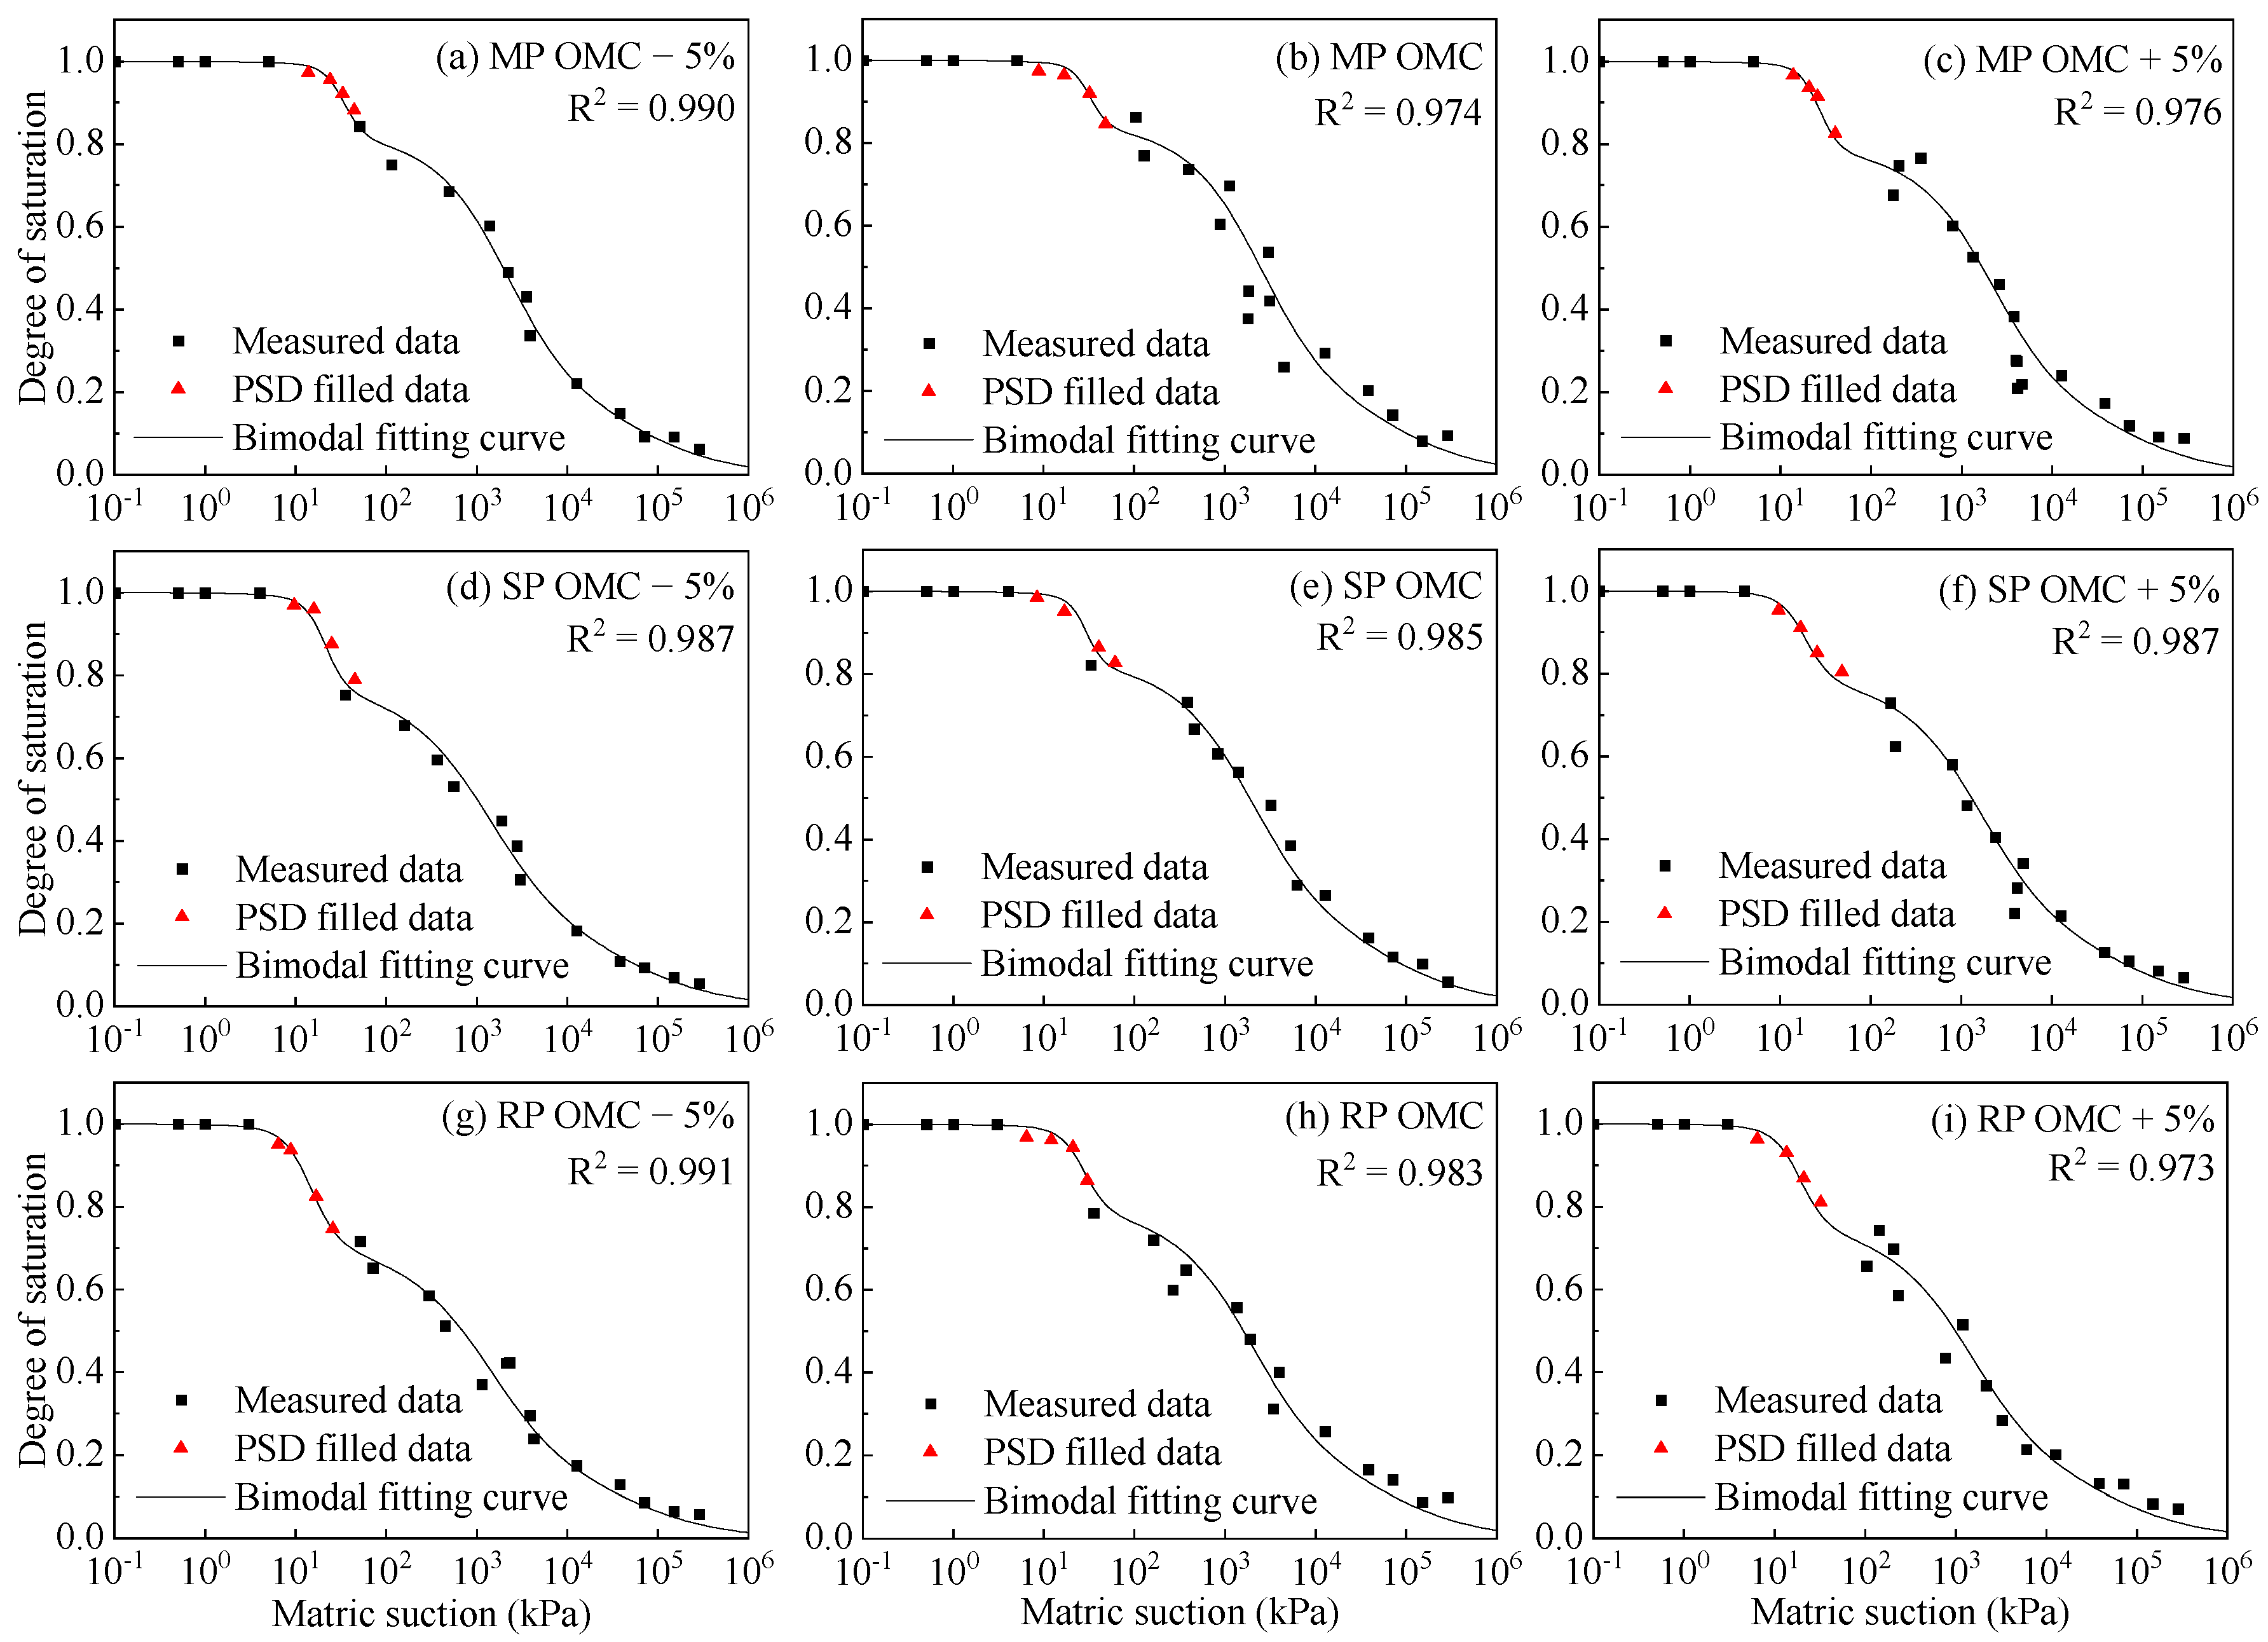
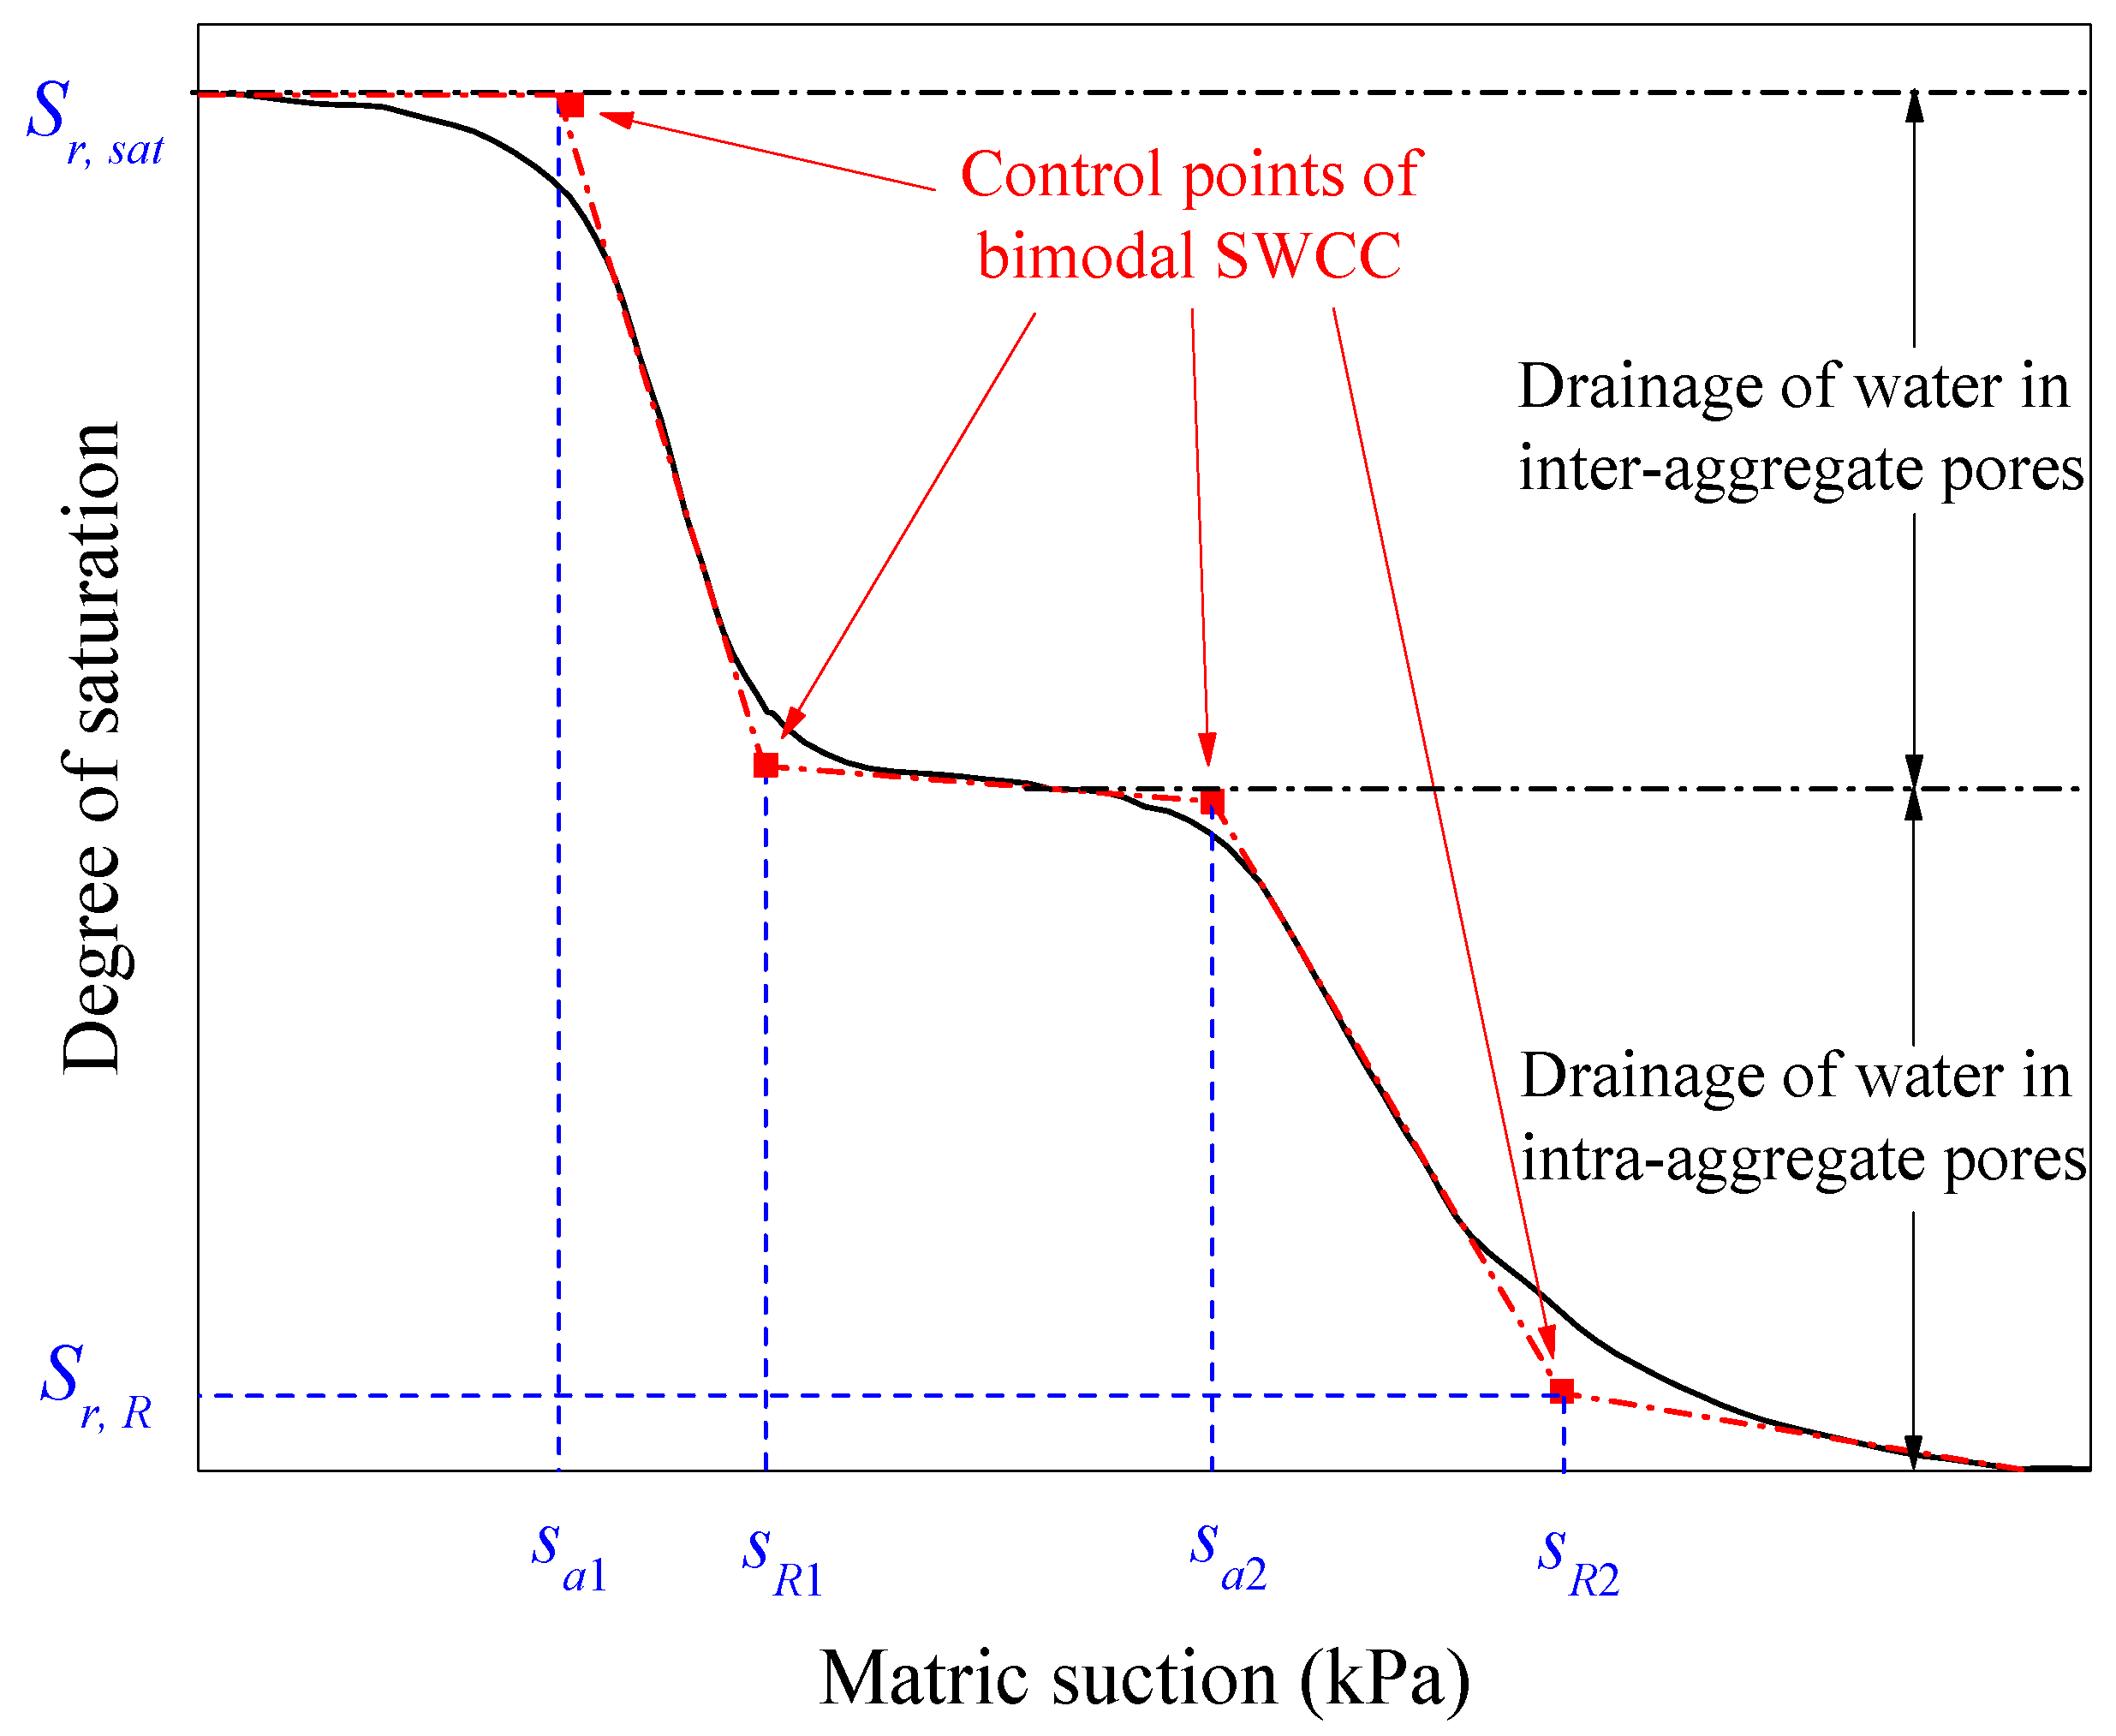
The SWCC data obtained from the filter paper method, vapor equilibrium method, and saturated water content tests were summarized in Figure 11. To supplement the data of the low-suction section, the PSD curve is used to verify the air-entry value and the first inflection point of the SWCC [24,25]. The measured SWCCs for all nine initial conditions show a typical bimodal pattern. Thus, the bimodal SWCCs are determined following the method proposed by Li et al. [52], as expressed in Equation (9). The parameters in Equation (9) are obtained graphically, as conceptionally depicted in Figure 12.
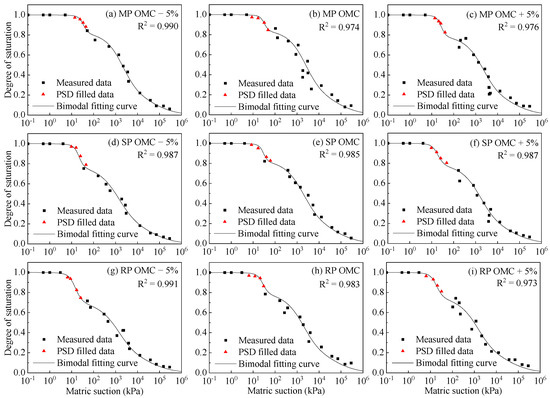
Figure 11.
Determination of bimodal SWCCs for the selected initial conditions: (a) MP OMC − 5%, (b) MP OMC, (c) MP OMC + 5%, (d) SP OMC − 5%, (e) SP OMC, (f) SP OMC + 5%, (g) RP OMC − 5%, (h) RP OMC and (i) RP OMC + 5%.

Figure 12.
Determination of the parameters for the bimodal SWCC fitting curve.
In this equation, Sr, sat represents the degree of saturation under the fully saturated condition, Sr, R represents the residual degree of saturation, sa1 and sa2 are the air-entry values of inter-aggregate and intra-aggregate pores, and sR1 and sR2 represent the residual suction of inter-aggregate and intra-aggregate pores, respectively.
3.2.2. Effects of the Initial Conditions on the SWCC
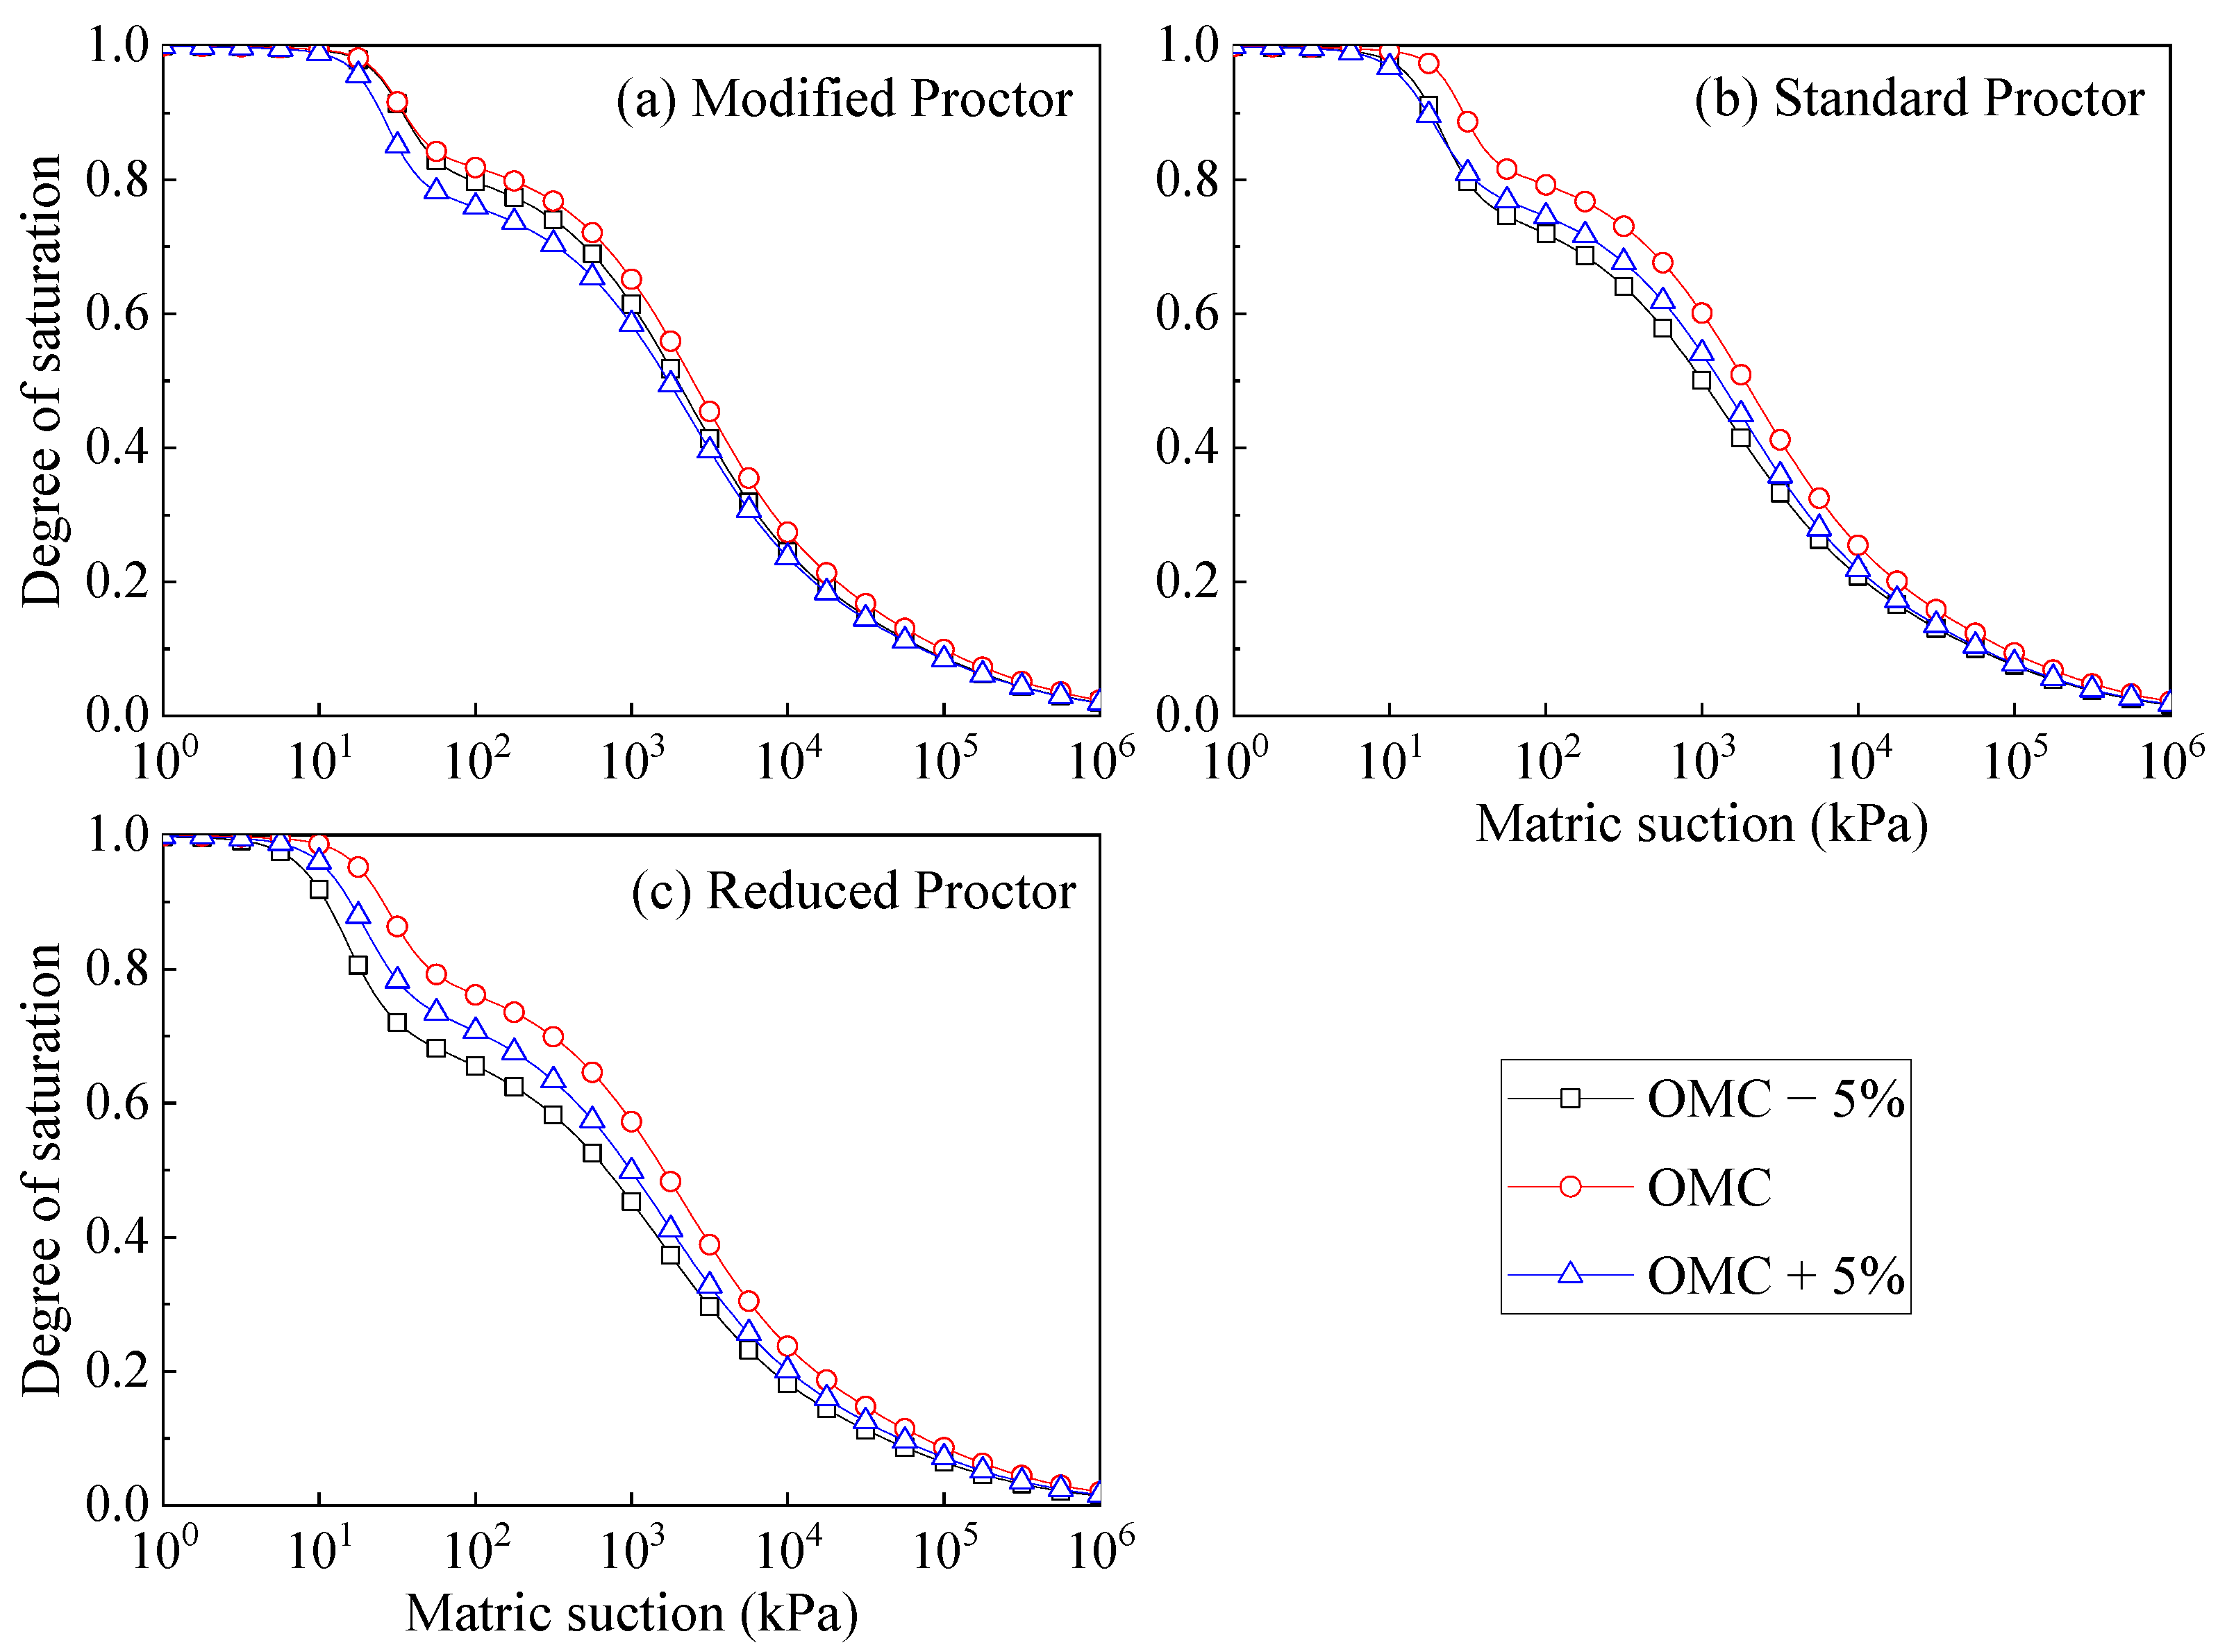
The variations of bimodal SWCC among the different initial conditions are depicted in Figure 13 and Figure 14. Figure 13 shows that, for the same proctor type, the SWCC of soil specimens compacted at OMC is higher than the specimens compacted at the wet side and dry side. The higher SWCC suggests a better water retention capacity, which means the water in the pores is harder to be drained under the same matric suction. Also, specimens compacted at the wet side generally show a better water retention capacity than those at the dry side. This phenomenon can be explained from the perspective of effective stress. The soil compacted at the wet side has a higher degree of saturation, leading to increased effective stress, hence improving the water retention capacity. Furthermore, as the compaction energy increases, the difference in SWCC decreases, which indicates that a better compaction condition can reduce the variation of water retention capacity with the moisture.
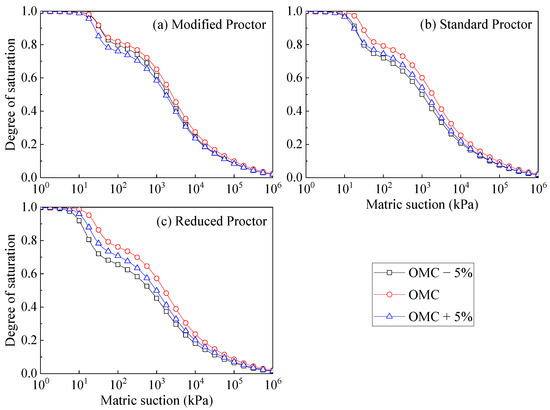
Figure 13.
Comparison of bimodal SWCCs under different proctor types: (a) modified proctor, (b) standard proctor and (c) reduced proctor.
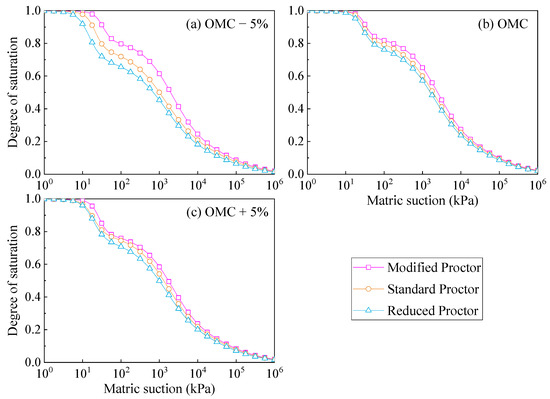
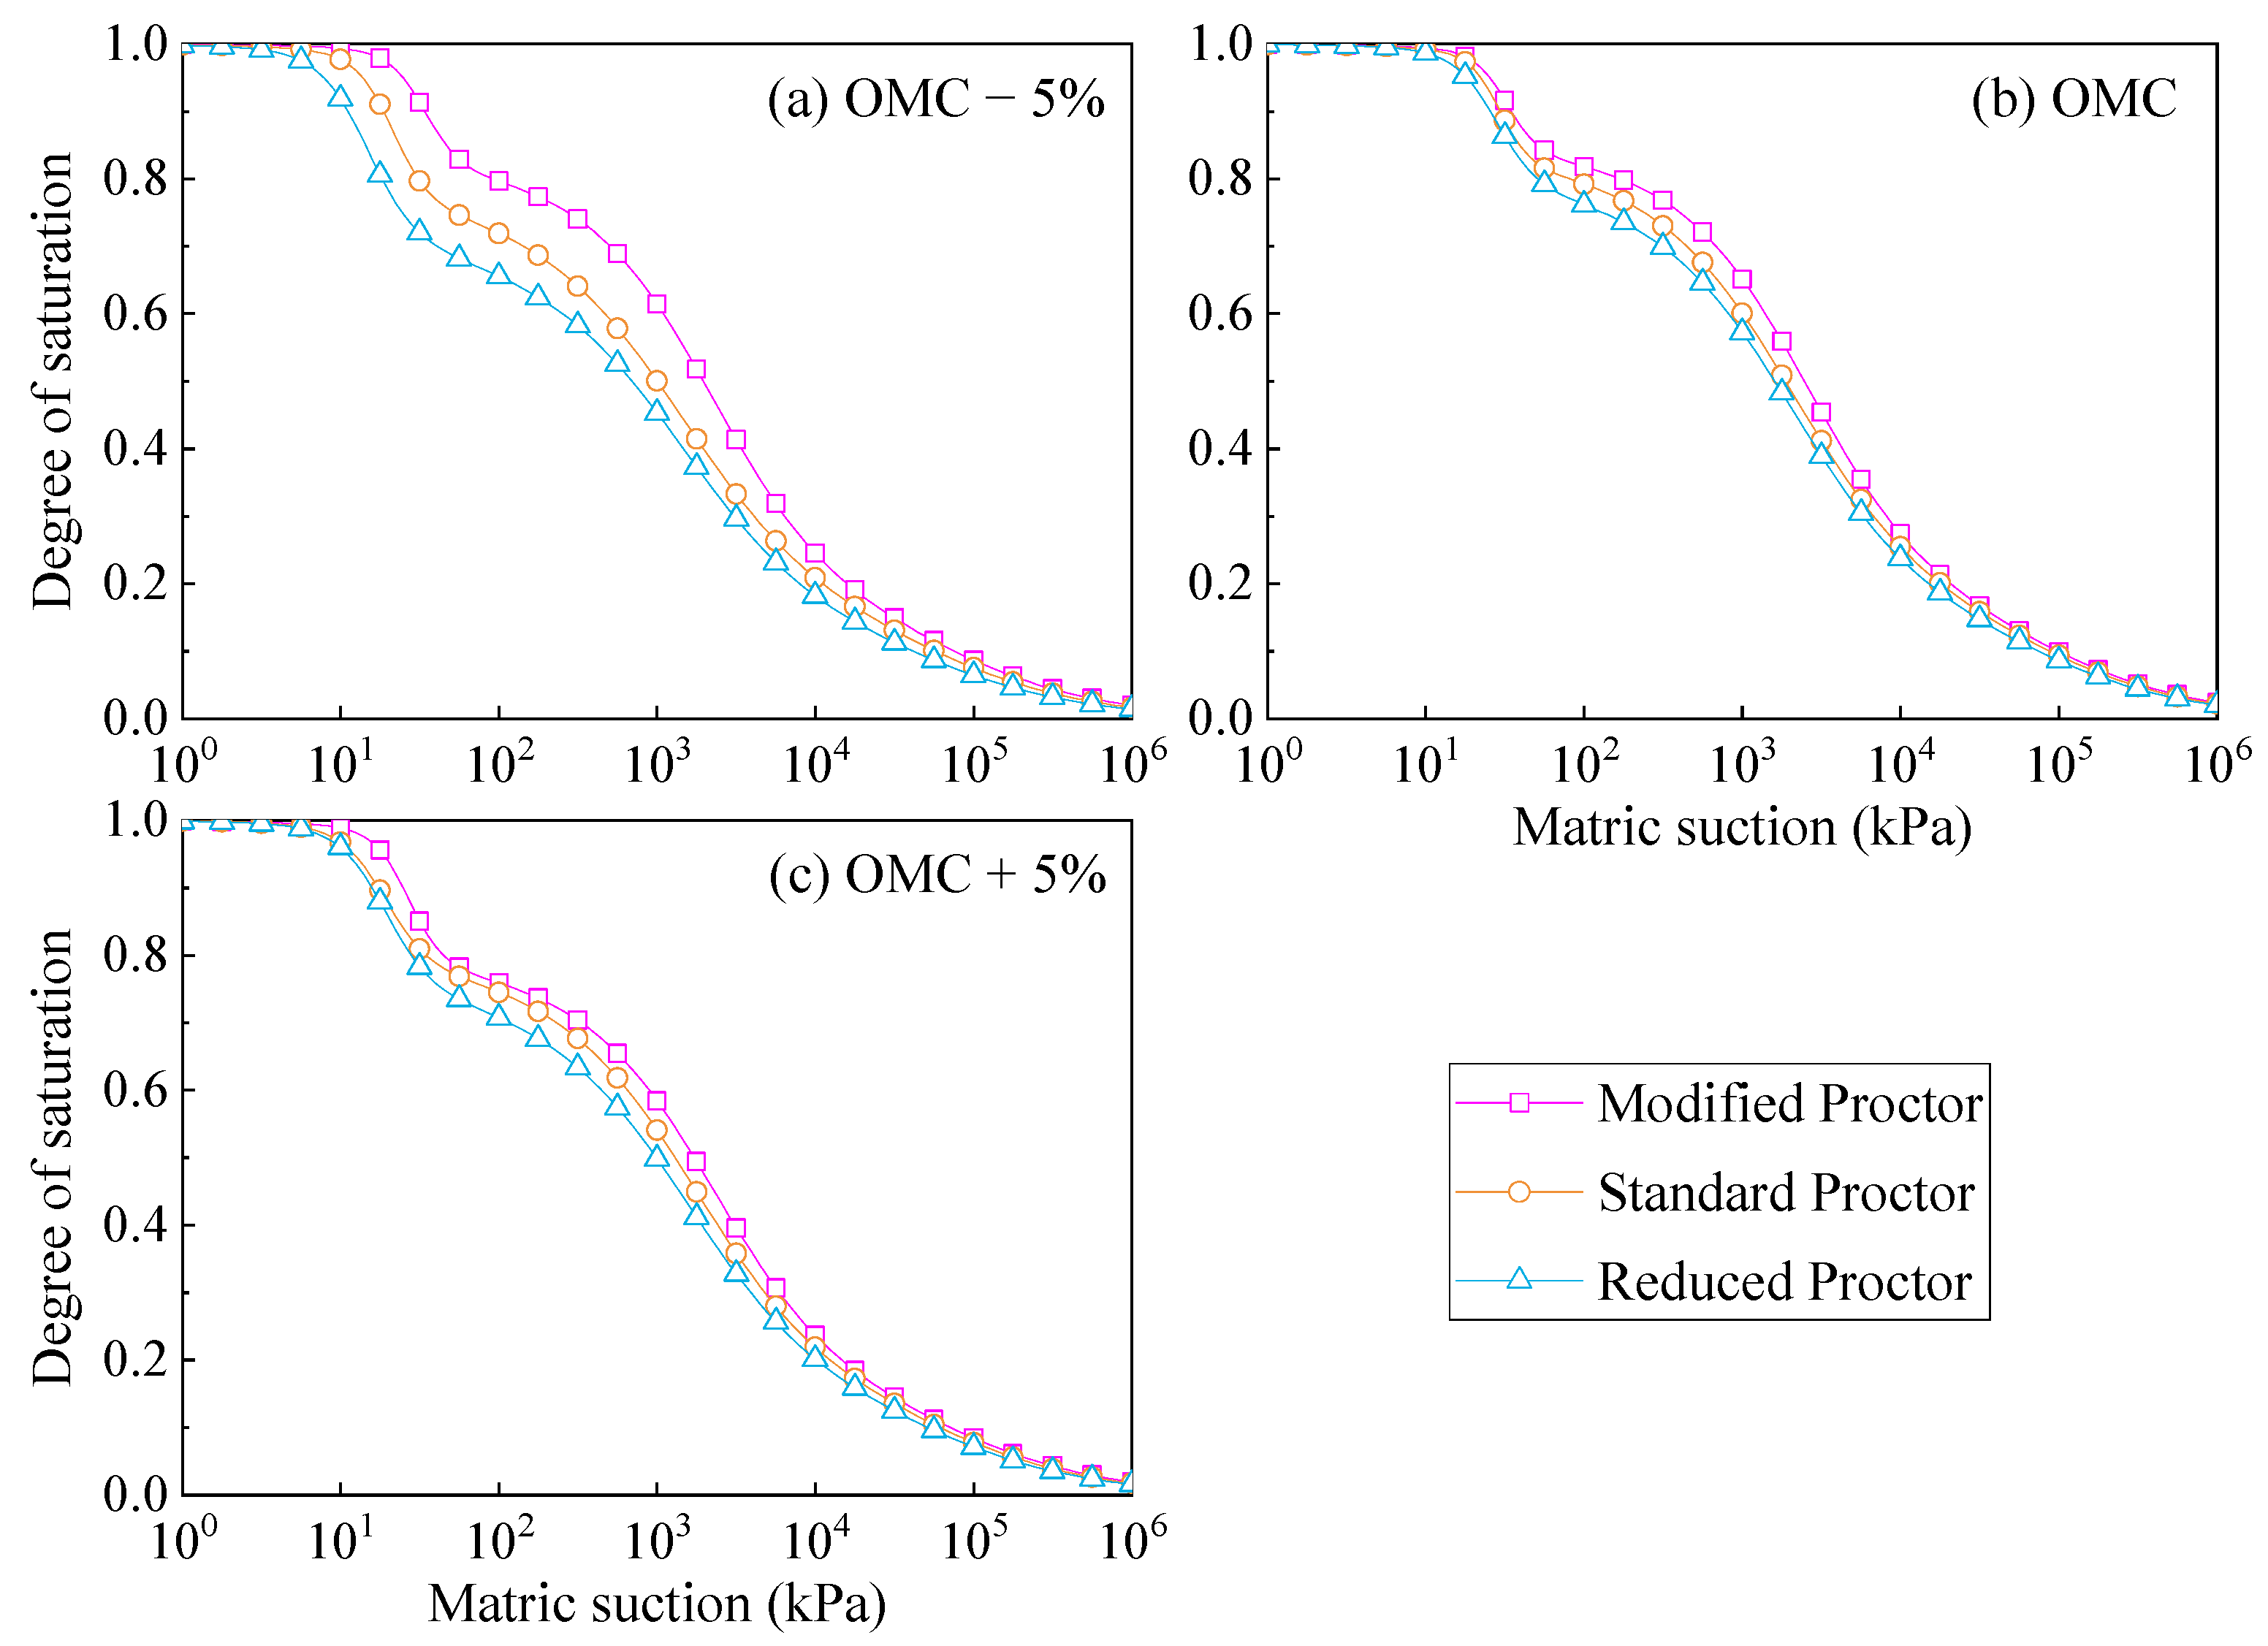
Figure 14.
Comparison of bimodal SWCCs under different compaction water contents: (a) OMC − 5%, (b) OMC and (c) OMC + 5%.
Figure 14 shows that, for the same compaction water content type (i.e., OMC − 5%), an increased compaction energy improves the water retention capacity of compacted soil. For specimens compacted at the dry side, an increased compaction energy improves the water retention capacity significantly. In contrast, for the soil specimens compacted at OMC and OMC + 5%, the SWCC is less affected by the compaction energy.
To quantitatively compare the SWCC equations, the fitting parameters of the SWCCs are summarized in Table 5. Among all nine initial conditions, the air-entry values of inter-aggregate pores sa1 are less than 20 kPa, and the residual suction values of intra-aggregate pores sR2 are greater than 13,000 kPa, which suggests a wide effective suction range.
Table 5.
Summary of the bimodal SWCC fitting parameters.
Under the same compaction energy, the fitting parameters of the soil specimens compacted at OMC are generally higher than the corresponding values under OMC − 5% and OMC + 5%. This indicates that the granite residual soil compacted under the optimum moisture content has the strongest water retention capacity within the full suction range. Additionally, for the soil specimens compacted at OMC − 5% and OMC + 5% under a certain compaction energy, the relation of the first air-entry value sa1 and the first residual suction value sR1 are affected by the compaction energy, while their second air-entry value sa2 and the second residual suction sR2 are similar to each other.
Under the same compaction water content type, when the compaction energy changes, the first and second air-entry values sa1 and sa2 change obviously with the compaction energy. The average values under the modified proctor are 1.80 and 1.54 times higher compared with the specimens under the reduced proctor, respectively. In addition, the first and second residual suction sR1 and sR2 change significantly for the specimens compacted at OMC − 5%, and only change slightly for the specimens compacted at OMC and its wet side.
3.2.3. Correlation between Pore Structure and SWCC
Among the nine initial conditions, the difference in SWCCs of the tested compacted granite residual soil is obvious within the suction range of 10–1000 kPa, changes less within the suction range of 1000–10,000 kPa, and tends to be similar in the high suction range above 10,000 kPa. This phenomenon is consistent with the change of PSD curve among the different initial conditions. The size and volume of inter-aggregate pores change obviously with the initial conditions, which correspond to the change of the SWCC within the low- and middle- suction ranges. In contrast, the intra-aggregate pores are almost not affected by the initial conditions, thus the difference in SWCCs among the different initial conditions within the high-suction range is unobvious.
As the compaction energy increases, the size and volume of inter-aggregate pores decreases significantly (Figure 7). According to the Young–Laplace equation expressed by Equation (10), the matric suction is inversely proportional to the pore diameter. Thus, as the inter-aggregate pores are compressed, the water retention capacity of the tested soil is improved.
where s is the matric suction; d is the pore diameter; Tw is the surface tension of water; and θw is the contact angle between the water and soil interface.
As the compaction water content increases from OMC − 5% to OMC, the aggregates in the pore structure are not fully filled by the adsorbed water, and the pintra values change obviously. This suggests an unstable pore structure, and, thus, the SWCC is affected by the compaction energy significantly. In contrast, as the compaction water content increases to OMC or above, the Sr, a reach 1.0 and the main proportion of the pore structure tends to be stable, thus the SWCC is less sensitive to the change in the compaction energy.
3.3. Determination of the 3D Bimodal SWCC Equation
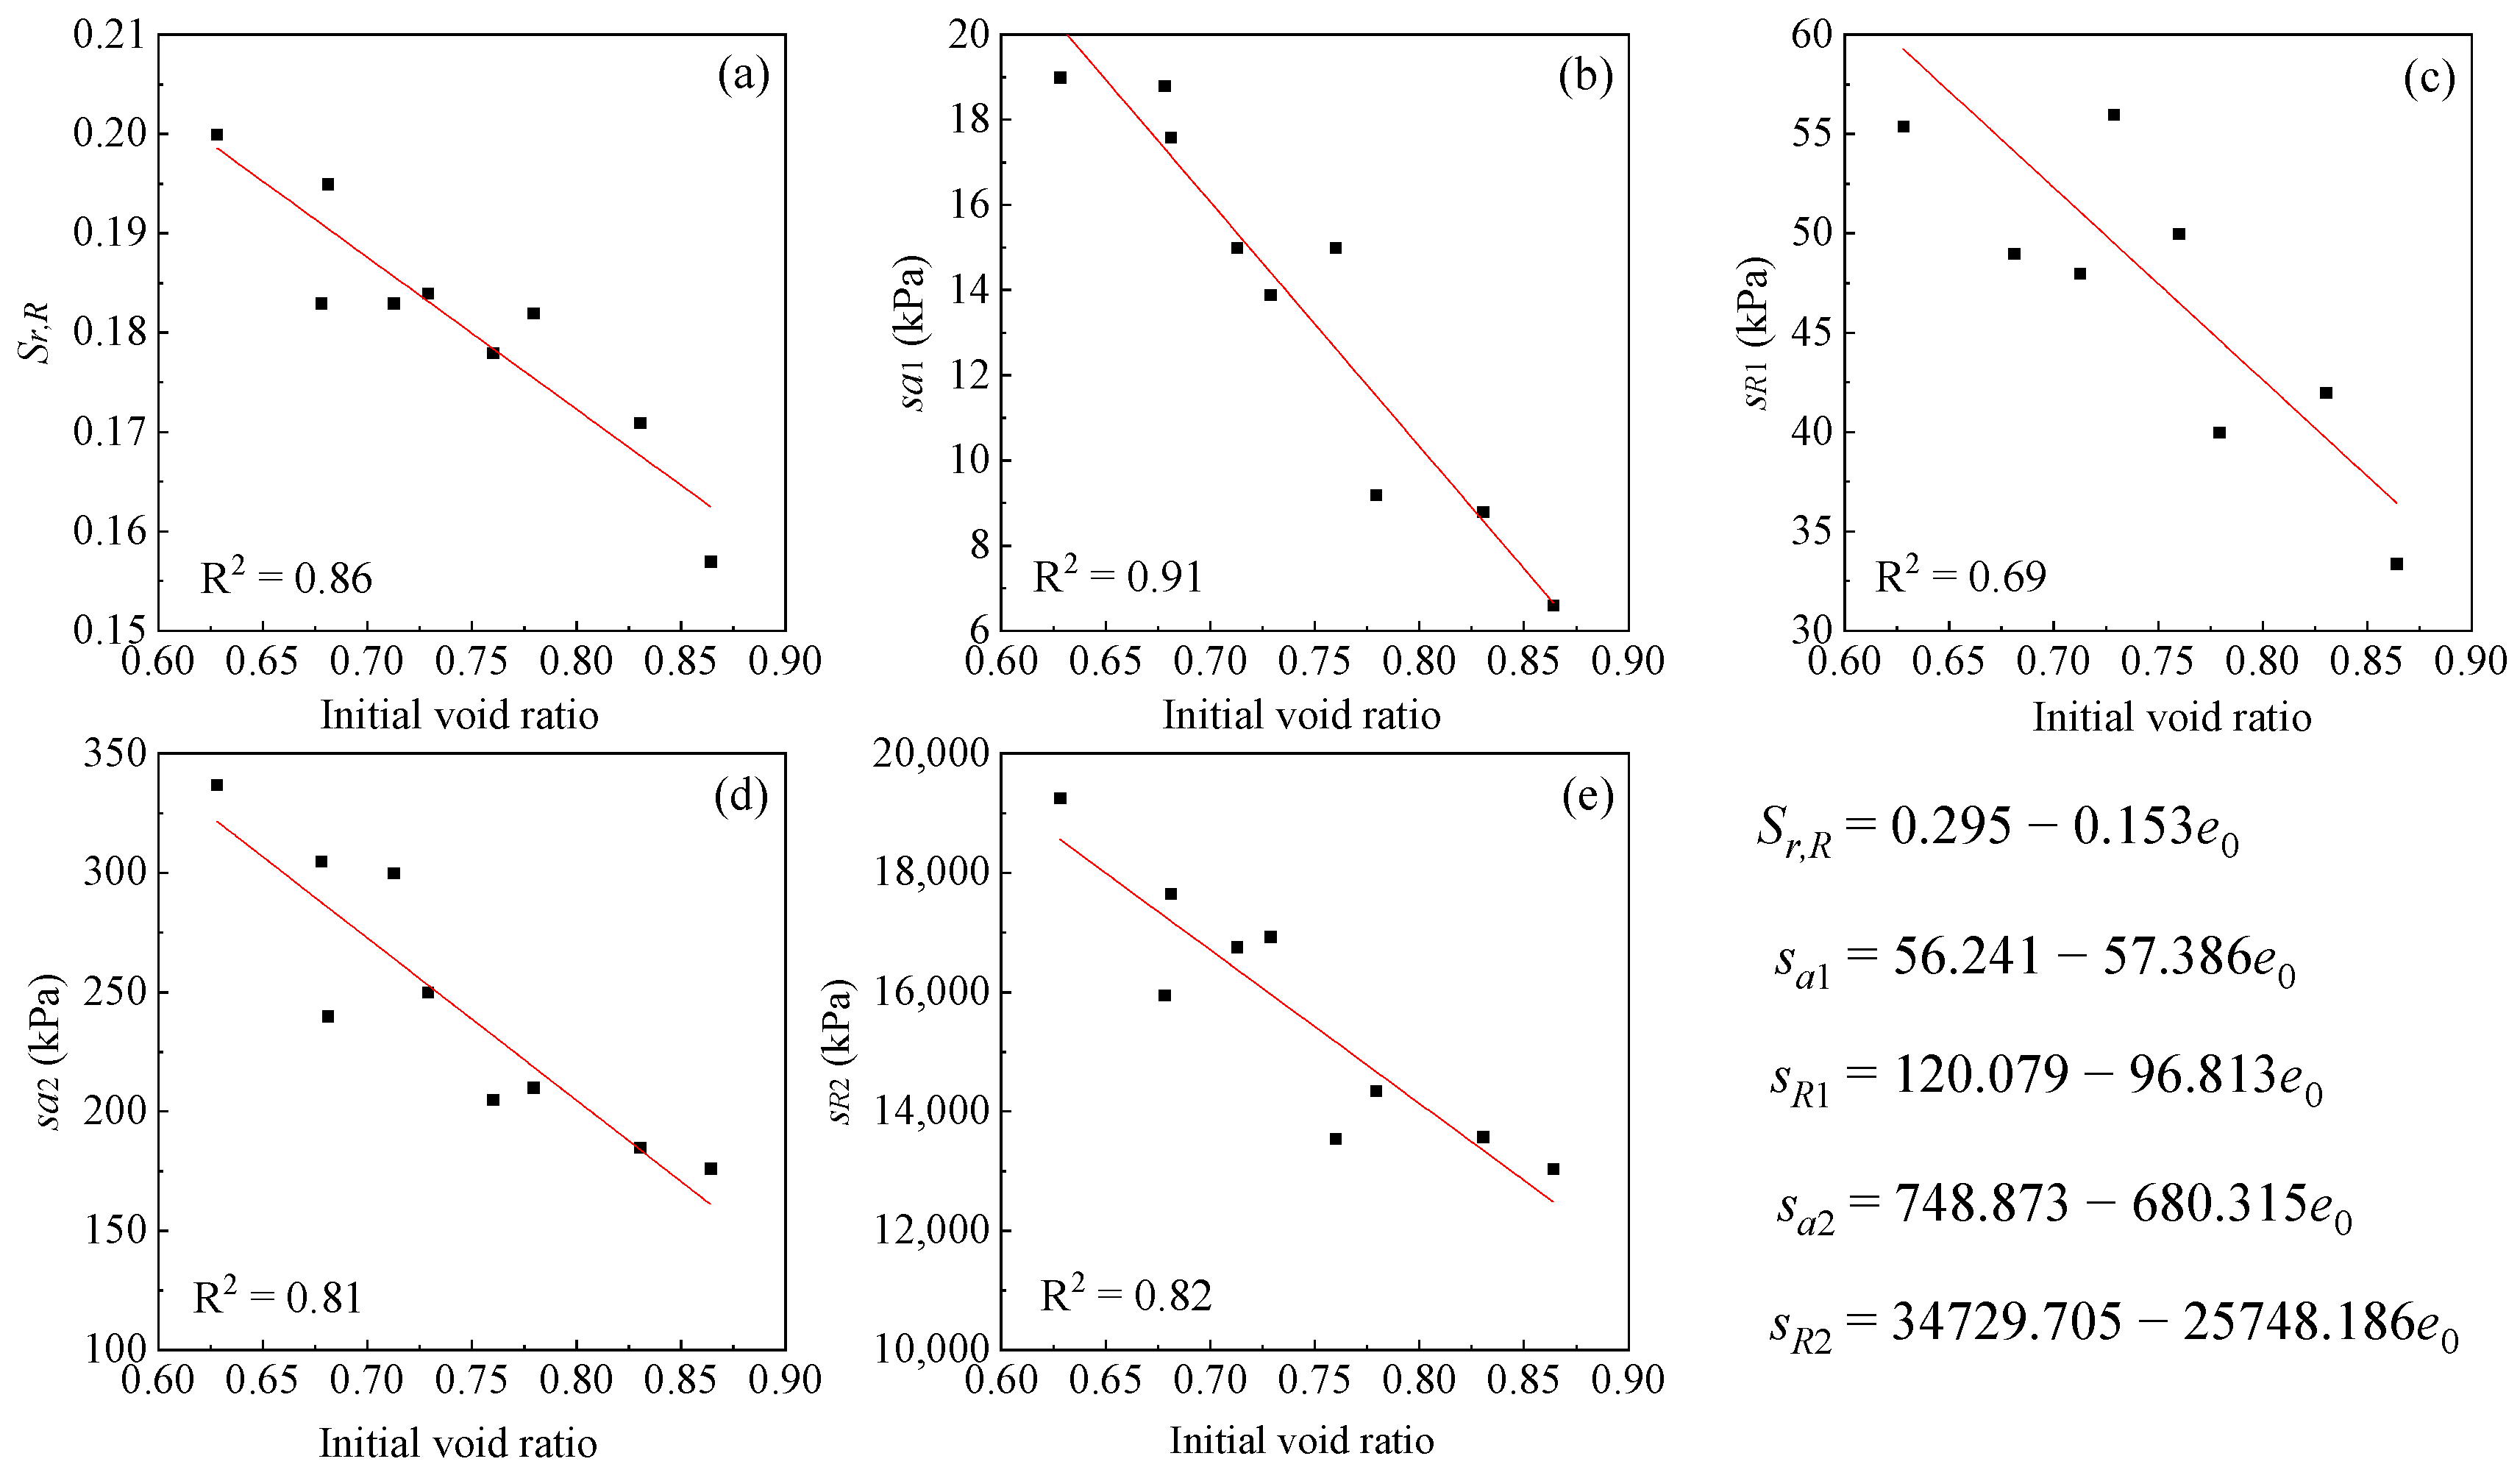
The analysis above suggests that the pore structure and the SWCC are closely correlated with the initial conditions. To facilitate the application of the SWCC, a single equation can be established to describe the water retention capacity of the granite residual soil under the various initial conditions by extending the equation from 2D to 3D. Considering the formation of existing 3D SWCC functions [35,36,39], the initial void ratio is selected as the third variable to characterize the influence of the initial conditions on the SWCC. Figure 15 shows the correlation of the initial void ratio e0 and all the five SWCC fitting parameters. It can be seen that all relationships can be described using linear fitting, and the equations are also listed in Figure 15.
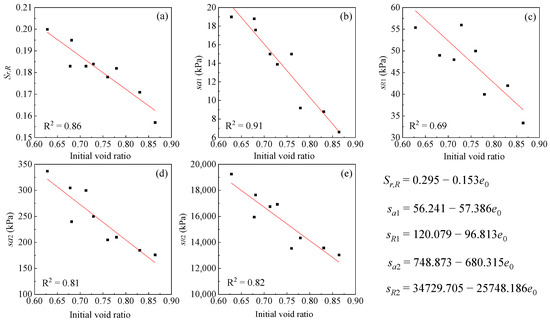
Figure 15.
Variation of SWCC fitting parameters with initial conditions: (a) Sr, R, (b) sa1, (c) sa2, (d) sR1 and (e) sR2
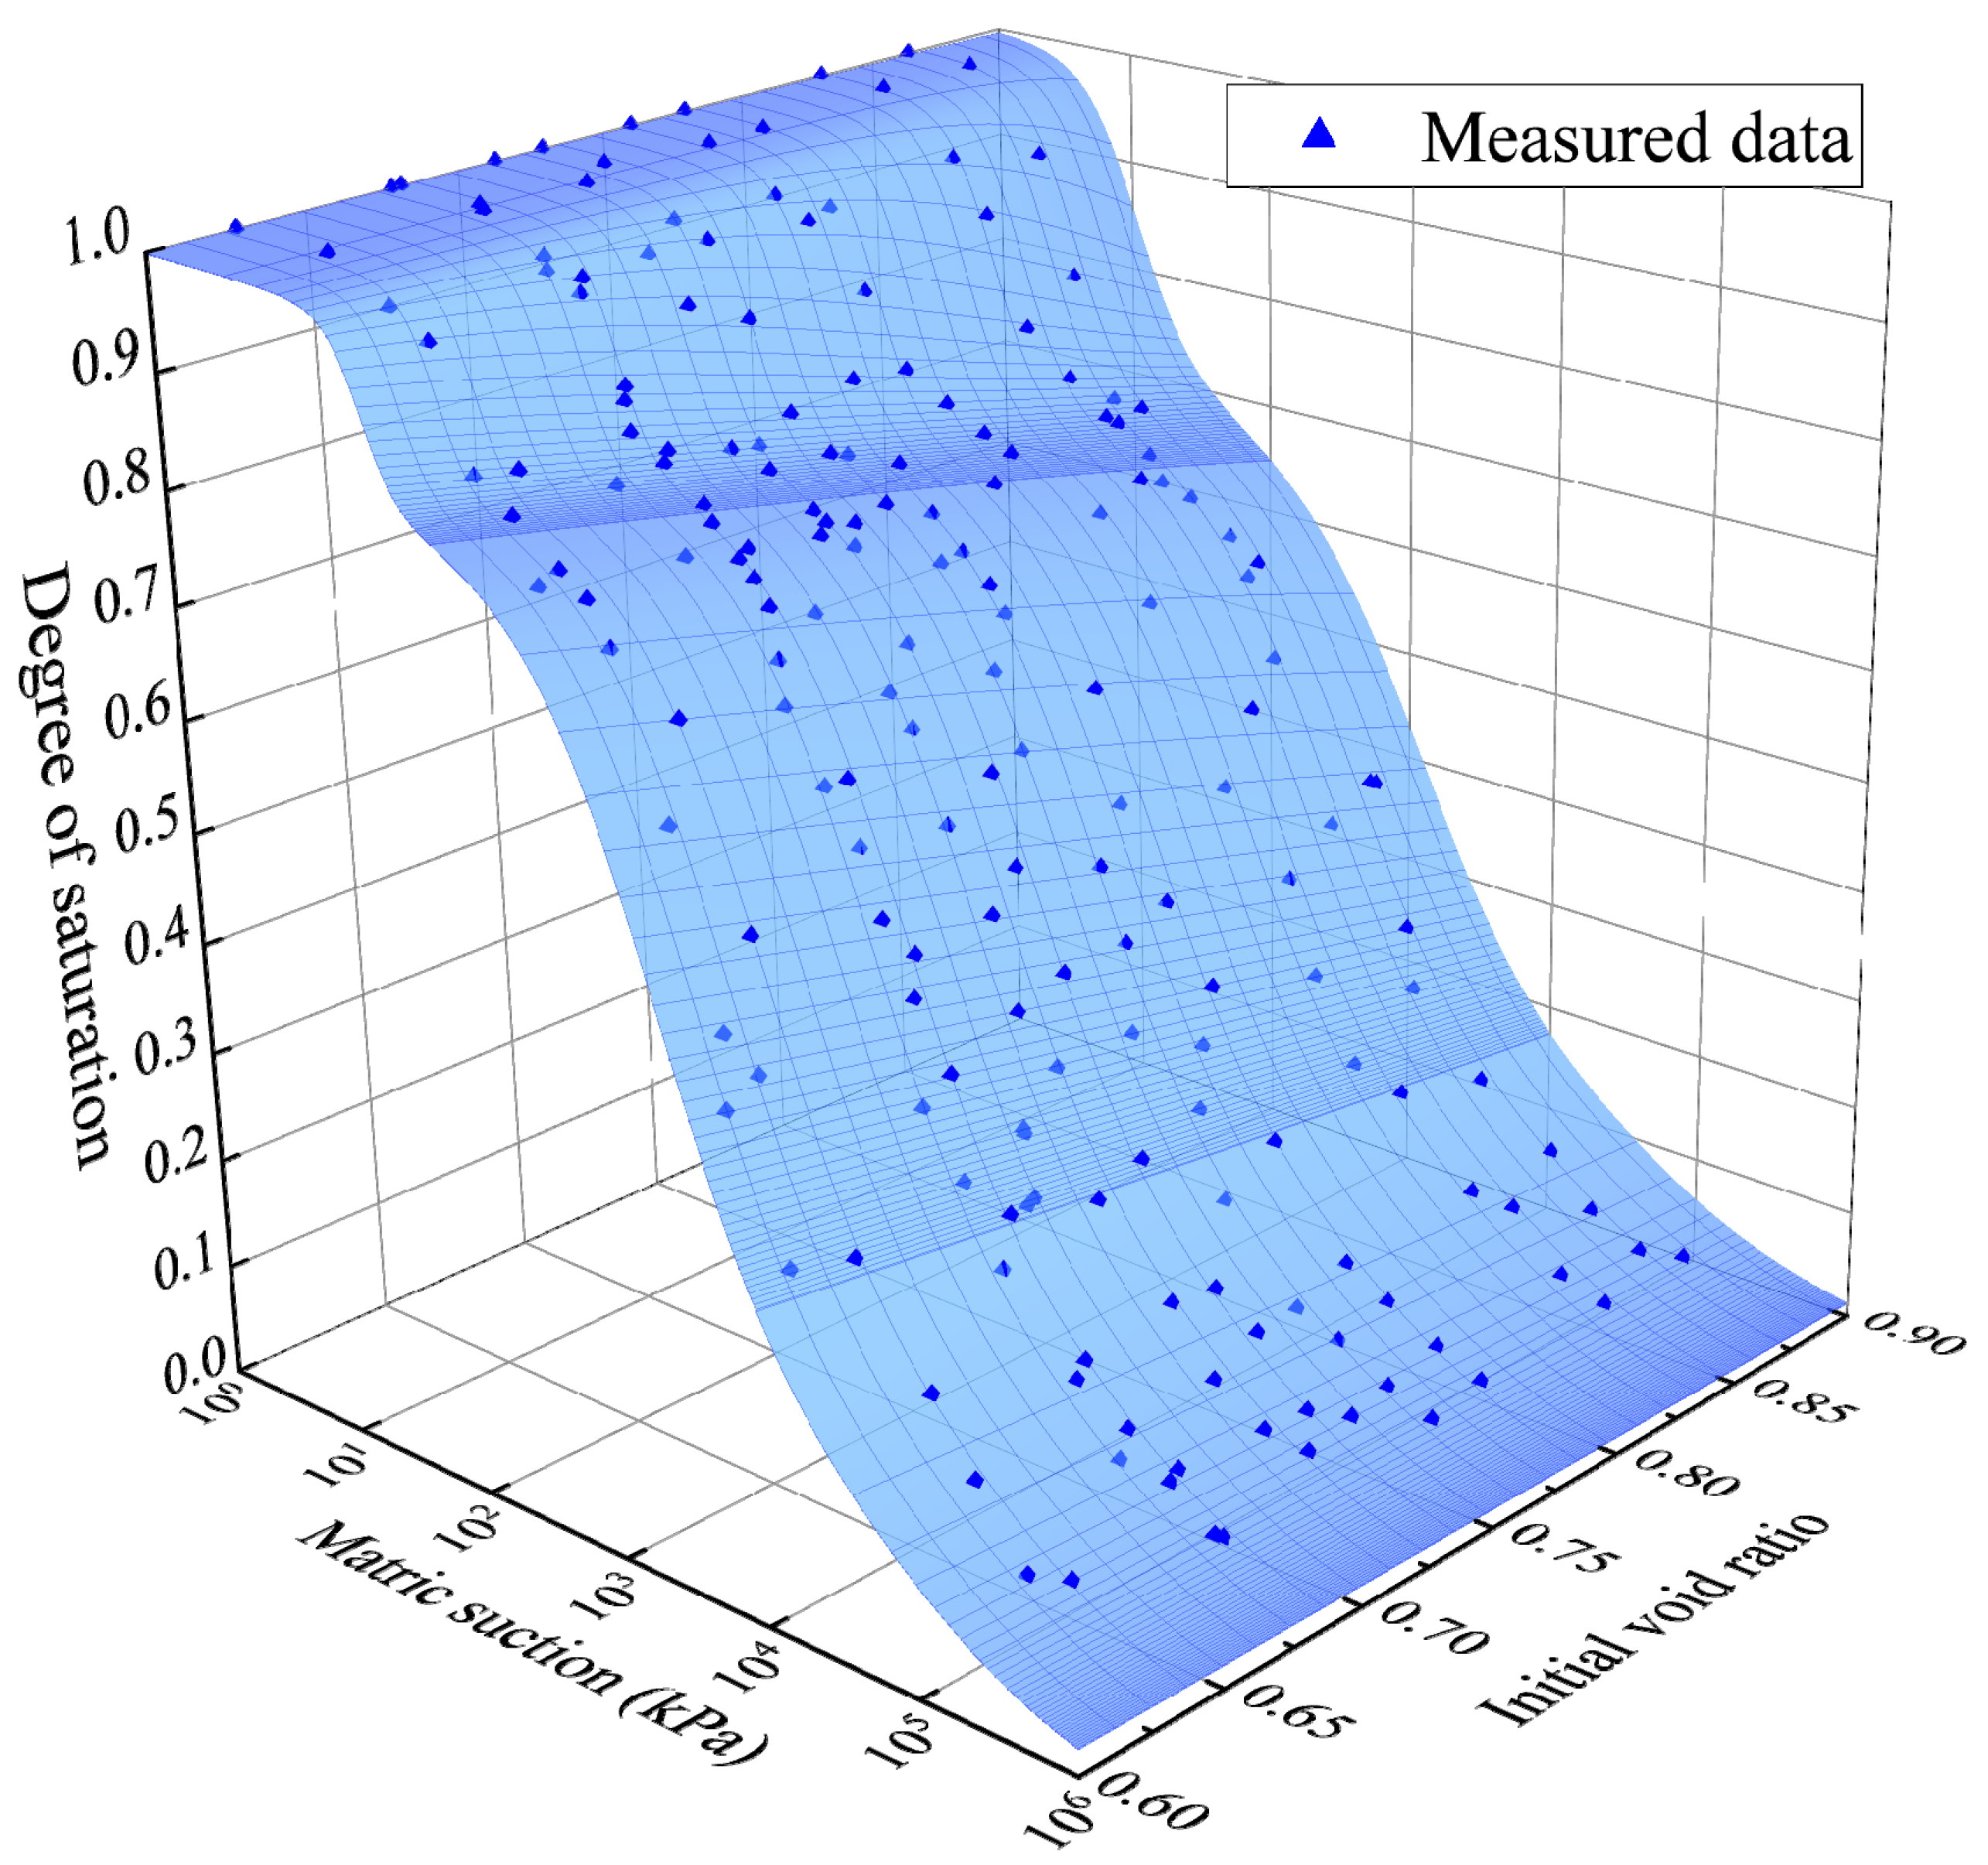
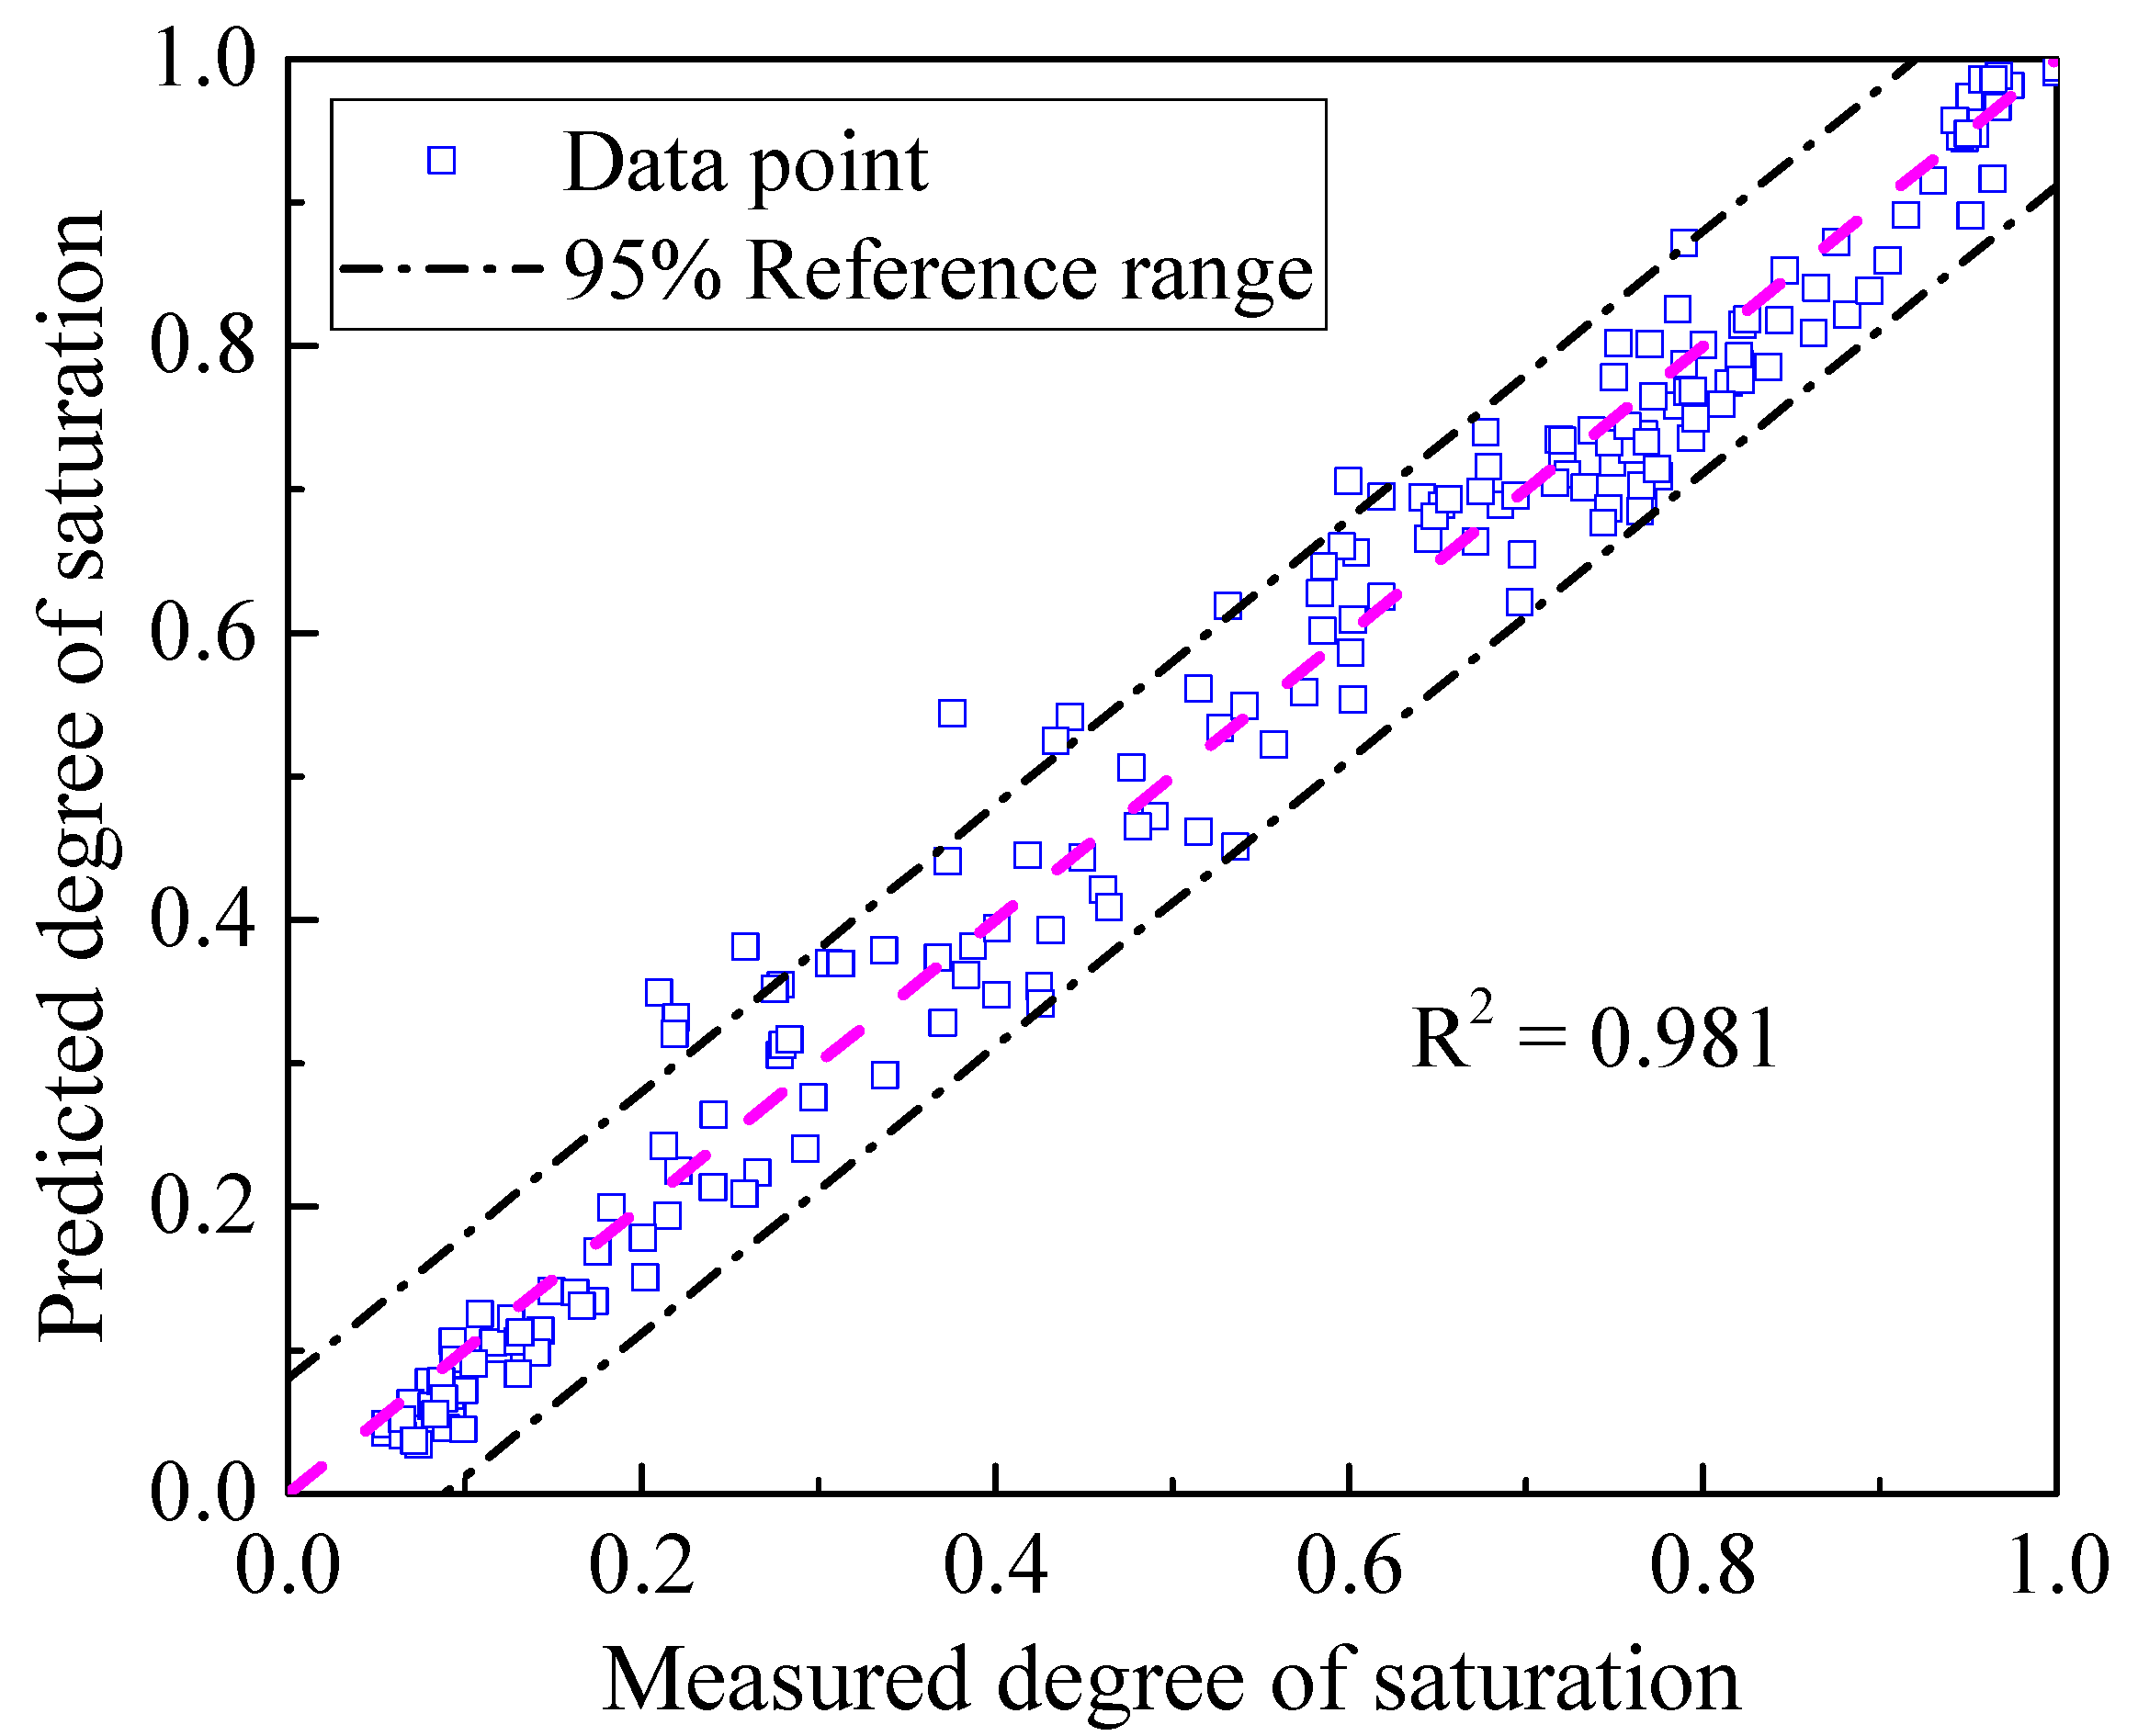
The 3D SWCC equation and all the test data are depicted in Figure 16. It can be seen that the proposed 3D SWCC equation can capture the main characteristics of the bimodal SWCC and its variations among the different initial conditions. Figure 17 shows that the 3D bimodal SWCC equation fits the measured data well for the entire suction range with a high R2 value, which proves the effectiveness of the method used in this paper.

Figure 16.
Three-dimensional SWCC based on Equation (9) and all the test data.
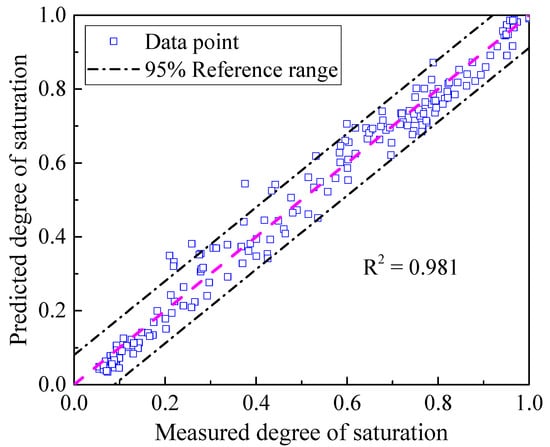
Figure 17.
Comparison of measured and predicted degree of saturation.
As the initial void ratio increases, all the fitting parameters of Equation (9) decrease, and the SWCCs tend to be lower in the degree of saturation/matric suction/initial void ratio (Sr-s-e0) space. The range of matric suction and degree of saturation covered by the first “s” shape increases with the increase in the initial void ratio. The starting suction value of the second “s” shape increases with the increase in the initial void ratio, accompanied by a gradual decrease in the slope of the descending section. These findings suggest that an increase in the density of granite residual soil results in a greater compression of inter-aggregate pores, leading to an overall enhancement of water retention capacity, especially within the middle-suction range.
Given the linear relationship between each fitting parameter and the initial void ratio, a recommended approach for utilizing the proposed 3D bimodal SWCC equation is presented. First, compute the initial void ratios based on physical parameters obtained from soil proctor curves. Subsequently, select several initial conditions with significantly different initial void ratios for SWCC testing, and then determine the proposed 3D bimodal SWCC equation. Following this, the bimodal SWCC for the untested initial conditions can be calculated. This approach can significantly reduce the number and duration of SWCC tests, facilitating the application of bimodal SWCCs in the design and research of unsaturated soil–water characteristic curves in practical engineering.
4. Conclusions
This paper investigated the bimodal SWCC and pore structure of a compacted granite residual soil using several laboratory tests. Nine initial conditions were selected based on the proctor curves, and the effect of the initial conditions on the PSD and SWCCs was thoroughly examined. Based on the results and findings, the following conclusions can be derived:
- The tested granite residual soil presents a bimodal pore size distribution and bimodal SWCC for all the initial conditions, demonstrating a clear correlation between pore structure and SWCC variations.
- The size and volume of inter-aggregate pores change noticeably with the initial conditions, leading to changes of the SWCCs within the low- and middle-suction range. In contrast, intra-aggregate pores remain relatively unchanged, resulting in less pronounced differences in SWCCs within the high-suction range.
- Incomplete filling of aggregates by adsorbed water leads to noticeable changes in pintra values, and the SWCC is significantly affected by the compaction energy. After the saturation of aggregates, the stabilized pore structure reduces sensitivity of the SWCC to the compaction energy.
- The proposed 3D bimodal SWCC model captures the main characteristics and variations of SWCCs among initial conditions in the Sr-s-e0 space and exhibits strong agreement with laboratory test data (R2 > 0.98).
Author Contributions
Conceptualization, X.C.; Software, M.M.; Methodology, S.Z.; Validation, M.H.; Data curation, K.Z.; Writing—original draft, S.W. All authors have read and agreed to the published version of the manuscript.
Funding
The study is funded by the National Natural Science Foundation of China (U1833123), the National Key Research and Development Program of China (2018YFB1600201), and the DOT of Jiangxi Province, China.
Data Availability Statement
Some or all of the data or code supporting the results of this study are available from the corresponding authors upon request.
Conflicts of Interest
Authors X.C., M.M., S.Z. and S.W. were employed by the China Construction Eighth Engineering Division Co., Ltd. The remaining authors declare that the research was conducted in the absence of any commercial or financial relationships that could be construed as a potential conflict of interest.
Abbreviations
| 3D | three-dimensional |
| MIP | mercury intrusion porosimetry |
| MP | modified proctor |
| OMC | optimum moisture content |
| PSD | pore size distribution |
| RH | relative humidity |
| RP | reduced proctor |
| SEM | scanning electronic microscope |
| SP | standard proctor |
| SWCC | soil–water characteristic curve |
| XRD | X-ray powder diffraction |
References
- Yao, Y.S.; Ni, J.J.; Li, J. Stress-dependent water retention of granite residual soil and its implications for ground settlement. Comput. Geotech. 2021, 129, 103835. [Google Scholar] [CrossRef]
- Luan, S.; Wang, F.; Wang, T.; Zhao, L.; Shui, E. Characteristics of gravelly granite residual soil in bored pile design: An in-situ test in Shenzhen. Adv. Mater. Sci. Eng. 2018, 7598154. [Google Scholar] [CrossRef]
- Zhao, Y.R.; Sun, X.H.; Wen, T.D.; Chen, R.; Huang, L. Micro-structural evolution of granite residual soil under external loading based on X-ray micro-computed tomography. KSCE J. Civ. Eng. 2021, 25, 2836–2846. [Google Scholar] [CrossRef]
- Mohsen, A.; Ramadan, M.; Gharieb, M.; Yahya, A.; Soltan, A.M.; Hazem, M.M. Rheological behaviour, mechanical performance, and anti-fungal activity of OPC-granite waste composite modified with zinc oxide dust. J. Clean. Prod. 2022, 341, 130877. [Google Scholar] [CrossRef]
- Fredlund, D.G.; Rahardjo, H. Soil Mechanics for Unsaturated Soils; John Wiley & Sons: Hoboken, NJ, USA, 1993. [Google Scholar]
- Rahardjo, H.; Lim, T.; Chang, M.F.; Fredlung, D.G. Shear-strength characteristics of a residual soil. Can. Geotech. J. 1995, 32, 60–77. [Google Scholar] [CrossRef]
- Gan, J.K.M.; Fredlund, D.G. Shear strength characteristics of two saprolitic soils. Can. Geotech. J. 1996, 33, 595–609. [Google Scholar] [CrossRef]
- Romero, E.; Gens, A.; Lloret, A. Water permeability, water retention and microstructure of unsaturated compacted Boom clay. Eng. Geol. 1999, 54, 117–127. [Google Scholar] [CrossRef]
- Birle, E.; Heyer, D.; Vogt, N. Influence of the initial water content and dry density on the soil-water retention curve and the shrinkage behavior of a compacted clay. Acta Geotech. 2008, 3, 191–200. [Google Scholar] [CrossRef]
- Wang, K.; Hui, Y.; Zhou, C.; Li, X.; Rong, Y. Soil-water characteristic surface model of soil-rock mixture. J. Mt. Sci. 2023, 20, 2756–2768. [Google Scholar] [CrossRef]
- Williams, J.; Prebble, R.E.; Williams, W.T. The influence of texture, structure and clay mineralogy on the soil moisture characteristic. Soil Res. 1983, 21, 15–32. [Google Scholar] [CrossRef]
- Leong, E.C.; Rahardjo, H. Review of soil-water characteristic curve equations. J. Geotech. Geoenviron. Eng. 1997, 123, 1106–1117. [Google Scholar] [CrossRef]
- Xie, X.; Li, P.; Hou, X.K.; Li, T.; Zhang, G. Microstructure of compacted loess and its influence on the soil-water characteristic curve. Adv. Mater. Sci. Eng. 2020, 5, 3402607. [Google Scholar] [CrossRef]
- Romero, E.; Vaunat, J. Retention curves of deformable clays. In Experimental Evidence and Theoretical Approaches in Unsaturated Soils; CRC Press: Boca Raton, FL, USA, 2000; pp. 91–106. [Google Scholar]
- Ng, C.W.W.; Pang, Y.W. Influence of stress state on soil-water characteristics and slope stability. J. Geotech. Geoenvironmental Eng. 2020, 126, 157–166. [Google Scholar] [CrossRef]
- Ng, C.W.W.; Pang, Y.W. Experimental investigations of the soil-water characteristics of a volcanic soil. Can. Geotech. J. 2000, 37, 1252–1264. [Google Scholar] [CrossRef]
- Tarantino, A.; Tombolato, S. Coupling of hydraulic and mechanical behaviour in unsaturated compacted clay. Géotechnique 2005, 55, 307–317. [Google Scholar] [CrossRef]
- Xiao, T.; Li, P.; Pan, Z.; Hou, Y.; Wang, J. Relationship between water retention capacity and pore-size distribution of compacted loess. J. Soils Sediments 2022, 22, 3151–3165. [Google Scholar] [CrossRef]
- Guoquan, D.; Xia, B.; Junping, Y.; Jungao, Z. Bimodal SWCC and bimodal PSD of soils with dual-porosity structure. Math. Probl. Eng. 2022, 4052956. [Google Scholar]
- Tao, G.; Chen, Y.; Xiao, H.; Chen, Q.; Wan, J. Determining soil-water characteristic curves from mercury intrusion porosimeter test data using fractal theory. Energies 2019, 12, 752. [Google Scholar] [CrossRef]
- Barden, L.; Sides, G.R. Engineering behavior and structure of compacted clay. J. Soil Mech. Found. Div. 1970, 96, 1171–1200. [Google Scholar] [CrossRef]
- Sridharan, A.; Altachaeffl, A.G.; Diamond, S. Pore size distribution studies. J. Soil Mech. Found. Div. 1971, 97, 771–787. [Google Scholar] [CrossRef]
- Alonso, E.E.; Gens, A.; Josa, A. A constitutive model for partially saturated soils. Géotechnique 1990, 40, 405–430. [Google Scholar] [CrossRef]
- Sasanian, S.; Newson, T.A. Use of mercury intrusion porosimetry for microstructural investigation of reconstituted clays at high water contents. Eng. Geol. 2013, 158, 15–22. [Google Scholar] [CrossRef]
- Nowamooz, H. Effective stress concept on multi-scale swelling soils. Appl. Clay Sci. 2014, 101, 205–214. [Google Scholar] [CrossRef]
- Li, X.; Zhang, L.M. Characterization of dual-structure pore-size distribution of soil. Can. Geotech. J. 2009, 46, 129–141. [Google Scholar] [CrossRef]
- Satyanaga, A.; Rahardjo, H.; Leong, E.C.; Wang, J.Y. Water characteristic curve of soil with bimodal grain-size distribution. Comput. Geotech. 2013, 48, 51–61. [Google Scholar] [CrossRef]
- Zhao, Y.; Rahardjo, H.; Satyanaga, A.; Zhai, Q.; He, J. A General Best-Fitting Equation for the Multimodal Soil-Water Characteristic Curve. Geotech. Geol. Eng. 2023, 41, 3239–3252. [Google Scholar] [CrossRef]
- Tao, R.; Cao, Z.; Pan, Y. Effects of bimodal SWCC on unsaturated loess slope stability analysis. In Geo-Risk 2023: Developments in Reliability, Risk, and Resilience; Geotechnical Special Publication: Arlington, VA, USA, 2023; Volume 346, pp. 291–300. [Google Scholar]
- Vanapalli, S.K.; Fredlund, D.G.; Pufahl, D.E. The influence of soil structure and stress history on the soil-water characteristics of a compacted till. Géotechnique 1999, 51, 573–576. [Google Scholar] [CrossRef]
- Burger, C.A.; Shackelford, C.D. Evaluating dual porosity of pelletized diatomaceous earth using bimodal soil-water characteristic curve functions. Can. Geotech. J. 2001, 38, 53–66. [Google Scholar] [CrossRef]
- Gould, S.; Rajeev, P.; Kodikara, J.; Zhao, X.L.; Burn, S.; Marlow, D. A new method for developing equations applied to the water retention curve. Soil Sci. Soc. Am. J. 2012, 76, 806–814. [Google Scholar] [CrossRef]
- Van Genuchten, M.T. A closed-form equation for predicting the hydraulic conductivity of unsaturated soils. Soil Sci. Soc. Am. J. 1980, 44, 892–898. [Google Scholar] [CrossRef]
- Fredlund, D.G.; Xing, A.Q. Equations for the soil-water characteristic curve. Can. Geotech. J. 1994, 31, 521–532. [Google Scholar] [CrossRef]
- Gallipoli, D.; Wheeler, S.J.; Karstunen, M. Modelling the variation of degree of saturation in a deformable unsaturated soil. Géotechnique 2003, 53, 105–112. [Google Scholar] [CrossRef]
- Tarantino, A. A water retention model for deformable soils. Géotechnique 2009, 59, 751–762. [Google Scholar] [CrossRef]
- Salager, S.; El Youssoufi, M.S.; Saix, C. Definition and experimental determination of a soil-water retention surface. Can. Geotech. J. 2010, 47, 609–622. [Google Scholar] [CrossRef]
- Zhou, W.H.; Yuen, K.V.; Tan, F. Estimation of soil-water characteristic curve and relative permeability for granular soils with different initial dry densities. Eng. Geol. 2014, 179, 1–9. [Google Scholar] [CrossRef]
- Wijaya, M.; Leong, E.C. Modelling the effect of density on the unimodal soil-water characteristic curve. Géotechnique 2017, 67, 637–645. [Google Scholar] [CrossRef]
- JTG 3430-2020; Test Methods of Soils for Highway Engineering. Research Institute of Highway Ministry of Transport: Beijing, China, 2020. (In Chinese)
- Ramadan, M.; Kohail, M.; Abadel, A.A.; Alharbi, Y.R.; Tuladhar, R.; Mohsen, A. De-aluminated metakaolin-cement composite modified with commercial titania as a new green building material for gamma-ray shielding applications. Case Stud. Constr. Mater. 2022, 17, e01344. [Google Scholar] [CrossRef]
- Mohsen, A.; Kohail, M.; Abadel, A.A.; Alharbi, Y.R.; Nehdi, M.L.; Ramadan, M. Correlation between porous structure analysis, mechanical efficiency and gamma-ray attenuation power for hydrothermally treated slag-glass waste-based geopolymer. Case Stud. Constr. Mater. 2022, 17, e01505. [Google Scholar] [CrossRef]
- Mohsen, A.; Amin, M.S.; Waly, S.A.; Ramadan, M. Rheological behavior, mechanical properties, fire resistance, and gamma ray attenuation capability for eco-friendly cementitious mixes incorporating thermally treated lead sludge. Constr. Build. Mater. 2022, 359, 129479. [Google Scholar] [CrossRef]
- ASTM D 5298-16; Standard Test Method for Measurement of Soil Potential (Suction) Using Filter Paper. ASTM International: West Conshohocken, PA, USA, 2016.
- Blatz, J.A.; Cui, Y.J.; Oldecop, L. Vapour Equilibrium and Osmotic Technique for Suction Control. Geotech. Geol. Eng. 2008, 26, 661–673. [Google Scholar] [CrossRef]
- Aldaood, A.; Bouasker, M.; Al-Mukhtar, M. Soil-water characteristic curve of lime treated gypseous soil. Appl. Clay Sci. 2014, 102, 128–138. [Google Scholar] [CrossRef]
- Tarantino, A.; De, C.E. Compaction behaviour of clay. Géotechnique 2008, 58, 199–213. [Google Scholar] [CrossRef]
- Alonso, E.E.; Pinyol, N.M.; Gens, A. Compacted soil behaviour: Initial state, structure and constitutive modelling. Géotechnique 2013, 63, 463–478. [Google Scholar] [CrossRef]
- Rosone, M.; Farulla, C.A.; Ferrari, A. Shear strength of a compacted scaly clay in variable saturation conditions. Acta Geotech. 2016, 11, 37–50. [Google Scholar] [CrossRef]
- Delage, P.; Audiguier, M.; Cui, Y.J.; Howat, M.D. Microstructure of a compacted silt. Can. Geotech. J. 1996, 33, 150–158. [Google Scholar] [CrossRef]
- Zhou, A.N.; Huang, R.Q.; Sheng, D.C. Capillary water retention curve and shear strength of unsaturated soils. Can. Geotech. J. 2016, 53, 974–987. [Google Scholar] [CrossRef]
- Li, X.; Li, J.H.; Zhang, L. Predicting bimodal soil-water characteristic curves and permeability functions using physically based parameters. Comput. Geotech. 2014, 57, 85–96. [Google Scholar] [CrossRef]


Disclaimer/Publisher’s Note: The statements, opinions and data contained in all publications are solely those of the individual author(s) and contributor(s) and not of MDPI and/or the editor(s). MDPI and/or the editor(s) disclaim responsibility for any injury to people or property resulting from any ideas, methods, instructions or products referred to in the content. |
© 2024 by the authors. Licensee MDPI, Basel, Switzerland. This article is an open access article distributed under the terms and conditions of the Creative Commons Attribution (CC BY) license (https://creativecommons.org/licenses/by/4.0/).