Article

Smoothed Particle Hydrodynamics (SPH) Analysis of Slope Soil–Retaining Wall Interaction and Retaining Wall Motion Response

College of Engineering and Technology, Southwest University, Chongqing 400715, China
*
Author to whom correspondence should be addressed.
Processes 2024, 12(2), 411; https://doi.org/10.3390/pr12020411
Submission received: 14 January 2024 / Revised: 6 February 2024 / Accepted: 9 February 2024 / Published: 18 February 2024
(This article belongs to the Section Particle Processes)

Abstract

:
The occurrence of slope instability disasters seriously endangers the safety of people’s lives and property in China. Therefore, it is essential to study the slope instability process and the interaction between soil and retaining walls. In this paper, the smoothed-particle hydrodynamics (SPH) method, based on the elastoplastic constitutive model of rock and soil, was used to simulate the entire process of slope instability and the interaction between soil and retaining walls. The model, based on the classical elastic–plastic theory, includes linear elastic deformation and plastic deformation following the non-associated flow rule under the Drucker–Prager (DP) yield criterion. By considering the plastic characteristics of geotechnical materials, this method can accurately simulate the slope movement process. The model was established, calculated, and compared with a slope example, thus verifying its feasibility. Furthermore, the motion response of the retaining wall under different conditions was studied, which provides a new numerical simulation platform for the stability checking of the retaining wall and motion analysis after the interaction between the retaining wall and slope soil.

1. Introduction

Natural slopes are very common in complicated environments; however, many artificial slopes are produced by large-scale engineering construction and excavation [1,2,3]. Landslides are a widespread geological disaster globally, causing thousands of deaths and billions in property loss [4]. The study of slope instability and the interaction between slope soil and retaining structure plays an important role in analyzing the whole instability process. The problem of slope instability and its failure involves the process of large soil deformation and soil–structure interaction, which has been the research object of many scholars in recent years. The study of slope stability analysis, motion mechanism, and motion process is mainly conducted in two ways: first, numerical methods based on grids, such as the finite element method (FEM) and the finite difference method (FDM), are adopted to mainly solve the problems identified via slope stability analysis and deformation analysis; the other involves meshless methods, such as the discrete element method (DEM) and the material point method (MPM) [5]. Geotechnical engineers usually use analytical and empirical methods to develop an appropriate model to effectively simulate the engineering site according to the design parameters and engineering characteristics of soil or rock materials [6]. Kumar, V. et al. [7] used the finite element method to analyze stability and added the shear strength reduction method to the finite element method to quantify the existing slope strength and infer the strain and displacement patterns. By analyzing the landslide activity mode, the shear strain and displacement of the slope were determined, and the harmfulness of the landslide zone was evaluated. N. Kotake et al. [8] used the finite element method (FEM) to simulate a series of laboratory model test results of unreinforced sand slope and reinforced sand slope. The results of the FEM simulation of unreinforced sand slope and reinforced sand slope are consistent with the physical experiment results in terms of the load–settlement relationship, strain field showing failure mode, and tension distribution of steel bars in different reinforcement arrangements. Singh, S.K. et al. [9] used the finite difference method (FDM) and the limit equilibrium method (LEM) to conduct numerical analysis on typical slopes common in Indian railways to determine the stability of safety factors under static and seismic conditions. Maugeri, M. et al. [10] put forward a mathematical model to predict the viscous deformation of landslides based on the FDM method, which has been verified in a landslide case in Gagliano Castelferrato, Italy. However, the numerical method based on the grid will appear as grid distortion, which will lead to large calculation errors or even non-convergence [11]. It is necessary to use a meshless method to simulate the large deformation of a slope in specific scenes. Li, S.H. et al. [12] studied the critical excavation depth of two ideal jointed rock slopes by using the DEM method. In addition, the influence of joints on failure modes in the DEM simulation and experimental observation was compared. It was found that the critical excavation depth predicted by DEM is lower than that predicted by LEM if the joint structure in the rock mass is not considered. Wang, H.B. et al. [13] put forward a discrete element modeling method (DSDM) based on displacement statistics. The stability of jointed rock slopes was analyzed by the coupled shear strength reduction method (SRM). Its innovation lies in using the global displacement statistics around the potential slip surface of jointed slopes instead of the local displacements of several characteristic points to define the criteria for terminating the iterative calculation process of DEM and determining FOS. Therefore, the DSDM method can effectively analyze the stability of jointed slopes with potential slip surfaces. Feng, Z.K. et al. [14] developed a high-performance MPM based on GPU and introduced the strength reduction method (SRM) for a quantitative analysis of slope failure risk assessment. By comparing the results of MPM with those of the limit equilibrium method (LEM), the results showed that the accuracy of MPM-SRM for landslide failure mechanics and deformation characteristics exceeds LEM, and based on this method, the stability and failure mechanism of east temple slope downstream of Xiaolangdi Dam in China were analyzed. Wu, F.Y. et al. [15] established the foundation friction algorithm based on the MPM method and calculated the foundation friction considering pore water pressure. The effectiveness of MPM in simulating the dynamic process of soil landslide was verified by a large-scale debris flow test, and the depth of debris flow calculated by MPM is consistent with the experimental results.
SPH was originally proposed to solve astrophysical problems in three-dimensional open space and has been widely studied and expanded [16,17,18]; it has been applied to dynamic response problems with material strength and hydrodynamic problems with large deformation. SPH is mesh-free, immune to the mesh distortion problem in FEM/FDM, and able to directly simulate the large deformation of soils that occurs during landslides. A series of slope stability analyses were performed using an in-house SPH program [19]. Yu, M. et al. [20] used the SPH model to predict the mobility of unstable slopes after failure and extended the application of the SPH model from disaster simulation to the prediction and analysis of unstable landslides. The stability of the SPH method was proved by comparing the two groups. Mori, H. et al. [21] modeled the shear strength parameters of soil as random variables and simulated the random field to explore the influence of soil variability on the runout distance. In addition, the uncertainty of rainfall characteristics was expressed by the Gumbel distribution, and the subsequent rainfall infiltration was simulated in a multiple seepage analysis to obtain the pore pressure profile of the slope, which was used as the initial condition of the SPH method. Combined with these different sources of uncertainty, according to the response uncertainty of landslide runout distance, the risk factors indicating the risk of nearby structures were quantified. Lian, Y.J. et al. [22] put forward the first and fully validated smoothed-particle hydrodynamics (SPH) model to solve the flow–deformation coupling problem in unsaturated porous media that undergoes large deformation and post-failure behavior. The ability of the proposed SPH model was verified by a basic consolidation test and large-scale rainfall-induced slope failure test. The theoretical solution was in good agreement with the experimental results, which shows that the proposed SPH model can be easily extended to solve large-scale geotechnical engineering applications involving unsaturated seepage deformation coupling problems. Hu, Y.X. et al. [23] established a coupled discrete element method (DEM) and smoothed-particle hydrodynamics (SPH) method to predict the whole process of landslide, wave generation, and wave propagation on the top slope of the Houziyan Reservoir in Sichuan. The DEM-SPH coupling simulation method proposed provides important enlightenment for reservoir landslide prevention and control.
The use of the SPH method has made good progress in the study of slope problems, but most of the current research focuses on the deformation of the soil after slope instability, and research on the impact of slope soil on the environment after instability is lacking. To further study the influence of slope instability, a soil–retaining wall interaction model was proposed by using the SPH method combined with the soil elastic–plastic constitutive model, and the model was verified. In addition, the motion law of retaining walls under different initial conditions was analyzed, which provides a new idea for the motion response analysis of retaining walls.

2. Numerical Simulation Method

2.1. SPH Theory

The core idea of the SPH method is to describe a continuous fluid or solid by utilizing interacting particle groups, with each particle representing a specific region within the problem domain of SPH. Each particle carries various physical parameters including density, mass, velocity, and acceleration. By solving the control equation for the particle groups, the mechanical behavior of the entire system can be obtained. The SPH solution consists of two key steps: the first step involves the approximation of the kernel function, and the second step involves particle approximation. These steps are as follows:
Kernel function approximation: The field functions (such as mass, velocity, density, etc.) are approximated by the following equation:
f x = f x δ x x d x
where f is a function of particle arbitrary space vector x; δ is Dirac function.
δ x x = 1 , x = x 0 , x x
δ can only approximate the space vector function at one point, so the SPH discrete model cannot be constructed. If the smoothing function w is used instead of δ , the formula above can be expressed as follows:
f x = f x W x x , h d x
where h is the smooth length, which indicates the influence range of the smooth function—that is, the support domain. The choice of smoothing function has a great influence on the accuracy, efficiency, and stability of the calculation results. The smoothing function in this paper adopts the cubic spline function [24]:
W ( q , h ) = α d 2 3 q 2 + 1 2 q 3 , 0 q < 1 1 6 ( 2 q ) 3 , 1 q < 2 0 , q 2
where q is the relative distance between particles from x to x , q = x x h ; α d is a fixed coefficient. In one-dimensional, two-dimensional, and three-dimensional problems, there are α d = 1 h , α d = 15 7 π h 2 , α d = 3 2 π h 3 . The aim is to find the spatial derivative of Equation (3), and the derivative integral expression of the function is as follows:
f x = f x W x x , h d x
Particle approximation: The partial differential equations to be solved in fluid force problems are transformed into a series of discrete ordinary differential equations by particle approximation.
f x = f x W x x , h d x j = 1 n f x j W x i x j , h Δ V j j = 1 n f x j W x i x j , h 1 ρ j ρ j Δ V j j = 1 n m j ρ j f x j W x i x j
where n is the number of particles in the support domain; Δ V j is the particle volume, which is used to replace the infinite body element dx′ at the particle j; m j and ρ j represent the mass and density of j, respectively.
Similarly, the particle approximate form of the function space derivative is as follows:
f x i = j = 1 n m j ρ j f x j · W x i x j , h
where W x i x j , h is the gradient of the nucleus, W x i x j , h = x i x j r i j W x i x j , h r i j , r i j = x i x j is the distance between particles i and j.
According to Equations (6) and (7), the SPH form of the Navier–Stokes equation can be obtained.
d ρ i d t = j = 1 n m j v i α v j α W i j x i α d v i α d t = j = 1 n m j σ i α β ρ i 2 + σ j α β ρ j 2 Π i j δ α β · W i j x i β + f α
where t is time, v is the velocity of particles, σ α β is the total stress tensor of the particle, x is the displacement of the particle, and f is the external force on the particle. Π i j is artificial viscosity, which is used to reduce the non-physical oscillation in the numerical results around the impact area [25]. Equation (8) expresses the motion of SPH particles, following the laws of conservation of mass and momentum.
i j = α c ¯ i j μ i j + β μ i j 2 ρ ¯ i j v i j · x i j < 0 0 v i j · x i j 0
where μ i j = h i j v i j x i j x i j 2 + 0.01 h i j 2 , c ¯ i j = c i + c j / 2 , ρ ¯ i j = ρ i + ρ j / 2 , h i j = h i + h j / 2 , c is the speed of sound, and α and β are constants and should be adjusted according to specific examples. When the SPH method simulates the mechanical behavior of solid materials, it will cause tension instability. In this paper, the artificial stress method is introduced, and its core idea is to introduce a kind of short-range repulsive force between a pair of adjacent particles to prevent tension when they come too close to each other [26].
f i j = W i j W ( Δ d , h )
where i and j represent a pair of adjacent particles; Δ d is the distance between two particles.
For two-dimensional problems, the components of artificial stress tensor are as follows:
R i x x = R i x x cos 2 θ i + R i y y sin 2 θ i
R i y y = R i x x sin 2 θ i + R i x x cos 2 θ i
R i x x = R i x x R i y y cos θ i sin θ i
where θ i is the angle.
θ i = 1 2 tan 1 2 σ i x y σ i x x σ i y y
The diagonal component of the artificial stress tensor can be expressed as follows:
R i x x = ϵ σ i x ρ i 2 , σ i x x > 0 0 , e l s e
where ϵ is a constant coefficient between 0 and 1. R i y y is also calculated by a similar expression. The stress tensor of diagonal components, σ i x x and σ i y y , after rotating the coordinate system can be calculated by the following formula:
σ i x x = cos 2 θ i σ i x x + 2 sin θ i cos θ i σ i x y + sin 2 θ i σ i y y σ i y y = sin 2 θ i σ i x x 2 sin θ i cos θ i σ i x y + cos 2 θ i σ i y y

2.2. Constitutive Model

In this paper, the constitutive model of soil adopts the elastic–plastic model, and its total stress tensor consists of elastic and plastic parts.
σ α β = p δ α β + s α β
where σ α β is the total stress tensor, s α β is the shear stress tensor, and p is the hydrostatic pressure. In this paper, according to its standard definition, hydrostatic pressure p is obtained from this constitutive equation:
p = 1 3 I 1 = 1 3 σ x x + σ y y + σ z z
where the compressive stress is negative. For ideal elastic–plastic materials, the strain-rate tensor E . α β is as follows:
E . α β = 1 2 v α x β + v β x α
where E . α β consists of the elastic strain-rate tensor E . e α β and fractional plastic strain-rate tensor E . p α β .
E . α β = E . e α β + E . p α β
According to Hooke’s law,
E . e α β = s ˙ α β 2 G + K σ ˙ r r δ α β ,
where s ˙ α β is deviatoric shear stress tensor, G is shear modulus ( G = E 2 ( 1 + v ) ) , E is Young’s modulus, K is bulk modulus ( K = E 3 ( 1 2 v ) ) , and v is Poisson’s ratio.
s ˙ p α β = σ ˙ α β 1 3 σ ˙ r r
The plastic strain-rate tensor can be calculated by the plastic flow law, as follows:
E . p α β = λ ˙ g σ α β
where λ ˙ is the plastic strain-rate operator, and g is the plastic buckling function. The total strain-rate tensor is expressed in the form of the stress-rate tensor, as follows:
E . α β = s ˙ α β 2 G + K σ ˙ r r δ α β + λ ˙ g σ α β
In this paper, the Drucker–Prager yield criterion is adopted to determine the plastic flow state of the soil. The yield conditions of this criterion are as follows:
f I 1 , J 2 = J 2 + α φ I 1 k c = 0
where I 1 and J 2 are the first and second invariants of the stress tensor, and I 1 = σ x x + σ y y + σ z z , J 2 = 1 2 s α β s α β . α φ , and k c are Drucker–Prager constants, which can be obtained by mutual conversion with the parameters of the Mohr–Coulomb material, such as cohesion c and internal friction angle φ . In the plane-strain state, the Drucker–Prager constant is defined as α φ = tan φ 9 + 12 tan 2 φ , k c = 3 c 9 + 12 tan 2 φ .
For the non-associated flow law, the plastic yield function is expressed as
g = J 2 + 3 I 1 sin ψ
where ψ is the dilatancy angle, where it is zero, indicating the plastic incompressibility of the material. The change rate of the plastic strain operator λ ˙ is obtained by solving
λ ˙ = 3 α φ K ε ˙ r r + G / J 2 S α β ε ˙ α β 27 α φ K sin ψ + G
After various calculations, the stress–strain relationship of the Drucker–Prager ideal elastic–plastic geotechnical material model under the non-associated flow law can be expressed as follows:
σ ˙ α β = 2 G e ˙ α β + K ε ˙ r r δ α β λ ˙ 9 K sin ψ δ α β + G J 2 s α β
Because this paper considers the problem of large deformation, it is necessary to calculate the differential strain rate of materials (the Jaumann rate):
σ ˙ ^ α β = σ ˙ α β ω ˙ α β σ α β σ α β ω ˙ α β T
where ω ˙ α β is the spin-rate tensor
ω ˙ α β = 1 2 v α x β v β x α
Finally, various calculated stress–strain relationships are as follows [27]:
σ ˙ α β = ω ˙ α β σ α β + σ α β ω ˙ α β T + 2 G e ˙ α β + K ε ˙ r r δ α β λ ˙ 9 K sin ψ δ α β + G J 2 s α β

2.3. Boundary Conditions

As the difficulty of SPH, boundary conditions greatly affect the calculation accuracy. There are two kinds of boundary treatment methods: by distributing virtual particles on the boundary, the neighboring particles are repelled to prevent them from penetrating the boundary; virtual particles fill the boundary to reflect the symmetrical surface so that neighboring particles are supported and covered by particles. Morris et al. proposed the boundary condition of velocity without slip [28]. When the distance r i between the virtual particle and the material particle is less than the threshold d 0 , the virtual particle velocity is taken as the inverse number of the material particle, and the pressure and stress are kept constant.
v b = β v v i P b = P i σ b = σ i
where v i , P i , and σ i represent soil velocity, pressure, and stress when the spacing is less than the threshold. v b , P b , and σ b represent the velocity, pressure, and stress of virtual particles.
β v = min β max 1 , d b d a
where β v is the velocity coefficient, and β max is the maximum velocity coefficient, which is used to prevent the material from being too fast when it is close to the boundary. Morris’s research shows that when β max = 1.5 , the simulation result is better. According to the research of Bui et al., β max is between 1.5 and 2.0 [27]. In this paper, when β v is 1.6, the effect is better.

2.4. Contact Model

In this paper, the soil–retaining wall interaction model for slopes is proposed, and the soil and retaining wall are represented by uniformly distributed particles. In the process of contact between the soil and retaining wall, the retaining wall is always regarded as a rigid body and does not deform. The external force types of soil particles are gravity and the contact force of the soil and the retaining wall.
As shown in Figure 1, a series of particles are generated on the surface of the retaining wall (k is adjacent to k + 1). When dp is less than the threshold d0, it is determined that contact occurs, and the vertical vector τ p and horizontal vector n p of point P can be calculated by the following formula:
τ p = t x , t y = x k + 1 x k x k + 1 x k , y k + 1 y k x k + 1 x k n p = t x , t y = y k + 1 y k x k + 1 x k , x k + 1 x k x k + 1 x k
where x k + 1 = x k + 1 , y k + 1 and x k = x k , y k represent the positions of k + 1 and k. Contact force is divided into method f n i and tangential f τ i :
f n i = 1 χ 2 m i Δ t 2 d 0 d p n p f τ i = μ f n i τ p
where χ represents the penetration degree of particles (χ is 0, which means that penetration is not allowed), μ is the friction coefficient, and ▽t is the time step. If f τ i > μ f n i , then f τ i = μ f n i f τ i f τ i [29]. Contact and stress analysis of soil-retaining wall is shown in Figure 1.
In the figure, pink particles represent soil particles and black particles represent the retaining wall particles. The trapezoid in the figure represents the retaining wall.
For rigid body motion, its speed can be divided into translation speed and rotation speed, and the conservation equation (i.e., control equation) of rigid body motion can be expressed by the following formula:
M 0 d v 0 d x = i = 1 N c F n i + F τ i I d Ω 0 d x = i = 1 N c x i X 0 × F n i + F τ i
where M0, I, v0, Ω0, and X0 are the mass, moment of inertia, translation speed, rotation speed, and centroid position of the rigid body, and Nc is the number of particles interacting with the rigid body.
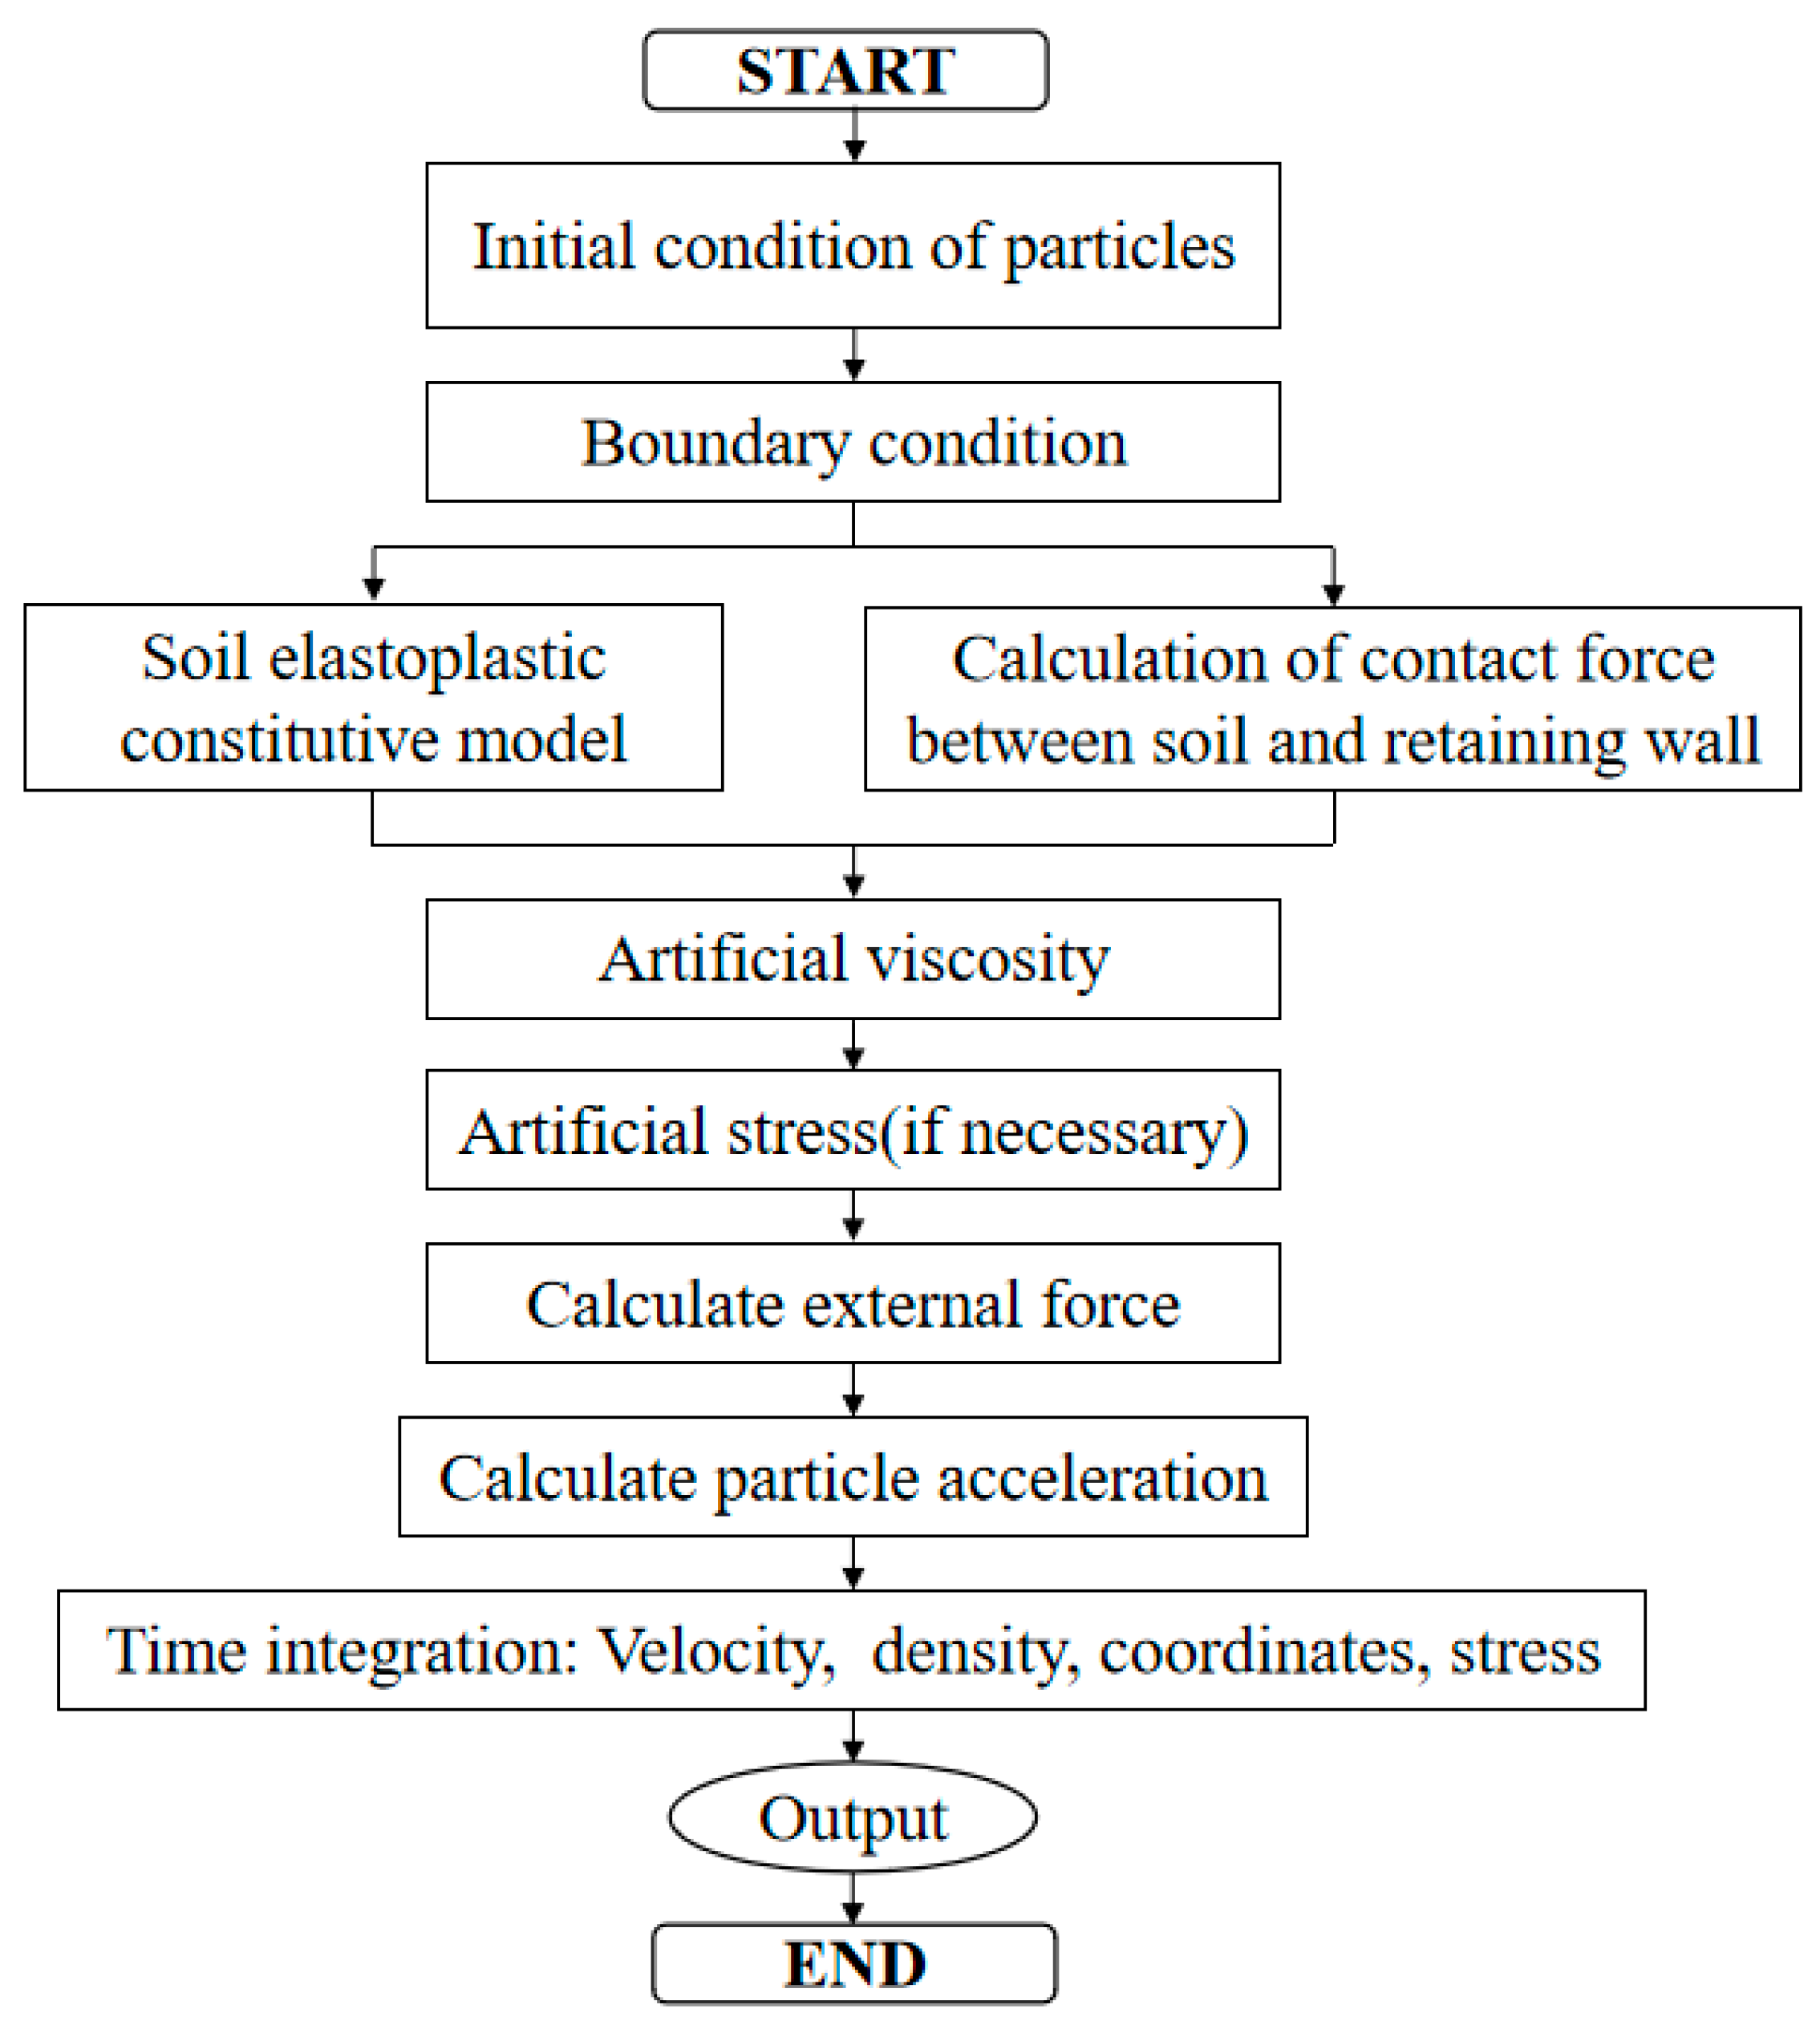
According to the basic theoretical analysis of SPH and elastic–plastic constitutive model, Fortran language is used to simulate the whole process of slope and the interaction between slope soil and retaining wall. The initial conditions need to be set when the program runs—particle spacing, smooth length, density, mass, and coordinate information. The program runs based on the Visual Studio environment. The implementation process of the program is shown in Figure 2.

3. Numerical Model

Experimental Control

The elastic–plastic constitutive model has been verified in previous research [26]. In this paper, the soil–retaining wall interaction model of the slope was verified by the experiments of Taiping Mou et al. [30]. The test model is shown in Figure 3. The test model consists of two parts: retaining wall and soil slope. The soil slope was made of silty clay, and the vertical retaining wall was made of cement mortar. In this experiment, geotechnical centrifuge was used to continuously agitate the model. Using centrifuge can increase the gravity acceleration of the model so as to simulate some special situations, such as earthquakes. By observing the test results, it could be found that the retaining wall only moved horizontally during the whole test process but did not rotate.
Through the theoretical method described in the start of the article, the SPH particle model was constructed. Soil parameters, such as dilatancy angle, shear modulus, bulk modulus, etc., have a certain universality according to references in the literature [31]. The main parameters of clay are as follows: internal friction angle φ = 35°, cohesive strength c = 23.93 KN/m2, density ρ = 1330 g/cm3, and dilation angle ψ = 13.95°. The density of the retaining wall refers to the density of concrete, which was 2400 Kg/m3 here. When the soil type is silty soil, the friction coefficient μ between the soil and the bottom of the retaining wall is usually 0.25–0.35 (The friction coefficients of different materials are shown in Table 1.), and in this model, it was 0.3.
The SPH model is established according to the above experimental standards, and the details of the SPH model are shown in Figure 4.
The SPH simulation results for when the model was not centrifuged are shown in Figure 5.
The arrow in the figure represents the velocity vector of particles. Figure 5 shows that the retaining wall with a normal design can bear the soil pressure effectively without translation.
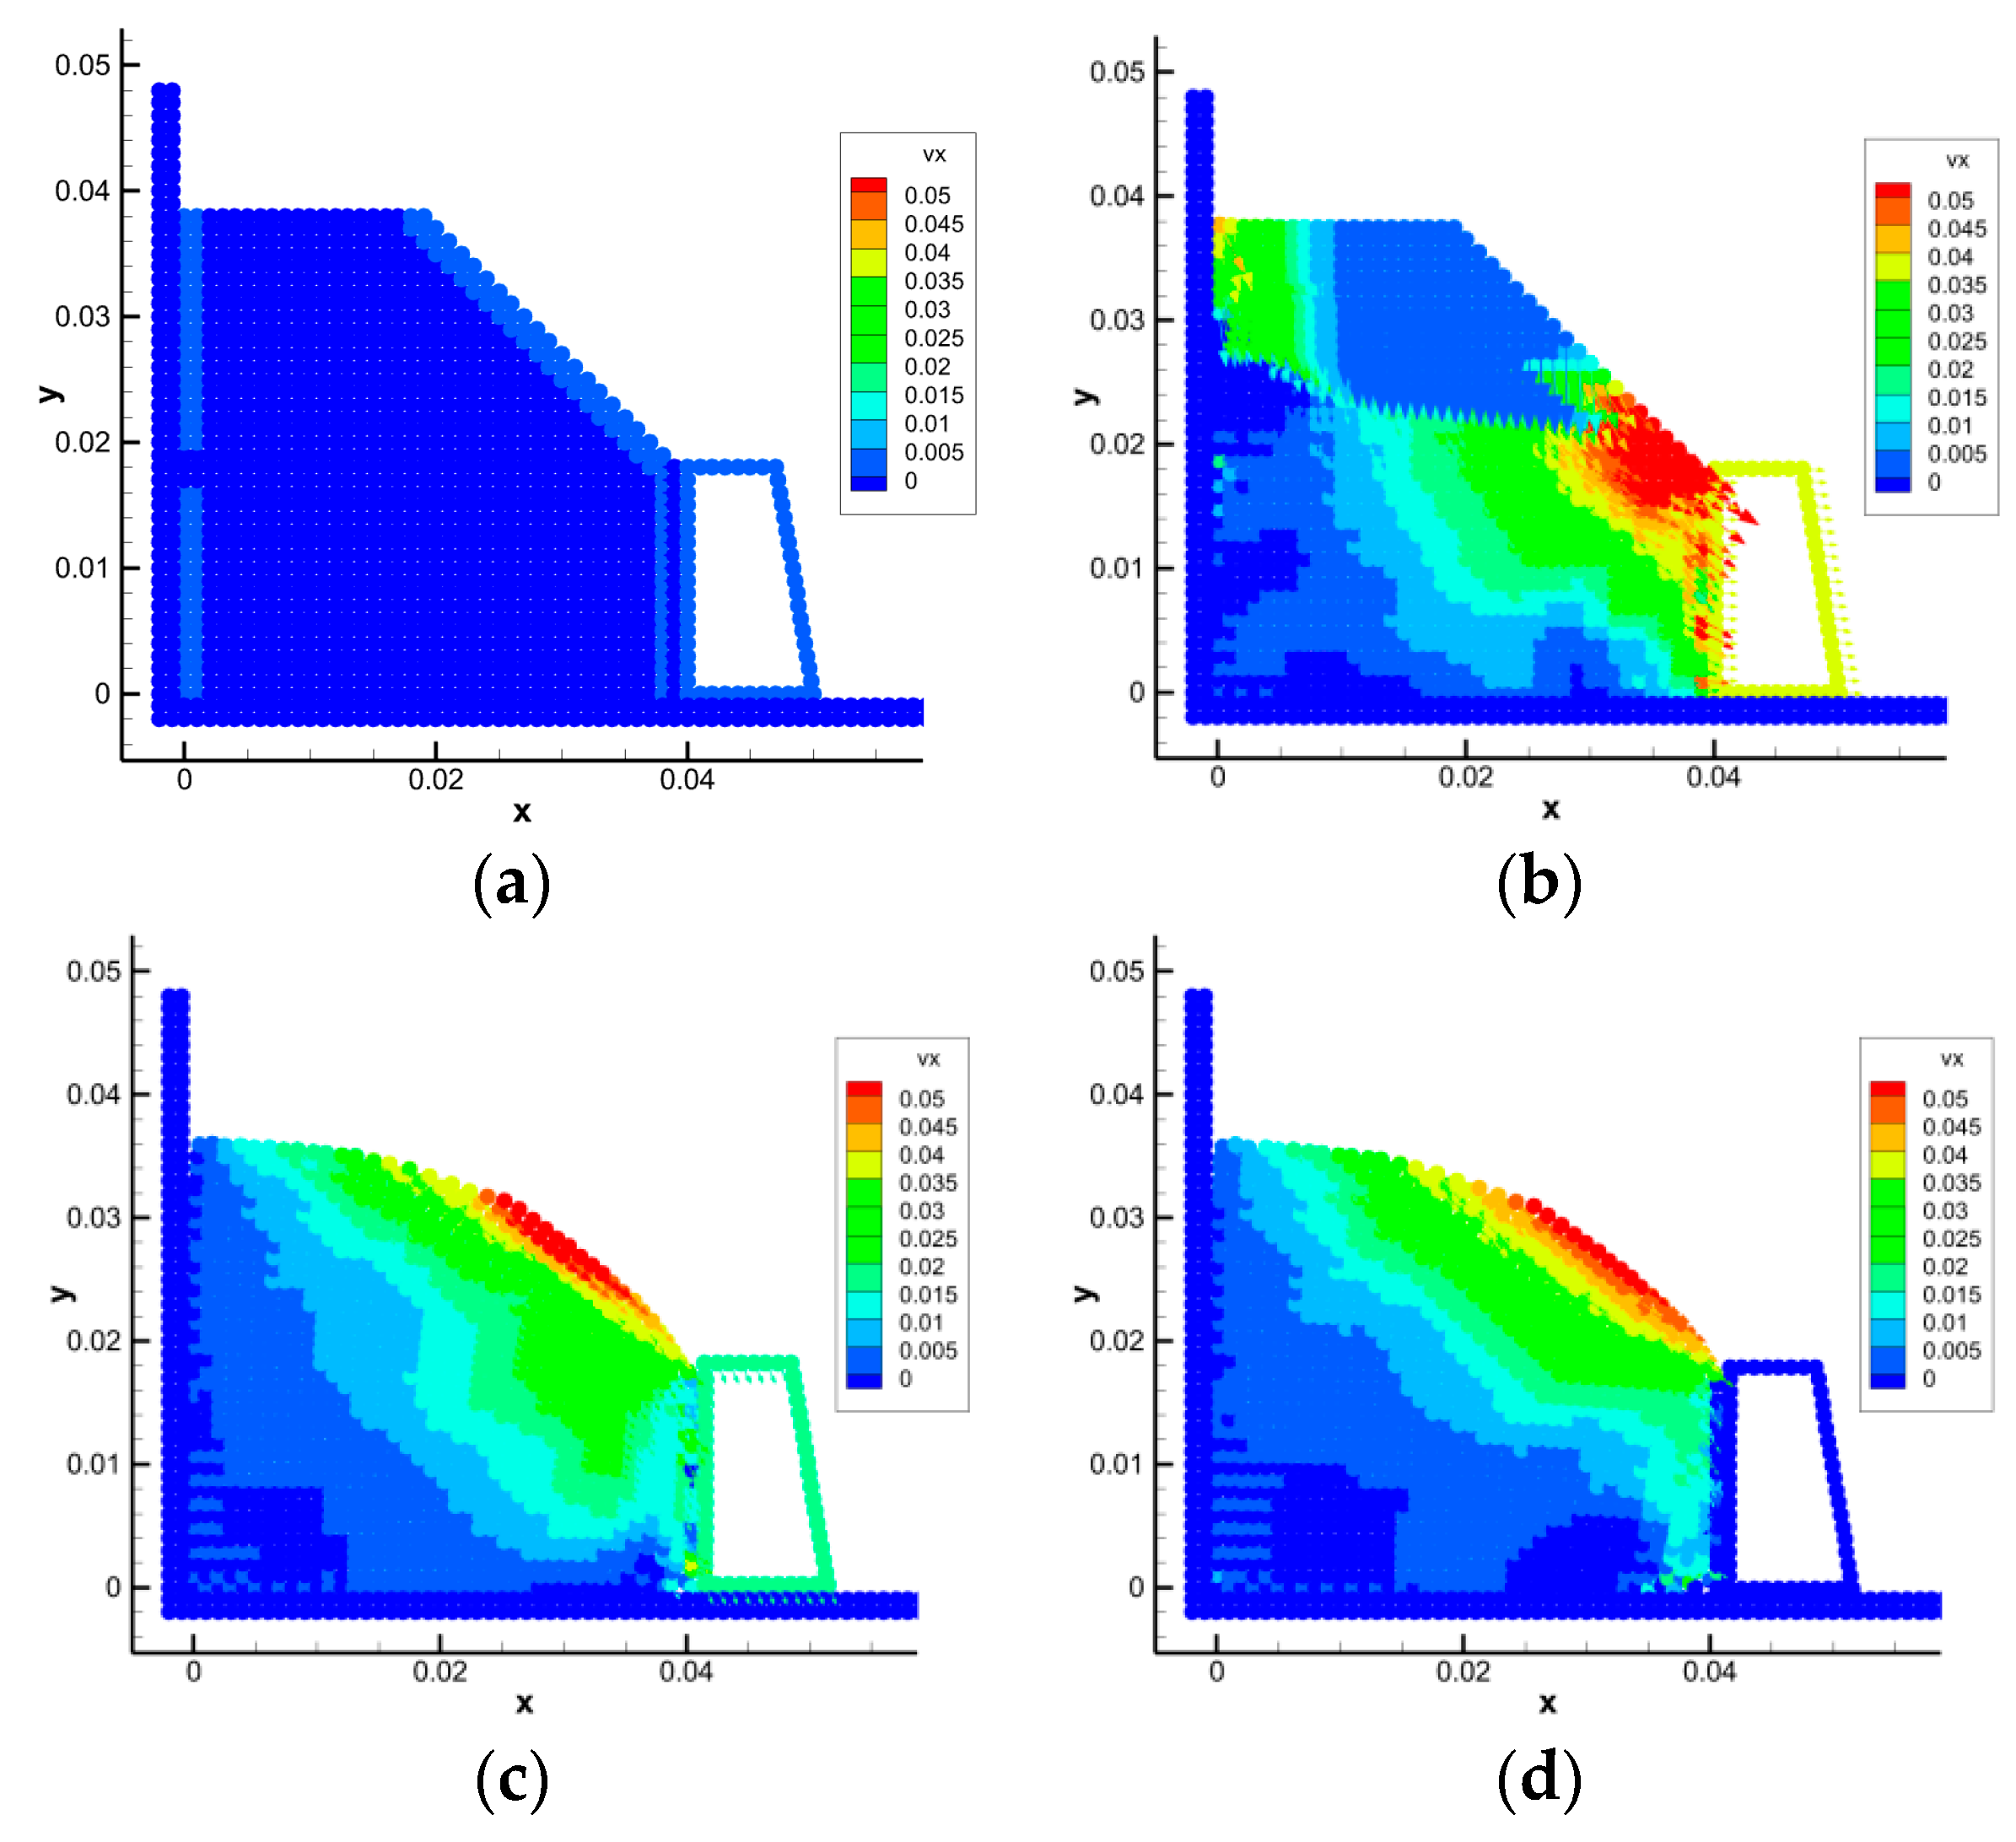
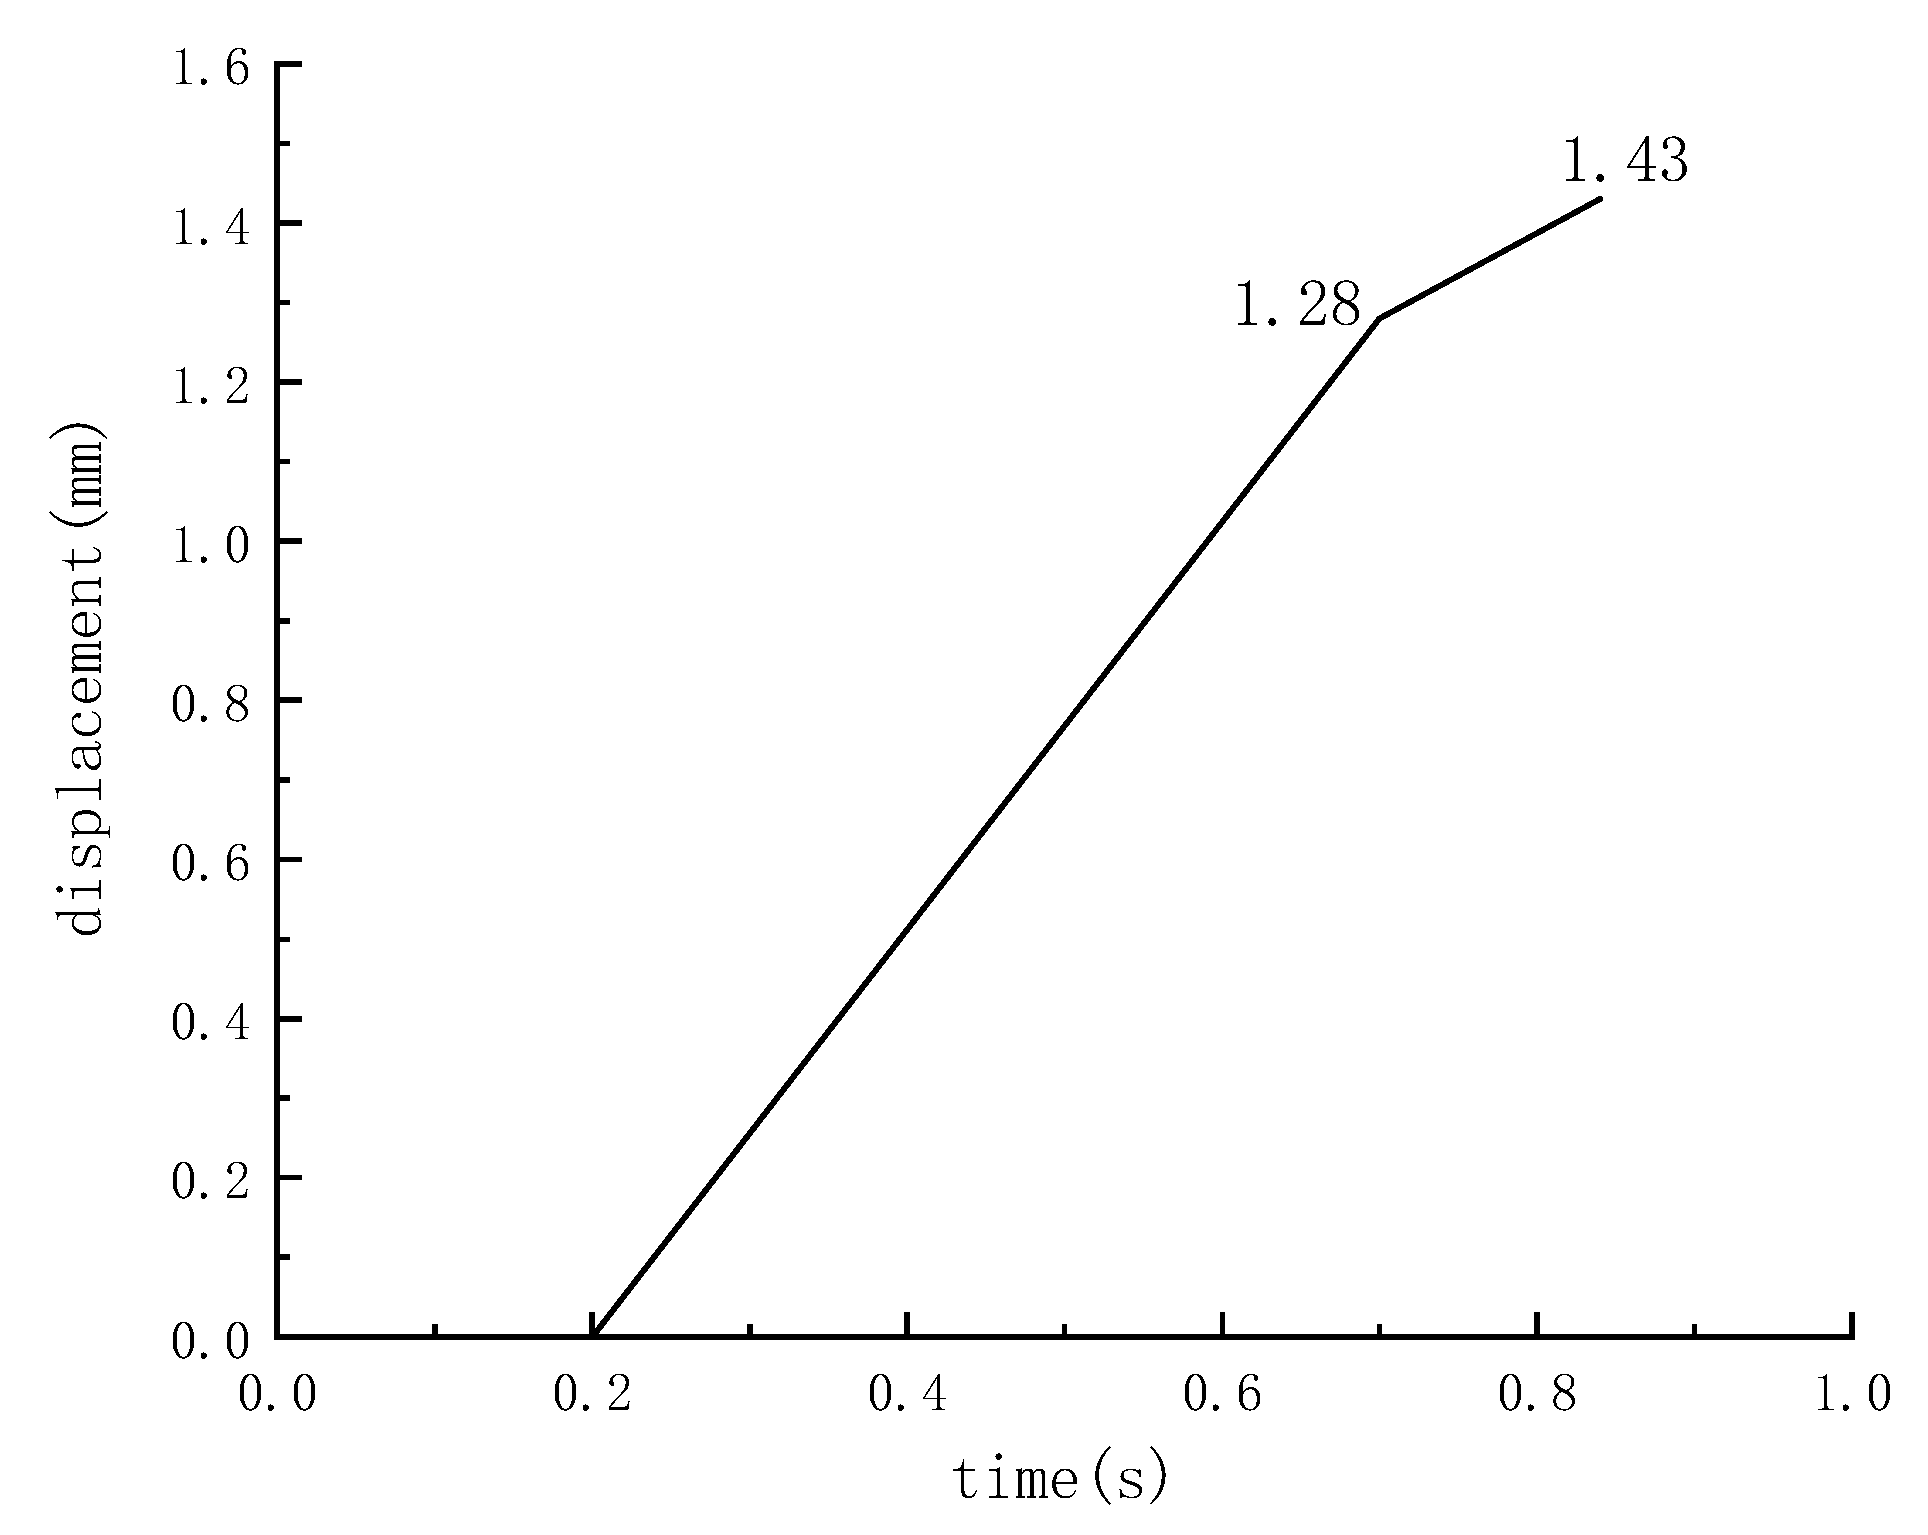
In the SPH model, we used increasing gravity acceleration to simulate the process of the centrifuge used. By gradually increasing the acceleration of gravity, the retaining wall can be simulated to bear greater load and stress, which usually occurs in specific scenes, such as earthquakes and large-scale mechanical operations on the slope. When the acceleration of gravity increases to 3 g, the retaining wall will eventually be unable to resist such a load and translate. The simulation process and result analysis are shown in Figure 6 and Figure 7.
The translation speed of the retaining wall under the action of earth pressure is positively correlated with the gravity acceleration of the model. After 0.84 s, the speed of the retaining wall gradually decreased to zero, and the displacement at this time was 1.43 mm. The simulation results are consistent with the experimental results, which verifies the accuracy of the model.
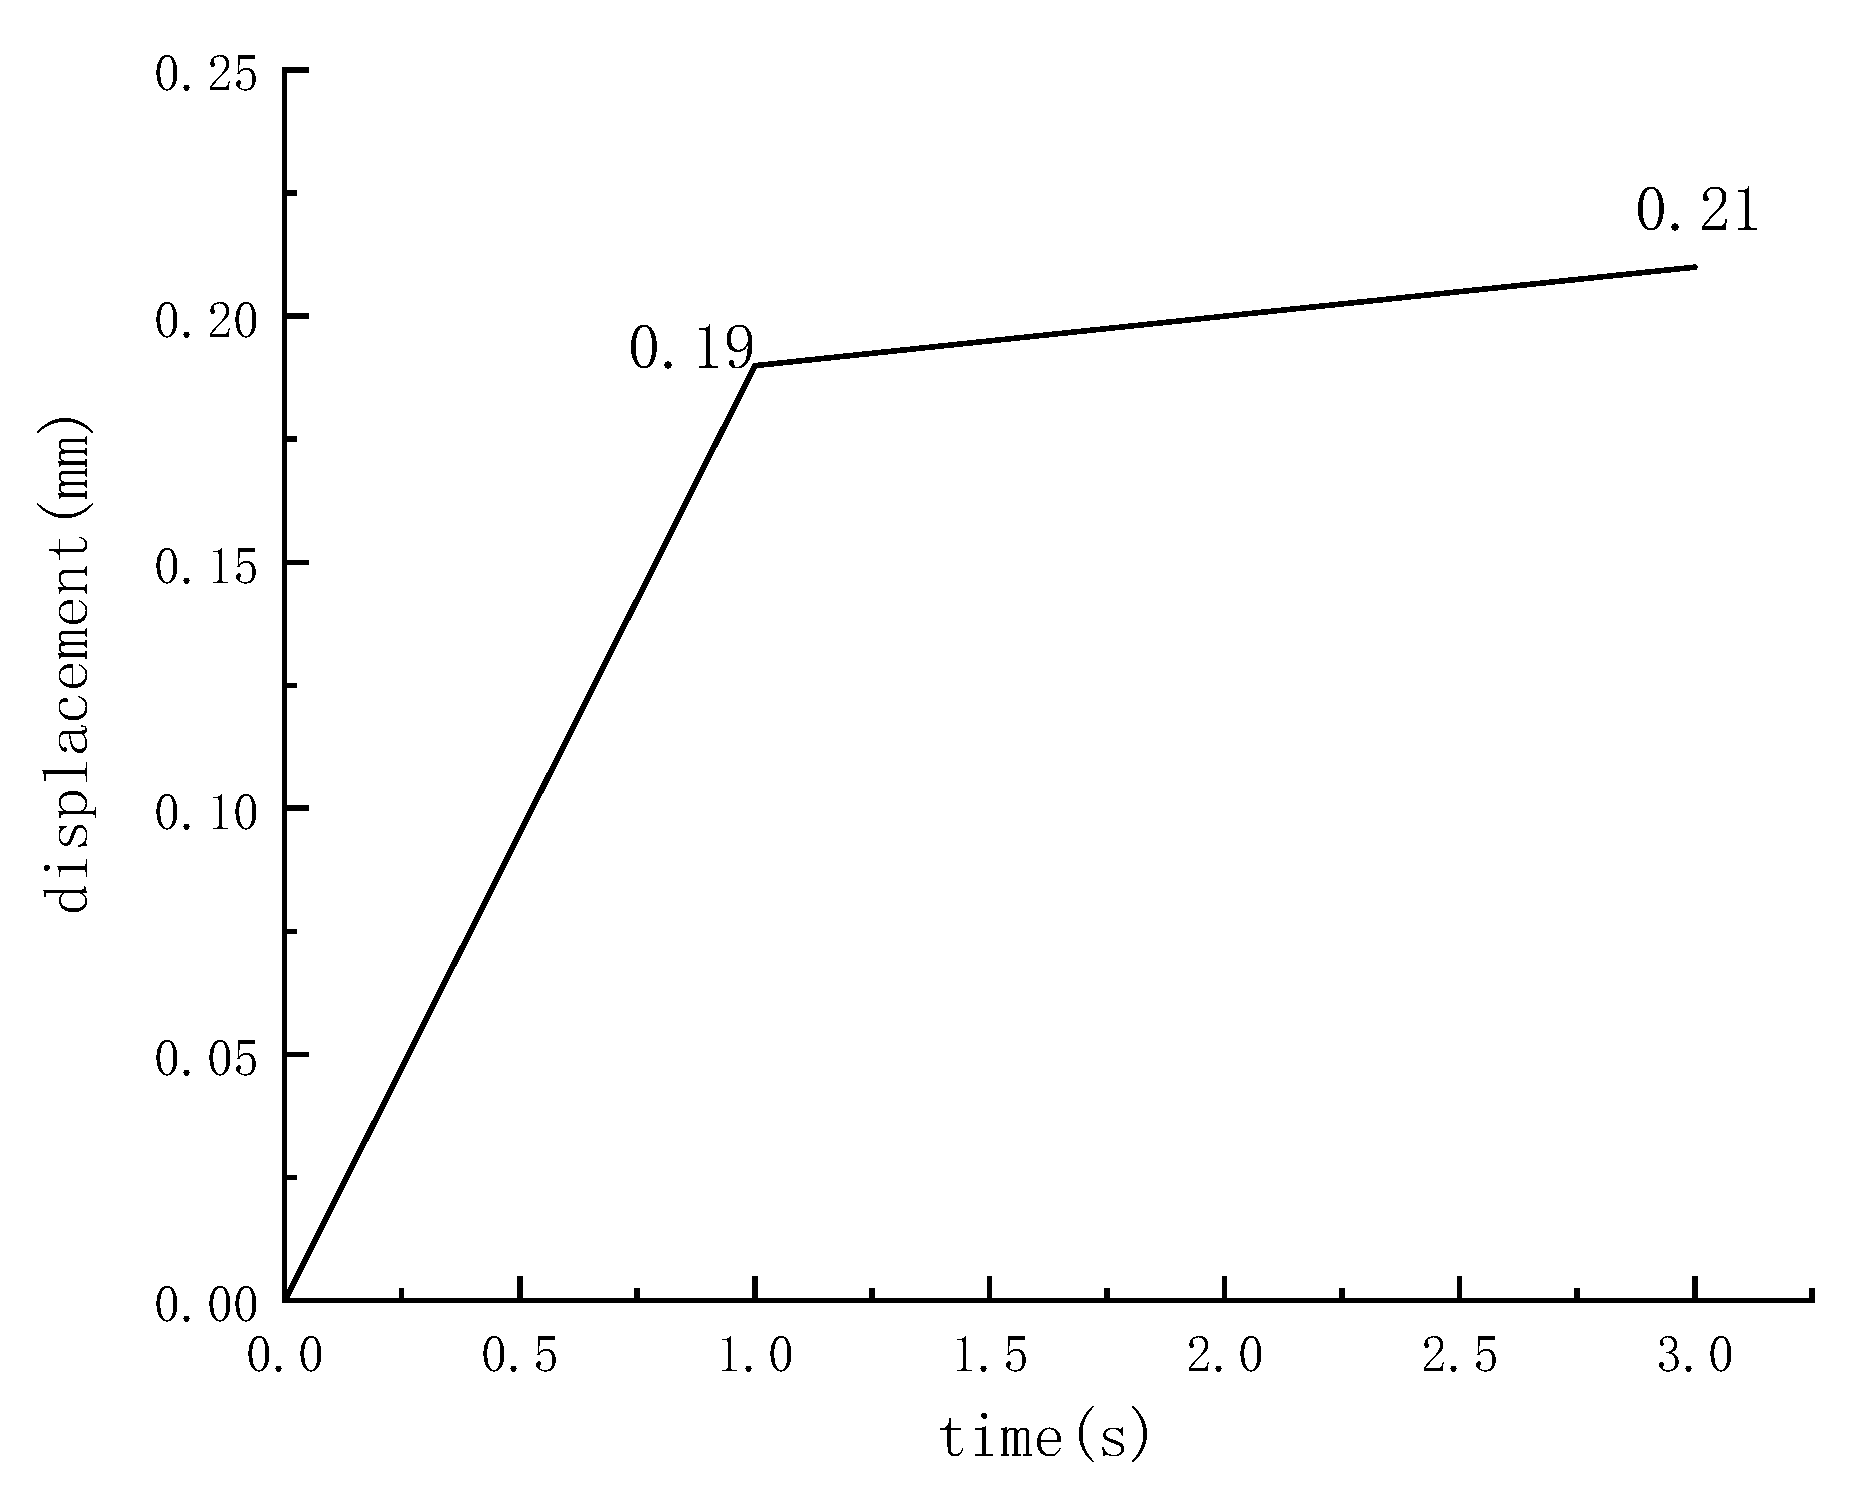
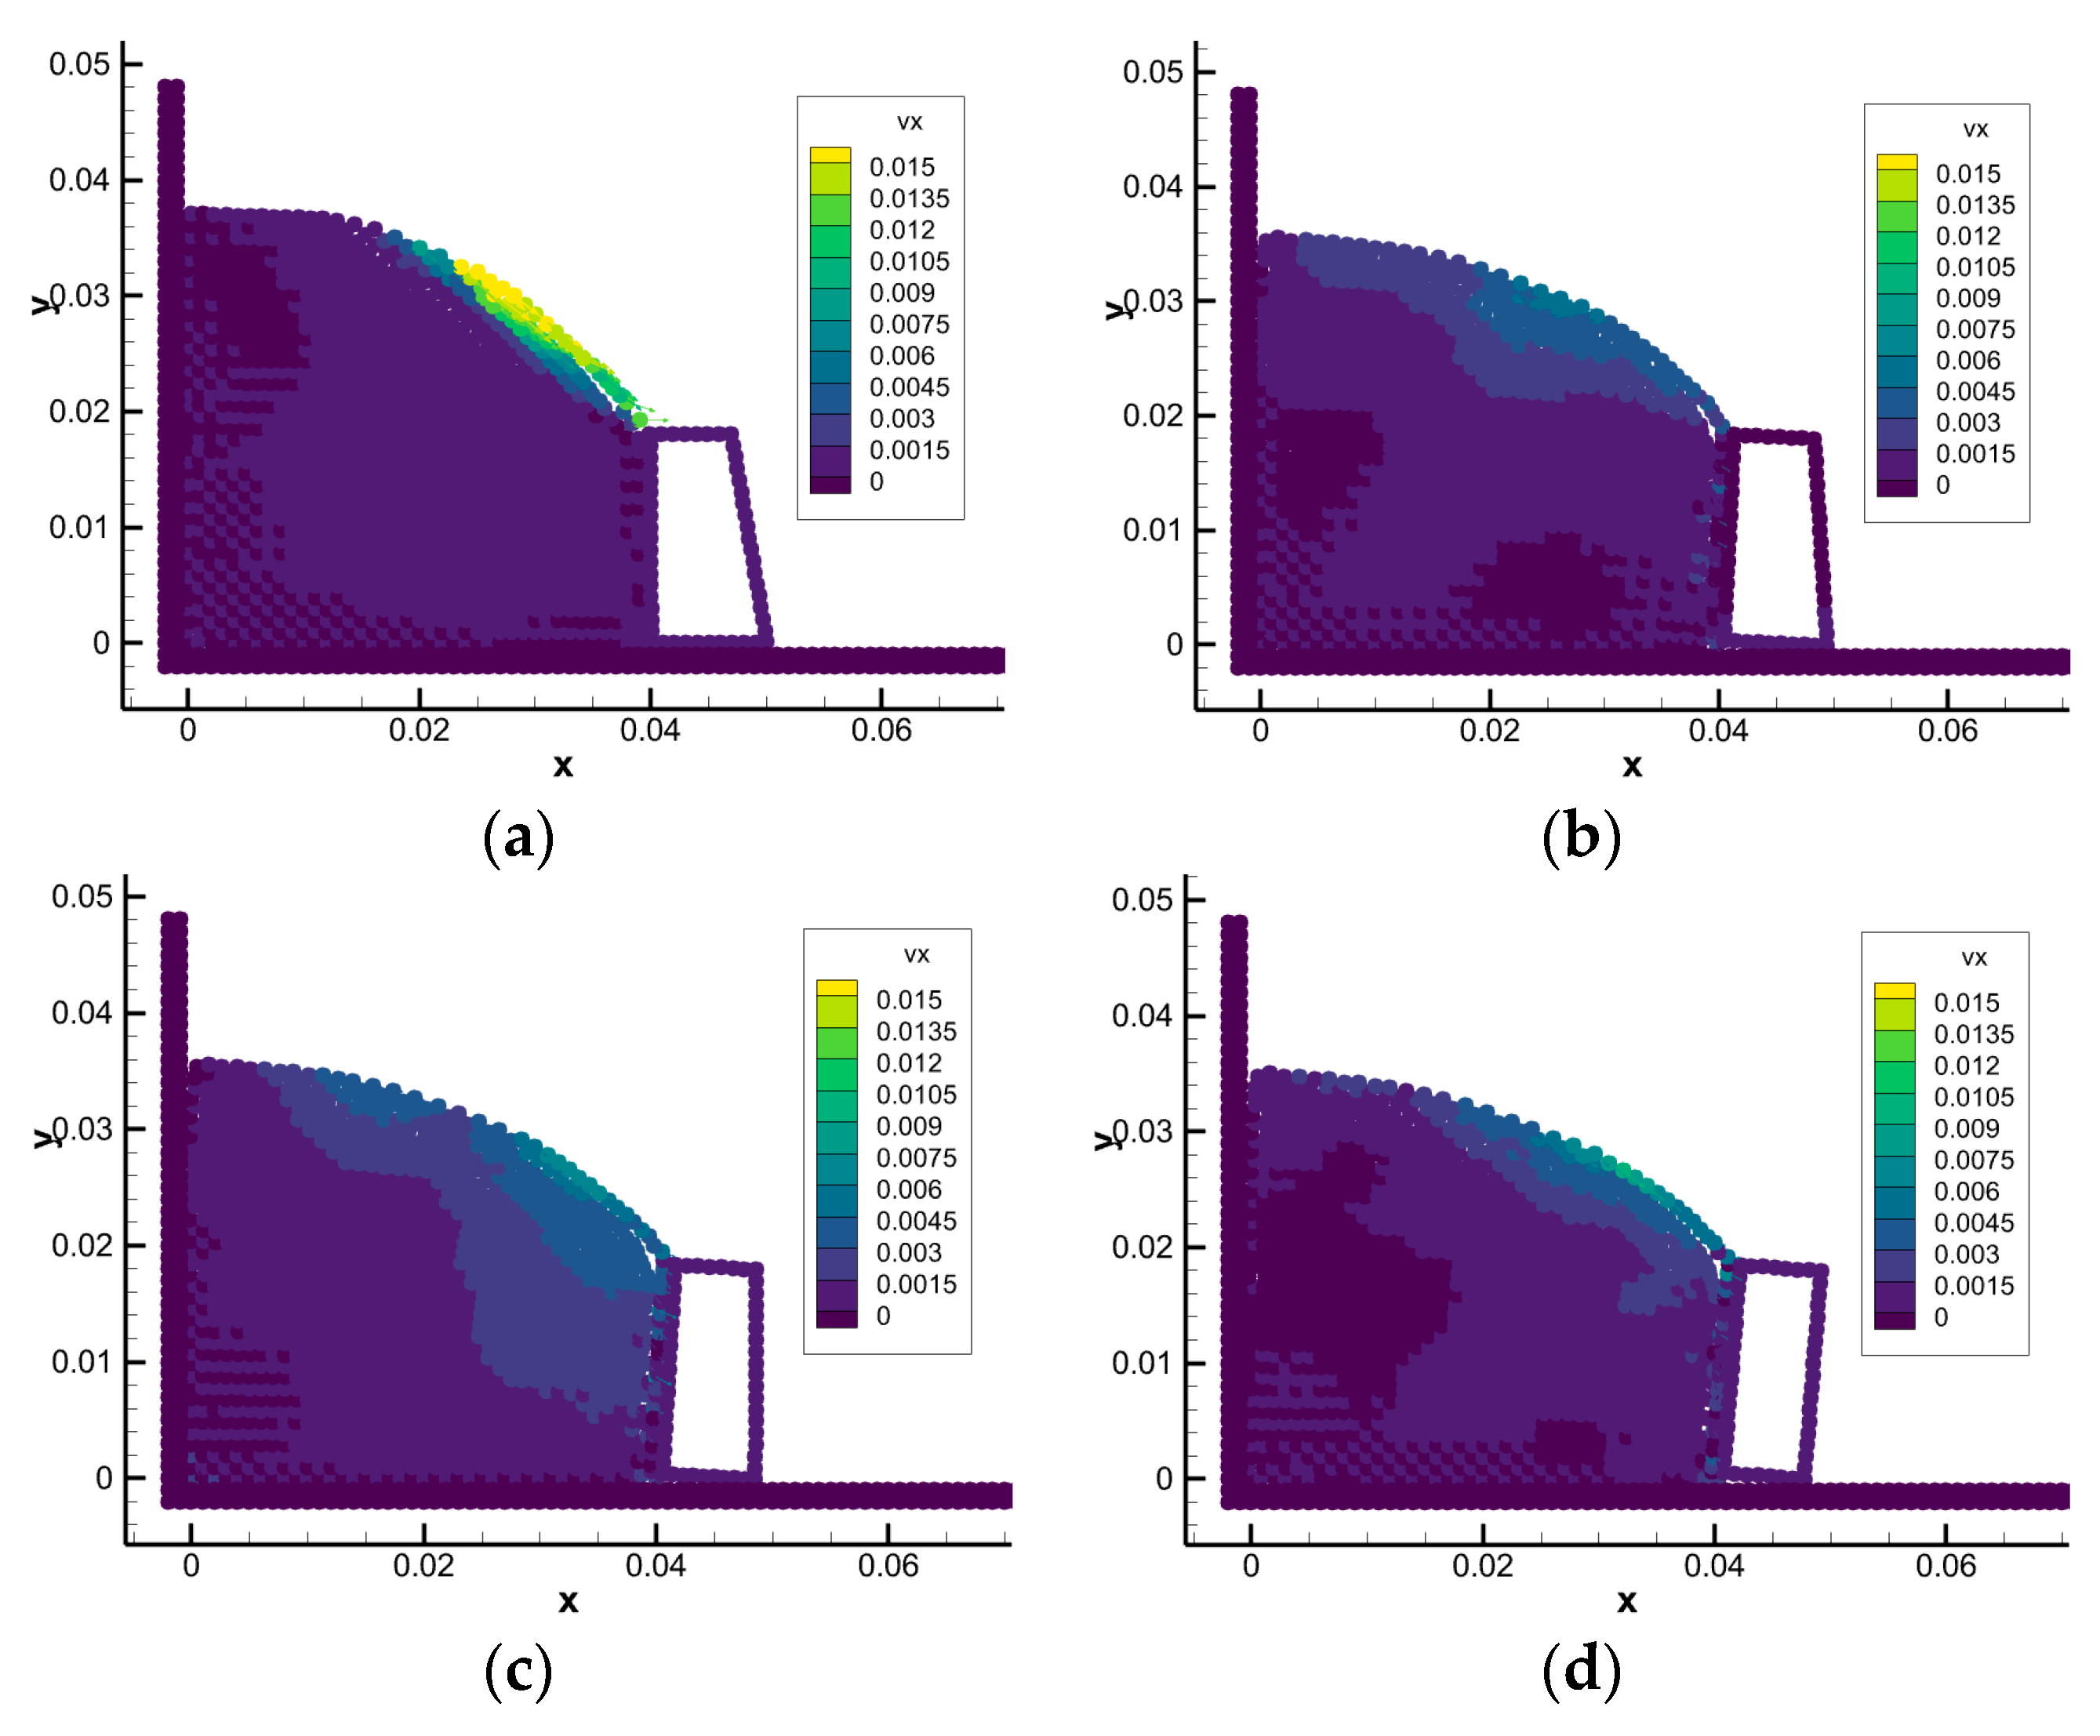
In order to study the influence of different soil environments on the translation of retaining walls, we used the friction coefficients of different types of soils to simulate the movement behavior of retaining walls. In this paper, we chose the friction coefficient μ = 0.2 and 0.1 for simulation and the simulation process and result analysis are shown in Figure 8, Figure 9, Figure 10 and Figure 11.
When the friction coefficient μ is 0.2, the results show that the retaining wall will be slightly displaced by soil force, and the final displacement is 0.21 mm.
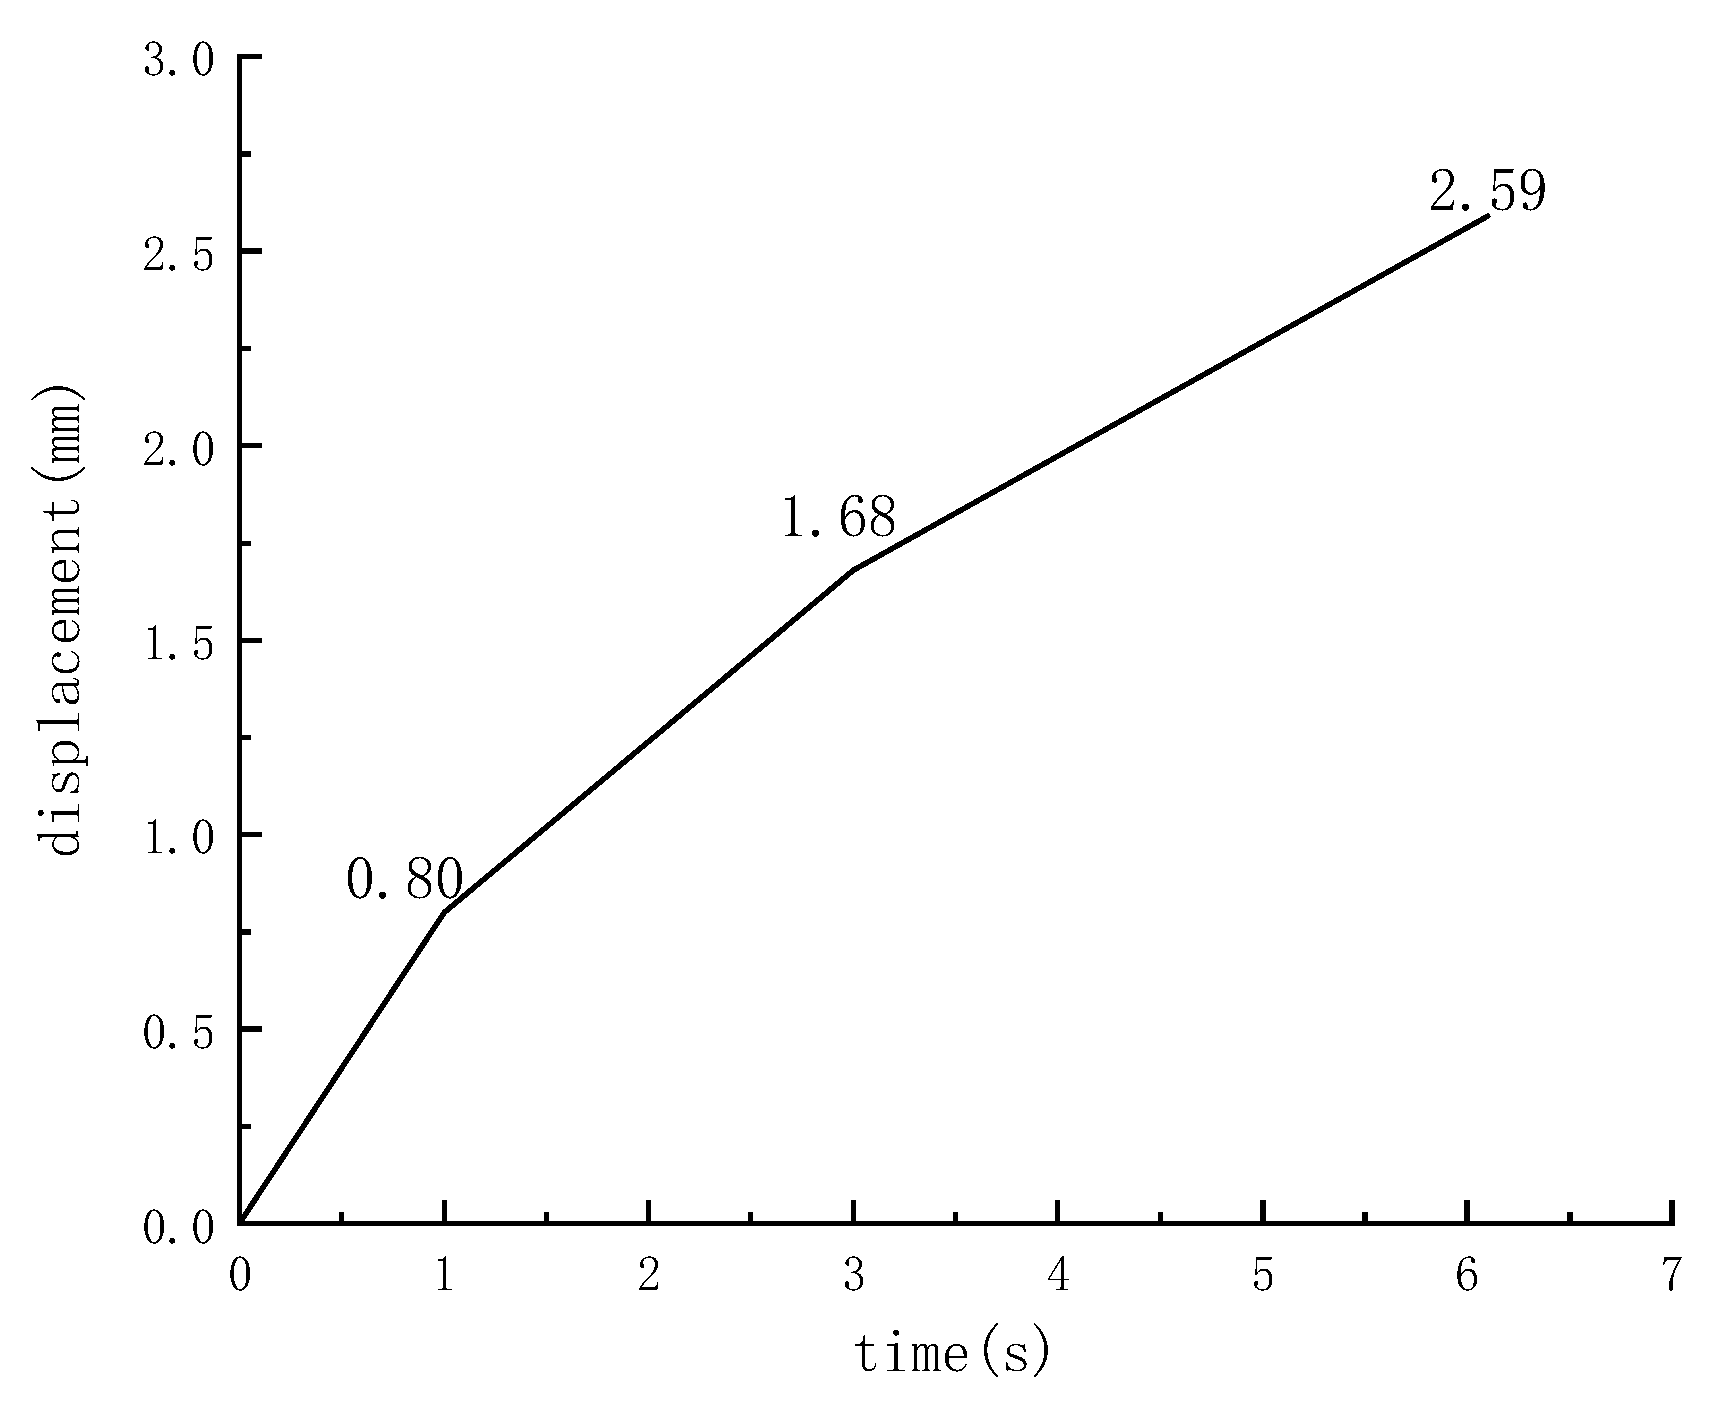
When the friction coefficient μ is 0.1, the friction force on the retaining wall is not enough to support it to keep balance. In this case, the retaining wall will translate after being subjected to soil force, and the maximum translation distance is about 2.59 mm at 6.1 s. It is worth noting that the retaining wall shows a slight overturning trend at this moment. This result reminds us that, in practical engineering, if the friction force is not enough to keep the balance of the retaining wall, we need to use other methods to ensure the stability of the retaining wall. For example, in the event of an earthquake, it is difficult for the friction coefficient between the soil and the retaining wall to keep the balance of the retaining wall; therefore, the buried depth of the retaining wall should be increased in earthquake-prone areas.
The failure of the retaining wall has two forms: translation and overturning. Therefore, when designing retaining walls, it is necessary to carry out anti-translation checking and anti-overturning checking at the same time. Through a comparison between the model and the experiment above, the applicability of this SPH numerical model to translational failure is verified. This paper will further study the failure of overturning. The anti-overturning stability coefficient of the retaining wall needs to be calculated in the anti-overturning checking calculation. The horizontal projection width b of the retaining wall bottom is the key parameter. This paper will analyze the overturning state of the retaining wall under different b values, and then verify the applicability of this model to the overturning failure of the retaining wall. The formula for checking the overturning resistance of retaining wall is as follows:
F t = G x 0 + E a cos ( α δ ) ( b z cot α ) E a sin ( α δ ) z b tan α 0
where F t is the overturning stability coefficient, G is the weight of the retaining wall, and x 0 is the horizontal distance from the center of the retaining wall to the toe of the wall. E a is the resultant force of dynamic earth pressure. α is the angle between the back of the wall and the horizontal projection of the wall bottom. δ is the friction angle between the back of the wall and rock and soil. b is the horizontal projection length of the retaining wall bottom surface. z is the vertical distance from the point where the geotechnical pressure acts to the heel of the wall. α 0 is the inclination angle of the bottom surface of the wall. In this paper, the bottom of the wall is placed horizontally; therefore α 0 is 0.
Through the model above, we know that when μ is greater than 3, the retaining wall will not translate. The friction coefficient μ is controlled above 3, and other parameters remain unchanged. After changing b, the overturning state of the retaining wall is analyzed. When considering the original b value as 1, b is reduced to 0.9–0.7 times; the simulation process is shown in Figure 12.
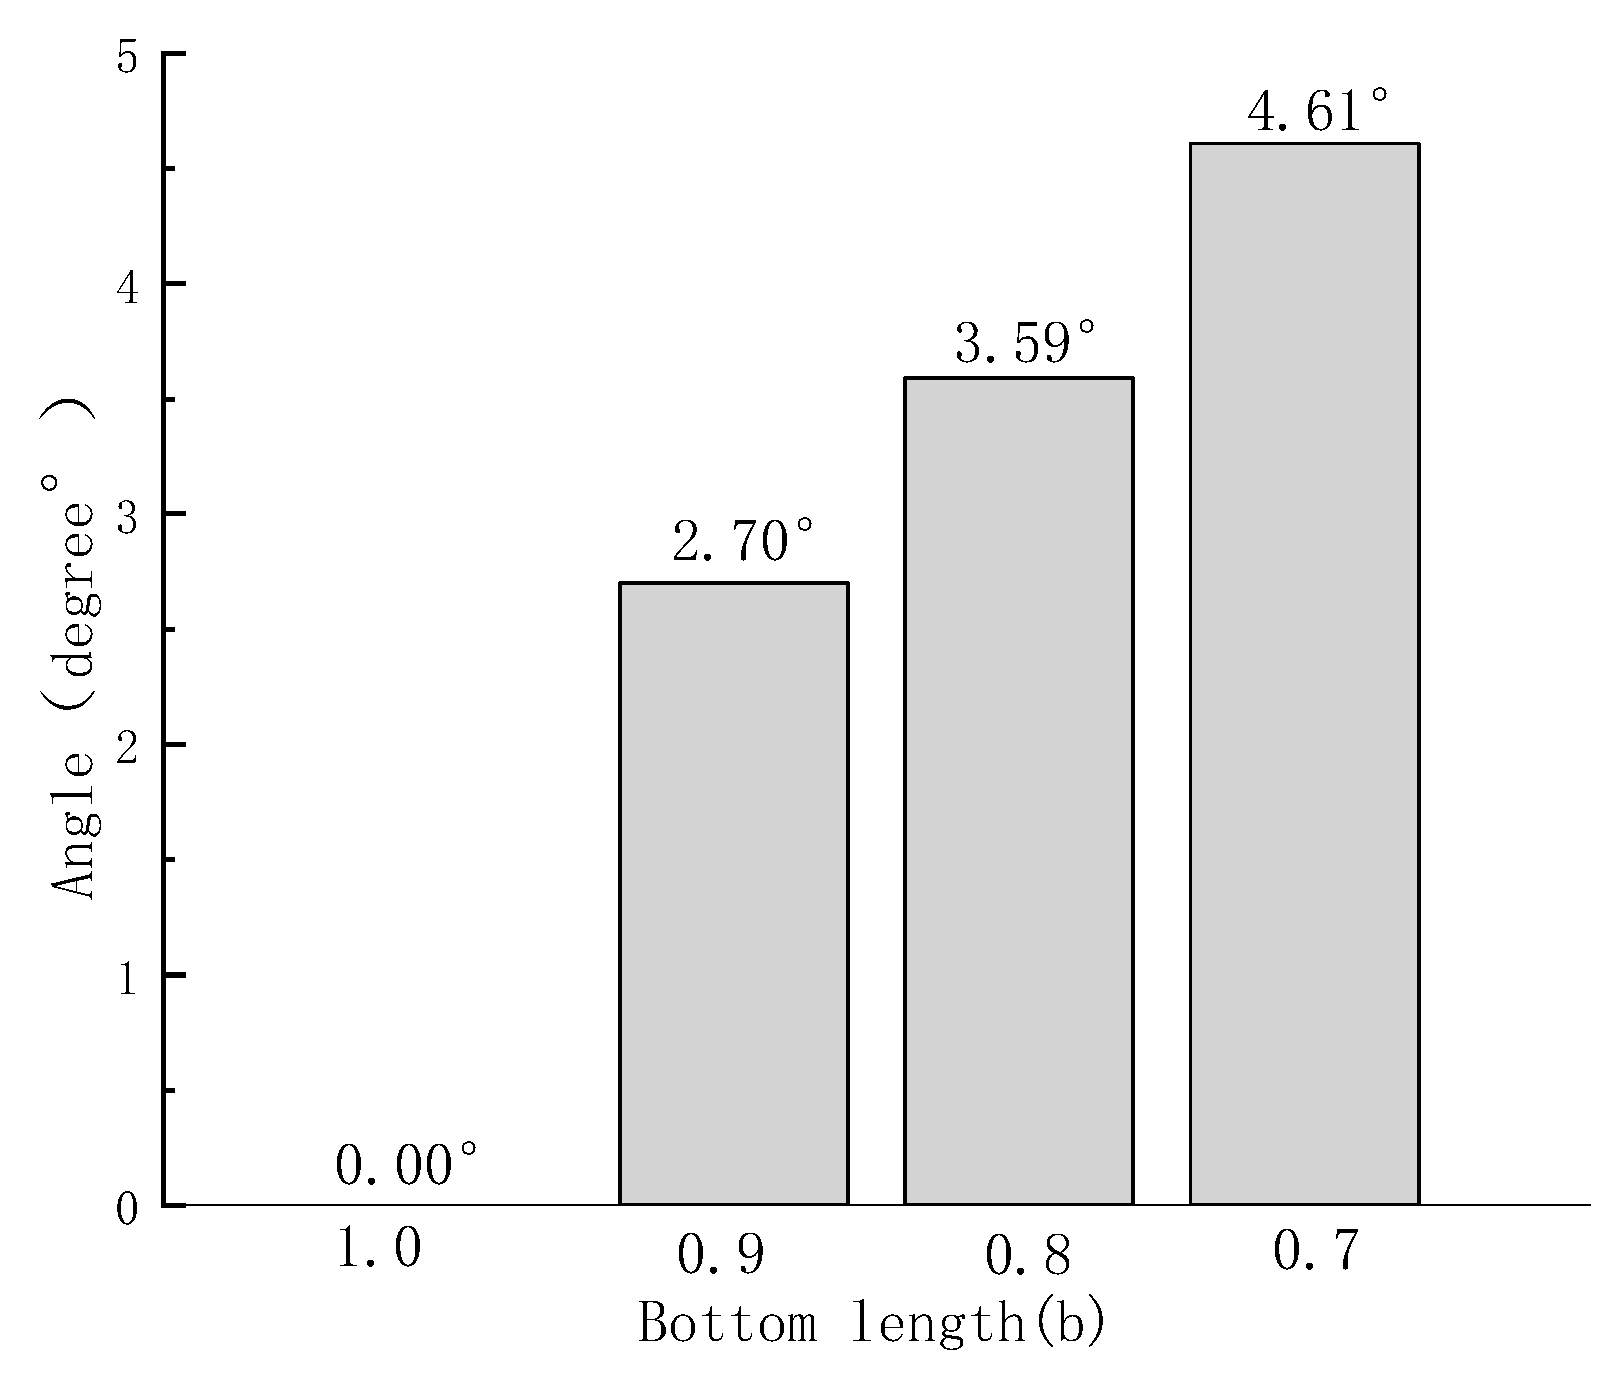
To verify whether the overturning results of the retaining wall in our model meet the design specifications, we further analyzed the included angle between the bottom edge of the retaining wall and the ground under different b values. For a more visual representation of the results, we imported the simulation results into CAD software 2019 for visualization. The result analysis is shown in Figure 13.
The analysis revealed that when the b value is 0.9 times the original value, the angle between the bottom edge of the retaining wall and the ground is approximately 2.70 degrees. When the b value is reduced to 0.8 times the original value, the angle increases to approximately 3.59 degrees. Further decreasing the b value to 0.7 times the original value results in a further increase in the angle to approximately 4.61 degrees.
The simulation results show that, with the decrease in the b value, the overturning degree of the retaining wall is also great, which proves that the model conforms to the anti-overturning checking code of the retaining wall.
This result serves as a reminder that, in order to prevent the overturning of the retaining wall, it is necessary to increase the length of the bottom edge in the design. If the conditions do not allow for an increase in the length of the bottom edge, other design aspects should be reinforced to ensure the stability of the retaining wall against overturning. One approach could be to increase the self-weight of the retaining wall.

4. Conclusions

In this paper, SPH modeling was carried out based on the elastic–plastic constitutive model, and an interaction model of slope soil and retaining wall was put forward. The simulation results were compared with the experiment, and the following conclusions were obtained:
  • By comparing the simulation results with the test results, the applicability of this model to the translation failure of retaining walls was verified. Displacement under different base friction coefficients was analyzed, which further verified that the model conformed to the anti-translation checking conditions in the code.
  • SPH analysis was carried out on the motion response of retaining walls with different base lengths. The overturning situation and overturning angle of different retaining walls were compared. It was verified that the model conformed to the anti-overturning checking conditions in the code.
  • Overall, the model accurately describes the motion response of the retaining wall under different conditions after soil impact. The model proved to be suitable for practical engineering cases and can provide a brand new numerical simulation platform for the design and checking calculation of retaining walls and the impact of soil on structures after landslides.

Author Contributions

Methodology, Q.Y. and M.H.; Software, Q.Y.; Formal analysis, Q.Y. and M.H.; Investigation, Q.T. and H.F.; Data curation, Q.Y., Y.R. and M.H.; Writing—original draft, Q.Y.; Writing—review and editing, M.H.; Visualization, Q.Y.; Supervision, A.B. All authors have read and agreed to the published version of the manuscript.

Funding

This research was funded by the Science and Technology Support Program Project of Guizhou Province, grant number [2021] General 341.

Data Availability Statement

The data presented in this study are available on request from the corresponding author.

Conflicts of Interest

The authors declare no conflicts of interest.

References

  1. Cheng, Y.; Huo, A.; Zhao, Z.; Peng, J. Analysis of loess fracture on slope stability based on centrifugal model tests. Bull. Eng. Geol. Environ. 2021, 80, 3647–3657. [Google Scholar] [CrossRef]
  2. Zhu, C.; He, M.; Karakus, M.; Cui, X.; Tao, Z. Investigating Toppling Failure Mechanism of Anti-dip Layered Slope due to Excavation by Physical Modelling. Rock Mech. Rock Eng. 2020, 53, 5029–5050. [Google Scholar] [CrossRef]
  3. Zhigang, T.; Chun, Z.; Manchao, H.; Kuiming, L. Research on the safe mining depth of anti-dip bedding slope in Changshanhao Mine. Geomech. Geophys. Geo-Energy Geo-Resour. 2020, 6, 36. [Google Scholar] [CrossRef]
  4. Liu, Z.Q.; Guo, D.; Lacasse, S.; Li, J.H.; Yang, B.B.; Choi, J.C. Algorithms for intelligent prediction of landslide displacements. J. Zhejiang Univ. A 2020, 21, 412–429. [Google Scholar] [CrossRef]
  5. Hu, M. Study on SPH Motion Model and Monitoring Method of Soil Slope. D.; University of Science and Technology Beijing: Beijing, China, 2015. (In Chinese) [Google Scholar]
  6. Asteris, P.G.; Rizal, F.I.M.; Koopialipoor, M.; Roussis, P.C.; Ferentinou, M.; Armaghani, D.J.; Gordan, B. Slope Stability Classification under Seismic Conditions Using Several Tree-Based Intelligent Techniques. Appl. Sci. 2022, 12, 1753. [Google Scholar] [CrossRef]
  7. Kumar, V.; Gupta, V.; Jamir, I. Hazard evaluation of progressive Pawari landslide zone, Satluj valley, Himachal Pradesh, India. Nat. Hazards 2018, 93, 1029–1047. [Google Scholar] [CrossRef]
  8. Kotake, N.; Tatsuoka, F.; Tanaka, T.; Siddiquee, M.S.A.; Huang, C.-C. FEM simulation of the failure of reinforced sand slopes subjected to footing load. Geosynth. Int. 2004, 11, 1–18. [Google Scholar] [CrossRef]
  9. Singh, S.K.; Negi, M.S.; Singh, J. Strengthening of Slope by Soil Nailing Using Finite Difference and Limit Equilibrium Methods. Int. J. Geosynth. Ground Eng. 2021, 7, 64. [Google Scholar] [CrossRef]
  10. Maugeri, M.; Motta, E.; Raciti, E. Mathematical modelling of the landslide occurred at Gagliano Castelferrato (Italy). Nat. Hazards Earth Syst. Sci. 2006, 6, 133–143. [Google Scholar] [CrossRef]
  11. Tang, H.; Cui, J.; Zhang, X.; Zhang, L.; Liu, L. Cosserat-particle finite element method for large deformation analysis of rock and soil. Chin. J. Geotech. Eng. 2023, 45, 495–502. [Google Scholar]
  12. Li, S.H.; Wang, J.G.; Liu, B.S.; Dong, D.P. Analysis of Critical Excavation Depth for a Jointed Rock Slope Using a Face-to-Face Discrete Element Method. Rock Mech. Rock Eng. 2007, 40, 331–348. [Google Scholar] [CrossRef]
  13. Wang, H.B.; Zhang, B.; Mei, G.; Xu, N. A statistics-based discrete element modeling method coupled with the strength reduction method for the stability analysis of jointed rock slopes. Eng. Geol. 2020, 264, 105247. [Google Scholar] [CrossRef]
  14. Feng, Z.K.; Xu, W.J. GPU material point method (MPM) and its application on slope stability analysis. Bull. Eng. Geol. Environ. 2021, 80, 5437–5449. [Google Scholar] [CrossRef]
  15. Wu, F.Y.; Sun, W.; Li, X.C.; Guan, Y.; Dong, M. Material point method-based simulation of dynamic process of soil landslides considering pore fluid pressure. Int. J. Numer. Anal. Methods Geomech. 2023, 47, 2385–2404. [Google Scholar] [CrossRef]
  16. Lodato, G.; Cossins, P.J. Smoothed Particle Hydrodynamics for astrophysical flows. Eur. Phys. J. Plus 2011, 126, 44. [Google Scholar] [CrossRef]
  17. Rasio, F.A.; Lombardi, J.C. Smoothed particle hydrodynamics calculations of stellar interactions. J. Comput. Appl. Math. 1999, 109, 213–230. [Google Scholar] [CrossRef]
  18. Wadsley, J.W.; Veeravalli, G.; Couchman, H.M.P. On the treatment of entropy mixing in numerical cosmology. Mon. Not. R. Astron. Soc. 2008, 387, 427–438. [Google Scholar] [CrossRef]
  19. Li, L.; Wang, Y. Identification of failure slip surfaces for landslide risk assessment using smoothed particle hydrodynamics. Georisk Assess. Manag. Risk Eng. Syst. Geohazards 2020, 14, 91–111. [Google Scholar] [CrossRef]
  20. Yu, M.; Huang, Y.; Deng, W.; Cheng, H. Forecasting landslide mobility using an SPH model and ring shear strength tests: A case study. Nat. Hazards Earth Syst. Sci. 2018, 18, 3343–3353. [Google Scholar] [CrossRef]
  21. Mori, H.; Chen, X.; Leung, Y.F.; Shimokawa, D.; Lo, M.K. Landslide hazard assessment by smoothed particle hydrodynamics with spatially variable soil properties and statistical rainfall distribution. Can. Geotech. J. 2020, 57, 1953–1969. [Google Scholar] [CrossRef]
  22. Ma, G.D.; Bui, H.; Lian, Y.J.; Tran, K.M.; Nguyen, G.D. A five-phase approach, SPH framework and applications for predictions of seepage-induced internal erosion and failure in unsaturated/saturated porous media. Comput. Methods Appl. Mech. Eng. 2022, 401, 115614. [Google Scholar] [CrossRef]
  23. Hu, Y.X.; Zhu, Y.G.; Li, H.B.; Li, C.J.; Zhou, J.W. Numerical estimation of landslide-generated waves at Kaiding Slopes, Houziyan Reservoir, China, using a coupled DEM-SPH method. Landslides 2021, 18, 3435–3448. [Google Scholar] [CrossRef]
  24. Monaghan, J.J.; Gingold, R.A. Shock simulation by the particle method SPH. J. Comput. Phys. 1983, 52, 374–389. [Google Scholar] [CrossRef]
  25. Gao, T.; Xie, S.; Hu, M.; Fang, H.; Yi, C.; Bao, A. Soil-soil engaging component SPH model based on a hypoplastic constitutive model. Trans. Chin. Soc. Agric. Eng. 2022, 38, 47–55. [Google Scholar] [CrossRef]
  26. Hu, M.; Xie, M.W.; Wang, L.W. SPH simulations of post-failure flow of landslides using elastic-plastic soil constitutive model. Chin. J. Geotech. Eng. 2016, 38, 58–67. [Google Scholar] [CrossRef]
  27. Bui, H.H.; Fukagawa, R.; Sako, K.; Ohno, S. Lagrangian meshfree particles method (SPH) for large deformation and failure flows of geomaterial using elastic–plastic soil constitutive model. Int. J. Numer. Anal. Methods Geomech. 2008, 32, 1537–1570. [Google Scholar] [CrossRef]
  28. Morris, J.P.; Fox, P.J.; Zhu, Y. Modeling Low Reynolds Number Incompressible Flows Using SPH. J. Comput. Phys. 1997, 136, 214–226. [Google Scholar] [CrossRef]
  29. Dong, X.W.; Liu, G.R.; Li, Z.L.; Zeng, W. A smoothed particle hydrodynamics (SPH) model for simulating surface erosion by impacts of foreign particles. Tribol. Int. 2016, 95, 267–278. [Google Scholar] [CrossRef]
  30. Mou, T.P.; Luo, F.Y.; Xiao, H.P.; Qiu, Z.X.; Zhang, G. Centrifuge Modeling on the Slope Supproted by Vertical Retaining Wall. Highway 2022, 67, 9–14. (In Chinese) [Google Scholar]
  31. Aluko, O.; Seig, D. An experimental investigation of the characteristics of and conditions for brittle fracture in two-dimensional soil cutting. Soil Tillage Res. 2000, 57, 143–157. [Google Scholar] [CrossRef]
Figure 1. Soil–retaining wall contact and stress analysis diagram.
Processes 12 00411 g001
Figure 2. Flow chart of SPH model algorithm.
Processes 12 00411 g002
Figure 3. Model diagram of the landslide experimental test of Mou et al. [30].
Processes 12 00411 g003
Figure 4. Schematic diagram of the slope and retaining wall.
Processes 12 00411 g004
Figure 5. SPH simulation results of a landslide without centrifugation. (a) t = 0.0 s (b) t = 1.0 s (c) t = 2.0 s (d) t = 3.0 s.
Processes 12 00411 g005
Figure 6. SPH simulation results of a landslide when acceleration is 3 g. (a) t = 0.0 s (b) t = 0.2 s (c) t = 0.7 s (d) t = 0.84 s.
Processes 12 00411 g006
Figure 7. Time-displacement diagram of retaining wall with acceleration of 3 g.
Processes 12 00411 g007
Figure 8. SPH simulation results of a landslide when μ = 0.2. (a) t = 0.0 s (b) t = 1.0 s (c) t = 2.0 s (d) t = 3.0 s.
Processes 12 00411 g008
Figure 9. Time-displacement diagram of retaining wall when μ = 0.2.
Processes 12 00411 g009
Figure 10. SPH simulation results of a landslide when μ = 0.1. (a) t = 0.0 s (b) t = 1.0 s (c) t = 3.0 s (d) t = 6.1 s.
Processes 12 00411 g010
Figure 11. Time-displacement diagram of retaining wall when μ = 0.1.
Processes 12 00411 g011
Figure 12. SPH simulation results of a landslide with different b values. (a) b = 1 t = 3.00 s (b) b = 0.9 t = 5.85 s (c) b = 0.8 t = 5.97 s (d) b = 0.7 t = 7.74 s.
Processes 12 00411 g012
Figure 13. Relationship diagram of the angle between the bottom edge of the retaining wall and ground.
Processes 12 00411 g013
Table 1. Friction coefficient between rock and soil and the bottom of the retaining wall.
Types of Rock and SoilFriction Factor
Clay0.2–0.4
Silt0.25–0.35
Sandy soil0.3–0.4
Crushed stone0.4–0.5
Soft rock0.4–0.6
Disclaimer/Publisher’s Note: The statements, opinions and data contained in all publications are solely those of the individual author(s) and contributor(s) and not of MDPI and/or the editor(s). MDPI and/or the editor(s) disclaim responsibility for any injury to people or property resulting from any ideas, methods, instructions or products referred to in the content.