Numerical Simulation of Hydrogen–Coal Blending Combustion in a 660 MW Tangential Boiler
by
Lijiang Dong
1, 
Shangwen Huang
2,*,
Baiyun Qian
1,
Kaike Wang
1,
Ning Gao
1,
Xiang Lin
1,
Zeqi Shi
1 and
Hao Lu
2,* 1
State Grid Xinjiang Company Limited Electric Power Research Institute, Urumqi 830047, China
2
Laboratory of Energy Carbon Neutrality, School of Electrical Engineering, Xinjiang University, Urumqi 830047, China
*
Authors to whom correspondence should be addressed.
Processes 2024, 12(2), 415; https://doi.org/10.3390/pr12020415
Submission received: 16 January 2024
/
Revised: 10 February 2024
/
Accepted: 13 February 2024
/
Published: 19 February 2024
Abstract
:With the adjustment of energy structure, the utilization of hydrogen energy has been widely attended. China’s carbon neutrality targets make it urgent to change traditional coal-fired power generation. The paper investigates the combustion of pulverized coal blended with hydrogen to reduce carbon emissions. In terms of calorific value, the pulverized coal combustion with hydrogen at 1%, 5%, and 10% blending ratios is investigated. The results show that there is a significant reduction in CO2 concentration after hydrogen blending. The CO2 concentration (mole fraction) decreased from 15.6% to 13.6% for the 10% hydrogen blending condition compared to the non-hydrogen blending condition. The rapid combustion of hydrogen produces large amounts of heat in a short period, which helps the ignition of pulverized coal. However, as the proportion of hydrogen blending increases, the production of large amounts of H2O gives an overall lower temperature. On the other hand, the temperature distribution is more uniform. The concentrations of O2 and CO in the upper part of the furnace increased. The current air distribution pattern cannot satisfy the adequate combustion of the fuel after hydrogen blending.
1. Introduction
New energy power generation is constrained by environmental factors, making it difficult to ensure a balance between the supply and demand of electricity [1]. During periods of low electrical energy demand, it is possible to transform electrical energy into hydrogen energy for storage and utilization—efficient use of energy by using hydrogen to generate electricity during peak demand periods. Compared to traditional hydrogen production methods, the use of new energy-generated electricity to produce hydrogen generates no pollutants [2]. There is little to no impact on the environment. A huge hydrogen energy industry chain is expected to be formed in the future. However, hydrogen has explosive and flammable characteristics. Large-scale storage and long-distance transportation still face major difficulties [3]. It will be difficult to establish a nationwide hydrogen transmission network in the future period. The utilization of hydrogen energy is likely to be concentrated in a small area. Hydrogen power generation is one of the key directions. Hydrogen power generation compensates for the instability of new energy generation. And it can effectively reduce carbon emissions.
There have been several studies on the combustion of hydrogen as a fuel to generate electricity. The main studies are centered on pure hydrogen combustion [4,5], methane–hydrogen blending combustion [6,7,8,9,10], natural gas–hydrogen blending combustion [11,12], ammonia–hydrogen blending combustion [13,14,15,16,17], and other fields. Tan et al. [18] investigated the staged combustion of hydrogen using numerical simulation. The redesigned combustion chamber structure has a smaller NOx (nitrogen oxide) emission. It can provide a reference for high-power hydrogen gas turbines. Banihabib et al. [19] redesigned the structure and control system of the original micro gas turbine. The purpose is to increase the percentage of hydrogen blending. The 100KW micro gas turbine was tested at 100% hydrogen combustion. And all the operational data were provided. The results showed that the machine operated stably, and the NOx emission was far below the limit. The premixed combustion study of methane–hydrogen blending was carried out by Liu et al. [20]. The effects of changes in equivalence ratio, Reynolds number, and H2 (hydrogen) concentration on gas turbine combustion were investigated in the laboratory. There was a significant change in the flame shape after the H2 concentration was increased. The occurrence of boundary layer flashback in hydrogen-enriched flames was also observed. Reale et al. [21] analyzed the effect of injecting liquid water and steam into hydrogen-containing methane fuel on the combustion process. The H2 concentration (volume fraction) can be increased to 30% while maintaining combustion stability. Zhou et al. [22] developed a more accurate gas radiation model to improve the accuracy of the simulations for natural gas–hydrogen blending. The model has high adaptability in the natural gas–hydrogen blending combustion process. Meziane et al. [23] explored the effect of different hydrogen blending ratios (0–90% volume fraction) on natural gas combustion through numerical simulations. The results demonstrated that when the hydrogen blending ratio increased, the temperature at the combustion chamber’s exit increased as the fuel mass flow rate remained constant. When the velocity at the inlet was kept constant, the pollutants produced by combustion decreased as the hydrogen percentage increased. However, there was a reduction in the temperature at the outlet, which would affect the output power. As the percentage of hydrogen increased, neither fuel injection method could ensure clean and efficient combustion. Further improvements to the gas turbine structure were needed. Bioche et al. [24,25] performed a large eddy simulation of ammonia/hydrogen/air combustion. The burner thermal power under optimal conditions could reach 34 KW. The effect of pressure changes on combustion was explored. Under high pressures, NO (nitric oxide) production was reduced at high pressures, and flame length was reduced. The cold wall temperature favors the suppression of NO production.
There have been many studies on the blending of hydrogen with gaseous fuels. However, there have been relatively few studies on hydrogen blending of coal combustion. It is important to realize the efficient use of hydrogen energy and promote the goal of carbon neutrality. The paper carries out a study of hydrogen blending combustion for a 660 MW tangential boiler. Based on the stable combustion of the existing coal-fired boiler, different percentages of hydrogen are blended from the sidewall. The flow field structure, combustion, and component changes after the hydrogen blending of coal are analyzed. It is expected to provide some references for future hydrogen utilization and coal-fired power plant renovation. It will contribute to carbon reduction.
2. Simulation Model and Meshing
The model chosen for this simulation is a 660 MW tangential boiler. The structural dimensions of the boiler in millimeters are shown in Figure 1. The detailed boiler layout has been described in previous work [26]. The B–F layer burners are put into operation. The B-layer burners are located in the lowest layer of the burners in operation. The intensity of air–coal mixing is lower compared to the burners in other layers. Therefore, based on the original boiler structure, four hydrogen burners are arranged at the boiler walls in the B-layer. The arrangement of the burner in layer B and SOFA (separated over-fire air) in the furnace is shown in Figure 2. The distance of the arranged hydrogen burners from the wall is 3000 mm.
The mesh is regenerated after adding the burners. The structured mesh is shown in Figure 3. Mesh numbers of 1456300, 1615434, and 1735540 are employed for simulation calculations, respectively. The mesh independence is verified by comparing the temperature at three different meshes, as shown in Figure 4. The temperature at a mesh number of 1.45 million is lower than that at the other mesh numbers. To save computational resources and ensure accuracy, the mesh number of 1.61 million is adopted.
3. Numerical Models and Simulation Cases
In this simulation, the flow, the tracking of pulverized coal particles, the devolatilization of volatile matter, gas phase combustion, the combustion of char, and the radiative heat transfer are chosen as a realizable k-ɛ model [27], stochastic particle trajectory model [28], two competing rate models [29], two mixture fraction/probability density function models [30], diffusion/kinetic-limited model [31], and P-1 model [32], respectively. The detailed description and parameter settings refer to the reference [26].
For this simulation, the characteristics of the coal used are shown in Table 1. Table 2 demonstrates the operating parameters of the boiler and the variation in the parameters after hydrogen blending. The boiler is operated at full load (660 MW).
To ensure that the load remains constant, the amount of hydrogen blending is determined by a percentage of the calorific value. For example, a percent hydrogen blending ratio represents that the heat released by complete combustion of hydrogen is equal to one percent of the heat when only coal is burned. To maintain overall heat uniformity, any reduction in the amount of pulverized coal due to hydrogen blending is reduced from the layer B burners. Additionally, any reduction in the amount of air is reduced from the BC-layer auxiliary air. The overall excess air coefficient is kept constant, and the temperature of the hydrogen gas fed in is set at 300 K. The remaining parameters are set by reference [26].
4. Results and Discussion
4.1. Verification of Simulation Results
To ensure the accuracy of the simulation results after adjusting the mesh, the obtained simulation results were compared with the design data based on the previous study [26], as shown in Table 3. The relative errors of O2 (oxygen), CO2 (carbon dioxide), gas temperature, and flue temperature are all within ±5%. The established simulation model has high accuracy.
4.2. Effect of Hydrogen Blending on the Flow Field
The flow fields in the furnace with different hydrogen blending ratios are shown in Figure 5. From Figure 5a, the flow field at the upper group burners (D–F layer burners) and SOFA zone changes less with the entry of different proportions of hydrogen. The hydrogen is blended in from the B-layer burners, which has less effect on the upper flow field. At the lower group of burners, the gas flow velocity starts to decrease as the percentage of hydrogen increases.
From Table 2, the total air volume gradually decreases as the percentage of hydrogen increases. In the same heat release situation, the amount of air required for hydrogen is lower than that required for pulverized coal. The air volume at the auxiliary air in the BC layer is reduced. The reduction in air volume also causes the momentum to decrease and the diameter of the tangent circle to increase. The change in the lower flow field also causes the velocity at the hopper to increase. At the top of the furnace, the reduction in the total airflow allowed the velocity of the flue gas above the arch nose to decrease. The overall flow in the furnace is stable. The hydrogen blending did not adversely affect the flow field.
Figure 5b shows the variation in the flow field at the B-layer burners after hydrogen blending. Due to the high calorific value of hydrogen, the amount of hydrogen blended in is relatively low. No more significant velocity changes are observed at the hydrogen inlet. The tangent circle diameter of the B layer has a significant increase as the hydrogen blending ratio increases. The combustion of hydrogen makes the pressure at the wall decrease. And the jet stream is shifted to the wall. Compared to Case 1, the increase in tangent circle diameter in Case 4 enlarges the contact area between coal and wind, which enhances the mixing of wind and coal.
4.3. Effect of Hydrogen Blending on the Temperature
From Figure 6a, the temperature in the center zone gradually decreases as the percentage of hydrogen blending increases. The high-temperature zone produced by combustion is more concentrated at the wall. The overall combustion coincides with the flow field in Figure 5a. In the SOFA zone, the supplemental incoming SOFA allows the adequate combustion of unburned pulverized coal in Case 1. The temperature in this zone increased. In Cases 2–4, the temperature in this zone decreases when the percentage of hydrogen blending rises. The blending of hydrogen reduces the amount of pulverized coal, and the amount of unburned pulverized coal decreases. The amount of heat released from the adequate combustion of the pulverized coal here also decreases.
Figure 6b shows the variation in the temperature field with different percentages of hydrogen from the B-layer burners. Compared to Case 1, the percentage of hydrogen blending is only 1%, and the overall temperature change is not significant in Case 2. In Cases 3 and 4, the percentage of hydrogen blending is increased to 5% and 10%, respectively. High temperatures can be observed in a smaller zone at the boiler wall. It takes a certain distance for the pulverized coal at the corners to start burning. The combustion of hydrogen is more rapid due to its flammable properties. The heat released from combustion favors the combustion of nearby pulverized coal. With the addition of hydrogen to the combustion, the temperature at the B-layer burners gradually decreases with the increase in the percentage of hydrogen. The H2O (Water) produced by burning hydrogen absorbs a lot of heat. The proportion of H2O in the flue gas is significantly higher in Cases 3 and 4 compared to Case 1. The specific heat capacity of water is higher compared to the other components of the flue gas. The increase in the specific heat capacity of the flue gas decreases the temperature.
The average temperatures of the cross-section at different heights of the boiler are calculated. The results are shown in Figure 7. As the percentage of hydrogen increases, there is an overall decreasing trend in the temperature from Case 1 to Case 4. From Case 1 to Case 3, the temperature has been decreasing. The trend of the temperature has not changed significantly. In Case 4, a large percentage of hydrogen is blended into the combustion. A large amount of water steam is generated in the lower part of the combustion zone, which reduces the temperature. While lowering the temperature, the temperature distribution is more uniform compared to Cases 1–3. There is no significant difference in the temperature variation trend in the upper part of the combustion zone. At about 29.9 m and 32.6 m, the addition of auxiliary air from the DE and EF layers lowered the temperature slightly. The temperatures all peaked at the top of the combustion zone. Compared to the maximum temperature of 1911 K in Case 1, the maximum temperature is only 1810 K in Case 4, which is about 5.3% lower. In the SOFA zone, the pulverized coal has almost completely burned. The temperature continues to decrease as the height increases.
4.4. Effect of Hydrogen Blending on the Species Distribution
The fraction of species in the furnace changed accordingly after hydrogen blending for combustion. The changes in the species are shown in Figure 8, Figure 9, Figure 10, Figure 11 and Figure 12.
Figure 8 and Figure 9 demonstrate the H2 distribution in the furnace and the average H2 concentration at different heights. From Figure 8a, it can be seen that in the combustion zone, the combustion of pulverized coal generates a certain amount of H2, which accumulates at the hopper. The center of the furnace also has a high concentration of H2 due to the influence of the updraft. As the height rises, H2 is basically burned out. The H2 concentration has a more significant increase with the increase in the hydrogen blending ratio. It can be seen from Figure 8b and Figure 11a that the combustion of pulverized coal consumes the O2 in the nearby zone. Due to the insufficient O2 concentration, H2 cannot be burned. A low concentration of H2 exists after the combustion of pulverized coal. With the entry of hydrogen from the side, there is also a certain concentration of H2 at the wall in Cases 2–4.
The variation in H2 concentration along the furnace height is shown in Figure 9. In Cases 1–4, the H2 concentration gradually increases with the increase in the hydrogen blending ratio. In conjunction with Figure 12a, the O2 concentration at the bottom is low and insufficient to support hydrogen combustion. As the height increased, the air was replenished from the burners, and the H2 concentration began to decrease. At the B-layer burners (at about 21.3 m), the addition of hydrogen gives a sudden increase in the H2 concentration. In Case 4, the H2 concentration reached a maximum of about 3.91%. In Cases 1–3, as the furnace height increased, the H2 concentration fluctuated slightly due to the combustion. And the concentration shows an overall decreasing trend. In Case 4, the concentration of H2 increases from 22.6 to 26.4m. The O2 concentration is relatively low between the two groups of burners. The combustion of hydrogen produces a certain amount of H2O. The reaction of H2O with char produces a certain amount of H2. From the upper burners to the top of the furnace, the large amount of O2 replenishment makes the H2 concentration decrease continuously. In the burnout zone, the H2 concentrations in Cases 1–4 are all maintained at a stable value. The H2 concentration in Case 4 is maintained at about 0.25% compared to the H2 concentration in Case 1, which tended to be zero.
Figure 10a and Figure 11a show the O2 distribution at the longitudinal and cross sections of the boiler for different hydrogen blending ratios, respectively. In the hopper and combustion zone, the combustion of pulverized coal and hydrogen consumes a large amount of O2. In the combustion zone, the supplemental air gives a higher O2 concentration at the burner outlet, as shown in Figure 11a. In the SOFA zone, the supplemental air brought a higher concentration of O2. The amount of SOFA does not change, but the flue gas velocity is reduced. This affects the adequate combustion of pulverized coal, which leads to a lower amount of consumed O2. From Cases 1 to 4, the O2 concentration at the top gradually increased.
The specific O2 concentration variation is shown in Figure 12a. From Case 1 to Case 4, the gradually decreasing total air volume attenuated the mixing between air and coal. Meanwhile, increasing amounts of H2O and char are reacted with each other. All these affected the adequate combustion of pulverized coal. In Cases 1 to 3, the O2 at the hopper is completely consumed. In Case 4, the reduction in the amount of pulverized coal in the B-layer burners resulted in a certain amount of O2 concentration. The concentration is maintained near 0.5%. In the combustion zone, there is no obvious difference in the trend of O2 concentration. A large amount of air is brought in by the auxiliary air in the BC, DE, and EF layers. The O2 concentration increases significantly at the auxiliary air nozzles at 22.6 m, 29.9 m, and 32.6 m. The combustion basically ends after the SOFA is replenished. The O2 concentration is basically stabilized in the upper part of the furnace. The increase in the hydrogen blending ratio affects the combustion of pulverized coal. More O2 is not consumed. Compared with the O2 concentration of 3.46% in Case 1, the O2 concentration in Case 4 reaches 4.17%.
As can be seen in Figure 10b, CO (carbon monoxide) is mainly concentrated in the lower part. The O2 concentration in this zone is insufficient for the pulverized coal to burn out, producing more CO. In the upper part, a sufficient amount of O2 maintains the CO concentration at a very low level. From Figure 11b, it can be seen that there is a high concentration of CO at the walls in Case 4. In conjunction with Figure 11d, the combustion of hydrogen produces a large amount of H2O, which in turn reacts with the char to produce CO.
The variations in CO concentration are shown more clearly in Figure 12b. From Case 1 to Case 3, the concentration of CO decreases with increasing hydrogen blending ratio from the hopper to the top of the combustion zone. From Figure 12d, the higher the hydrogen blending ratio, the higher the concentration of H2O. The CO will react with H2O, and the CO is consumed. In Case 4, which has the highest hydrogen blending ratio, the combustion of H2 brings a large amount of H2O. It greatly promotes the reaction between H2O and char, and a large amount of CO is produced. In the burnout zone, the CO concentration gradually increases with the increase in the hydrogen blending ratio. Although there is a high O2 concentration in the SOFA zone, the air–coal mixing is weak, and H2O also affects the combustion. Eventually, the CO concentration is maintained around 0.12%, 0.33%, and 0.51% for Cases 2 to 4, respectively, compared to Case 1, where the CO concentration tends to zero.
The variations in CO2 concentration at the longitudinal and transverse sections of the furnace can be seen in Figure 10c and Figure 11c. When the hydrogen blending ratio is gradually increased, the concentration of CO2 decreases significantly. In the combustion zone, a large amount of CO2 produced by pulverized coal combustion is affected by the rotating airflow. The CO2 spreads to the walls of the boiler, and the concentration of CO2 is higher near the walls. In the burnout zone, the large amount of O2 brought by the SOFA supports the combustion of unburned pulverized coal. The CO2 concentration increases. A certain amount of CO2 can be observed at the inlet of the hydrogen burners in Cases 3 and 4, as shown in Figure 11c. The hydrogen burner is close to the pulverized coal burner. The amount of pulverized coal in the B-layer burners decreases after the increase in the blending ratio. The amount of primary air does not change. After the reaction between H2O and char to form CO, the small amount of O2 brought by the primary air in the B-layer allows CO to continue to be burned.
Figure 12c shows the average concentration of CO2 at different furnace heights. At the bottom of the furnace, the reaction of CO with H2O gives higher CO2 concentrations in Cases 2 and 3 than in the non-hydrogen blended Case 1. From Figure 12b,d, the combined CO and H2O concentrations in Cases 2 and 3 are closer to those at the hopper. This also puts the CO2 concentrations close to each other in both cases, with both concentrations near 15.4% at the bottom. In Case 4, the CO2 concentration has dropped significantly, with only 12.4%. In the combustion zone, there is a significant reduction in CO2 concentration at the 21.3 m B-layer burners due to the influence of hydrogen blending. In Cases 1 to 3, the CO2 concentration fluctuates considerably under the influence of combustion. In Case 4, the temperature distribution is more uniform (see Figure 7), and the fluctuation of CO2 concentration is small. In the burnout zone, the CO2 concentration gradually stabilized with the end of combustion. From Case 1 to Case 4, the CO2 concentration stabilized at 15.6%, 15.4%, 14.5%, and 13.6%, respectively.
From Figure 10d, it can be seen that the distribution of H2O is more uniform when hydrogen is not blended. After blending hydrogen, the H2O concentration in the lower part has a significant increase. At the B-layer of burners, where hydrogen is injected, there is a large amount of H2O production at the wall, as shown in Figure 11d. In Figure 12d, the average concentration of H2O at different heights is shown. The H2O produced from combustion is accumulated at the hopper by gravity. From Case 2 to Case 4, hydrogen blending increases the H2O concentration with the increase in the hydrogen blending ratio. The H2O concentration in Case 4 reached a maximum of 11.4%. Eventually, the H2O concentrations in Cases 1 to 4 basically ceased to change at the top. The H2O concentrations floated around 4.24%, 4.45%, 4.92%, and 5.73%, respectively.
The average concentrations of CO+CO2 are displayed in Figure 13. From Case 1 to Case 4, the variation in CO+CO2 concentrations is opposite to H2O. The concentrations of CO + CO2 gradually decrease as the proportion of blended hydrogen increases. The combustion of H2 brings more H2O. The proportion of CO + CO2 produced by the combustion of pulverized coal is reduced. It is clear that H2 blending favors the reduction in CO + CO2 concentration.
5. Conclusions
In this paper, for the combustion of pulverized coal with hydrogen blending, a simulation is carried out in a 660 MW boiler. It is hoped that effective means will be used to reduce carbon emissions. The effects of different hydrogen blending ratios on (1%, 5%, and 10%) combustion are investigated. The conclusions obtained are as follows:
- (1)
- The large amount of heat released by hydrogen combustion helps the ignition of pulverized coal. The combustion of hydrogen in the B-layer burners increases the tangent diameter. It helps the mixing between air and coal.
- (2)
- More H2O will be produced after hydrogen blending. A large amount of heat is stored in H2O. The temperature has a significant reduction, which affects the heat exchange of the boiler. When the percentage of hydrogen blending reaches 10%, the maximum temperature in the furnace is reduced by about 5.3%. However, the temperature distribution in the lower part of the combustion zone is more uniform.
- (3)
- Hydrogen blending reduces CO2 production at the source. Compared with the CO2 concentration of 15.6% under the non-hydrogen blending condition, the CO2 concentration decreased to 13.6% under the 10% hydrogen blending condition.
- (4)
- As the percentage of hydrogen blending increases, the concentrations of O2 and CO at the furnace outlet increase. The combustion is not complete. The existing air distribution pattern is not suitable for the combustion of pulverized coal with hydrogen.
Coal with hydrogen combustion has a certain combustion-supporting effect while reducing CO2. However, the air distribution scheme based on pulverized coal combustion is not suitable for hydrogen blending combustion. In the future, the air distribution scheme of coal–hydrogen cofiring needs to be further explored. It is planned to reduce the effect of air temperature on combustion by reducing the total airflow. The operating layers of the H2 burner are adjusted to allow for a more even distribution of H2. The purpose of ensuring adequate combustion is achieved by preheating the pulverized coal. It is hoped that these methods will air distributions for coal–hydrogen cofiring. The role of H2 in supporting combustion will play a significant role in the low-load stabilization of boilers in the future. It provides a solution for the stable operation of boilers at low and variable loads. It effectively reduces carbon emissions at the source.
Author Contributions
Software, B.Q.; Validation, N.G.; Formal analysis, K.W.; Investigation, X.L.; Data curation, L.D. and Z.S.; Writing—original draft, S.H.; Writing—review and editing, H.L. All authors have read and agreed to the published version of the manuscript.
Funding
The authors appreciate the financial support provided by the State Grid Company Limited Electric Power Research Institute Science and Technology Project (SGXJDK00NYJS2310296).
Data Availability Statement
Data are contained within the article.
Conflicts of Interest
The authors declare no conflicts of interest.
References
- Liu, L.; Zhai, R.; Hu, Y. Performance evaluation of wind-solar-hydrogen system for renewable energy generation and green hydrogen generation and storage: Energy, exergy, economic, and enviroeconomic. Energy 2023, 276, 127386. [Google Scholar] [CrossRef]
- Ge, L.; Zhang, B.; Huang, W.; Li, Y.; Hou, L.; Xiao, J.; Mao, Z.; Li, X. A review of hydrogen generation, storage, and applications in power system. J. Energy Storage 2024, 75, 109307. [Google Scholar] [CrossRef]
- Xu, Y.; Deng, Y.; Liu, W.; Zhao, X.; Xu, J.; Yuan, Z. Research progress of hydrogen energy and metal hydrogen storage materials. Sustain. Energy Technol. Assess. 2023, 55, 102974. [Google Scholar] [CrossRef]
- Cappelletti, A.; Martelli, F. Investigation of a pure hydrogen fueled gas turbine burner. Int. J. Hydrogen Energy 2017, 42, 10513–10523. [Google Scholar] [CrossRef]
- Xu, S.; Xi, L.; Tian, S.; Tu, Y.; Chen, S.; Zhang, S.; Liu, H. Numerical investigation of pressure and H2O dilution effects on NO formation and reduction pathways in pure hydrogen MILD combustion. Appl. Energy 2023, 350, 121736. [Google Scholar] [CrossRef]
- Jithin, E.V.; Varghese, R.J.; Velamati, R.K. Experimental and numerical investigation on the effect of hydrogen addition and N2/CO2 dilution on laminar burning velocity of methane/oxygen mixtures. Int. J. Hydrogen Energy 2020, 45, 16838–16850. [Google Scholar] [CrossRef]
- Yadav, V.K.; Ray, A.; Ravi, M. Experimental and computational investigation of the laminar burning velocity of hydrogen-enriched biogas. Fuel 2019, 235, 810–821. [Google Scholar] [CrossRef]
- Zhou, Q.; Cheung, C.S.; Leung, C.W.; Li, X.; Li, X.; Huang, Z. Effects of fuel composition and initial pressure on laminar flame speed of H2/CO/CH4 bio-syngas. Fuel 2019, 238, 149–158. [Google Scholar] [CrossRef]
- Park, S. Hydrogen addition effect on NO formation in methane/air lean-premixed flames at elevated pressure. Int J Hydrog. Energy 2021, 46, 25712–25725. [Google Scholar] [CrossRef]
- de Persis, S.; Idir, M.; Molet, J.; Pillier, L. Effect of hydrogen addition on NOx formation in high-pressure counter-flow premixed CH4/air flames. Int. J. Hydrogen Energy 2019, 44, 23484–23502. [Google Scholar] [CrossRef]
- Donohoe, N.; Heufer, A.; Metcalfe, W.K.; Curran, H.J.; Davis, M.L.; Mathieu, O.; Plichta, D.; Morones, A.; Petersen, E.L.; Güthe, F. Ignition delay times, laminar flame speeds, and mechanism validation for natural gas/hydrogen blends at elevated pressures. Combust Flame 2014, 161, 1432–1443. [Google Scholar] [CrossRef]
- Cellek, M.S.; Pınarbaşı, A. Investigations on performance and emission characteristics of an industrial low swirl burner while burning natural gas, methane, hydrogen-enriched natural gas and hydrogen as fuels. Int. J. Hydrogen Energy 2018, 43, 1194–1207. [Google Scholar] [CrossRef]
- Valera-Medina, A.; Pugh, D.G.; Marsh, P.; Bulat, G.; Bowen, P. Preliminary study on lean premixed combustion of ammonia-hydrogen for swirling gas turbine combustors. Int. J. Hydrogen Energy 2017, 42, 24495–24503. [Google Scholar] [CrossRef]
- Khateeb, A.A.; Guiberti, T.F.; Zhu, X.; Younes, M.; Jamal, A.; Roberts, W.L. Stability limits and NO emissions of technically-premixed ammonia-hydrogen-nitrogen-air swirl flames. Int. J. Hydrogen Energy 2020, 45, 22008–22018. [Google Scholar] [CrossRef]
- Pugh, D.; Bowen, P.; Valera-Medina, A.; Giles, A.; Runyon, J.; Marsh, R. Influence of steam addition and elevated ambient conditions on NOx reduction in a staged premixed swirling NH3/H2 flame. Proc. Combust. Inst. 2019, 37, 5401–5409. [Google Scholar] [CrossRef]
- Valera-Medina, A.; Gutesa, M.; Xiao, H.; Pugh, D.; Giles, A.; Goktepe, B.; Marsh, R.; Bowen, P. Premixed ammonia/hydrogen swirl combustion under rich fuel conditions for gas turbines operation. Int. J. Hydrogen Energy 2019, 44, 8615–8626. [Google Scholar] [CrossRef]
- Okafor, E.C.; Tsukamoto, M.; Hayakawa, A.; Somarathne, K.D.K.A.; Kudo, T.; Tsujimura, T.; Kobayashi, H. Influence of wall heat loss on the emission characteristics of premixed ammonia-air swirling flames interacting with the combustor wall. Proc. Combust. Inst. 2021, 38, 5139–5146. [Google Scholar] [CrossRef]
- Tan, T.; Fan, W.; Zhang, R. Study on hydrogen staged combustion for gas turbine. Fuel 2023, 349, 128700. [Google Scholar] [CrossRef]
- Banihabib, R.; Lingstädt, T.; Wersland, M.; Kutne, P.; Assadi, M. Development and testing of a 100 kW fuel-flexible micro gas turbine running on 100% hydrogen. Int. J. Hydrogen Energy 2023, 49, 92–111. [Google Scholar] [CrossRef]
- Liu, X.; Bertsch, M.; Subash, A.A.; Yu, S.; Szasz, R.-Z.; Li, Z.; Petersson, P.; Bai, X.-S.; Aldén, M.; Lörstad, D. Investigation of turbulent premixed methane/air and hydrogen-enriched methane/air flames in a laboratory-scale gas turbine model combustor. Int. J. Hydrogen Energy 2021, 46, 13377–13388. [Google Scholar] [CrossRef]
- Reale, F.; Sannino, R. Water and steam injection in micro gas turbine supplied by hydrogen enriched fuels: Numerical investigation and performance analysis. Int. J. Hydrogen Energy 2021, 46, 24366–24381. [Google Scholar] [CrossRef]
- Zhou, Z.; Han, X.; Jin, G.; Wang, X.; Yu, J.; Shan, S. New coefficients of the weighted-sum-of-gray-gases model for gas radiation characteristics of hydrogen/natural gas blends combustion. Int. Commun. Heat Mass Transf. 2023, 149, 107090. [Google Scholar] [CrossRef]
- Meziane, S.; Bentebbiche, A. Numerical study of blended fuel natural gas-hydrogen combustion in rich/quench/lean combustor of a micro gas turbine. Int. J. Hydrogen Energy 2019, 44, 15610–15621. [Google Scholar] [CrossRef]
- Bioche, K.; Bricteux, L.; Bertolino, A.; Parente, A.; Blondeau, J. Large Eddy Simulation of rich ammonia/hydrogen/air combustion in a gas turbine burner. Int. J. Hydrogen Energy 2021, 46, 39548–39562. [Google Scholar] [CrossRef]
- Bioche, K.; Blondeau, J.; Bricteux, L. Large eddy simulation investigation of pressure and wall heat loss effects on rich ammonia-hydrogen-air combustion in a gas turbine burner. Int. J. Hydrogen Energy 2022, 47, 36342–36353. [Google Scholar] [CrossRef]
- Lu, H.; Huang, S.; Li, H.; Cheng, Z.; Chang, X.; Dong, L.; Kong, D.; Jing, X. Numerical simulation of combustion characteristics in a 660 MW tangentially fired pulverized coal boiler subjected to peak-load regulation. Case Stud. Therm. Eng. 2023, 49, 103168. [Google Scholar] [CrossRef]
- Shih, T.-H.; Liou, W.W.; Shabbir, A.; Yang, Z.; Zhu, J. A new k-ϵ eddy viscosity model for high reynolds number turbulent flows. Comput. Fluids 1995, 24, 227–238. [Google Scholar] [CrossRef]
- Chang, J.; Wang, X.; Zhou, Z.; Chen, H.; Niu, Y. CFD modeling of hydrodynamics, combustion and NOx emission in a tangentially fired pulverized-coal boiler at low load operating conditions. Adv. Powder Technol. 2021, 32, 290–303. [Google Scholar] [CrossRef]
- Kobayashi, H.; Howard, J.B.; Sarofim, A.F. Coal devolatilization at high temperatures. Symp. (Int.) Combust. 1977, 16, 411–425. [Google Scholar] [CrossRef]
- Ansys Inc. Ansys Fluent Theory Guide; Ansys Inc.: Canonsburg, PA, USA, 2023. [Google Scholar]
- Baum, M.; Street, P. Predicting the combustion behaviour of coal particles. Combust. Sci. Technol. 1971, 3, 231–243. [Google Scholar] [CrossRef]
- Sazhin, S.S.; Sazhina, E.M.; Faltsi-Saravelou, O.; Wild, P. The P-1 model for thermal radiation transfer: Advantages and limitations. Fuel 1996, 75, 289–294. [Google Scholar] [CrossRef]
Figure 1.
Boiler structure diagram.
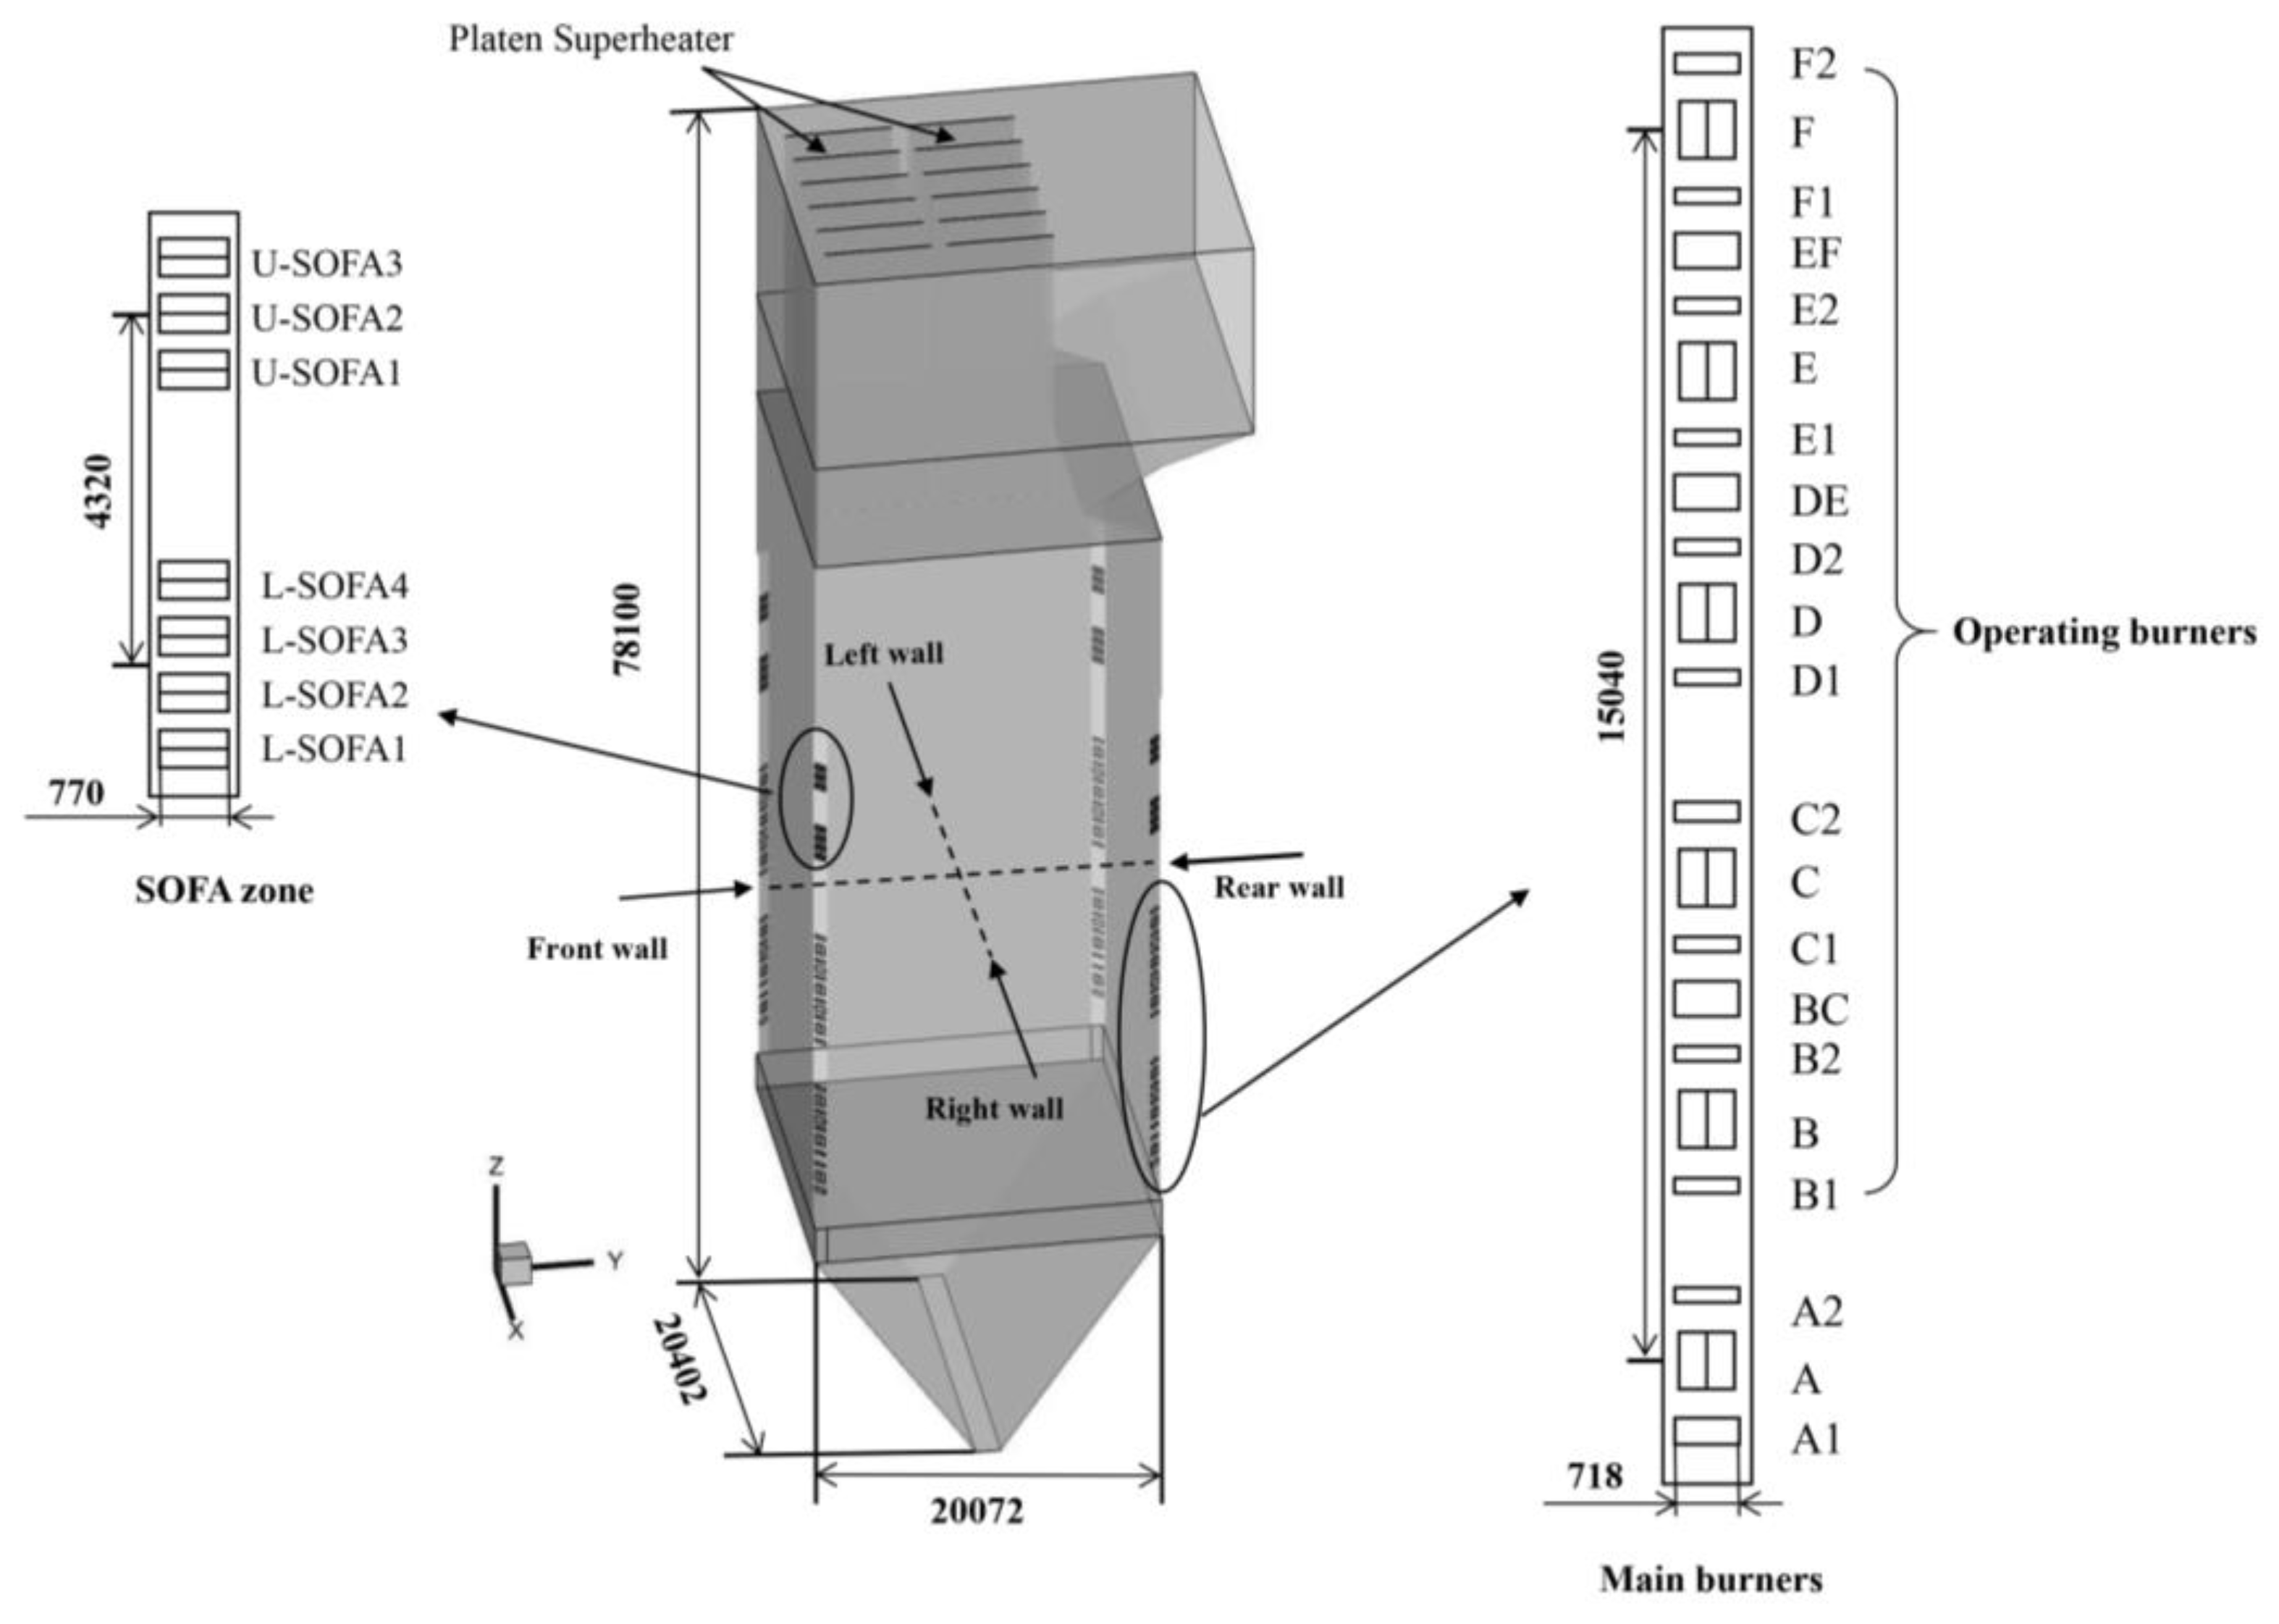
Figure 2.
(a) The B-layer burners layout diagram; (b) over-fire air burners layout diagram panel.
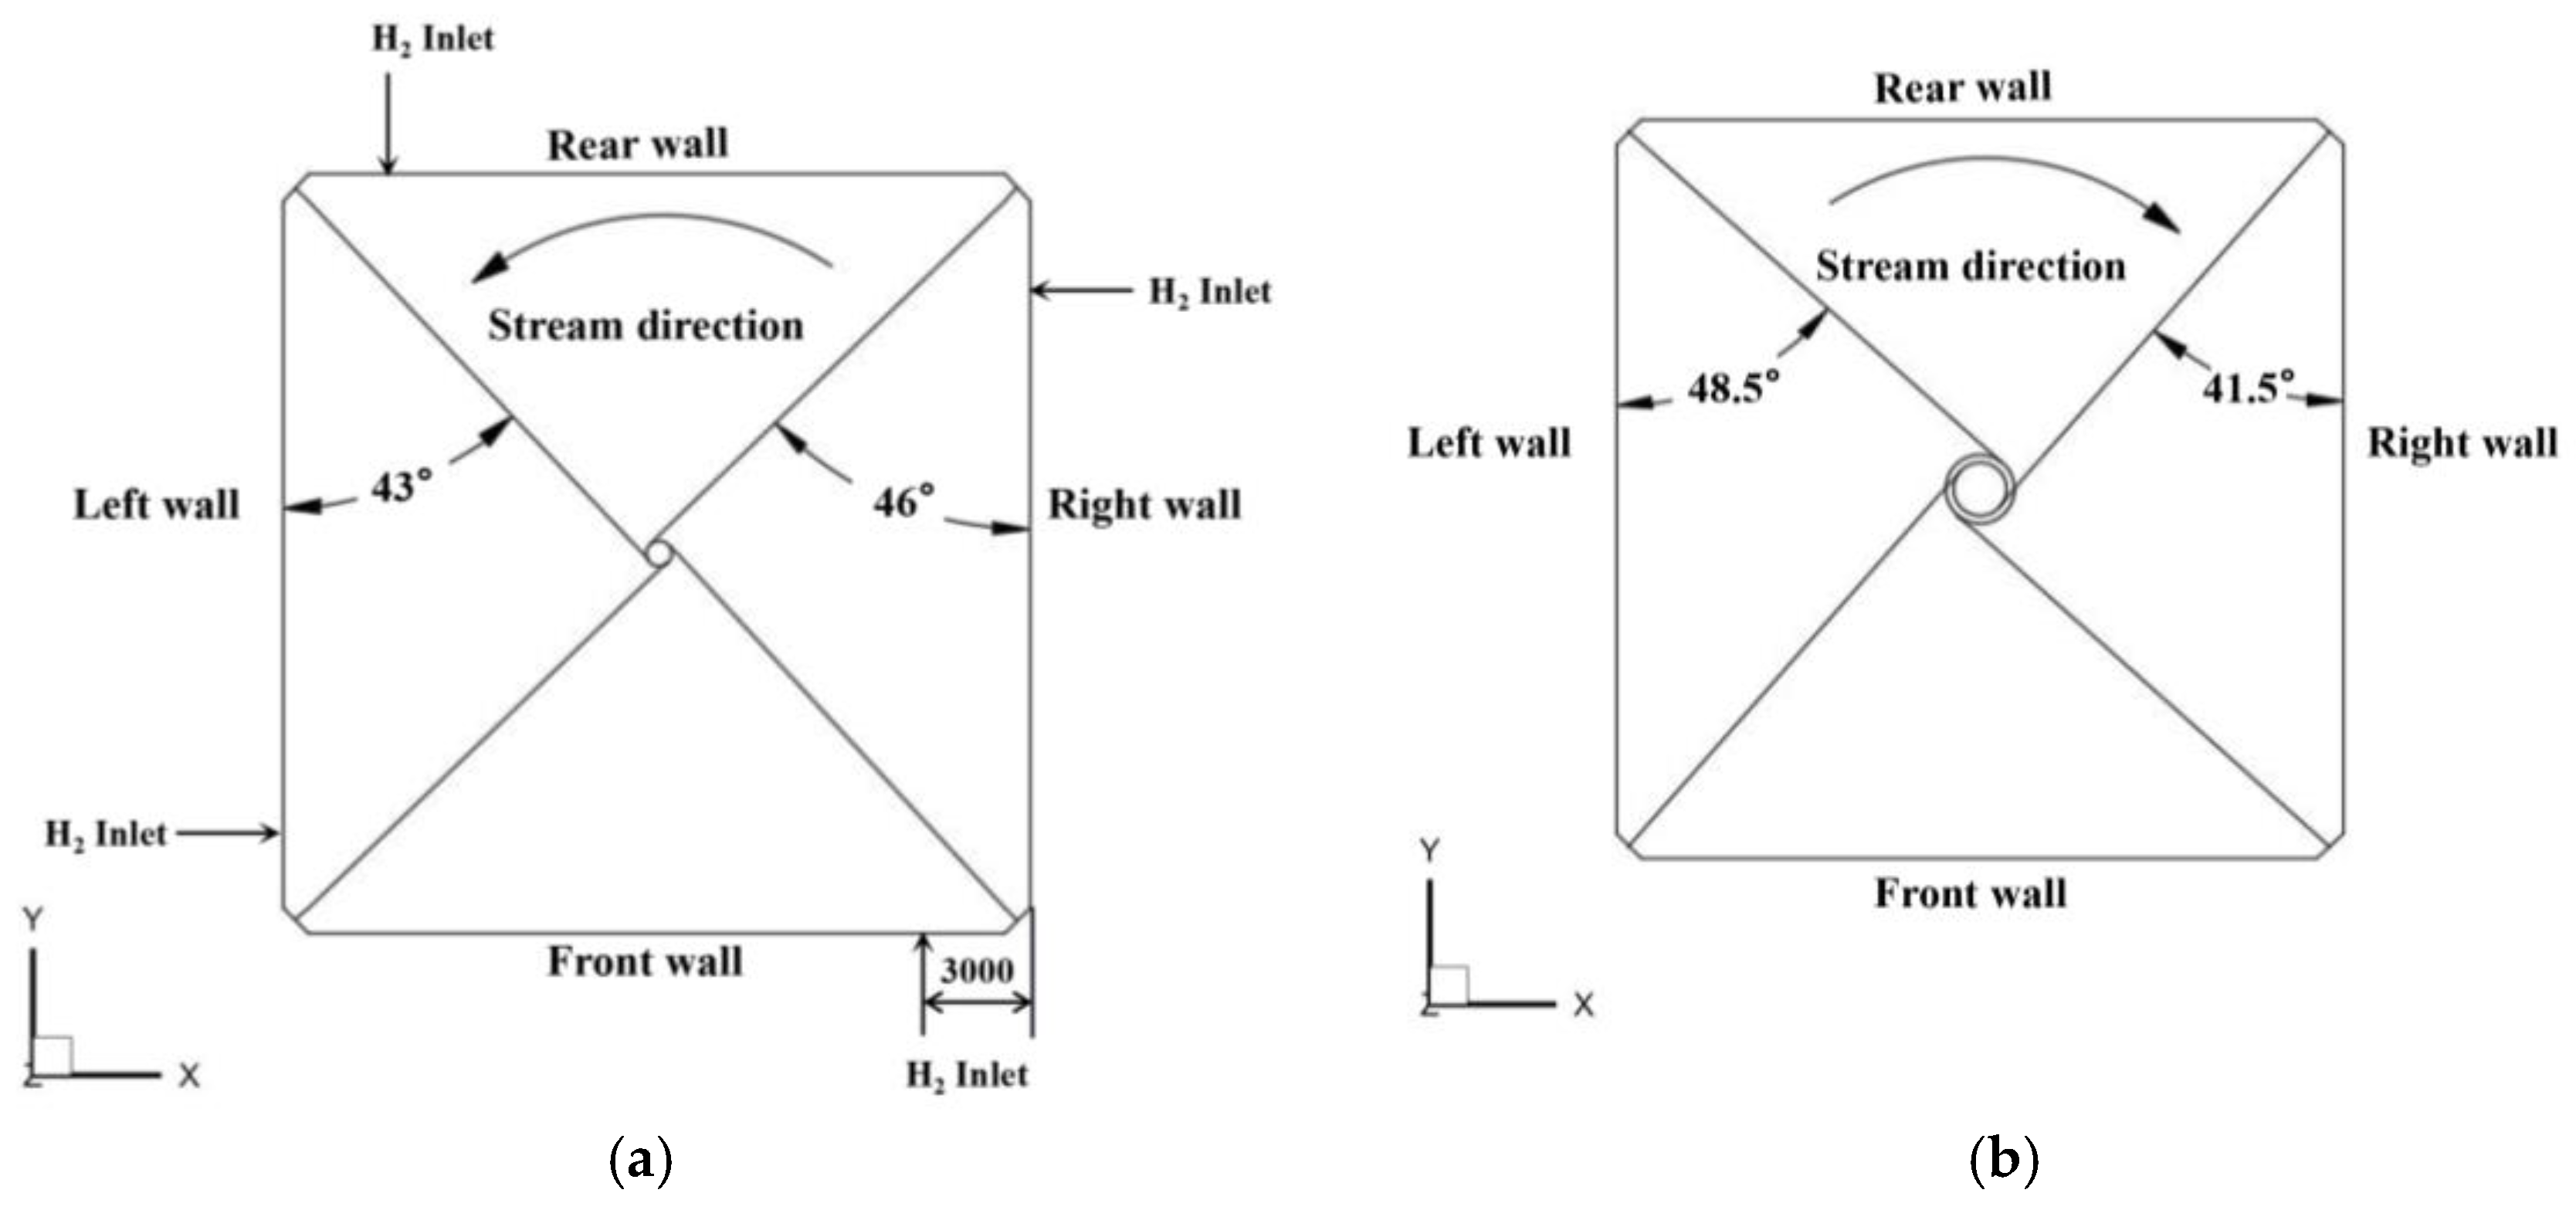
Figure 3.
(a) The mesh structure of the entirety; (b) the mesh structure of the cross-section.

Figure 4.
Mesh independence verification.

Figure 5.
(a) Velocity distribution at the longitudinal section of the boiler; (b) velocity distribution in cross-section at burners in layer B.
Figure 5.
(a) Velocity distribution at the longitudinal section of the boiler; (b) velocity distribution in cross-section at burners in layer B.
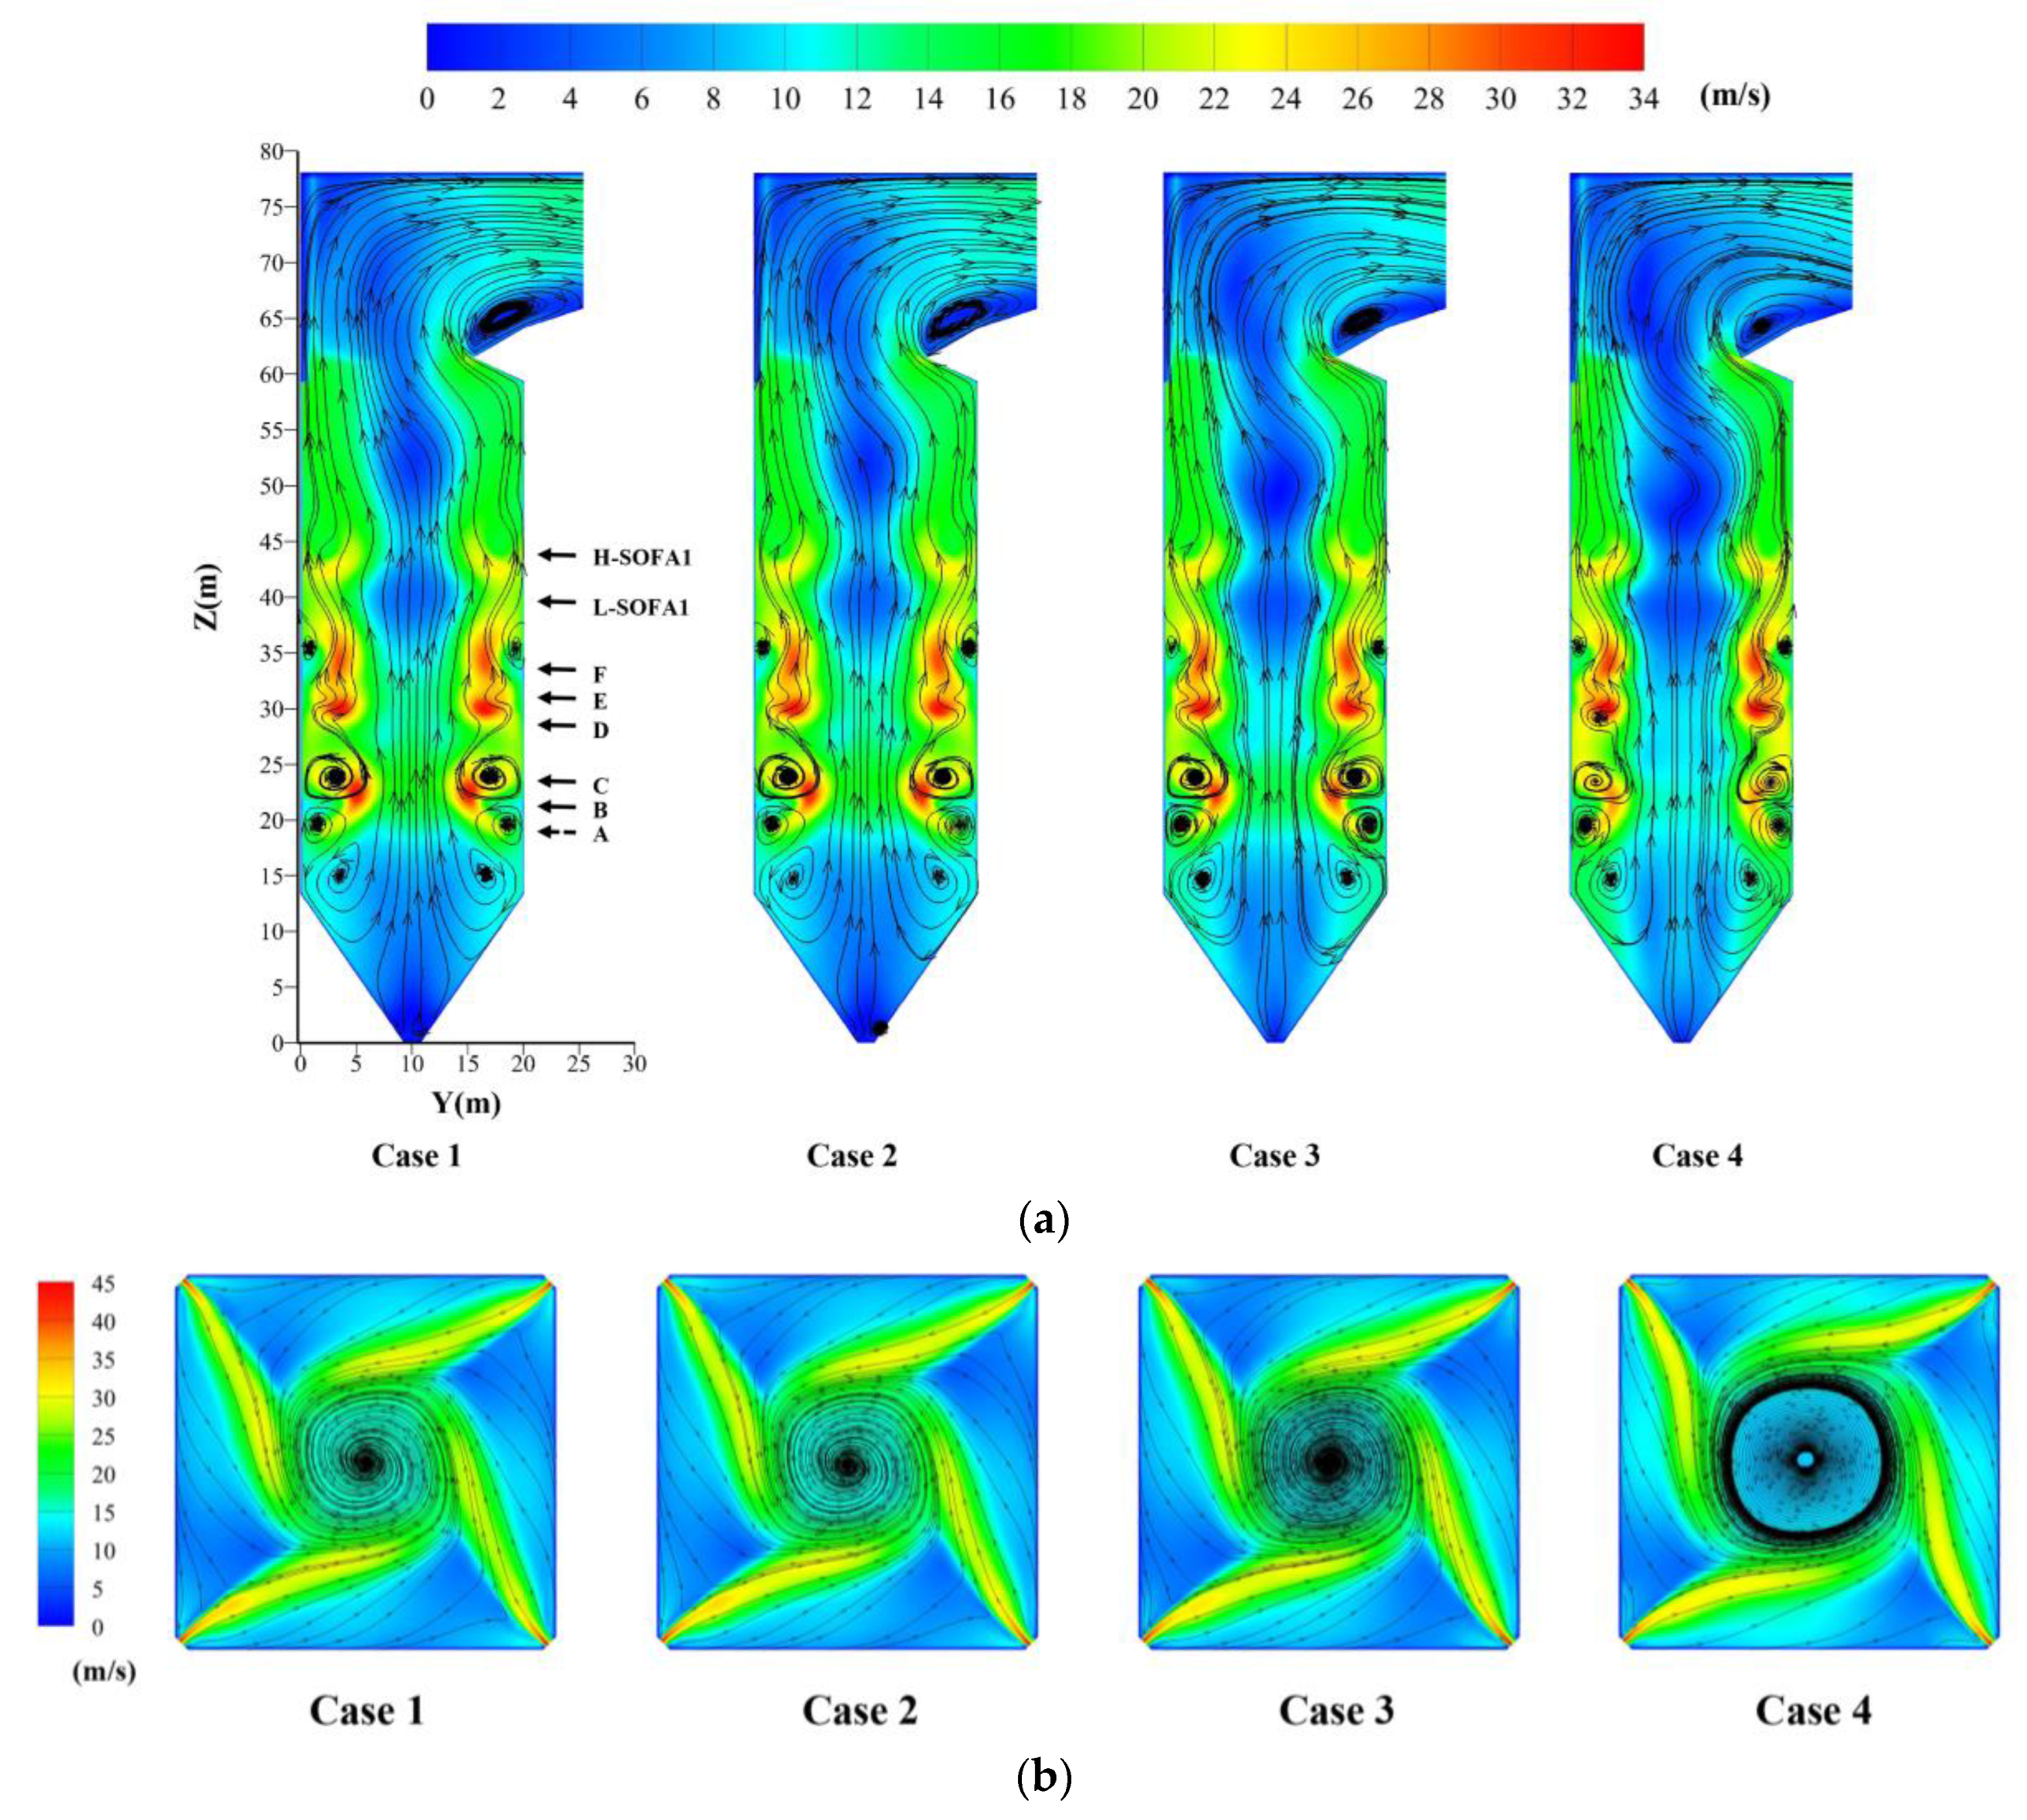
Figure 6.
(a) Temperature distribution at the longitudinal section of the boiler; (b) temperature distribution in cross-section at burners in layer B.
Figure 6.
(a) Temperature distribution at the longitudinal section of the boiler; (b) temperature distribution in cross-section at burners in layer B.
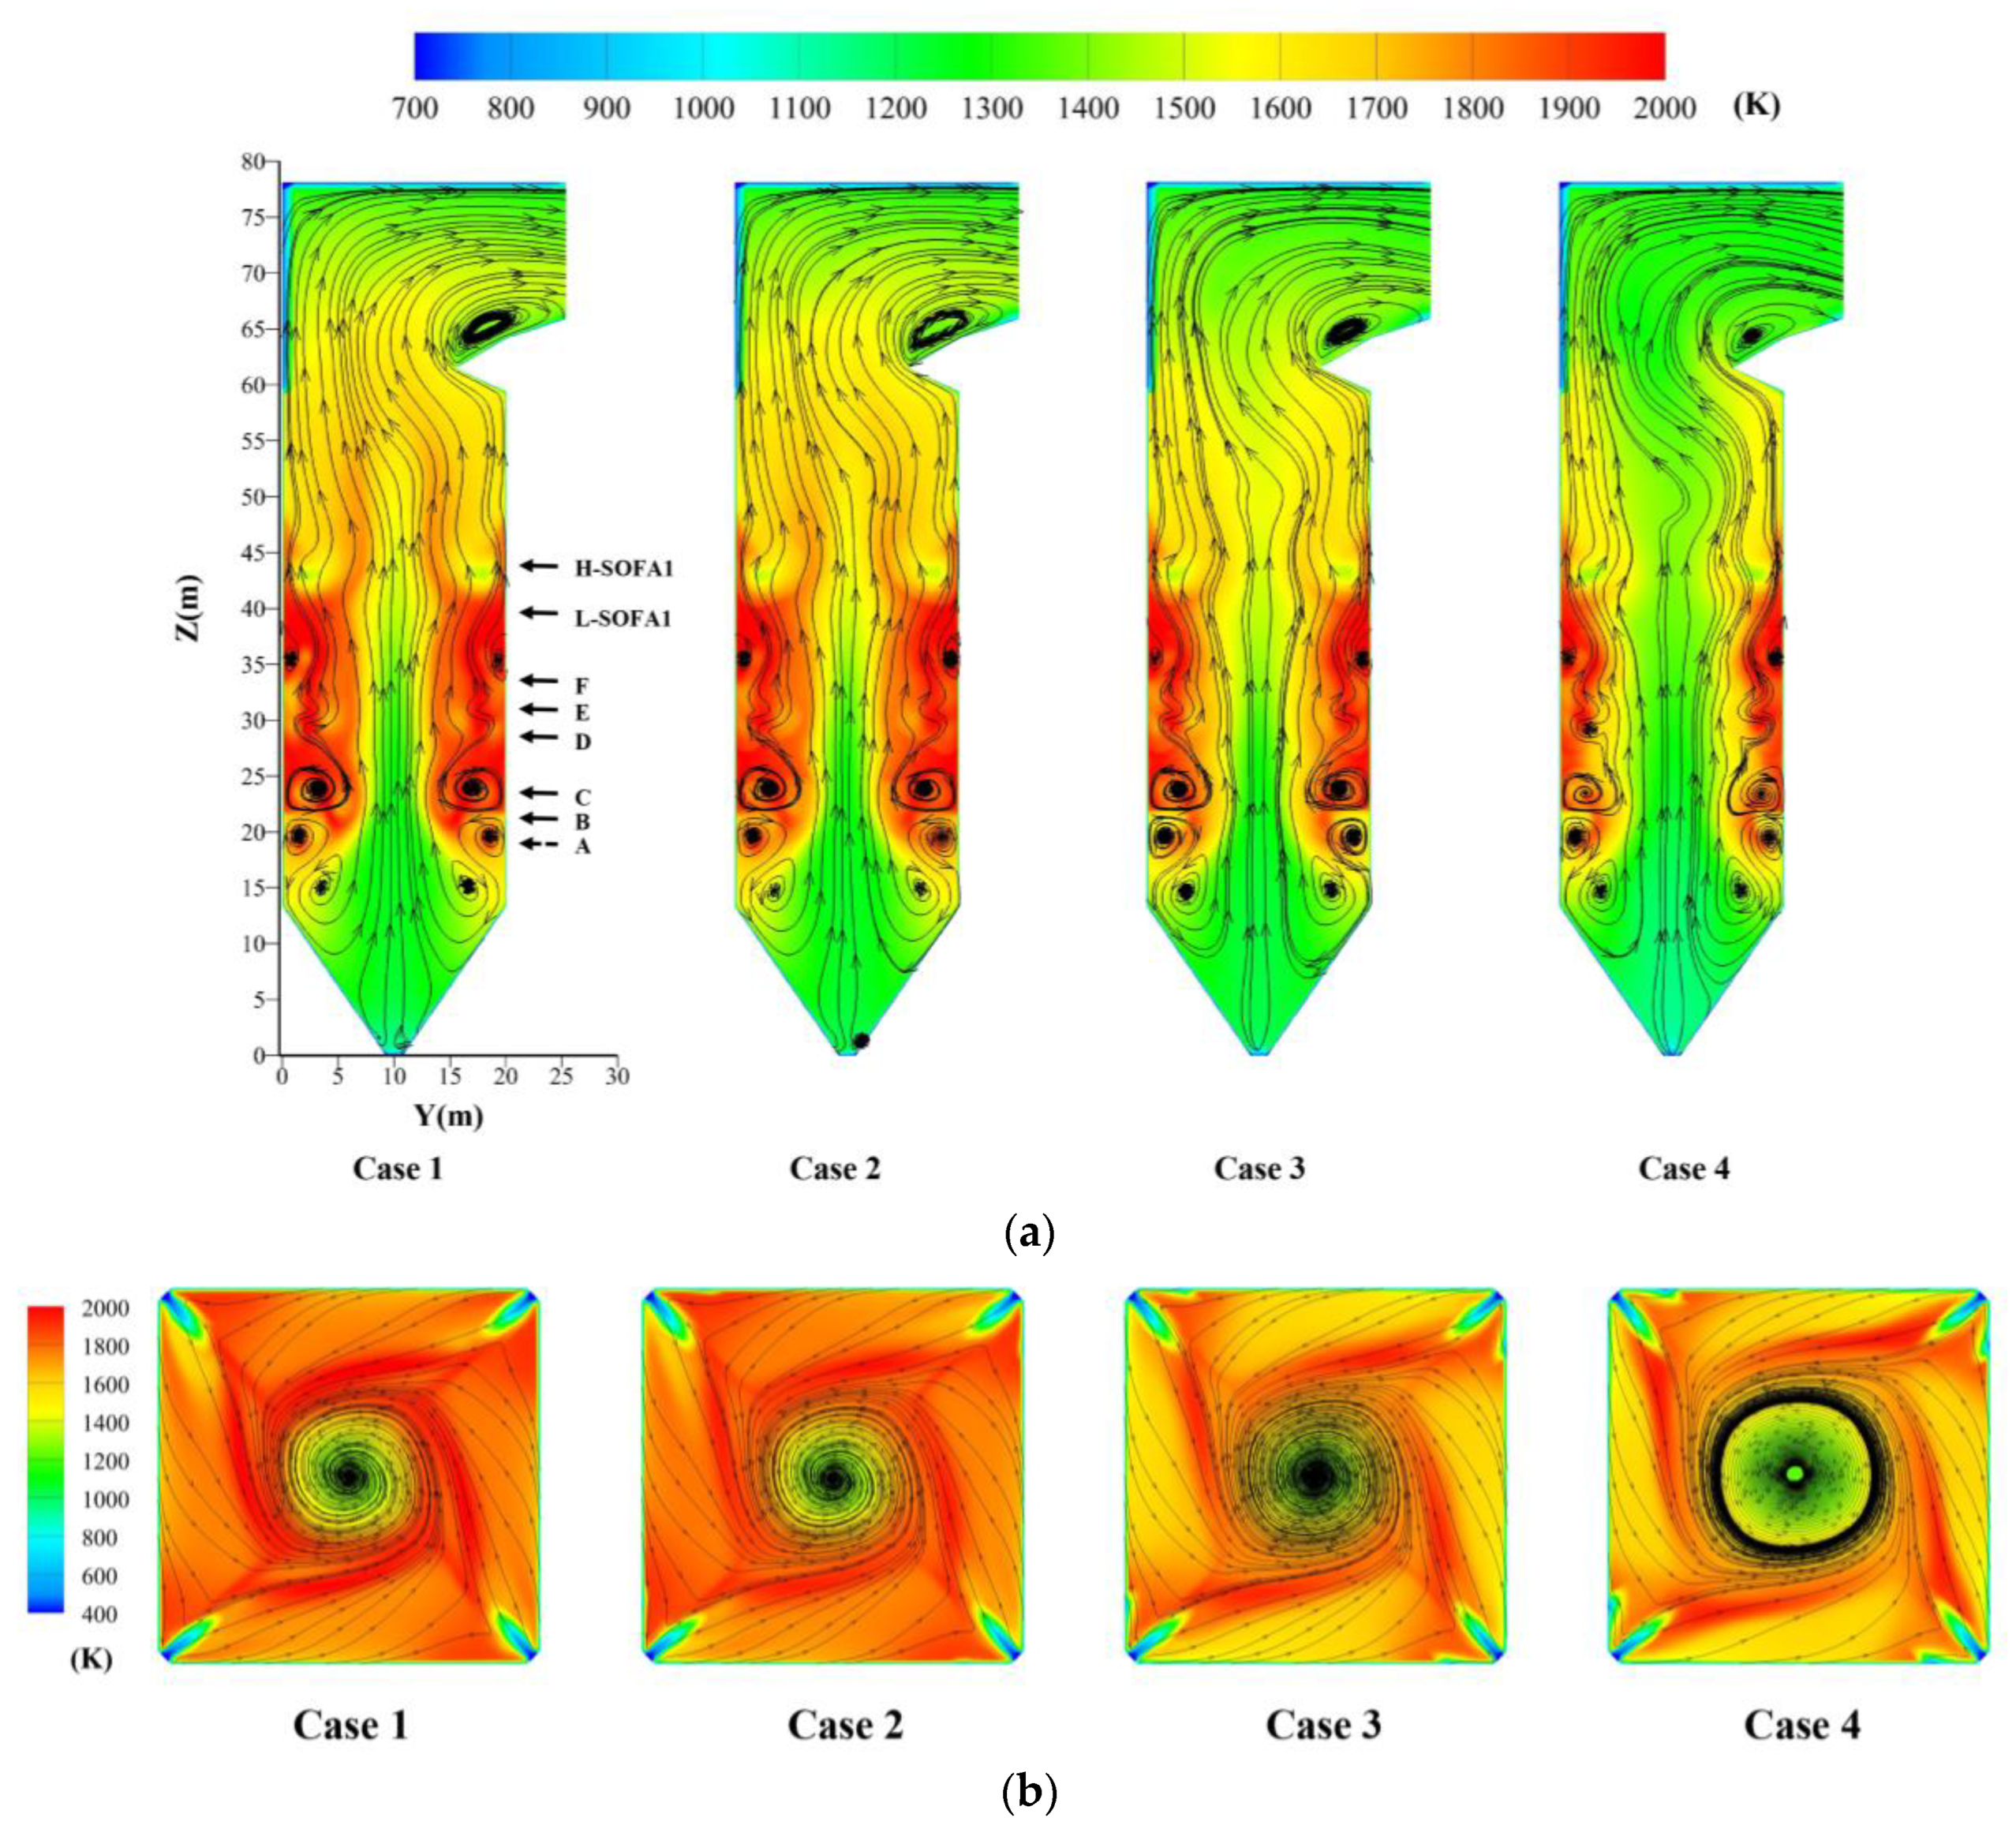
Figure 7.
The average temperature at different proportions of mixed hydrogen.

Figure 8.
(a) H2 distribution at the longitudinal section of the boiler; (b) H2 distribution in cross-section at burners in layer B.
Figure 8.
(a) H2 distribution at the longitudinal section of the boiler; (b) H2 distribution in cross-section at burners in layer B.
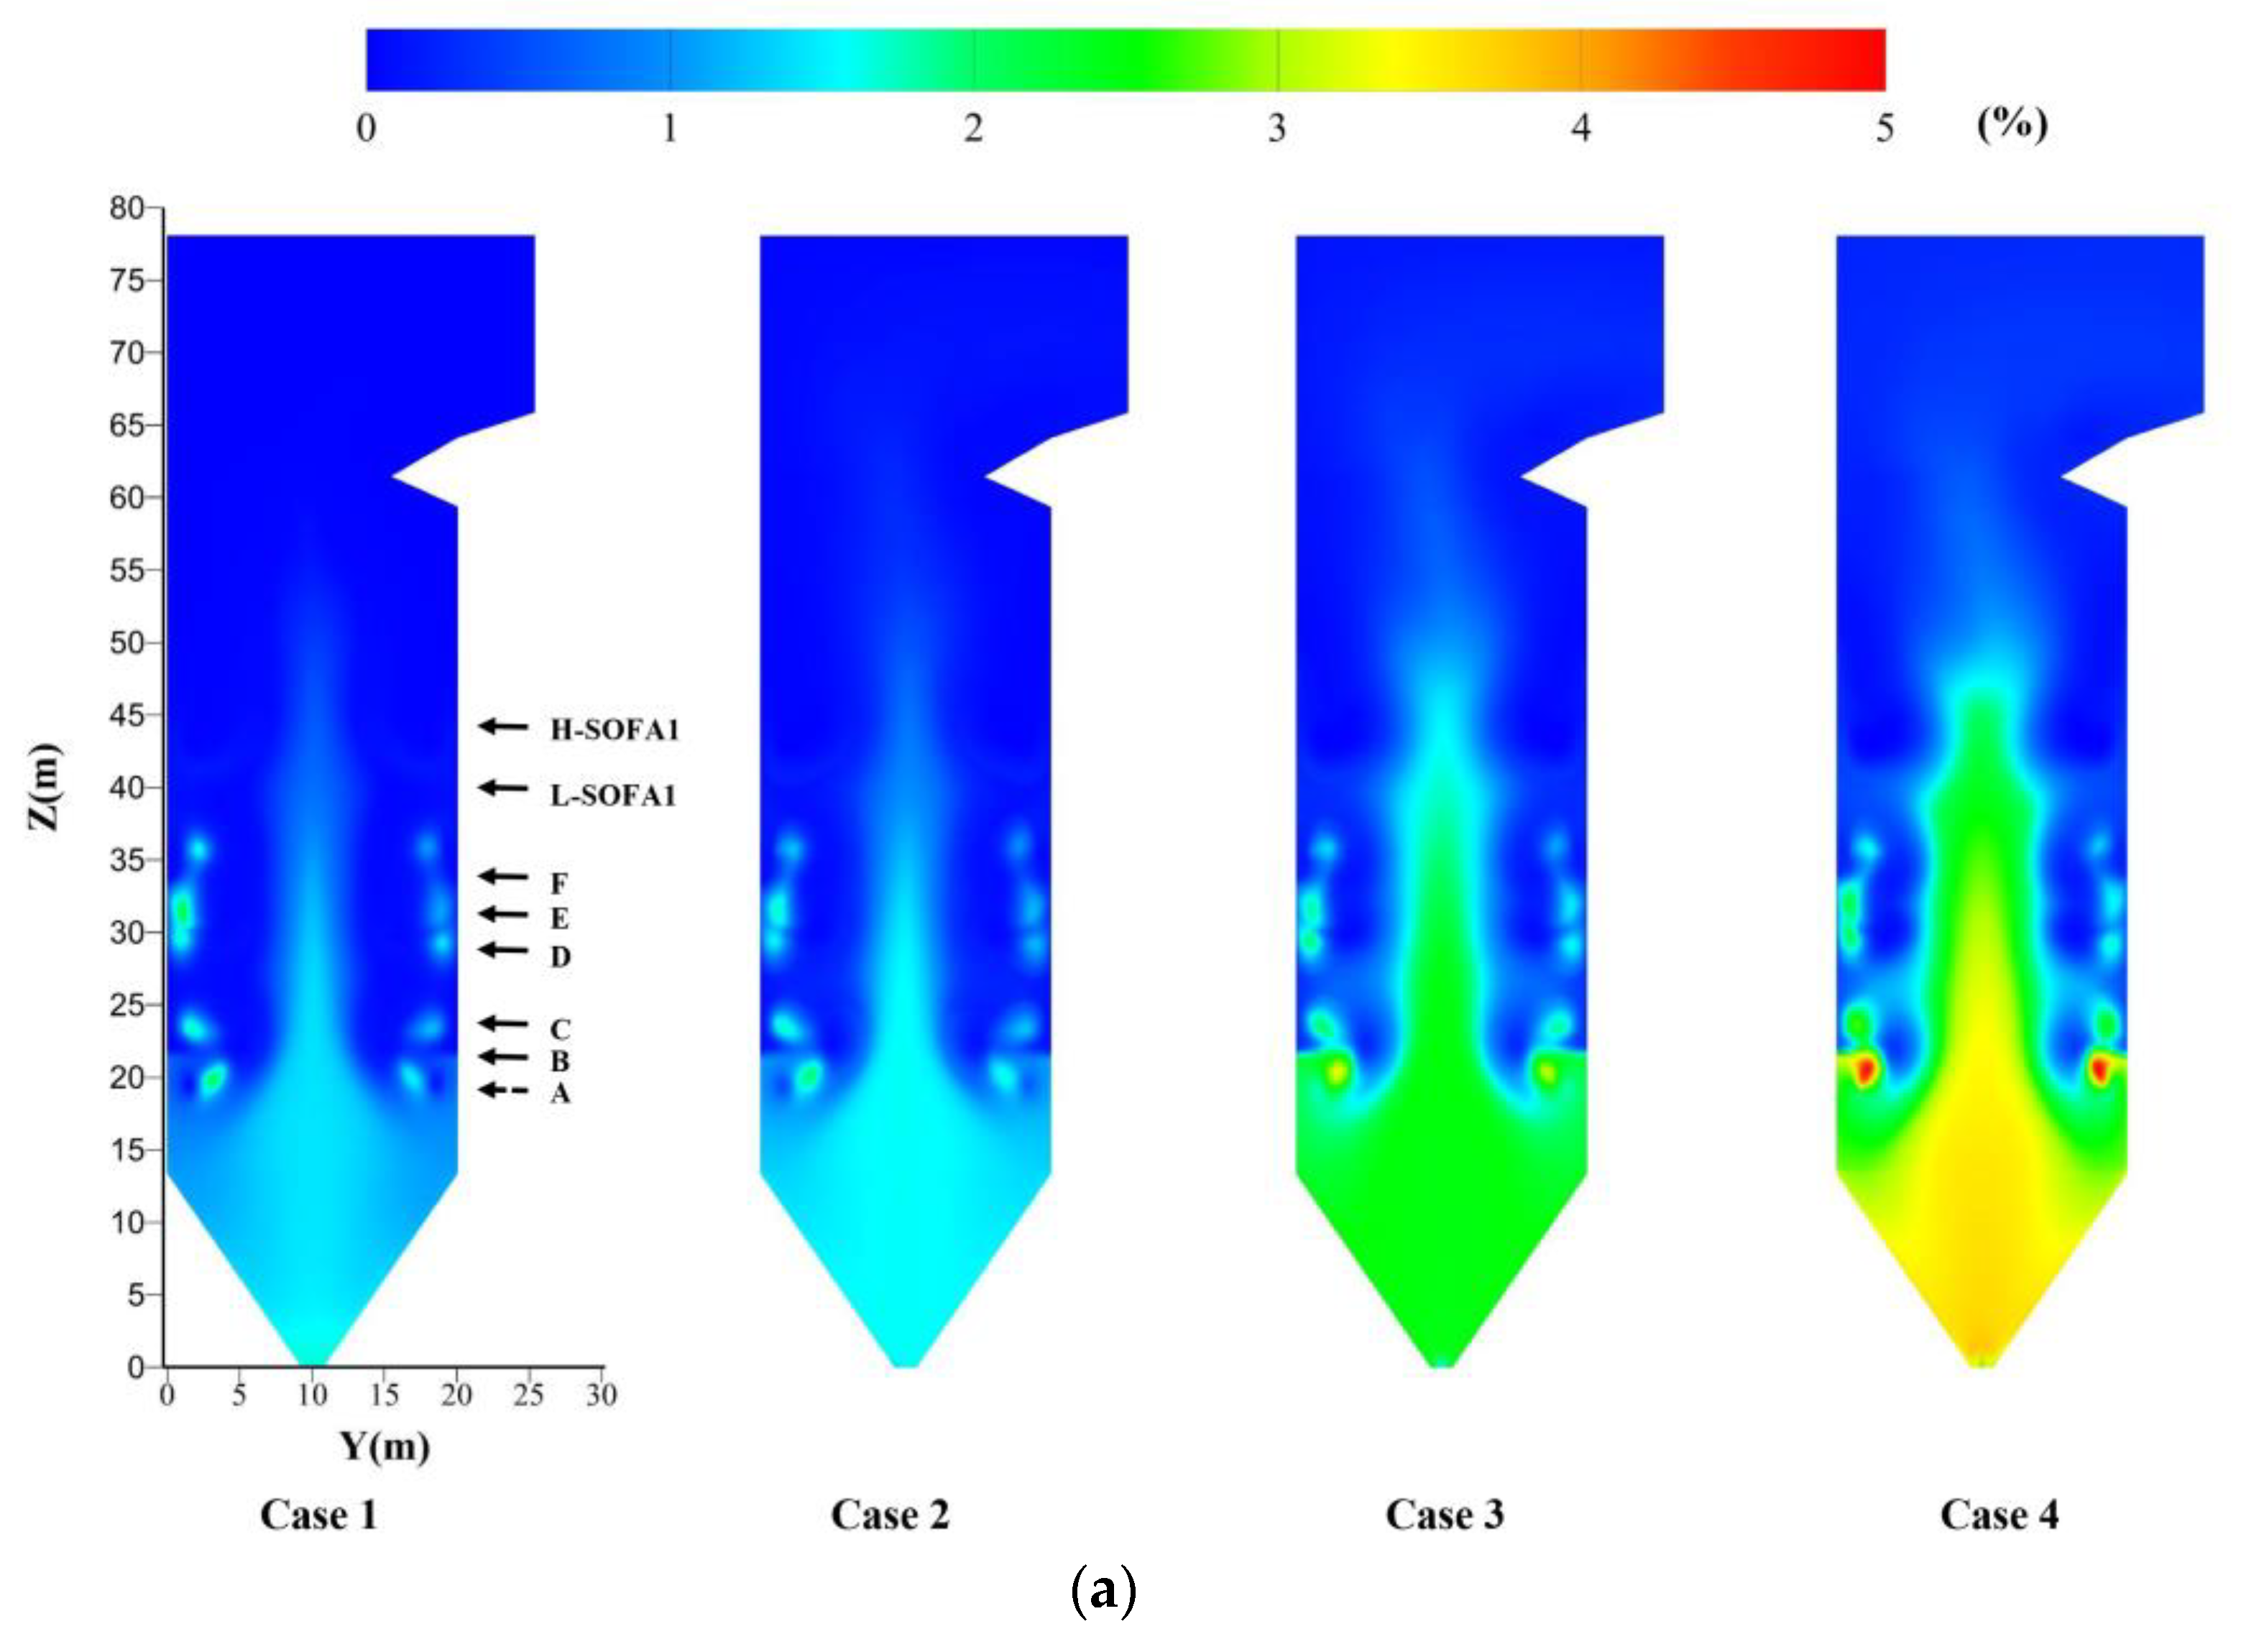
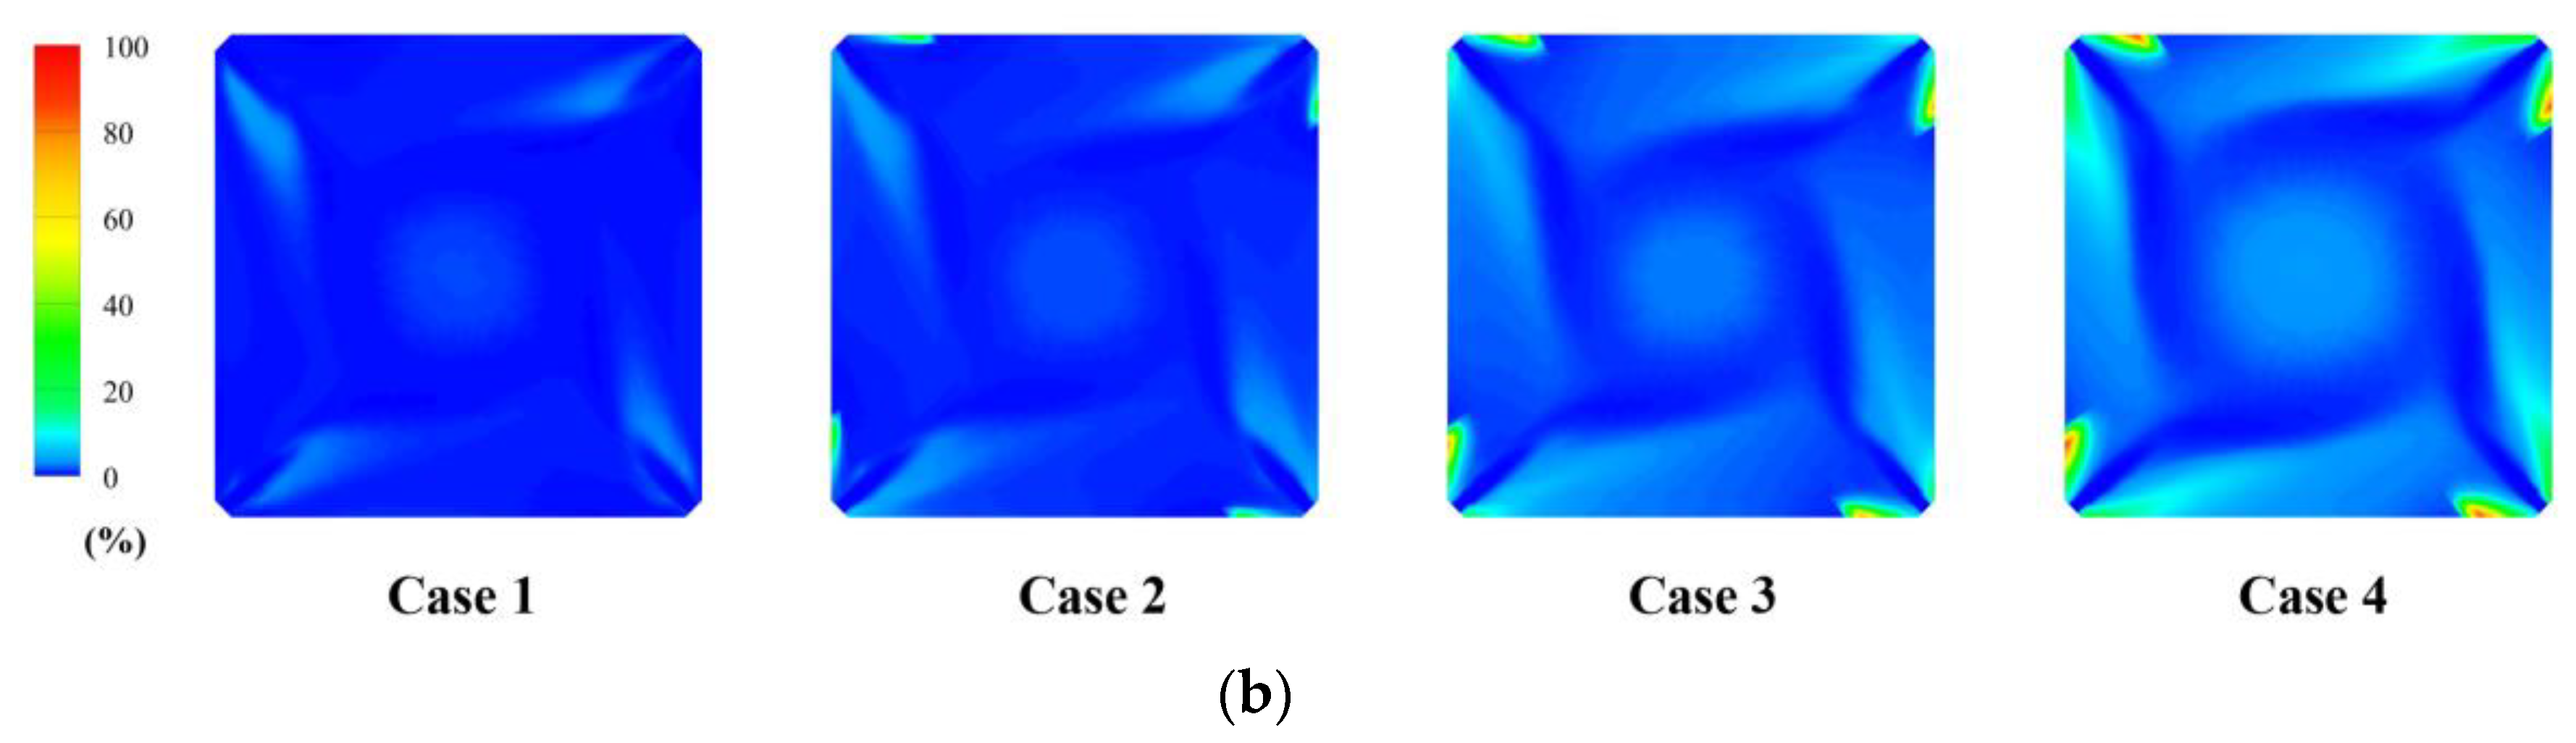
Figure 9.
The average H2 concentration at different proportions of mixed hydrogen.

Figure 10.
(a) O2 distribution at the longitudinal section; (b) CO distribution at the longitudinal section; (c) CO2 distribution at the longitudinal section; (d) H2O distribution at the longitudinal section.
Figure 10.
(a) O2 distribution at the longitudinal section; (b) CO distribution at the longitudinal section; (c) CO2 distribution at the longitudinal section; (d) H2O distribution at the longitudinal section.
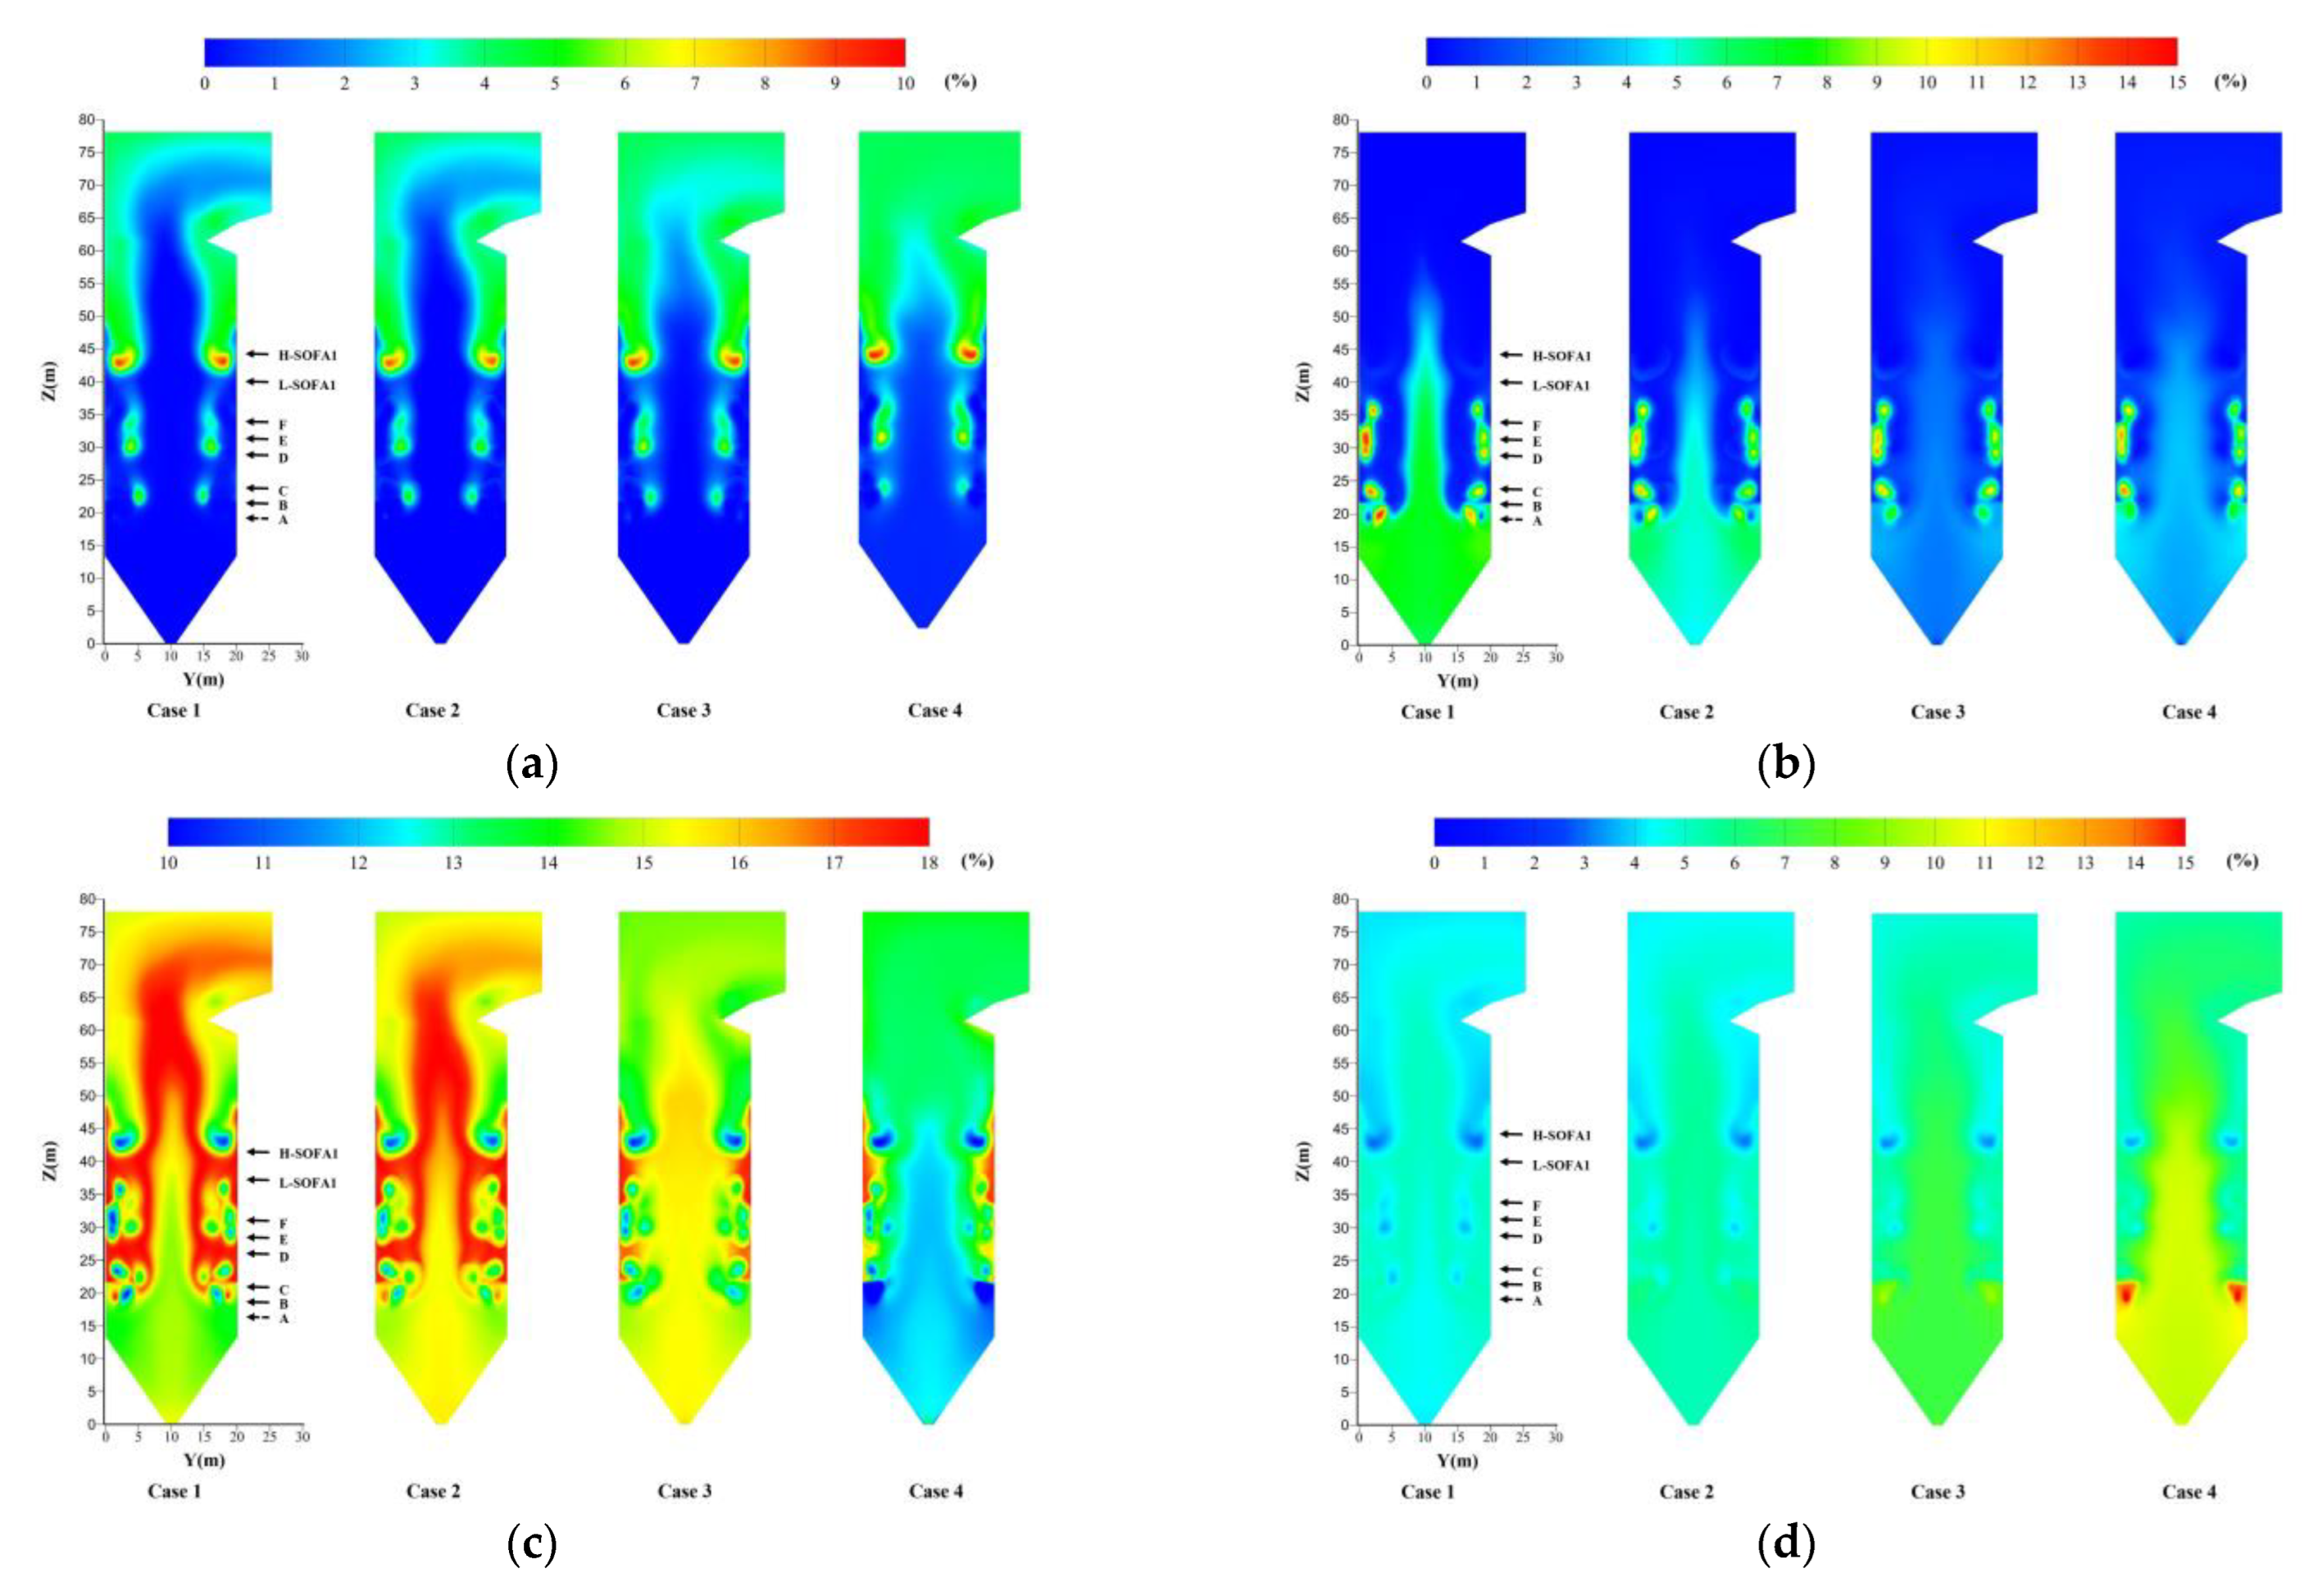
Figure 11.
The species distribution in cross-section at burners in layer B. (a) O2 distribution at the cross-section; (b) CO distribution at the cross-section; (c) CO2 distribution at the cross-section; (d) H2O distribution at the cross-section.
Figure 11.
The species distribution in cross-section at burners in layer B. (a) O2 distribution at the cross-section; (b) CO distribution at the cross-section; (c) CO2 distribution at the cross-section; (d) H2O distribution at the cross-section.
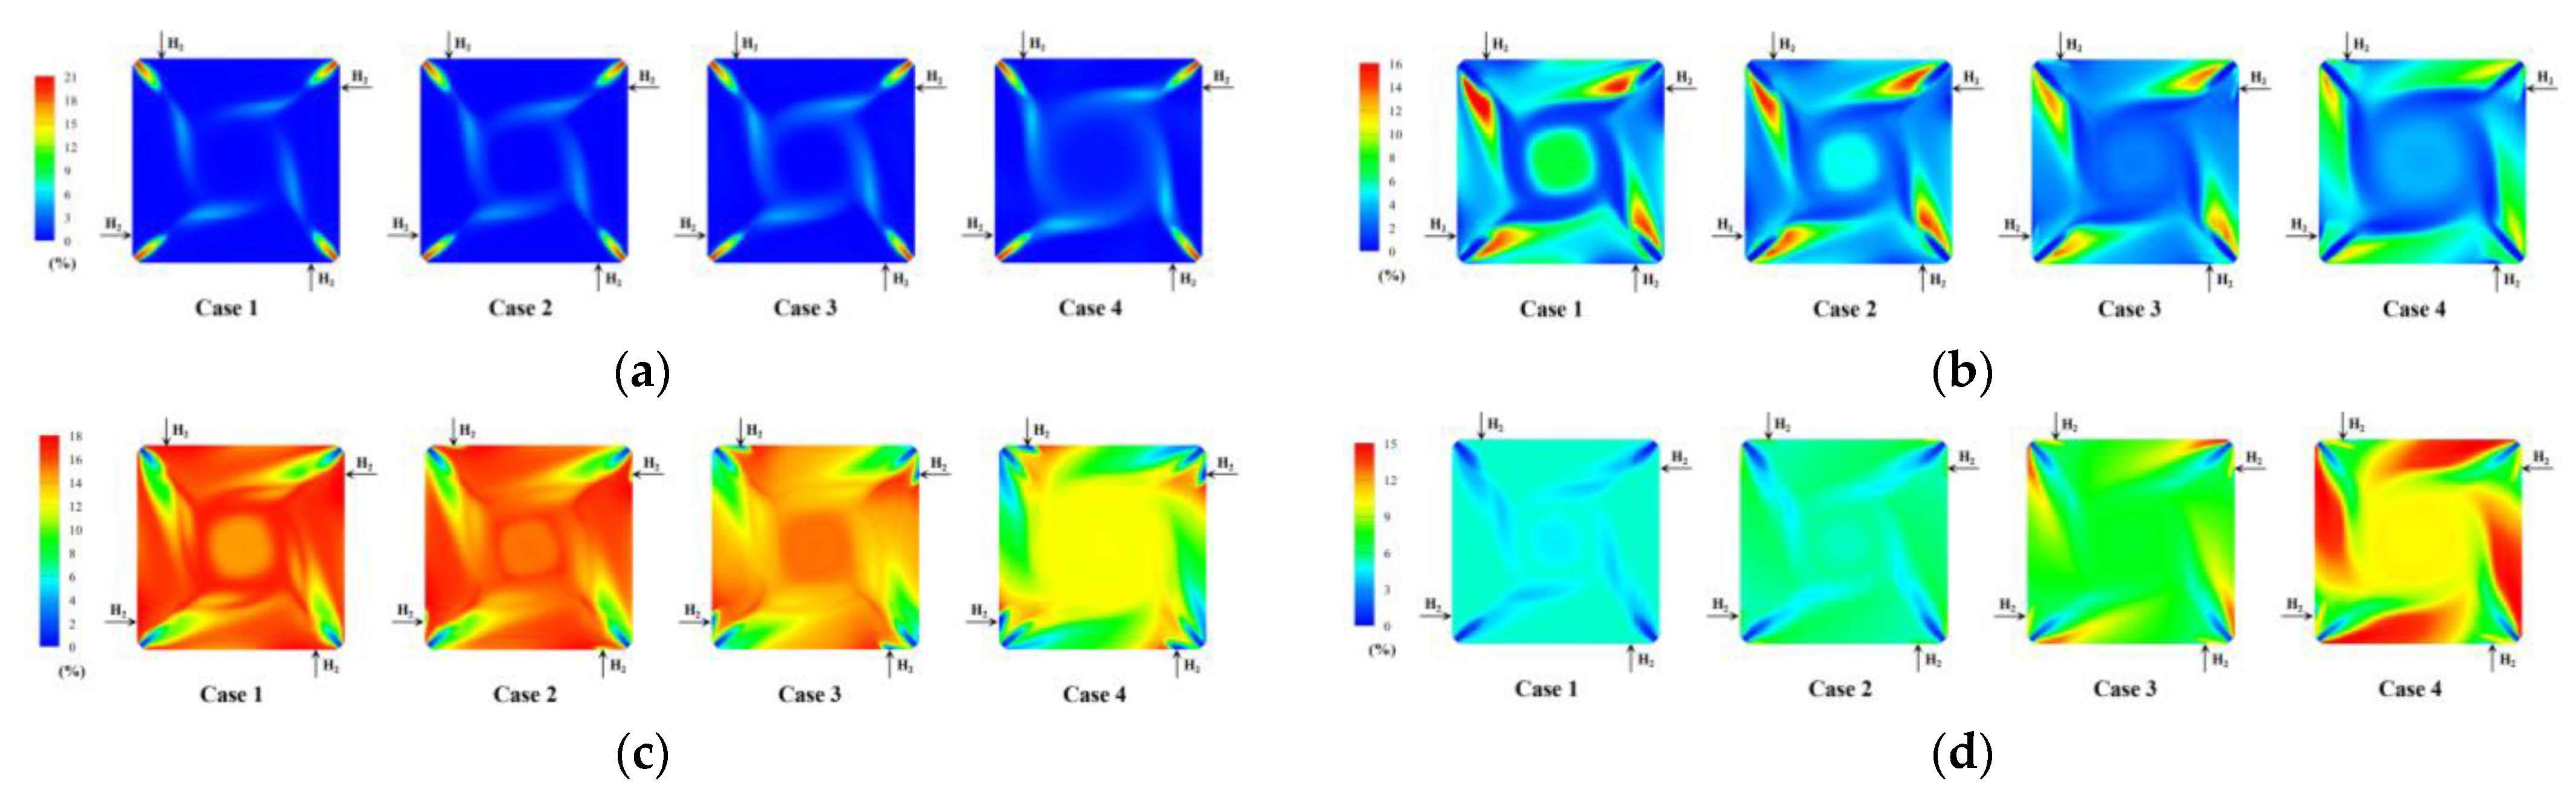
Figure 12.
The average species concentrations at different proportions of mixed hydrogen. (a) The average O2 concentration; (b) the average CO concentration; (c) the average CO2 concentration; (d) the average H2O concentration.
Figure 12.
The average species concentrations at different proportions of mixed hydrogen. (a) The average O2 concentration; (b) the average CO concentration; (c) the average CO2 concentration; (d) the average H2O concentration.

Figure 13.
The average CO+CO2 concentration at different proportions of mixed hydrogen.


Table 1.
Sample properties of the coal.
| Proximate (As received, wt%) | Ultimate (As received, wt%) | ||
|---|---|---|---|
| Moisture | 28.50–29.60 | C | 53.04–54.29 |
| Ash | 4.45–5.36 | H | 2.42–2.58 |
| Volatile | 19.69–20.30 | O | 8.00–9.17 |
| Fixed carbon | 46.45–45.65 | N | 0.55 |
| Net heating value (MJ/kg) | 18.40–19.42 | S | 0.72–0.77 |
Table 2.
Sample properties of the coal.
| Case Name | Case 1 | Case 2 | Case 3 | Case 4 |
|---|---|---|---|---|
| Total airflow (t/h) | 2406.05 | 2401.60 | 2383.81 | 2361.53 |
| Primary airflow (t/h) | 618.35 | 618.35 | 618.35 | 618.35 |
| Secondary airflow (t/h) | 1243.93 | 1239.48 | 1221.69 | 1199.41 |
| Over-fire air flow (t/h) | 543.77 | 543.77 | 543.77 | 543.77 |
| Total coal flow (t/h) | 305.46 | 302.41 | 290.19 | 274.91 |
| Hydrogen flow (t/h) | 0.00 | 0.40 | 1.97 | 3.95 |
| Primary air temperature (K) | 338.15 | 338.15 | 338.15 | 338.15 |
| Secondary air temperature (K) | 638.15 | 638.15 | 638.15 | 638.15 |
| Hydrogen temperature (K) | / | 300 | 300 | 300 |
| Hydrogen mixing ratio (%) | 0.00 | 1.00 | 5.00 | 10.00 |
| Excess air ratio | 1.20 | 1.20 | 1.20 | 1.20 |
| Layer of burner | B C D E F | B C D E F | B C D E F | B C D E F |
Table 3.
Verification of the simulation results.
| Parameter | Simulation | Design | Measurement | Relative Error |
|---|---|---|---|---|
| O2 (vol%) | 3.46 | 3.50 | / | −1.14% |
| CO2 (vol%) | 15.65 | 16.46 | / | −4.92% |
| Gas temperature (K) | 1591.61 | 1518.22 | / | 4.83% |
| Flue temperature (K) | 1142.43 | / | 1183.55 | −3.48% |
Disclaimer/Publisher’s Note: The statements, opinions and data contained in all publications are solely those of the individual author(s) and contributor(s) and not of MDPI and/or the editor(s). MDPI and/or the editor(s) disclaim responsibility for any injury to people or property resulting from any ideas, methods, instructions or products referred to in the content. |
© 2024 by the authors. Licensee MDPI, Basel, Switzerland. This article is an open access article distributed under the terms and conditions of the Creative Commons Attribution (CC BY) license (https://creativecommons.org/licenses/by/4.0/).
Share and Cite
MDPI and ACS Style
Dong, L.; Huang, S.; Qian, B.; Wang, K.; Gao, N.; Lin, X.; Shi, Z.; Lu, H. Numerical Simulation of Hydrogen–Coal Blending Combustion in a 660 MW Tangential Boiler. Processes 2024, 12, 415. https://doi.org/10.3390/pr12020415
AMA Style
Dong L, Huang S, Qian B, Wang K, Gao N, Lin X, Shi Z, Lu H. Numerical Simulation of Hydrogen–Coal Blending Combustion in a 660 MW Tangential Boiler. Processes. 2024; 12(2):415. https://doi.org/10.3390/pr12020415
Chicago/Turabian StyleDong, Lijiang, Shangwen Huang, Baiyun Qian, Kaike Wang, Ning Gao, Xiang Lin, Zeqi Shi, and Hao Lu. 2024. "Numerical Simulation of Hydrogen–Coal Blending Combustion in a 660 MW Tangential Boiler" Processes 12, no. 2: 415. https://doi.org/10.3390/pr12020415
Note that from the first issue of 2016, this journal uses article numbers instead of page numbers. See further details here.