Article

Measurement Method of Bar Unmanned Warehouse Area Based on Binocular Vision

1
National Engineering Research Center of Flat Rolling Equipment, University of Science and Technology Beijing, Beijing 100083, China
2
Shougang Research Institute of Technology, Beijing 100043, China
*
Author to whom correspondence should be addressed.
Processes 2024, 12(3), 466; https://doi.org/10.3390/pr12030466
Submission received: 17 January 2024 / Revised: 20 February 2024 / Accepted: 23 February 2024 / Published: 25 February 2024

Abstract

:
With the development of Industry 4.0 and the implementation of the 14th Five-Year Plan, intelligent manufacturing has become a significant trend in the steel industry, which can propel the steel industry toward a more intelligent, efficient, and sustainable direction. At present, the operation mode of unmanned warehouse area for slabs and coils has become relatively mature, while the positioning accuracy requirement of bars is getting more stringent because they are stacked in the warehouse area according to the stacking position and transferred by disk crane. Meanwhile, the traditional laser ranging and line scanning method cannot meet the demand for precise positioning of the whole bundle of bars. To deal with the problems above, this paper applies machine vision technology to the unmanned warehouse area of bars, proposing a binocular vision-based measurement method. On the one hand, a 3D reconstruction model with sub-pixel interpolation is established to improve the accuracy of 3D reconstruction in the warehouse area. On the other hand, a feature point matching algorithm based on motion trend constraint is established by means of multi-sensor data fusion, thus improving the accuracy of feature point matching. Finally, a high-precision unmanned 3D reconstruction of the bar stock area is completed.

1. Introduction

With the development of information technology such as the Internet of Things and artificial intelligence, the steel industry is transforming into a smart manufacturing model with the smart factory as the carrier as well as the intelligence of key manufacturing as the core and is based on end-to-end data flow and supported by NetCom interconnection technology. At present, unmanned warehouse areas have become a very representative and important technology for smart factories. As the main lifting execution unit in the unmanned warehouse area, the unmanned crane accurately identifies the position of the crane and the location of materials in the warehouse through the crane and material automatic positioning system. Then, the material can be accurately lifted and moved under unmanned conditions. Therefore, the intelligent automatic positioning system for cranes and materials is the basis for realizing unmanned cranes and warehouse areas, which directly affects the operational accuracy of unmanned warehouse areas.
The positioning of the crane in the bar unmanned warehouse area mainly relies on the Gray bus and the data feedback in real-time to the dispatching system through the PLC, which is able to pinpoint the crane during the movement. In terms of material positioning in the warehouse area, unlike the steel coil warehouse area, where each steel coil can be located precisely through the fixed saddle, the bars in the warehouse area are tightly stacked on a large scale. Therefore, the precise positioning of each bundle of bar is vital during the lifting process. The traditional bar warehouse area uses laser ranging and line scanning to locate the material, but this method can only obtain 2D contour information of the material in the warehouse area, and the lack of information in one dimension along the width of the stack leads to incomplete measurement of the stack contour information. As the steel materials in the bar unmanned warehouse area are stored in large quantities and close piles, the above material positioning method often leads to accidents such as the material falling due to the lack of suction force caused by the inaccurate disk position, the disk crane being destroyed due to the exceeding number of bundles, the stack collapsing during the palletizing and so on. Therefore, in order to solve the above problems, it is necessary to use a more accurate method to realize the precise positioning of the material in the bar unmanned warehouse area.
Therefore, in order to solve the above problems, this paper introduces machine vision technology into the bar unmanned warehouse area and puts forward a binocular vision detection method. On the basis of the subpixel interpolation stereo matching algorithm, the IMU and camera information fusion method are used to improve the matching accuracy of visual feature points and, finally, complete the 3D reconstruction of the bar unmanned warehouse area.

2. Literature Review

In recent years, with the development of machine vision technology, binocular vision-based inspection technology and applications have been widely used in various fields [1,2,3,4,5]. Simultaneous Localization and Mapping (SLAM) [6] based on binocular vision has undergone rapid development, too, which has attracted extensive attention from researchers.
Early researchers divided SLAM into visual SLAM and LIDAR SLAM according to the different types of sensors used in SLAM technology, such as cameras and LIDAR [7]. Davision [8] constructed the first monocular vision SLAM system framework, MonoSLAM, using sparse feature point-based vision front-end tracking and using the current frame pose of the monocular camera and observed feature point information as back-end optimization variables. Subsequently, Klein [9] proposed PTAM, which uses two separate tasks for parallel processing of split tracking and mapping while introducing the keyframe mechanism to reduce the system computation, but it has problems such as small detection scenes and easy loss of front-end target tracking. In order to solve the problem of SLAM being insensitive to features, feature extraction and matching are used to ensure the accuracy of pose estimation in SLAM tracking. Mur-Artal [10,11] proposed the ORB-SLAM and ORB-SLAM2 systems, which ensure the consistency of movement trajectories and constructed maps by tracking targets and constructing maps. Then, the LSD-SLAM system proposed by Engle [12] bit-pose estimation in the visual front-end by constructing image gradient-based wayfinding points. In order to overcome the problem of front-end feature point tracking failure caused by environmental factors during camera movement.
In recent years, Visual SLAM algorithms have witnessed significant advancements and demonstrated stable and robust operation across various scenarios. However, challenges arise when low-quality images result from fast camera movements and varying light conditions, limiting the effectiveness of current visual sensors [13]. To address this, researchers have explored composite SLAM approaches such as VINS (IMU + visual) and RTAB-MAP (LIDAR + visual). IMU sensors offer superior angular velocity measurement accuracy and local position measurement accuracy compared to odometers. The IMU can capture clear images of dynamic objects during fast camera movements, and the camera can correct cumulative errors generated by the IMU during slow speeds [14]. The synergistic combination of the two significantly enhances SLAM performance.
Furthermore, due to the affordability and ease of use of vision and IMU sensors, an increasing number of scholars are directing their attention towards them [15]. Presently, visual-inertial fusion methods can be categorized into tight coupling and loose coupling based on whether image feature information is incorporated into the state vector [16]. In loose coupling, the IMU and camera independently estimate their motion and then fuse their pose estimates. In contrast, tight coupling involves initially fusing IMU and camera states, then jointly constructing motion and observation equations, and finally performing state estimation [17]. OKVIS was proposed by [18,19] Leutenegger, which uses the IMU measurement error and the visual reprojection error to construct the objective function, and uses the graph optimization method to solve the objective and finally obtain the state volume to be estimated, and the experimental results show that the system has higher accuracy compared with the filter-based method.
With the development of SLAM technology, SLAM based on binocular vision has gradually been widely used in various fields. Li [20] used multi-channel fusion SLAM technology for road detection and positioning. Pai [21] used SLAM technology to build a 2D map and complete path planning. Shao [22] applied semantic SLAM to autonomous indoor parking and achieved great results. Yan [23] presented a state-of-the-art real-time localization and mapping system by SLAM to achieve precise pose estimation and dense (3D) point cloud mapping in complex greenhouses.
Compared with the bar unmanned warehouse area, the above SLAM application research environment is better, which means the graphic texture and feature points are clear and easy to detect, so it has achieved good application results. In the bar unmanned warehouse area, the bar as the detection target is characterized by too much texture and a large number of repetitive textures, which leads to a large number of false matches in feature point detection. Therefore, in order to solve this problem, this paper, on the basis of the above research, adopts the feature point matching algorithm based on motion trend constraint to complete the inter-frame feature point matching and uses the point cloud splicing algorithm to finally get the accurate 3D position information of the bar unmanned warehouse area, which provides the basis for the crane lifting. The field application shows that this system can realize the synchronous positioning and map construction of unmanned bar warehouse areas and provide an effective location basis for crane lifting, which has good application prospects.

3. 3D Dimensional Measurement of Stack Based on Binocular Vision

3.1. Binocular Camera Joint Calibration

The joint calibration of binocular cameras is based on the completion of calibration of both the left and right cameras separately. The process of binocular camera calibration is as follows. Firstly, assume that there is a feature point P on the checkerboard whose coordinate under the world coordinate system is Pw. The coordinate would be recorded by the left and right cameras as P L = [ X L , Y L , Z L ] T , P R = [ X R , Y R , Z R ] T , respectively, and the expression of the point P in the imaging model of the left and right cameras can be found in Equation (1) as follows:
{ P L = R L P W + T L P R = R R P W + T R
By establishing a binocular stereo vision reference coordinate system with the left camera coordinate system as the origin, the expression can be obtained as:
P R = R P L + T
Combining Equations (1) and (2) yields the coordinate system conversion relationship between the binocular cameras as:
{ R = R R R L 1 T = T R R R R L 1 T L

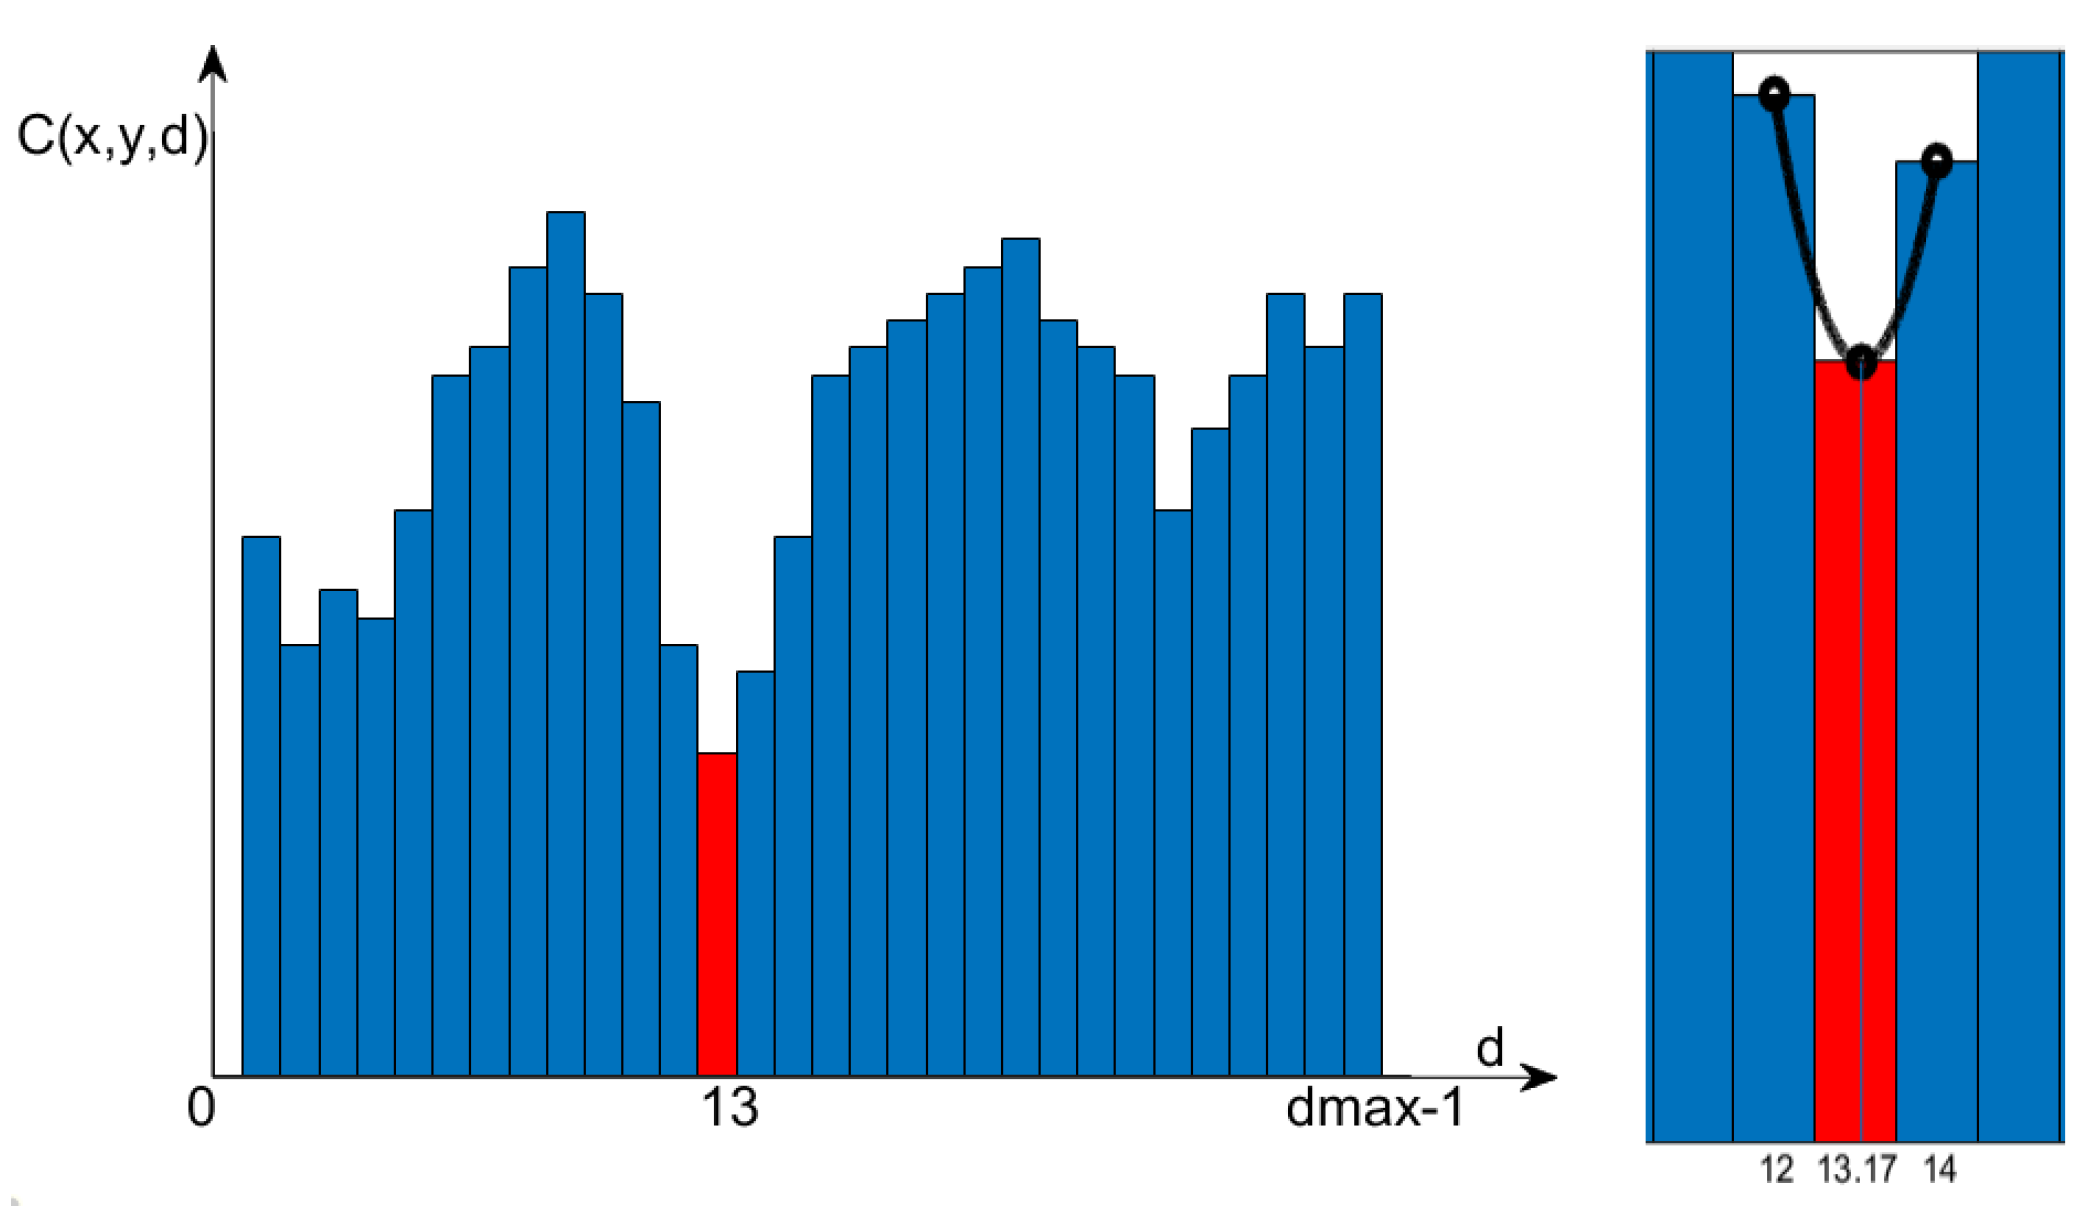
3.2. Stereo Matching Algorithm Based on Sub-Pixel Interpolation

During the 3D reconstruction process, the pixel-level parallax is incapable of adapting to the space that the depth changes continuously, especially in the scene with a large inclination or a curved surface, and therefore cannot be applied to the 3D dimensional measurement of bar stacks. Therefore, the accuracy of the stereo matching algorithm needs to be improved from pixel level to sub-pixel level to make the parallax of the measurement surface in a natural smooth transition. The sub-pixel accuracy parallax value can be obtained by curve fitting, which utilizes the neighboring parallax values and the cost values of the best parallax value, measured by WTA in the cost space, as supplementary information to calculate, as shown in Figure 1.
For any pixel point (x, y), a quadratic curve can be fitted by extracting three sets of data corresponding to it, which are (dmin−1, C(x, y, dmin−)), (dmin, C(x, y, dmin)), (dmin+1, C(x, y, dmin+)). The extreme point of the fitted curve reveals the best sub-pixel difference for that pixel point, and the expression is
d * = d min C ( x , y , d min + ) C ( x , y , d min ) 2 ( C ( x , y , d min + ) + C ( x , y , d min ) 2 C ( x , y , d min ) )
where dmin is the best parallax obtained by WTA in the cost space; C(x, y, dmin) is the best parallax corresponding to the pixel point (x, y); (dmin−1, C(x, y, dmin−)), (dmin+1, C(x, y, dmin+)) are the corresponding parallax at the same pixel of the best parallax; d* is the sub-pixel precision parallax calculated through the parallax post-processing process.
In order to obtain more accurate subpixel-level parallax values, this paper uses a high interpolation method based on the cost space, as shown in Figure 2.
It reconstructs the cost space C0 based on the initial parallax map D0, then utilizes bilateral filtering on the cost space to smooth the image as well as to keep its edge features for the purpose of dealing with the abrupt changes in the depth change region, to obtain the cost space C i C W , and extracts the data needed for Equation (4) from the newly generated cost space, applies subpixel interpolation to updates the new depth estimates, and at last feeds them back into the process until the final parallax map comes out.
The expression for constructing the cost space based on the initial parallax map is:
C ( i ) ( x , y , d ) = min ( η L , ( d D ( i ) ( x , y ) ) 2 )
where L is the search for parallax levels range; d is the candidate parallax; D ( i ) ( x , y ) is the parallax corresponding to the L level; η is the scaling coefficient while dividing the parallax levels.
As shown in Figure 3, the sub-pixel parallax 3D reconstruction result is verified according to the actual collected images in the warehouse area. Due to the stratification caused by the discontinuous depth of the pixel-level parallax 3D reconstruction, it could not be applied to the region where the depth changes continuously. The 3D reconstructed image becomes obviously smooth after the sub-pixel parallax post-processing, which, to a certain extent, solves the inapplicability of binocular vision measurement to the region with continuously changing depth of large field of view.
The method in this paper is also compared with SGBM [24] and CSCA [25] methods, as shown in Table 1, to verify that the measurement obtained by this method has a significant accuracy advantage under the long-range measurement conditions.

4. Vision-Based Multi-Bit Pose Measurement Technology for Bar Warehouse Area

Due to the large measurement range in the metallurgical warehouse area, the partial 3D information measured from a fixed viewpoint cannot meet the demand for 3D point cloud reconstruction of the stack surface in the bar warehouse area of a large field of view. Therefore, the motion structure is used, which is to extract and match the feature points between adjacent images to solve the spatial transformation relationship and to add the newly collected point cloud information to the original one to obtain the final field point cloud information under a larger detection range. Take the feature detection of adjacent two frames in the image sequence, and the matching to obtain correlation information as the prerequisite and foundation for the realization of visual front-end tracking, then the number of correlation information obtained and the rate of correct matching would affect the accuracy of detecting the carrier pose as well as motion state. With the research and development of computer vision, some algorithms of feature point detection that can adapt to different environments and can perform well under various working conditions have been gradually derived, such as SIFT [26], SURF [27], ORB [28], etc.

4.1. Bar Warehouse Area Feature Point Detection

It is because the texture on the surface of the bars has a complex structure and repeats too much, and there are labels bound on the side of the bars that distinguish their specifications and material numbers, which makes the feature measurement and matching process more difficult. In order to verify and compare the measurement effect of several feature point measurement algorithms in terms of bar images, the images of the side and top surface of the stack in the bar warehouse area were collected and measured, and the measurement result of each algorithm is shown in Figure 4.
Among the measurement results of the above three feature point measurement algorithms on the side surface of the bar stack, the SIFT obtains the largest number of feature points. In terms of the measurement on the top surface, the number of feature points measured is obviously sparse due to the long measurement distance (about 10 m). Thus, the three feature measurements obtain a comparable number of feature points, while the ORB spends the shortest time. The results of these feature measurement algorithms are shown in Table 2.

4.2. Feature Point Matching Algorithm Based on Motion Trend Constraint

In order to complete the overall 3D reconstruction of the warehouse area, it is necessary to match the feature points of the two adjacent frames collected by the moving camera. During the initial matching process, the matching point pairs are usually filtered by setting the Hamming distance. Assume that the binary descriptors of feature point A and feature point B are D(A) and D(B), respectively, then the Hamming distance between them is defined as:
H ( A , B ) = i = 1 N δ ( D ( A ) i D ( B ) i )
where δ( ) is an indicator function, which is 1 when the conditions in the brackets are true (otherwise, it is 0). Equation (6) means that for each binary bit, if A and B have different values at that position, increase the Hamming distance by 1. In feature point matching, the feature point pair with a smaller Hamming distance is usually selected as the matching point because a smaller Hamming distance indicates that the two binary descriptors are more similar.
However, lots of mismatches are generated due to a large number of similar or repeated textures in the images. As shown in Figure 5, a great number of false matches can be seen in the images, which are generated through the three feature detection algorithms, respectively.
Any mismatch would lead to calculation errors in the position and posture of the adjacent images. Thus, in order to eliminate the mismatch and to take the long measurement distance in the metallurgical warehouse area as well as the large amount of repetitive texture information in the bar stack into consideration, a feature point mismatch elimination strategy combining RANSAC algorithm and motion constraints is designed.
The RANSAC algorithm, in an iterative manner, is applied to estimate the optimal homography matrix H from a set of observation data, including outliers, and then to preliminarily reject the mismatched pairs of points from the matched images. Its expression Es for constructing the optimal solution function is:
E s = arg min ( i = 1 n ( ( x i h 11 x i + h 12 y i + h 13 h 31 x i + h 32 y i + h 33 ) 2 + ( y i h 21 x i + h 22 y i + h 23 h 31 x i + h 32 y i + h 33 ) 2 ) )
For images of bar stacks that have repetitive textures, the RANSAC algorithm can only reject a small number of mismatched feature points. Due to the strong correlation between feature point matching and vision system pose transformation, the inertial measurement module (IMU) is used to solve the value of vision system pose transformation in real-time. However, the error would increase non-linearly over long periods of operation because of the zero point offset and the accumulated error. In this paper, the binocular camera and IMU are combined to form an inertial vision navigation system, and then the inertial information and visual information could be mutually complementary to reduce the limitations of single sensor detection and, therefore, the reliability of the whole system could be improved. The system adopts a strap-down carrying mode and realizes the inertial navigation function with the help of a computer. The structure of the inertial vision navigation system is shown in Figure 6.
The inertial measurement module mainly consists of an accelerometer and gyroscope. It obtains the structural motion trend through the two modules, supplements the camera dynamic information, and uses the structural motion trend as a constraint to filter the feature points of the two frames of images. As shown in Figure 7, it is the feature point matching process based on motion trend constraints.
The specific steps are as follows:
  • System Calibration
During the measurement process, the IMU sensor might generate zero offset, Gaussian white noise, and random noise due to factors such as internal mechanical and temperature changes. Therefore, the optimal value should be obtained after calibration compensation and back-end optimization.
First, the calibration coefficient is obtained through joint calibration of the camera and IMU. This joint calibration uses the caliber [29] method to obtain the system parameters. This method calculates the calibration data by minimizing the objective function (Equation (8)).
n = 1 N m = 1 M J n m J ( T c , i , T g , i , g ω , d , b a ( t ) , b g ( t ) , η a ( t ) , η g ( t ) )
where N is the number of calibration images; M is the number of landmarks; T c , i is the transformation between the camera and the IMU; T g , i is the pose of the IMU; gw is the gravity direction; d is the offset between camera time and IMU time; a ˜ ( t ) , w ˜ ( t ) are measurements of the accelerometer and gyroscope; a ( t ) , w ( t ) are real values of the accelerometer and gyroscope; b a ( t ) , b g ( t ) are zero offsets of the accelerometer and gyroscope; η a ( t ) , η g ( t ) are gaussian white noises.
2.
Establish an IMU measurement model.
The joint calibration coefficients are obtained through the joint calibration of the camera and IMU, and the measurement model of the inertial model is established according to the calibration coefficients as follows.
a ˜ ( t ) = a ( t ) + b a ( t ) + η a ( t )
w ˜ ( t ) = w ( t ) + b g ( t ) + η g ( t )
3.
Establish IMU kinematics model.
After obtaining the measurements from the accelerometer and gyroscope of the inertial module, the IMU kinematic model could be used to calculate the spatial position transformation in the interval [ t , t + Δ t ] , and the calculation model can be expressed as:
{ R ( t + Δ t ) = R ( t ) E x p ( ( w ˜ ( t ) b g ( t ) η g d ( t ) ) Δ t ) v ( t + Δ t ) = v ( t ) + g Δ t + R ( t ) ( a ˜ ( t ) b a ( t ) η a d ( t ) ) Δ t p ( t + Δ t ) = p ( t ) + v ( t ) Δ t + 1 2 g Δ t 2 + 1 2 R ( t ) ( a ˜ ( t ) b a ( t ) η a d ( t ) ) Δ t 2
where R is the relative rotation angle, V is velocity, and P is the position.
4.
Eliminate mismatched feature points using the inertia model.
Equation (11) represents the spatial pose change of the system from moment t to t + Δt. Therefore, after the system calibration is completed, the relative rotation angle R, velocity V, and position P of the IMU carrier at the moment t + Δt can be calculated based on the moment t. R, V, and P is the motion constraint. The matched feature points are verified based on the calculated pose as follows:
F ( t + Δ t ) = f ( R , V , P ) F ( t )
where f ( ) is the state transition function. The feature point pairs that do not conform to Equation (12) are mismatched feature points that are different from the pose changes, and they are eliminated to retain the correctly matched feature points.
Finally, the precise matching of adjacent image feature points is completed through the above steps. As shown in Figure 8 and Figure 9, it is the matching result of feature points between adjacent images that are completely consistent under several algorithms.
According to the random consistent check results of several feature point detection methods under both side and top acquisition angles of the bar pile, it can be seen that all three feature detection methods fit the conformance. However, there are differences in the final results of the three feature detection algorithms, as shown in Table 3.
It is found that the three measurement methods could obtain enough matching point pairs on the side of the bar stack and are visually consistent, but in terms of shooting at the top of the stack, the SIFT method cannot obtain a sufficient number of correct matching pairs and thus cannot meet the demand for long-distance detection of the bar stack, while the ORB has the advantages on both the measurement speed and the number of matching point pairs obtained from the top, compared with the SURF. Therefore, this paper chooses the ORB feature point measurement methods hereinafter, as they are the most stable and accurate.

4.3. Bar Library Multi-Position Point Cloud Stitching Algorithm

In order to get the complete 3D position data of the warehouse area, the point cloud of each frame image needs to be stitched together. The ICP problem is constructed on the basis of the congruent matching point pairs between frames and the two sets of corresponding 3D points obtained by the spatial depth information calculated by the binocular vision detection system to solve the image stitching problem.
Construct the source image point cloud data P = { p 1 , p 2 p n } and the target image point cloud data Q = { q 1 , q 2 q n } , and the points in the two sets of data correspond to each other. To obtain an optimal Euclidean transformation R, t, which makes i , p i = R q i + t . By constructing the error term of a single point ei and the ensemble error term of the whole point cloud Ei, the least squares problem is constructed and then solved by using the SVD decomposition. The error term is defined as:
e i = p i ( R q i + t )
E i = min R , t 1 2 i = 1 n p i ( R q i + t ) 2 2
Define the center of mass p , q of the set of points P and Q as:
p = 1 n i = 1 n ( p i )
q = 1 n i = 1 n ( q i )
The error term is integrated and decomposed into three parts, as shown in Equation (17), where the first term is only related to the rotation matrix R, and after it is solved, t can be solved by making the second term zero.
E i = 1 2 i = 1 n p i R q i t p + R q + p R q 2 = 1 2 i = 1 n ( p i p R ( q q ) ) + ( p R q t ) 2 = 1 2 i = 1 n ( ( p i p R ( q q ) ) 2 + p R q t 2       + 2 ( p i p R ( q q ) ) T ( p R q t ) )
Combining Equations (15)–(17) yields the rotational error term in decentered coordinates p and q as
E R = 1 2 i = 1 n p R q 2 = t r ( R i = 1 n q p T )
Constructive the matrix W and conduct SVD decomposition to it. Additionally, solve the spatial rotation matrix R, combining which with the Equation (13). Then, the displacement vector t could be solved.
W = i = 1 n q p T = U V T
R = U V T
By the methods above, the images of the bar warehouse area are collected and point-cloud fused. The acquisition and point cloud fusion effect of the visual odometer image of multi-position is shown in Figure 10.
After the visual odometry solves the spatial transformation relationship of the camera at different locations, the 3D information of the target image could be added to the source image in an incremental way. As shown in Figure 10, two images acquired at different locations are stitched together by the point cloud and displayed in a differential color image. The two common imaging areas overlap partially in the stitched point cloud image, while the separate imaging areas of both the target image and the original image also remain. Therefore, a more complete scene and material pile point cloud information could be obtained.

5. Fields Test and Application

The measurement device was applied in the unmanned bar warehouse area in a factory to verify the measurement accuracy by means of 3D reconstruction of the bar stack. A binocular camera was set up on an unmanned crane, and continuous sequences of images of the warehouse area were collected with the movement of the crane, organizing into a sequence of 100 images from the images of the whole 35 m bar stack. Then, by fitting the visual coordinate system to the warehouse area coordinate system, the spatial information measurement results that are consistent with the crane laser scanning coordinate system were formed. Consequently, a complete 3D point cloud image of the stack surface was plotted (Figure 11).
In order to verify the reconstruction accuracy of the vision system, the 2D contour data of the stack was selected, which was collected by the vision system at the same position as the crane laser scanning. Additionally, the median of the redundant points of the splicing position was calculated, and the cubic polynomial interpolation method was used to no data points in the data post-processing stage to form the bar stack contour data with the same length of the crane laser scanning, and finally, the two sets of data were filtered. The comparison of the 2D contour of the stack measured by the vision system and the crane laser scanning system is shown in Figure 12.
Under the premise of using the crane laser scanning results as standard data, it can be found from Figure 12 that the binocular vision-based bar stack contour measurement method used in this paper can obtain bar stack contours that are relatively consistent, and the visual scanning results are in gully areas also perform well. Compared with the laser scanning results, the mean absolute error of the visual scanning result is 9.82 mm, the mean relative error is 0.26%, the maximum absolute error is 17.73 mm, and the maximum relative error is 0.47%. The scene of the bar warehouse area is large, and the above data shows that the reconstruction of the bar warehouse area based on binocular vision has high accuracy.
The reconstruction of warehouse areas based on binocular vision primarily addresses the dimensional deficiencies caused by the current laser scanning, which leads to lifting issues. It also establishes a data foundation for subsequent unmanned warehouse operations. Therefore, this paper compares the proposed method with the traditional laser scanning approach. With the premise of using crane laser scanning results as the reference data, the results are presented in Table 4.
From Table 4, it can be observed that the use of binocular vision in the unmanned warehouse for bar materials ensures synchronized positioning and map construction while maintaining the data accuracy of the original laser scanning method. Simultaneously, it enhances data dimensions, obtaining the 3D profile of stack positions, thereby improving the accuracy of overhead crane hoisting. Furthermore, the adoption of high-frequency surface scanning facilitates the capture of a greater number of data points in the warehouse map, meeting on-site application requirements and demonstrating promising practicality and value.

6. Conclusions

(1) In order to overcome the inadequacy of the existing contour detection methods of the stack in the bar warehouse area, a 3D dimension detection method of stack based on binocular vision and IMU is proposed. It obtains the 3D information of the stack position by constructing a three-dimensional point cloud image of the stack with a binocular camera to ensure the accurate positioning of the crane during lifting.
(2) A stereo matching algorithm based on subpixel interpolation is proposed to solve the interpolation using the neighboring parallax value and the corresponding surrogate value of the best parallax value, which is obtained by WTA in the cost space, as supplementary information, so as to improve the accuracy of 3D reconstruction. After verifying using the acquisition images of the warehouse area, it can be found that the images have been greatly improved compared with those before subpixel processing, which, to a certain extent, solves the adaptation problem of binocular vision detection applied in the continuous transformation region with a large field of view depth.
(3) In order to solve the feature point mismatching problem caused by the consistent texture in the warehouse area, a feature point matching algorithm based on the motion trend constraint is proposed; then, by solving the system positional change with IMU, the mismatched feature points are eliminated, and finally, the fused image of the warehouse area point cloud could be obtained.
(4) The field application results show that the binocular vision-based bar stacking measurement method proposed in this paper could reconstruct the three-dimensional image of the warehouse area and obtain the three-dimensional contour of the stack. Compared with the traditional detection method, it has a higher data dimension to improve the lifting accuracy, and it can meet the field demand in terms of processing speed as well as detection accuracy, which has good application value and promotion prospects.
(5) The system proposed in this paper changes the current situation of lack of laser scanning dimensions in the bar warehouse area, making the bar warehouse area more intelligent, helping to improve the work efficiency of steel enterprises, and providing a solid data foundation for automatic hoisting in bar unmanned warehouse areas.
(6) This paper realized a 3-D reconstruction of the bar unmanned warehouse area based on binocular vision and obtained certain research conclusions and results. However, further questions need to be solved in future work. For the problem of the impact of complex environmental factors in the bar warehouse area on system robustness, more in-depth research is needed, and sensors need to give full play to their respective advantages to achieve multi-information fusion 3-D reconstruction of the reservoir area.

Author Contributions

S.Y.: Conceptualization, Methodology, Formal Analysis, Writing—Original Draft. D.X.: Project administration, Funding acquisition, Writing—Review & Editing. H.Y.: Methodology, Software. Z.W.: Data curation. H.H.: Visualization. X.W.: Writing—Review & Editing. Q.Y.: Resources, Supervision. All authors have read and agreed to the published version of the manuscript.

Funding

This work was supported by the National Natural Science Foundation of China (Grant No. 62273032). The authors would like to acknowledge the financial support from the Royal Society with grant IEC\NSFC\211254.

Data Availability Statement

Data are contained within the article.

Conflicts of Interest

The authors declare no competing interests.

References

  1. Fang, J.; Xu, S.; Yang, Y.; Wang, Y. Localization and measurement method of continuous casting slab model based on binocular vision. Microw. Opt. Technol. Lett. 2020, 62, 53–59. [Google Scholar] [CrossRef]
  2. Niu, M.; Song, K.; Huang, L.; Wang, Q.; Yan, Y.; Meng, Q. Unsupervised saliency detection of rail surface defects using stereoscopic images. IEEE Trans. Ind. Inform. 2020, 17, 2271–2281. [Google Scholar] [CrossRef]
  3. Zhao, S.; Kang, F.; Li, J. Displacement monitoring for slope stability evaluation based on binocular vision systems. Optik 2018, 171, 658–671. [Google Scholar] [CrossRef]
  4. Shi, B.; Liu, Z.; Zhang, G. Online stereo vision measurement based on correction of sensor structural parameters. Opt. Express 2021, 29, 37987–38000. [Google Scholar] [CrossRef]
  5. Liu, L.; Cui, J.; Huan, Y.; Zou, Z.; Hu, X.; Zheng, L. A Design of Smart Unmanned Vending Machine for New Retail Based on Binocular Camera and Machine Vision. IEEE Consum. Electron. Mag. 2021, 11, 21–31. [Google Scholar] [CrossRef]
  6. Smith, R.C.; Cheeseman, P. On the representation and estimation of spatial uncertainty. Int. J. Robot. Res. 1986, 5, 56–68. [Google Scholar] [CrossRef]
  7. Bresson, G.; Alsayed, Z.; Yu, L.; Glaser, S. Simultaneous localization and mapping: A survey of current trends in autonomous driving. IEEE Trans. Intell. Veh. 2017, 2, 194–220. [Google Scholar] [CrossRef]
  8. Davison, A.J.; Reid, I.D.; Molton, N.D.; Stasse, O. MonoSLAM: Real-Time Single Camera SLAM. IEEE Trans. Pattern Anal. Mach. Intell. 2007, 29, 1052–1067. [Google Scholar] [CrossRef] [PubMed]
  9. Klein, G.; Murray, D. Parallel tracking and mapping for small AR workspaces. In Proceedings of the 2007 6th IEEE and ACM International Symposium on Mixed and Augmented Reality, Washington, DC, USA, 13–16 November 2007; IEEE Computer Society: Washington, DC, USA, 2007; pp. 1–10. [Google Scholar]
  10. Mur-Artal, R.; Montiel, J.M.M.; Tardos, J.D. ORB-SLAM: A Versatile and Accurate Monocular SLAM System. IEEE Trans. Robot. 2015, 31, 1147–1163. [Google Scholar] [CrossRef]
  11. Mur-Artal, R.; Tardós, J.D. Orb-SLAM2: An open-source slam system for monocular, stereo, and RGB-D cameras. IEEE Trans. Robot. 2017, 33, 1255–1262. [Google Scholar] [CrossRef]
  12. Engel, J.; Schöps, T.; Cremers, D. LSD-SLAM: Large-scale direct monocular SLAM. In Proceedings of the European Conference on Computer Vision, Zurich, Switzerland, 6–12 September 2014; Springer: Cham, Switzerland, 2014; pp. 834–849. [Google Scholar]
  13. Liu, Y.; Zhao, C.; Ren, M. An Enhanced Hybrid Visual–Inertial Odometry System for Indoor Mobile Robot. Sensors 2022, 22, 2930. [Google Scholar] [CrossRef]
  14. Xie, H.; Chen, W.; Wang, J. Hierarchical forest based fast online loop closure for low-latency consistent visual-inertial SLAM. Robot. Auton. Syst. 2022, 151, 104035. [Google Scholar] [CrossRef]
  15. Lee, W.; Eckenhoff, K.; Yang, Y.; Geneva, P.; Huang, G. Visual-inertial-wheel odometry with online calibration. In Proceedings of the 2020 IEEE/RSJ International Conference on Intelligent Robots and Systems (IROS), Las Vegas, NV, USA, 24 October 2020–24 January 2021. [Google Scholar]
  16. Cheng, J.; Zhang, L.; Chen, Q. An Improved Initialization Method for Monocular Visual-Inertial SLAM. Electronics 2021, 10, 3063. [Google Scholar] [CrossRef]
  17. Jung, J.H.; Cha, J.; Chung, J.Y.; Kim, T.I.; Seo, M.H.; Park, S.Y.; Yeo, J.Y.; Park, C.G. Monocular visual-inertial-wheel odometry using low-grade IMU in urban areas. IEEE Trans. Intell. Transp. Syst. 2020, 23, 925–938. [Google Scholar] [CrossRef]
  18. Leutenegger, S.; Furgale, P.; Rabaud, V.; Chli, M.; Konolige, K.; Siegwart, R. Keyframe-based visual-inertial slam using nonlinear optimization. In Proceedings of the Robotis Science and Systems (RSS), Berlin, Germany, 24 June–28 June 2013. [Google Scholar]
  19. Leutenegger, S.; Lynen, S.; Bosse, M.; Siegwart, R.; Furgale, P. Keyframe-based visual–inertial odometry using nonlinear optimization. Int. J. Robot. Res. 2014, 34, 314–334. [Google Scholar] [CrossRef]
  20. Li, J.; Shi, X.X.; Cheng, Z.P.; Wang, J.Z. Road detection and location based on multi-channel fusion and polar constraint. J. Beijing Inst. Technol. 2020, 40, 867–872. [Google Scholar]
  21. Pai, N.S.; Huang, W.Z.; Chen, P.Y.; Chen, S.A. Optimization and Path Planning of Simultaneous Localization and Mapping Construction Based on Binocular Stereo Vision. Sens. Mater. 2022, 34, 1091–1104. [Google Scholar] [CrossRef]
  22. Shao, X.; Zhang, L.; Zhang, T.; Shen, Y.; Zhou, Y. MOFIS SLAM: A Multi-Object Semantic SLAM System with Front-View, Inertial, and Surround-View Sensors for Indoor Parking. IEEE Trans. Circuits Syst. Video Technol. 2021, 32, 4788–4803. [Google Scholar] [CrossRef]
  23. Yan, Y.; Zhang, B.; Zhou, J.; Zhang, Y.; Liu, X.A. Real-Time Localization and Mapping Utilizing Multi-Sensor Fusion and Visual–IMU–Wheel Odometry for Agricultural Robots in Unstructured, Dynamic and GPS-Denied Greenhouse Environments. Agronomy 2022, 12, 1740. [Google Scholar] [CrossRef]
  24. Yang, Q. A non-local cost aggregation method for stereo matching. In Proceedings of the 2012 IEEE Conference on Computer Vision and Pattern Recognition, Providence, RI, USA, 16–21 June 2012; pp. 1402–1409. [Google Scholar]
  25. Peng, X.; Han, J.; Tang, Y.; Shang, Y.; Yu, Y. Anti-noise stereo matching algorithm based on improved Census transform and outlier elimination. Acta Opt. Sin. 2017, 37, 223–231. [Google Scholar]
  26. Lowe, G. Distinctive image features from scale-invariant keypoints. Int. J. Comput. Vis. 2004, 60, 91–110. [Google Scholar] [CrossRef]
  27. Bay, H.; Ess, A.; Tuytelaars, T.; Van Gool, L. Speeded-up robust features. Comput. Vis. Image Underst. 2008, 110, 346–359. [Google Scholar] [CrossRef]
  28. Rosten, E.; Drummond, T. Machine learning for high-speed corner detection. In Proceedings of the Computer Vision–ECCV 2006: 9th European Conference on Computer Vision, Graz, Austria, 7–13 May 2006; pp. 430–443. [Google Scholar]
  29. Furgale, P.; Rehder, J.; Siegwart, R. Unified temporal and spatial calibration for multi-sensor systems. In Proceedings of the 2013 IEEE/RSJ International Conference on Intelligent Robots and Systems, Tokyo, Japan, 3–7 November 2013. [Google Scholar]
Figure 1. Parallax sub-pixel difference.
Processes 12 00466 g001
Figure 2. Flow chart of the stereo matching algorithm.
Processes 12 00466 g002
Figure 3. Comparison of pixel and sub-pixel precision 3D reconstruction.
Processes 12 00466 g003
Figure 4. Bar stack feature point measurement comparison results.
Processes 12 00466 g004
Figure 5. Initial feature matching point pair images.
Processes 12 00466 g005aProcesses 12 00466 g005b
Figure 6. Inertial vision navigation architecture.
Processes 12 00466 g006
Figure 7. Feature point matching process based on motion trend constraints.
Processes 12 00466 g007
Figure 8. Matching point pair images of bar stack side surface after filtering.
Processes 12 00466 g008aProcesses 12 00466 g008b
Figure 9. Matching point pair images of bar stack top surface after filtering.
Processes 12 00466 g009
Figure 10. Point cloud registration based on multi-position visual pose estimation.
Processes 12 00466 g010
Figure 11. Point cloud image of bar stack in unmanned warehouse area.
Processes 12 00466 g011
Figure 12. Bar stack contours from Binocular vision and crane laser scanning.
Processes 12 00466 g012
Table 1. 3D dimensional measurement results.
Measurement Range (mm)Target Size
(mm)
SGBM
(mm)
Error
(%)
CSCA
(mm)
Error
(%)
Proposed Algorithm (mm)Error
(%)
18009089.4130.6591.3241.4791.7031.89
25009088.1612.0491.8152.0291.1331.26
30009091.8582.0689.9784.0193.6081.34
36009093.3303.7088.6791.4789.5960.45
45009095.2125.7988.4201.7688.9121.21
50009092.4722.7595.3605.9691.7471.94
56009092.2282.4887.9912.2388.9911.12
850090108.26520.2995.9956.6692.5432.83
Table 2. Comparison of feature point measurement results.
Side Surface of Bar StackTop Surface of Bar Stack
Feature Point TypeNumber of MeasurementsTime (ms)Number of MeasurementsTime (ms)
SIFT1897278401071980
SURF82406070362160
ORB5001580411580
Table 3. Comparison of feature point matching results after filtering.
Side Surface of Bar StackTop Surface of Bar Stack
Feature Point TypeNumber of Initial Matching Point PairsNumber of Matching Point Pairs after FilteringTime (ms)Number of Initial Matching Point PairsNumber of Matching Point Pairs after FilteringTime (ms)
SIFT282383712,05010741930
SURF534208663069172170
ORB5928262041201750
Table 4. Comparison results between laser scanning and binocular vision.
MAE (mm)MREMaximum Absolute Error (mm)Maximum Relative ErrorBar DimensionMethodUnit Distance
(mm)
Frequency
(Hz)
Laser scanning00002DSingle Point Scan102
Binocular vision9.820.26%17.730.47%3DFace Scan9.5630
Disclaimer/Publisher’s Note: The statements, opinions and data contained in all publications are solely those of the individual author(s) and contributor(s) and not of MDPI and/or the editor(s). MDPI and/or the editor(s) disclaim responsibility for any injury to people or property resulting from any ideas, methods, instructions or products referred to in the content.

