Article

Mechanism of Calcium Ion-Selective Channel Opening in the ChR2_L132C Mutant: A Molecular Dynamics Simulation

1
Chongqing Key Laboratory of Big Data for Bio Intelligence, Chongqing University of Posts and Telecommunications, Chongqing 400065, China
2
Department of Chemistry and Physical Sciences, Nicholls State University, Thibodaux, LA 70310, USA
*
Authors to whom correspondence should be addressed.
Processes 2024, 12(3), 494; https://doi.org/10.3390/pr12030494
Submission received: 7 February 2024 / Revised: 23 February 2024 / Accepted: 25 February 2024 / Published: 28 February 2024
(This article belongs to the Section Chemical Processes and Systems)

Abstract

:
Channelrhodopsin-2 (ChR2) is an important tool for optogenetics, and some of its mutants are Ca2+-selective channels. However, the mechanism for Ca2+-selective permeation is still unclear. In this study, molecular dynamic (MD) simulations for the Ca2+ permeation of the CatCh mutant were carried out to investigate the fundamental features of the selectivity of Ca2+. Research on the conformational changes in the key residues near the central gate (CG) of the channel suggested that E83, E90, and D253 play an important role in Ca2+ conductivity. The clustering analysis indicates that the above “EED triad” acts as a filter, and Ca2+ can only pass through if the EED is in a certain conformation. It was also found that hydrated Ca2+ can be coordinated with carboxyl groups, resulting in the loss of part of the water molecules in the hydrated shell and a reduction in ionic radius, which helps Ca2+ enter the channel.

1. Introduction

Optogenetics is a multidisciplinary technology that integrates optics, software control, gene manipulation technology, electrophysiology, etc., and the ChR2 [1], extracted from microorganisms, which is one of the most important tools in optogenetics. Channelrhodopsin-2 (ChR2) [1] is a non-selective cation channel that permits the passage of various cations, including H+, Na+, K+, and Ca2+. However, due to its low ionic conductivity and poor ion selectivity, ChR2 is not effective in some optogenetic fields. Therefore, designing and modifying ChRs with high conductance and ion selectivity is of great importance. Several ChR2 variants have been artificially engineered, including CatCh [2], which is a mutated form of ChR2 (ChR2-L132C) that has a six-fold increase in Ca2+ permeability compared to wild-type ChR2. This results in a 70-fold increase in photosensitivity and faster response kinetics.
The L132C mutation is a classical method used to increase Ca2+’s conductance of ChR2. Many subsequent experiments related to mutations have included the L132C mutant. For instance, Pan’s team conducted experiments in 2014 that showed increased photosensitivity in ChR2-L132C/T159C and ChR2-L132C/T159S mutants [3]. Similarly, Mager’s team reported in 2018 that the F219Y mutation near L132 in ChR2 also increases relative calcium ion permeability (PCa/PNa) [4]. CapChR1 (ChR2-S63D-L132C-T159C-N258E) and CapChR2 (CoChR-S43D-L132C-T139C-N238E) [5] were obtained by Hegemann’s group in 2022. Both variants contain the L132C mutation, and exhibit increased Ca2+ conductance. The MD simulation on CapChR2 found that extracellularly oriented D43 and E238 in the channel attract Ca2+ into the channel. The authors also suggested that the voltage dependence of Ca2+ conductance at CG could be reduced by mutating residues at CG of ChR2, such as S63D/N258E.
The crystal structure of the open state is crucial in explaining the mechanism of ion permeation. Although the crystal structures of the dark state of ChR2 and other ChRs have been found [6,7,8,9,10], and the structures of some intermediates in the photocycle have even been resolved [11], the explicit structure of the open state of ChR2 is still lacking. In addition, there are structural differences between the dark and open states of ChR2, as well as changes in the amino acid residues near the channel pores and the protonation state of the retinal with the gating state [12,13,14]. As a result, many existing mechanisms of ion permeation based on the dark-state crystal structure are insufficient.
Ca2+ plays a crucial role in various metabolic activities, including cell signaling, metabolic excitation, neuronal plasticity, muscle contraction, apoptosis, and cell growth. However, there have been few studies on the Ca2+-selective mechanism of ChRs. Further research on this mechanism will aid in understanding the ion-permeable mechanism of ChRs and facilitate the design of Ca2+-selectively enhanced ChRs. This study employs MD simulations to investigate the process of Ca2+ and Na+ permeation in CatCh, aiming to explain the reason for the increased Ca2+ conductance caused by the L132C mutation.

2. Materials and Methods

2.1. Modeling Transmembrane CatCh Systems

In our previous research [15], a conducting state of ChR2 was obtained through MD simulations, referred to as the ‘ChR2-P520-like’ structure. This structure is indicated as the most likely conductive state of ChR2 by the radius of the ion channel, the water distribution density of the channel, and the calculated absorption spectra of the retinal chromophore. The residues E83, E90, and D253 are deprotonated in this state. To create a mutant of L132C, the leucine residue at position 132 in the sequence was substituted with cysteine using the CHARMM-GUI 3.8 online tool [16]. The L132C mutant was then inserted into a pre-equilibrated lipid bilayer composed of 16:0/18:1c9 palmitoyloleylphosphatidylcholine (POPC) to create the transmembrane system of CatCh. Subsequently, the transmembrane CatCh was immersed in a 0.1 mol/L CaCl2 solution environment, and a 300 ns MD simulation was conducted to obtain its open-state-like structure, which was designated as “CatCh-P520” (the pdb file is included in the Supplementary Materials) The CatCh system comprised 245 residues, 12145 water molecules, and 136 phospholipid molecules, totaling 58672 atoms. AmberTools v22 [17] was used to analyze the last 100 ns of equilibrium trajectories, and clustering analysis was employed to extract five representative conformations.
The CatCh-P520 structure obtained above was used for the construction of the CatCh-P520 transmembrane structure; using the Membrane Builder on the CHARMM-GUI 3.8 online website, the CatCh-P520 was embedded as an initial structure in a preequilibrated POPC lipid bilayer. Then, the composite structure of CatCh-P520 and the membrane were immersed into 0.15 mol/L of NaCl, a 0.1 mol/L CaCl2 solution, and a mixed solution, respectively, to complete the construction of the transmembrane system of CatCh-P520.

2.2. MD Simulation Details

NAMD2.13 software [18] was used to perform the MD simulation of the CatCh transmembrane system. For all simulations, the CHARMM36m [19] force field was employed. The simulations used the Particle Mesh Ewald (PME) method [20] to calculate long-range electrostatic interactions. A truncation radius of 12 Å was set for short-range non-bonding interactions. The SHAKE algorithm [21] was used to limit covalent bond vibrations and all hydrogen atoms. The Langevin piston algorithm [22] was used to maintain a pressure of 1. The system temperature was controlled at 303.15 K using Langevin temperature. Harmonic restraints were used to restrain the partial dihedral and plane angles of the protein, which were gradually reduced in 6 pre-equilibration steps. MD simulations were performed in the NPT ensemble for 300 ns with a time step of 2 fs. Figure S2 shows the root mean square deviation (RMSD) of the CatCh.
MD simulations were performed on CatCh-P520 and ChR2-P520 transmembrane systems using NAMD 2.13 software. An electric field strength of 0.198 kcal/mol−1 Å−1 E−1 was added in the direction of the z-axis of the whole system (perpendicular to the direction of the bilayer POPC membranes). The simulations were performed for 300 ns under the NPT ensemble. The permeation simulations’ conformations underwent cluster analysis using AmberTools. Free energy calculations were performed using Molecular Mechanics/the Poisson Boltzmann Surface Area (MM/PBSA) [23].
To investigate the permeation of Ca2+, CatCh-P520 was immersed in a 0.1 mol/L CaCl2 solution after being embedded in a bilayer POPC membrane. A membrane voltage with an electric field strength of 0.198 kcal/mol−1 Å−1 E−1 was applied along the z-axis, and another 300 ns MD simulation was performed. The ion permeation process typically takes a long time and, therefore, requires acceleration. In experiments, the photocurrents typically last for microseconds [24]. To accelerate the process of the MD simulation of ion permeation, a transmembrane voltage of approximately 900 mV [25] was used in this study. This voltage was about ten times higher than the membrane voltage in the physiological state (70–100 mV) and enabled the observation of the process of ion permeation in nanoseconds. Previous studies of CapChR2 [5] by Fernandez Lahore et al. also used voltages close to 1 V for the ion penetration of the membrane.

3. Results

3.1. Models of CatCh-P520 and Simulation of ion Permeation

A comparison of the structure of CatCh-P520 with the previously reported ChR2-P520-like open state (shown in Figure S1) indicates that the channel enlargement is mainly due to the partial displacement of TM2 of CatCh-P520 near the C132 site. The cavity containing amino acid position 132 of CatCh-P520 is larger than that of the ChR2-P520-like open state, and the movement of TM4 is the main cause of the increase in this cavity. Kleinlogel et al. [2] also reported that the increase in Ca2+ permeability may be due to the leucine mutation at position 132, which results in the formation of a cavity at the mutation site. This increases the flexibility of the helix, leading to the displacement of the helix and making the channel larger. The experiments were conducted with CatCh mutants.
The density map of Ca2+ in CatCh-P520 indicates the significant aggregation of Ca2+ near E101 on the extracellular side, suggesting that this site is prone to Ca2+ aggregation in the solution. In the equilibrium conformation of CatCh-P520, the carboxyl groups of E101 and E97 located in the extracellular access channel, and E90 and D253 at the central gate (Figure S3) are oriented towards the extracellular side, which attracts Ca2+ into the channel.
The duration of the Ca2+ residence at each residue position of the channel during permeation reflects the interaction between Ca2+ ions and the residues. Figure 1a shows that Ca2+ remained longer at E90 and E83 and shorter at E101 and E97, indicating a stronger interaction between Ca2+ and E90 and E83 during the permeation process. It is worth noting that when passing through selective channel proteins, such as KcsA, NaV, and CaV [26,27,28], the ions’ hydration shell was partially or completely removed. In contrast, non-selective ion channels allow ions to pass through without dehydration. Therefore, the hydration state is a crucial factor in describing ion permeation. To demonstrate the change in the hydration state of Ca2+, the variations in the coordination number of Ca2+ (including the coordination of Ca2+ to oxygen atoms in H2O and residues) were counted, as shown in Figure 1b. At the beginning of the permeation process, Ca2+ was coordinated with an average total of 7.2 oxygen atoms, with the majority of coordinated oxygen atoms originating from H2O molecules. Upon entering the channel for 4 ns and reaching E90 of the CG, hydrated Ca2+ released 1–2 H2O molecules to form a coordination with the carboxyl oxygen. After an additional 10 ns, Ca2+ approached E83, and the H2O molecule bound to Ca2+ and was restored to seven. When Ca2+ reaches E83 in the intracellular gate (ICG), the carboxylated oxygen of the glutamate replaces four H2O molecules bound by Ca2+ due to the proximity of E83 to E82. At this point, both the H2O and the carboxylate are coordinated with approximately four oxygen atoms to Ca2+. Finally, Ca2+ exits the channel to enter the cell. The calculation of Ca2+ binding energies to the carboxyl groups at CG (listed in Table S1) indicates that the substitution of water molecules by carboxyl oxygen at these sites is mainly due to the strong electrostatic attraction between the ion and the carboxyl group. This suggests that partial dehydration occurs only near the acidic amino acids during Ca2+ permeation. In contrast, hydrated Na+ was dehydrated to a much lesser extent as it permeated into the channel (as seen in Figure S4). According to the literature [29], KcsA, which exhibits high ion selectivity, tends to pass through the channel as a fully dehydrated ion. The weaker ion selectivity of CatCh is likely due to the change in hydration number, which prevents the strong dehydration-based selectivity mechanism from being utilized.
Figure 2 displays the one-dimensional potential mean force (PMF) of Ca2+ permeating into CatCh-P520. The PMF shows an energy barrier of 5 kcal/mol at the CG in the channel for Ca2+. Additionally, there are two relatively weak energy barriers (approximately 1 kcal/mol) before and after the CG, corresponding to E97 and E83 in the channel, respectively. The free energy barriers shown in the PMF correspond well with the binding sites observed in the simulations, suggesting that the energy barriers at these positions are the result of a significant interaction between several glutamic acids and Ca2+. These results also suggest that in CatCh, the Ca2+ conductance pathway is coupled to the position of GLU and ASP in the channel.

3.2. Effects of Amino Acids at CG

The figures show that Ca2+ interacts significantly with the channels in the CG and ICG, which may act as potential ‘selective filters’ for Ca2+. The residence time and PMF of Ca2+ permeation support this. It is important to note that the conformational changes in the amino acid residues E90, D253, and E83 play a key role in Ca2+ permeation.
As a divalent cation, Ca2+ strongly interacts with deprotonated acidic amino acids in the channel. Further analysis of the Ca2+ trajectories was conducted. The carboxyl positions of E83, E90, and D253 were used as a reference to perform the K-means clustering analysis of the trajectories with Ca2+ in the vicinity of CG. The clustering results are presented in Table 1, and the top three representative conformations are shown in Figure 3. The results of the clustering analysis indicate that when Ca2+ is in close proximity to CG, the nearby residues predominantly adopt conformations corresponding to clustering results 1 and 2. In these states, Ca2+’s passage through CG was not observed. In clustering result 3’s state, the Ca2+ permeation at CG was observed, and clustering result 3 accounted for 12.5% of the total. The clustering results show that the percentage of structures capable of Ca2+ permeation is approximately 12.5%, indicating that even in the Ca2+-enhanced ChR2 variant of CatCh, Ca2+ permeation is low, which is similar to the results observed experimentally by Kleinlogel et al. [2].
The binding free energies of E83, E90, and D253 to Ca2+ were calculated in each of the three clusters (see Table 1 and Table S1) to represent the stabilizing effect of each of the three amino acid residues on Ca2+. In the first two clusters, E90 exhibited a high binding free energy for Ca2+ (−12.21 and −17.05 kcal/mol, respectively). Compared to cluster 3, D253 in cluster 1 had a binding free energy of −16.65 kcal/mol for Ca2+. This largely limits further Ca2+ penetration into CG. In cluster 2, D253 forms a hydrogen bond with water near R120. The effect of D253 on Ca2+ is weaker (−1.29 kcal/mol), but the attraction to Ca2+ is even weaker (only −0.23 kcal/mol) due to the carboxyl group of E83 not facing CG. However, in cluster 3, the carboxyl conformation of E83 towards CG allows Ca2+ to permeate more readily towards the intracellular side, resulting in the easier passage of Ca2+ through the channel.

3.3. Comparison of Ca2+ and Na+ Permeation Patterns

CatCh has a higher Ca2+ conductivity than ChR2, but like ChR2, its primary conductive ion is still Na+ [1,2]. To understand why CatCh’s Ca2+ conductivity is lower than that of Na+, an analysis of Na+ and Ca2+’s permeation is necessary. In the charged-field permeation simulation, we replaced the 0.1 mol/L CaCl2 solution with a 0.15 mol/L NaCl solution and a mixed NaCl-CaCl2 solution, respectively. We kept all other conditions unchanged to observe the process of corresponding ions.
Figure S3 illustrates that the F102 residue, situated at extracellular cavity 1 (EC1), blocks ion entry into the channel. The hydrophobic benzene ring, along with its spatial site blocking, prevents ions from entering the channel. Ca2+ primarily enters the channel through E101 on TM2 during permeation and then passes through E97 to the CG to interact with residues such as E90 at the CG. Compared to Ca2+, Na+ enters the channel more easily, and there are more pathways for Na+ to enter from the extracellular loop 1 of the channel. The Na+ passage was observed on both sides of F102 (Figure S3). The permeation mechanism of Na+ in the channel was simpler, and it remained in the central cavity for a shorter period of time than Ca2+. Na+ does not interact complexly with carboxylated residues in the central cavity. This is also evident from the change in the oxygen coordination of Na+ (as seen in Figure S4). The coordination number of Na+ for oxygen remains constant during permeation, and only two H2O coordinations are removed, even at E83 and E82. This is one reason why Na+ conductance is generally greater than that of Ca2+ in ChRs.
Ca2+ blocks the permeation of other ions. When Ca2+ is located at CG in the channel, its two positive charges prevent other Ca2+ and Na+ ions from approaching CG before they pass through CG. However, the subsequent arrival of Ca2+ and Na+ ions may also promote further Ca2+ penetration at CG, resulting in successive ion penetration, similar to the ‘knock-on’ mechanism [5]. In contrast, Na+ can pass more densely through the channel.

4. Discussion

Due to the low Ca2+ conductance of most wild-type ChRs, we chose CatCh, a classical ChR2 Ca2+-enhancing mutant, to carry out the study on the permeation properties of Ca2+ in ChRs. And the structure of CatCh-P520 was obtained by mutation, and MD experiments using ChR2-P520 and ion-permeation simulations of CatCh-P520 were performed.
Previous discussions have established the structural differences between CatCh-P520 and ChR2-P520 (Figure S3). The permeation properties of ions are directly affected by the radius of their hydrated ions. The hydrated Ca2+ ion has a radius of approximately 3.8 Å, as the thickness of its first solvation shell is around 2.4 Å from the Ca2+, and the radius of a water molecule is usually considered to be 1.4 Å [30]. The minimum channel radius in the open state of ChR2 is approximately 3 Å [1]. The radius at the CG (E90 to D253 carboxylate distance) of CatCh-P520 obtained from the simulations in this paper is approximately 3.4 Å. Based on the radius, it appears challenging for hydrated Ca2+ to pass directly through the channels of ChR2 and CatCh-P520. This difference in radius may be a significant factor contributing to the greater Ca2+ permeability of CatCh compared to ChR2. This text suggests that hydrated Ca2+ ions must lose some water molecules at CG and ICG to reduce their radius and pass through the channel.
CatCh-P520 exhibits differences in the permeation processes of Ca2+ and Na+ due to their different ionic radii and carried charges. Since Ca2+ carries two positive charges, its permeation in CatCh-P520 is interconnected with GLU and ASP in the channel, i.e., its permeation path in CatCh-P520 follows the sequence E101, E97, E90/D253, and E83. This is similar to Ca2+ permeation in other channel proteins, such as in RyR [30], as Ca2+ passes near the selectivity filter along the sequence D4903, E4900, and D4899. Comparatively, Na+ penetrates more easily in CatCh-P520 due to its smaller size and smaller charge-carrying capacity and has shorter interaction time with GLU and ASP in the channel. The permeation characteristics mentioned are in line with the stronger Na+ conductance demonstrated by CatCh in the experiments.
Through the analysis of the Ca2+ permeation process in CatCh-P520, it was discovered that Ca2+ interacts more with residues in the channel near CG and ICG (refer to Figure 2). And after energy analysis, we focused the Ca2+ interaction near the CG and ICG on three conformations of residues E83, E90, and D253 (Figure 3). Within the channel, an ‘EED triad’ consisting of three carboxylic residues (E83, E90, and D253) facilitated Ca2+ binding. The reasons why Ca2+ penetration is more likely to occur in clustering result 3 are summarized as follows: D253 is ‘non-blocking’, E90 is ‘transferring’, and E83 is ‘attracting’. The clustering analysis reveals that when calcium ions are near CG in the channel, the ‘EED triad’ can adopt three conformations, as depicted in Figure 4. Clusters 1 and 2 are the dominant clusters prevalent. However, the strong force of D253 and E90 in cluster 1 creates a bilateral tethering structure with Ca2+, which restricts the penetration of Ca2+. In contrast, Ca2+ in cluster 2 does not experience the tethering effect of D253; at this point, D253 mostly forms a hydrogen bond with R120 or water in the vicinity of R120, which is in a different position to the channel. But it is difficult for Ca2+ to pass through the channel due to the lack of attraction to Ca2+ by E83. Ca2+ can only pass through when the residues in the channel are in the state under cluster 3, which satisfies the ‘non-blocking’ of D253, the ‘attracting’ of E83, and the ‘transferring’ of E90.
This text summarizes the structural features of CatCh-P520 and the ‘EED triad’ regulatory properties of Ca2+ in CatCh-P520 through simulations. Based on our findings, we propose the following ideas for enhancing the selectivity of ChRs for Ca2+: (i) Increase the radius of the open state of the channel to reduce the spatial site resistance of hydrated Ca2+ in the channel due to the large radius of hydrated Ca2+. For instance, the conductance of Ca2+ can be increased by the L132C mutation of ChR2, which increases the radius of the channel. (ii) Additionally, the enrichment of Ca2+ by carboxylate-bearing residues on the outside of EC1 (E41, E101) plays a crucial role in the permeation of Ca2+ due to the low concentration of Ca2+ in the cytosol. Increasing the number of carboxylate-bearing residues in the extracellular space would facilitate Ca2+ entry into the channel. (iii) The conformation of several residues, such as E83 of the ICG, influences Ca2+ permeation at the CG. The attraction of Ca2+ by the GLU of the ICG is favorable in helping Ca2+ to cross the energy barrier of the CG. Therefore, selectively mutating residues in the region between E83 and E90 to acidic amino acids may be an important method to increase Ca2+ permeability, similar to mimicking the EEEE motifs in other Ca2+-selective channel proteins [28,31,32].

5. Conclusions

In summary, our conclusions indicate that the reason for the increase in Ca2+ conductance in CatCh is due to the L132C mutation, which increases the channel’s radius. This makes the diameter of the partially dehydrated Ca2+ more compatible with the channel size, resulting in the higher permeability properties of Ca2+ in CatCh. Additionally, our findings suggest the reason for the generally lower conductance of Ca2+ in the various variants of ChR2, and we indicate the permeable properties of Ca2+ in CatCh. As the CatCh mutant only changes one amino acid residue far from the channel’s portion, the conclusions drawn from the simulations in CatCh can also be applied, to some extent, to ChR2 itself. Understanding these detailed mechanisms can aid in the design of subsequent Ca2+-selective enhancement variants of ChRs.

Supplementary Materials

The following supporting information can be downloaded at: https://www.mdpi.com/article/10.3390/pr12030494/s1, Figure S1: The superposition of ChR2-P520 (white) and CatCh (blue). The green residue is Cys132, and the blue arrow indicates the direction of the helical displacement of CatCh-P520 relative to ChR2-P520; Figure S2: RMSD of CatCh in equilibrium simulation; Figure S3: Ca2+ density distribution, carboxyl group orientation, and F102 position in equilibrium simulations. The gray arrows describe the potential Na+ permeation pathway; Figure S4: Changes in hydration number during Na+ penetration; Table S1: Energy decomposition of three clusters.

Author Contributions

Conceptualization, W.Z.; methodology, S.Y.; formal analysis, T.X.; investigation, T.X.; data curation, W.Z.; writing—original draft preparation, T.X.; writing—review and editing, Y.D.; visualization, T.X. All authors have read and agreed to the published version of the manuscript.

Funding

This research received no external funding.

Data Availability Statement

The original contributions presented in this study are included in the article/Supplementary Materials, and further inquiries can be directed to the corresponding author/s.

Acknowledgments

We thank Shuangyan Zhou for her help in molecular dynamic simulations.

Conflicts of Interest

The authors declare no conflict of interest.

References

  1. Nagel, G.; Szellas, T.; Huhn, W.; Kateriya, S.; Adeishvili, N.; Berthold, P.; Ollig, D.; Hegemann, P.; Bamberg, E. Channelrhodopsin-2, a directly light-gated cation-selective membrane channel. Proc. Natl. Acad. Sci. USA 2003, 100, 13940–13945. [Google Scholar] [CrossRef]
  2. Kleinlogel, S.; Feldbauer, K.; Dempski, R.E.; Fotis, H.; Wood, P.G.; Bamann, C.; Bamberg, E. Ultra light-sensitive and fast neuronal activation with the Ca2+-permeable channelrhodopsin CatCh. Nat. Neurosci. 2011, 14, 513–518. [Google Scholar] [CrossRef] [PubMed]
  3. Pan, Z.H.; Ganjawala, T.H.; Lu, Q.; Ivanova, E.; Zhang, Z. ChR2 mutants at L132 and T159 with improved operational light sensitivity for vision restoration. PLoS ONE 2014, 9, e98924. [Google Scholar] [CrossRef] [PubMed]
  4. Mager, T.; Lopez de la Morena, D.; Senn, V.; Schlotte, J.; D’Errico, A.; Feldbauer, K.; Wrobel, C.; Jung, S.; Bodensiek, K.; Rankovic, V.; et al. High frequency neural spiking and auditory signaling by ultrafast red-shifted optogenetics. Nat. Commun. 2018, 9, 1750. [Google Scholar] [CrossRef] [PubMed]
  5. Fernandez Lahore, R.G.; Pampaloni, N.P.; Peter, E.; Heim, M.M.; Tillert, L.; Vierock, J.; Oppermann, J.; Walther, J.; Schmitz, D.; Owald, D.; et al. Calcium-permeable channelrhodopsins for the photocontrol of calcium signalling. Nat. Commun. 2022, 13, 7844. [Google Scholar] [CrossRef] [PubMed]
  6. Volkov, O.; Kovalev, K.; Polovinkin, V.; Borshchevskiy, V.; Bamann, C.; Astashkin, R.; Marin, E.; Popov, A.; Balandin, T.; Willbold, D.; et al. Structural insights into ion conduction by channelrhodopsin 2. Science 2017, 358, eaan8862. [Google Scholar] [CrossRef] [PubMed]
  7. Kato, H.E.; Zhang, F.; Yizhar, O.; Ramakrishnan, C.; Nishizawa, T.; Hirata, K.; Ito, J.; Aita, Y.; Tsukazaki, T.; Hayashi, S.; et al. Crystal structure of the channelrhodopsin light-gated cation channel. Nature 2012, 482, 369–374. [Google Scholar] [CrossRef] [PubMed]
  8. Kato, H.E.; Kim, Y.S.; Paggi, J.M.; Evans, K.E.; Allen, W.E.; Richardson, C.; Inoue, K.; Ito, S.; Ramakrishnan, C.; Fenno, L.E.; et al. Structural mechanisms of selectivity and gating in anion channelrhodopsins. Nature 2018, 561, 349–354. [Google Scholar] [CrossRef]
  9. Kim, Y.S.; Kato, H.E.; Yamashita, K.; Ito, S.; Inoue, K.; Ramakrishnan, C.; Fenno, L.E.; Evans, K.E.; Paggi, J.M.; Dror, R.O.; et al. Crystal structure of the natural anion-conducting channelrhodopsin GtACR1. Nature 2018, 561, 343–348. [Google Scholar] [CrossRef]
  10. Oda, K.; Vierock, J.; Oishi, S.; Rodriguez-Rozada, S.; Taniguchi, R.; Yamashita, K.; Wiegert, J.S.; Nishizawa, T.; Hegemann, P.; Nureki, O. Crystal structure of the red light-activated channelrhodopsin Chrimson. Nat. Commun. 2018, 9, 3949. [Google Scholar] [CrossRef]
  11. Oda, K.; Nomura, T.; Nakane, T.; Yamashita, K.; Inoue, K.; Ito, S.; Vierock, J.; Hirata, K.; Maturana, A.D.; Katayama, K.; et al. Time-resolved serial femtosecond crystallography reveals early structural changes in channelrhodopsin. eLife 2021, 10, e62389. [Google Scholar] [CrossRef] [PubMed]
  12. Cheng, J.; Zhang, W.; Zhou, S.; Ran, X.; Shang, Y.; Lo, G.V.; Dou, Y.; Yuan, S. The effect on ion channel of different protonation states of E90 in channelrhodopsin-2: A molecular dynamics simulation. RSC Adv. 2021, 11, 14542–14551. [Google Scholar] [CrossRef] [PubMed]
  13. Kuhne, J.; Vierock, J.; Tennigkeit, S.A.; Dreier, M.A.; Wietek, J.; Petersen, D.; Gavriljuk, K.; El-Mashtoly, S.F.; Hegemann, P.; Gerwert, K. Unifying photocycle model for light adaptation and temporal evolution of cation conductance in channelrhodopsin-2. Proc. Natl. Acad. Sci. USA 2019, 116, 9380–9389. [Google Scholar] [CrossRef] [PubMed]
  14. Radu, I.; Bamann, C.; Nack, M.; Nagel, G.; Bamberg, E.; Heberle, J. Conformational changes of channelrhodopsin-2. J. Am. Chem. Soc. 2009, 131, 7313–7319. [Google Scholar] [CrossRef] [PubMed]
  15. Xin, Q.; Zhang, W.; Yuan, S. The Mechanism of the Channel Opening in Channelrhodopsin-2: A Molecular Dynamics Simulation. Int. J. Mol. Sci. 2023, 24, 5667. [Google Scholar] [CrossRef]
  16. Jo, S.; Kim, T.; Iyer, V.G.; Im, W. CHARMM-GUI: A web-based graphical user interface for CHARMM. J. Comput. Chem. 2008, 29, 1859–1865. [Google Scholar] [CrossRef] [PubMed]
  17. Pearlman, D.A.; Case, D.A.; Caldwell, J.W.; Ross, W.S.; Cheatham, T.E.; Debolt, S.; Ferguson, D.; Seibel, G.; Kollman, P. Amber, a Package of Computer-Programs for Applying Molecular Mechanics, Normal-Mode Analysis, Molecular-Dynamics and Free-Energy Calculations to Simulate the Structural and Energetic Properties of Molecules. Comput. Phys. Commun. 1995, 91, 1–41. [Google Scholar] [CrossRef]
  18. Kalé, L.; Skeel, R.; Bhandarkar, M.; Brunner, R.; Gursoy, A.; Krawetz, N.; Phillips, J.; Shinozaki, A.; Varadarajan, K.; Schulten, K. NAMD2: Greater Scalability for Parallel Molecular Dynamics. J. Comput. Phys. 1999, 151, 283–312. [Google Scholar] [CrossRef]
  19. Huang, J.; Rauscher, S.; Nawrocki, G.; Ran, T.; Feig, M.; de Groot, B.L.; Grubmüller, H.; MacKerell, A.D. CHARMM36m: An improved force field for folded and intrinsically disordered proteins. Nat. Methods 2017, 14, 71–73. [Google Scholar] [CrossRef]
  20. Darden, T.; York, D.; Pedersen, L. Particle mesh Ewald: An N⋅log(N) method for Ewald sums in large systems. J. Chem. Phys. 1993, 98, 10089–10092. [Google Scholar] [CrossRef]
  21. Andersen, H.C. Rattle: A “velocity” version of the shake algorithm for molecular dynamics calculations. J. Comput. Phys. 1983, 52, 24–34. [Google Scholar] [CrossRef]
  22. Feller, S.E.; Zhang, Y.; Pastor, R.W.; Brooks, B.R. Constant pressure molecular dynamics simulation: The Langevin piston method. J. Chem. Phys. 1995, 103, 4613–4621. [Google Scholar] [CrossRef]
  23. Miller, B.R., 3rd; McGee, T.D., Jr.; Swails, J.M.; Homeyer, N.; Gohlke, H.; Roitberg, A.E. MMPBSA.py: An Efficient Program for End-State Free Energy Calculations. J. Chem. Theory Comput. 2012, 8, 3314–3321. [Google Scholar] [CrossRef] [PubMed]
  24. Govorunova, E.G.; Sineshchekov, O.A.; Li, H.; Wang, Y.; Brown, L.S.; Palmateer, A.; Melkonian, M.; Cheng, S.; Carpenter, E.; Patterson, J.; et al. Cation and Anion Channelrhodopsins: Sequence Motifs and Taxonomic Distribution. mBio 2021, 12, e0165621. [Google Scholar] [CrossRef]
  25. Roux, B. The membrane potential and its representation by a constant electric field in computer simulations. Biophys. J. 2008, 95, 4205–4216. [Google Scholar] [CrossRef]
  26. Rappleye, M.; Berndt, A. Structural basis for ion selectivity and engineering in channelrhodopsins. Curr. Opin. Struct. Biol. 2019, 57, 176–184. [Google Scholar] [CrossRef]
  27. Jiang, D.; Zhang, J.; Xia, Z. Structural Advances in Voltage-Gated Sodium Channels. Front. Pharmacol. 2022, 13, 908867. [Google Scholar] [CrossRef] [PubMed]
  28. Wu, J.; Yan, Z.; Li, Z.; Qian, X.; Lu, S.; Dong, M.; Zhou, Q.; Yan, N. Structure of the voltage-gated calcium channel Ca(v)1.1 at 3.6 A resolution. Nature 2016, 537, 191–196. [Google Scholar] [CrossRef] [PubMed]
  29. Noskov, S.Y.; Roux, B. Ion selectivity in potassium channels. Biophys. Chem. 2006, 124, 279–291. [Google Scholar] [CrossRef] [PubMed]
  30. Zhang, A.; Yu, H.; Liu, C.; Song, C. The Ca2+ permeation mechanism of the ryanodine receptor revealed by a multi-site ion model. Nat. Commun. 2020, 11, 922. [Google Scholar] [CrossRef]
  31. Gao, S.; Yao, X.; Yan, N. Structure of human Ca(v)2.2 channel blocked by the painkiller ziconotide. Nature 2021, 596, 143–147. [Google Scholar] [CrossRef] [PubMed]
  32. Gao, Y.; Xu, S.; Cui, X.; Xu, H.; Qiu, Y.; Wei, Y.; Dong, Y.; Zhu, B.; Peng, C.; Liu, S.; et al. Molecular insights into the gating mechanisms of voltage-gated calcium channel CaV2.3. Nat. Commun. 2023, 14, 516. [Google Scholar] [CrossRef] [PubMed]
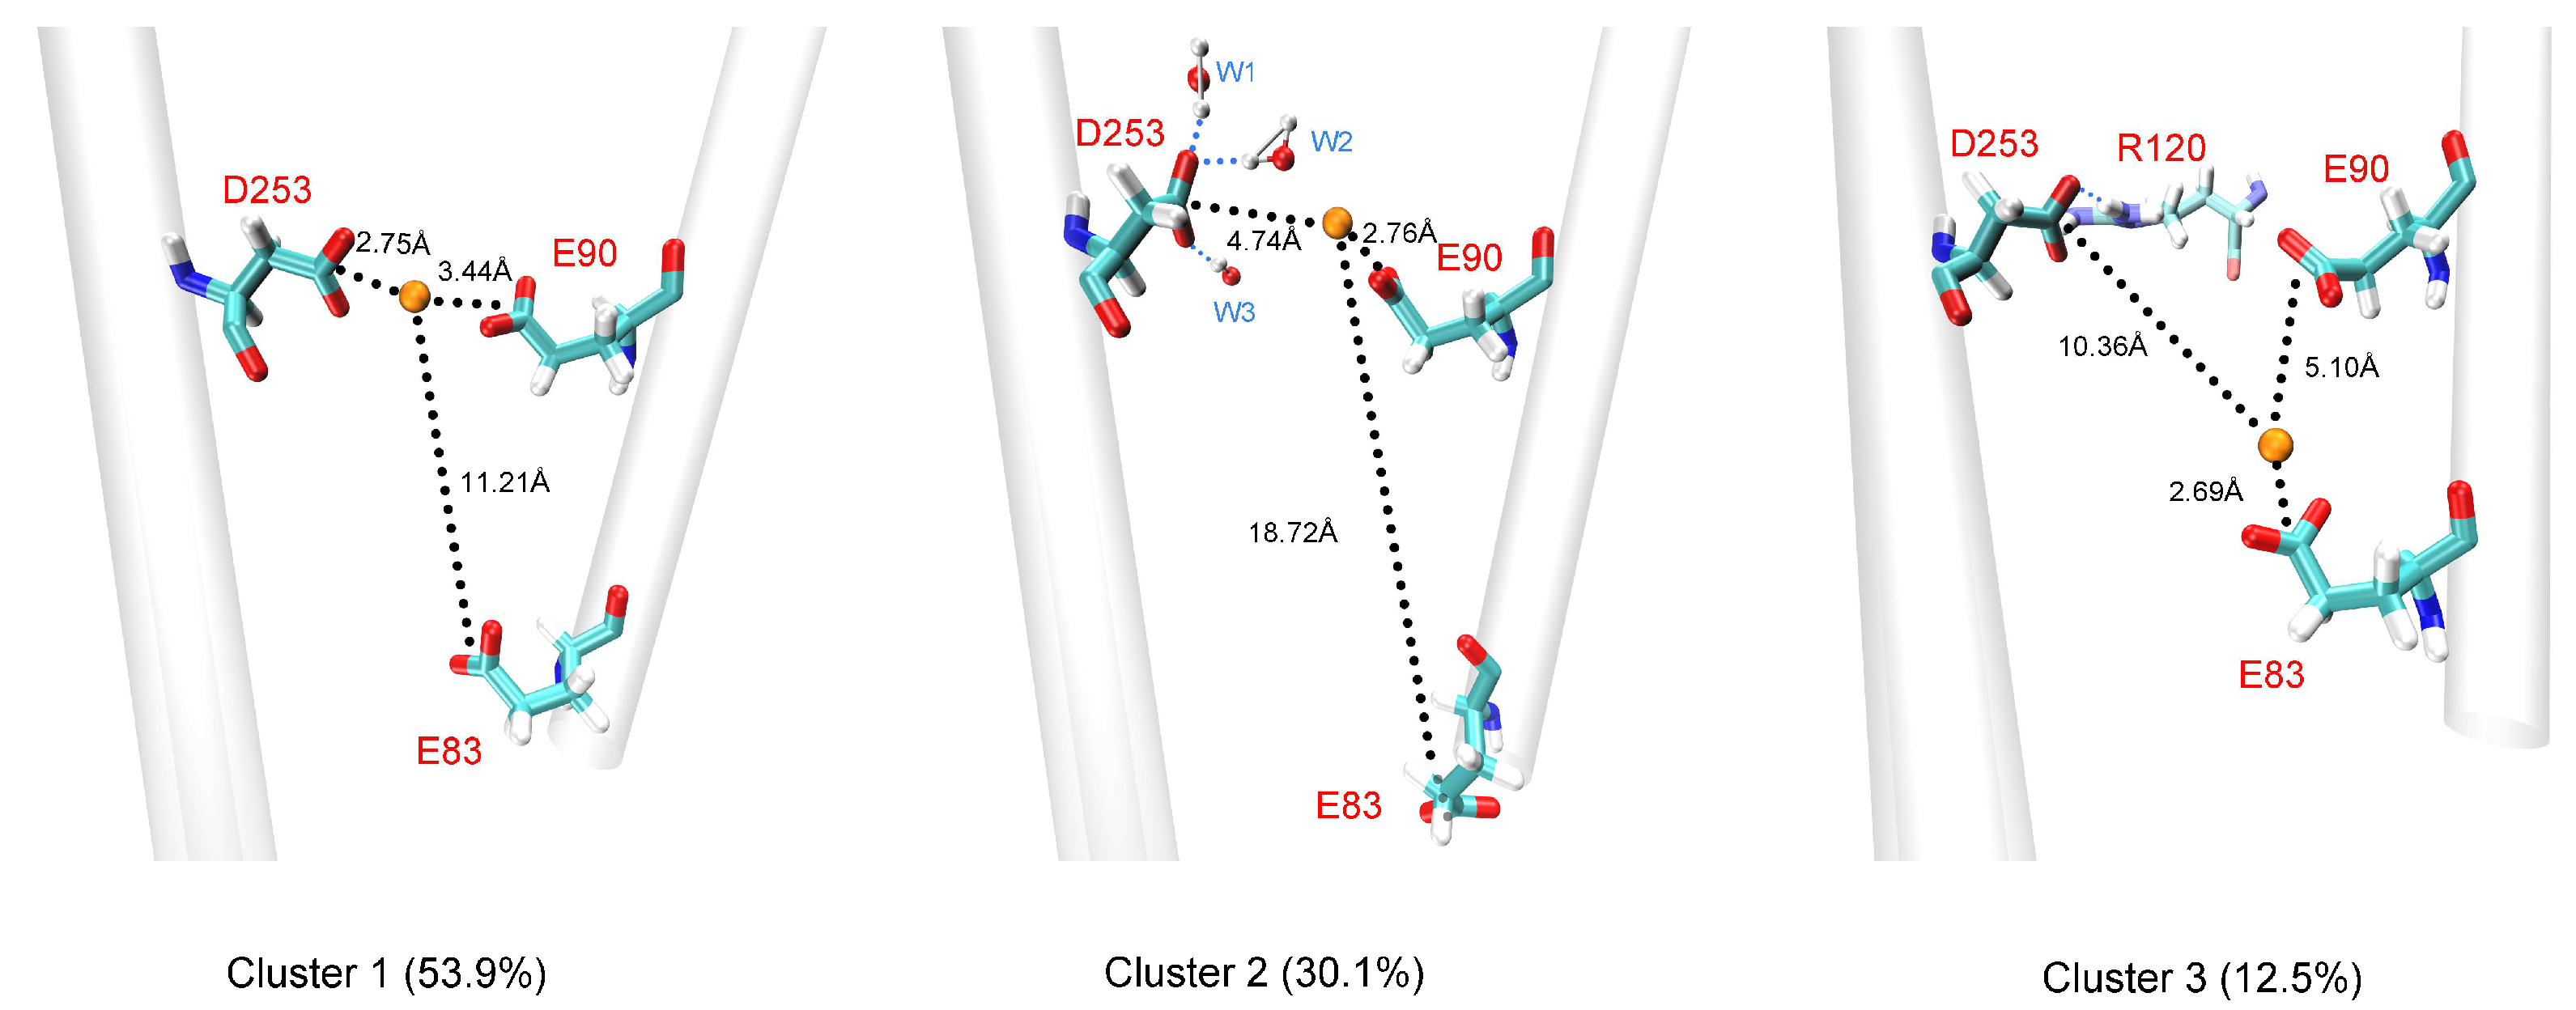
Figure 1. (a) Evolution of the Z coordinates when Ca2+ permeates through the CatCh-P520 channel, the extracellular gate (ECG), CG, and ICG regions are roughly divided by the dotted line. E101 and E97 are located in the ECG region, D253 and E90 in the CG region and E83 in the ICG region. (b) Evolution of the Ca2+ oxygen coordination when Ca2+ permeates through the CatCh-P520 channel. The figure displays the total oxygen coordination of Ca2+ (black solid line), the oxygen coordination with water (blue dashed line), and the change in oxygen coordination with amino acid residues (red dotted line).
Processes 12 00494 g001
Figure 2. PMF of Ca2+ in CatCh-P520. The brown dashed arrow indicates the approximate path of Ca2+ penetration and several key amino acid residues (E97, D253, E90, E83) during penetration; the corresponding energy barrier sizes at these points are labeled.
Processes 12 00494 g002
Figure 3. Clustering results. In each cluster, the left helix is TM7, and the right one is TM2. Ca2+ is depicted as orange spheres, and the black dashed lines show the distances between Ca2+ and the three residues D253, E90, and E83. The blue dashed lines in cluster 2 and cluster 3 represent the hydrogen bonds formed by D253 with water or R120.
Processes 12 00494 g003
Figure 4. Schematic diagram of the EED triad with regulated Ca2+ permeable entry channels. In each cluster, Ca2+ is depicted as orange spheres, TM7 and TM2 are represented by two long thick lines, and E90, D253, and E83 are represented by three short thick lines. In the conformation of cluster 3, Ca2+ permeates more easily through the CG, as indicated by a black arrow.
Processes 12 00494 g004
Table 1. Clustering results and corresponding energy decomposition.
ClusterPercentageBinding Free Energy (kcal/mol)
E90D253E83
153.9%−12.21−16.65−0.41
230.1%−17.05−1.29−0.23
312.5%−1.78−0.40−18.15
Disclaimer/Publisher’s Note: The statements, opinions and data contained in all publications are solely those of the individual author(s) and contributor(s) and not of MDPI and/or the editor(s). MDPI and/or the editor(s) disclaim responsibility for any injury to people or property resulting from any ideas, methods, instructions or products referred to in the content.

