
Performance and Exhaust Emissions from Diesel Engines with Different Blending Ratios of Biofuels


Abstract
1. Introduction
2. Concepts and Methodologies
2.1. Equation
2.1.1. Fundamental Conservation Principles
- Mass equation
- 2.
- Momentum equation
- 3.
- Energy equation
2.1.2. Turbulence Model
2.1.3. Combustion Model
2.1.4. Spray Model
2.1.5. Emission Model
2.2. Thermophysical Property Predictions
2.2.1. Critical Properties
2.2.2. Saturated Vapor Pressure
2.2.3. Dynamic Viscosity
2.2.4. Surface Tension
2.2.5. Thermal Conductivity
2.2.6. Density
2.2.7. Latent Heat of Vaporization
2.3. Mechanism of Biodiesel and n-Butanol
2.4. Three-Dimensional CFD Model
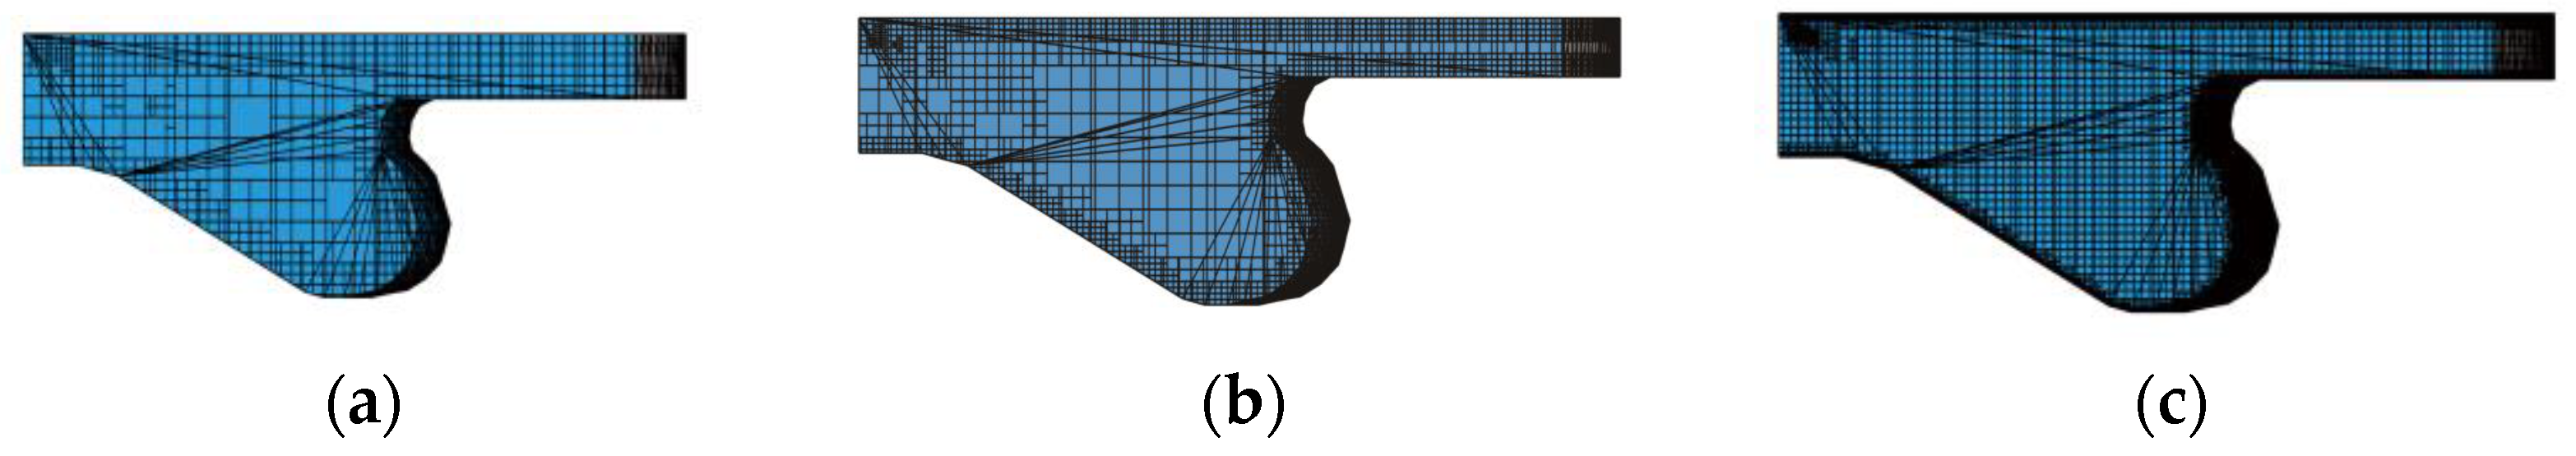
2.4.1. Computational Mesh
2.4.2. Feasibility Assessment
2.5. Uncertainty Analysis
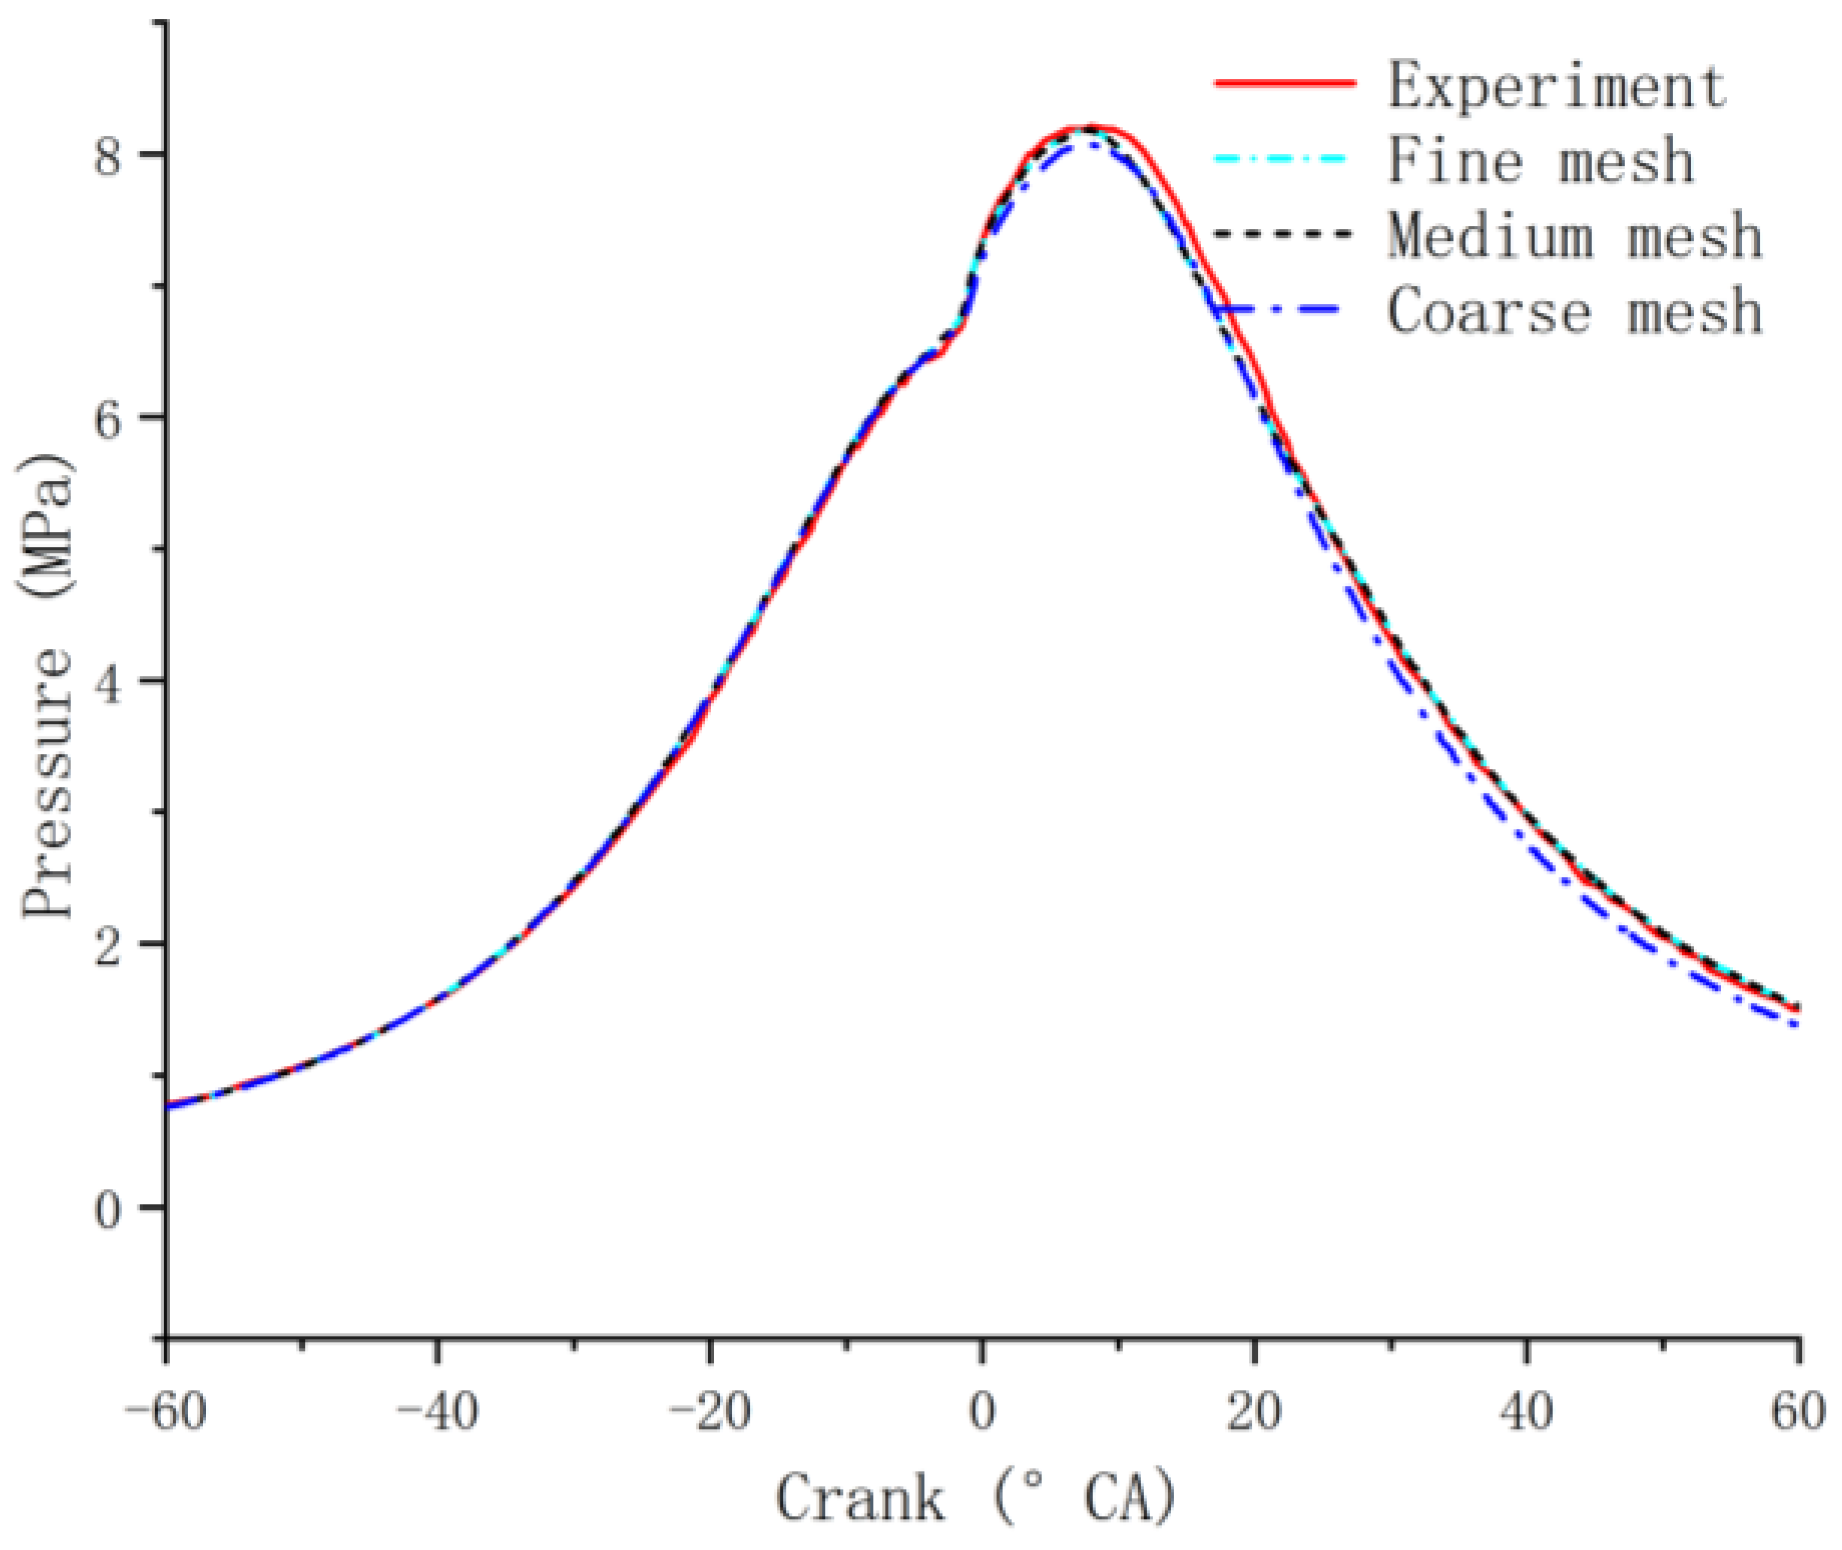
2.6. Model Validation
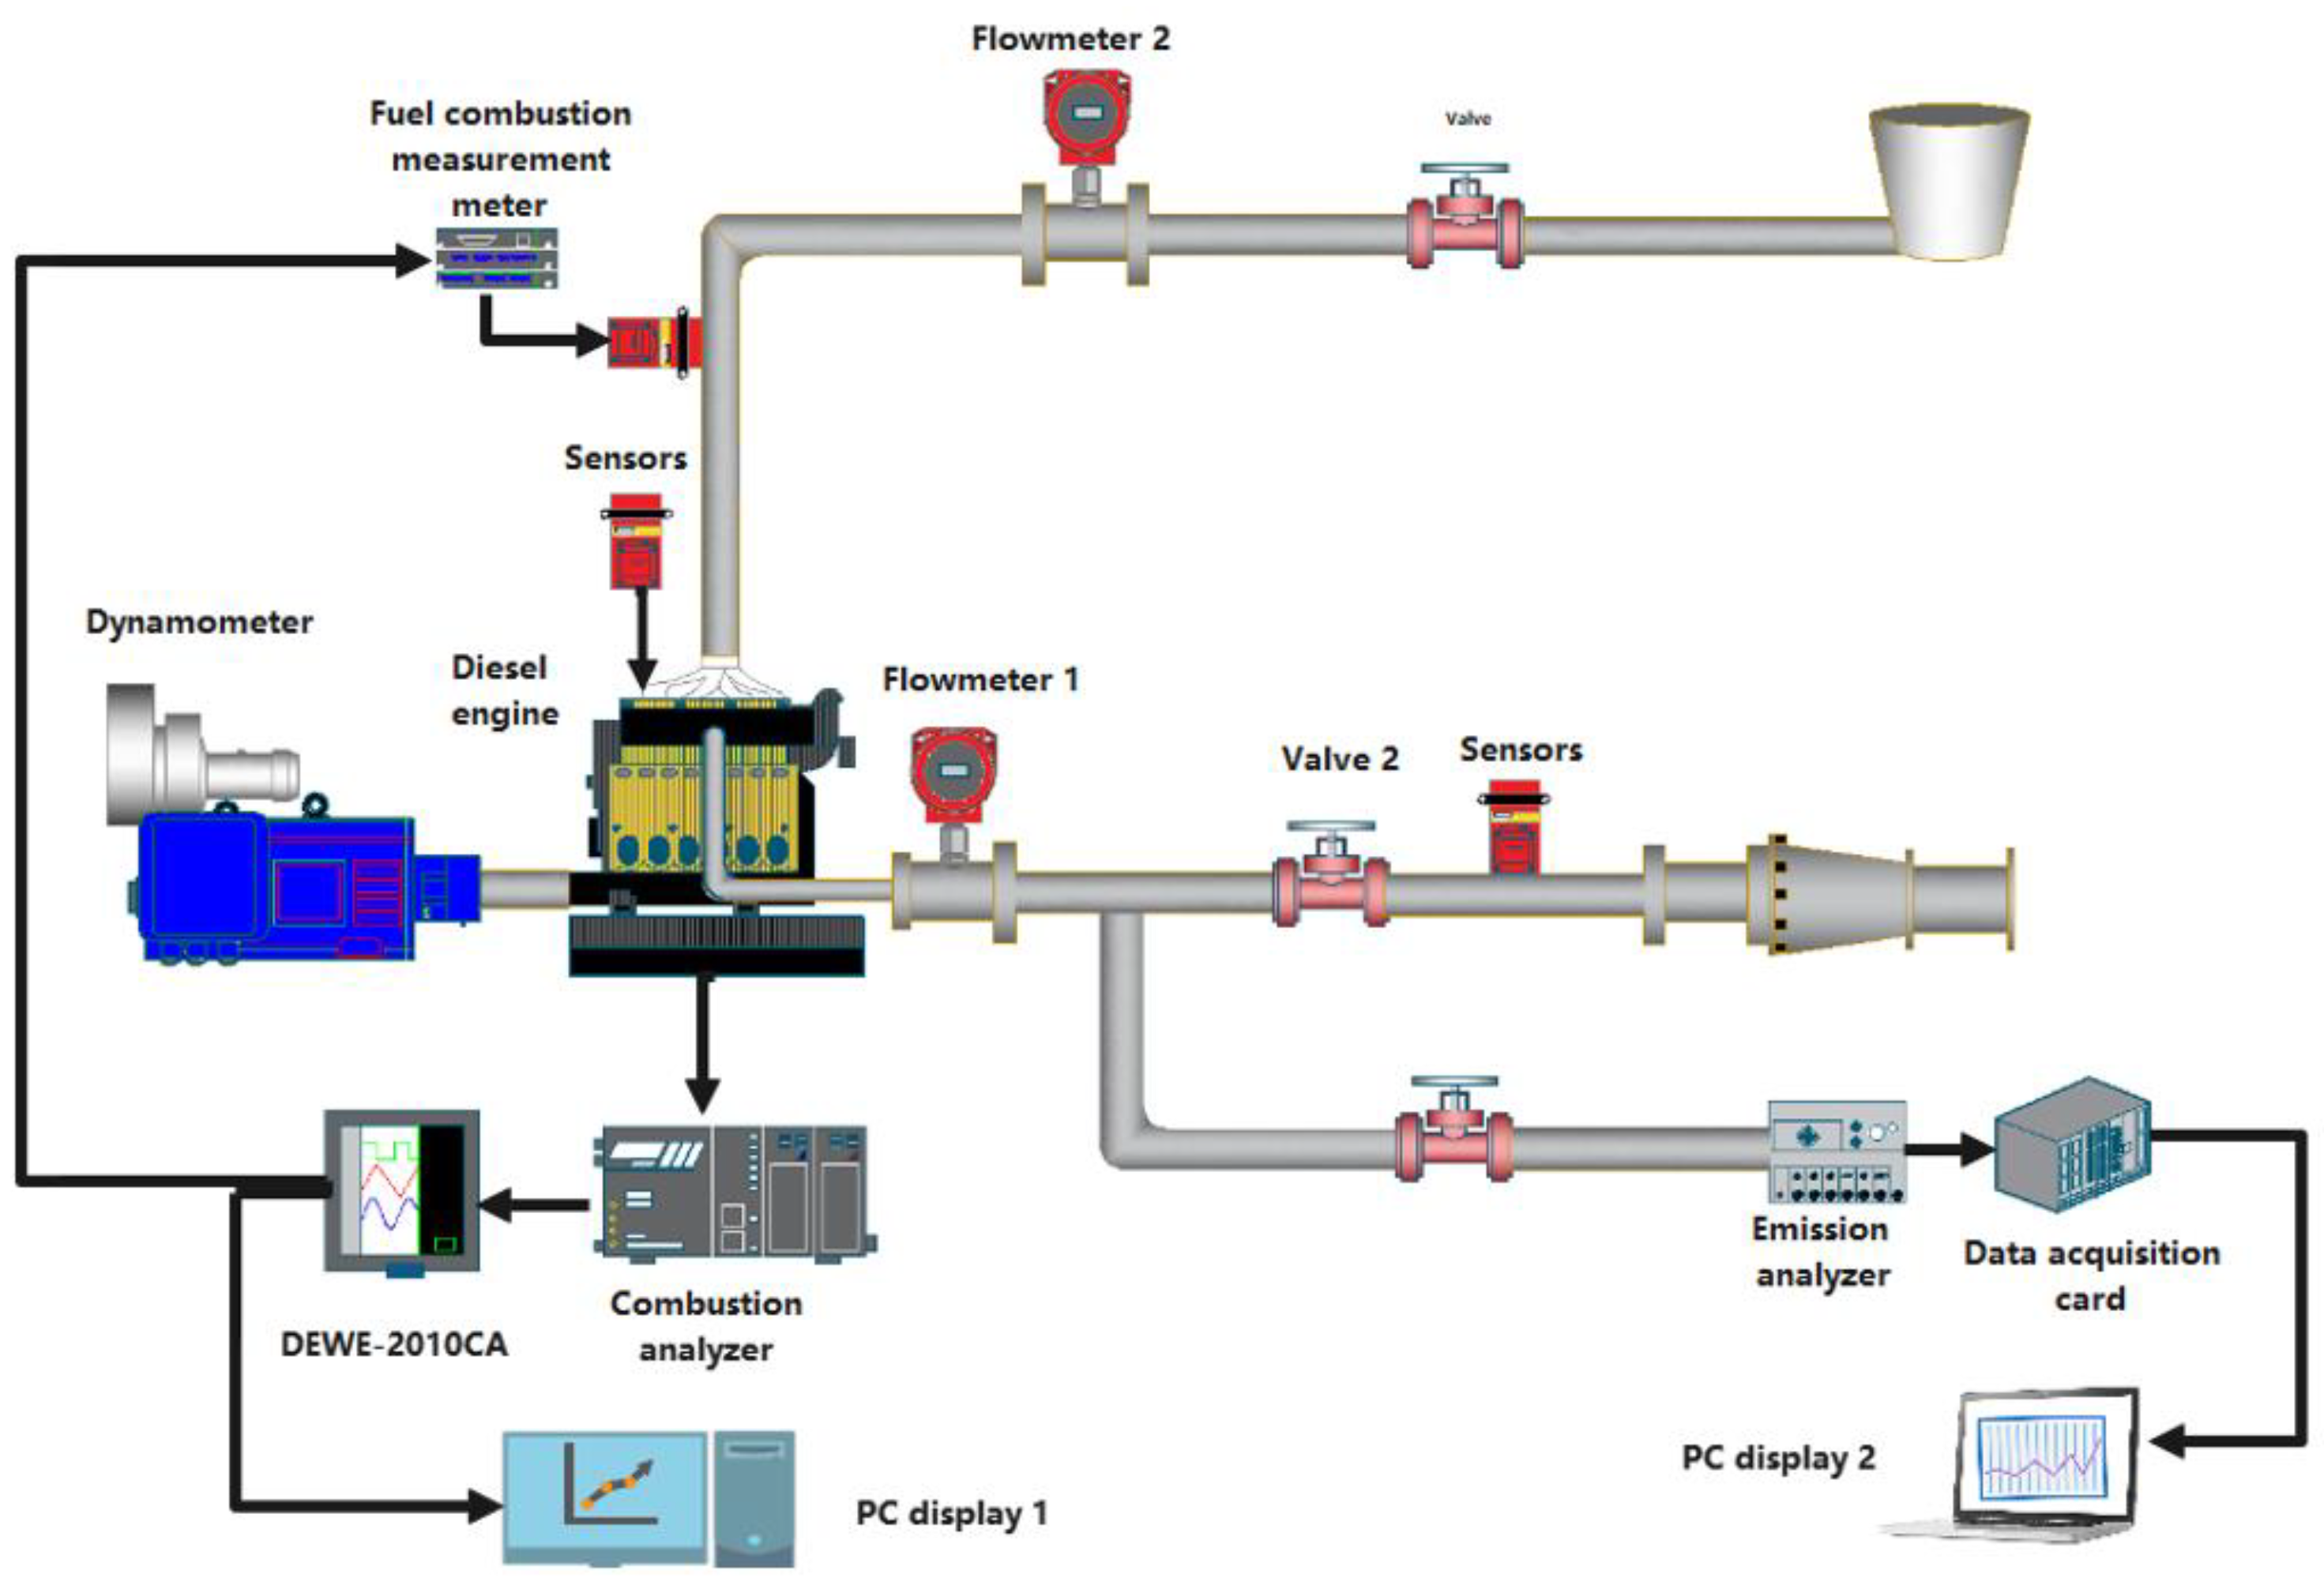
2.7. Fuel Sample Preparation
3. Results and Discussion
3.1. Combustion Characteristics
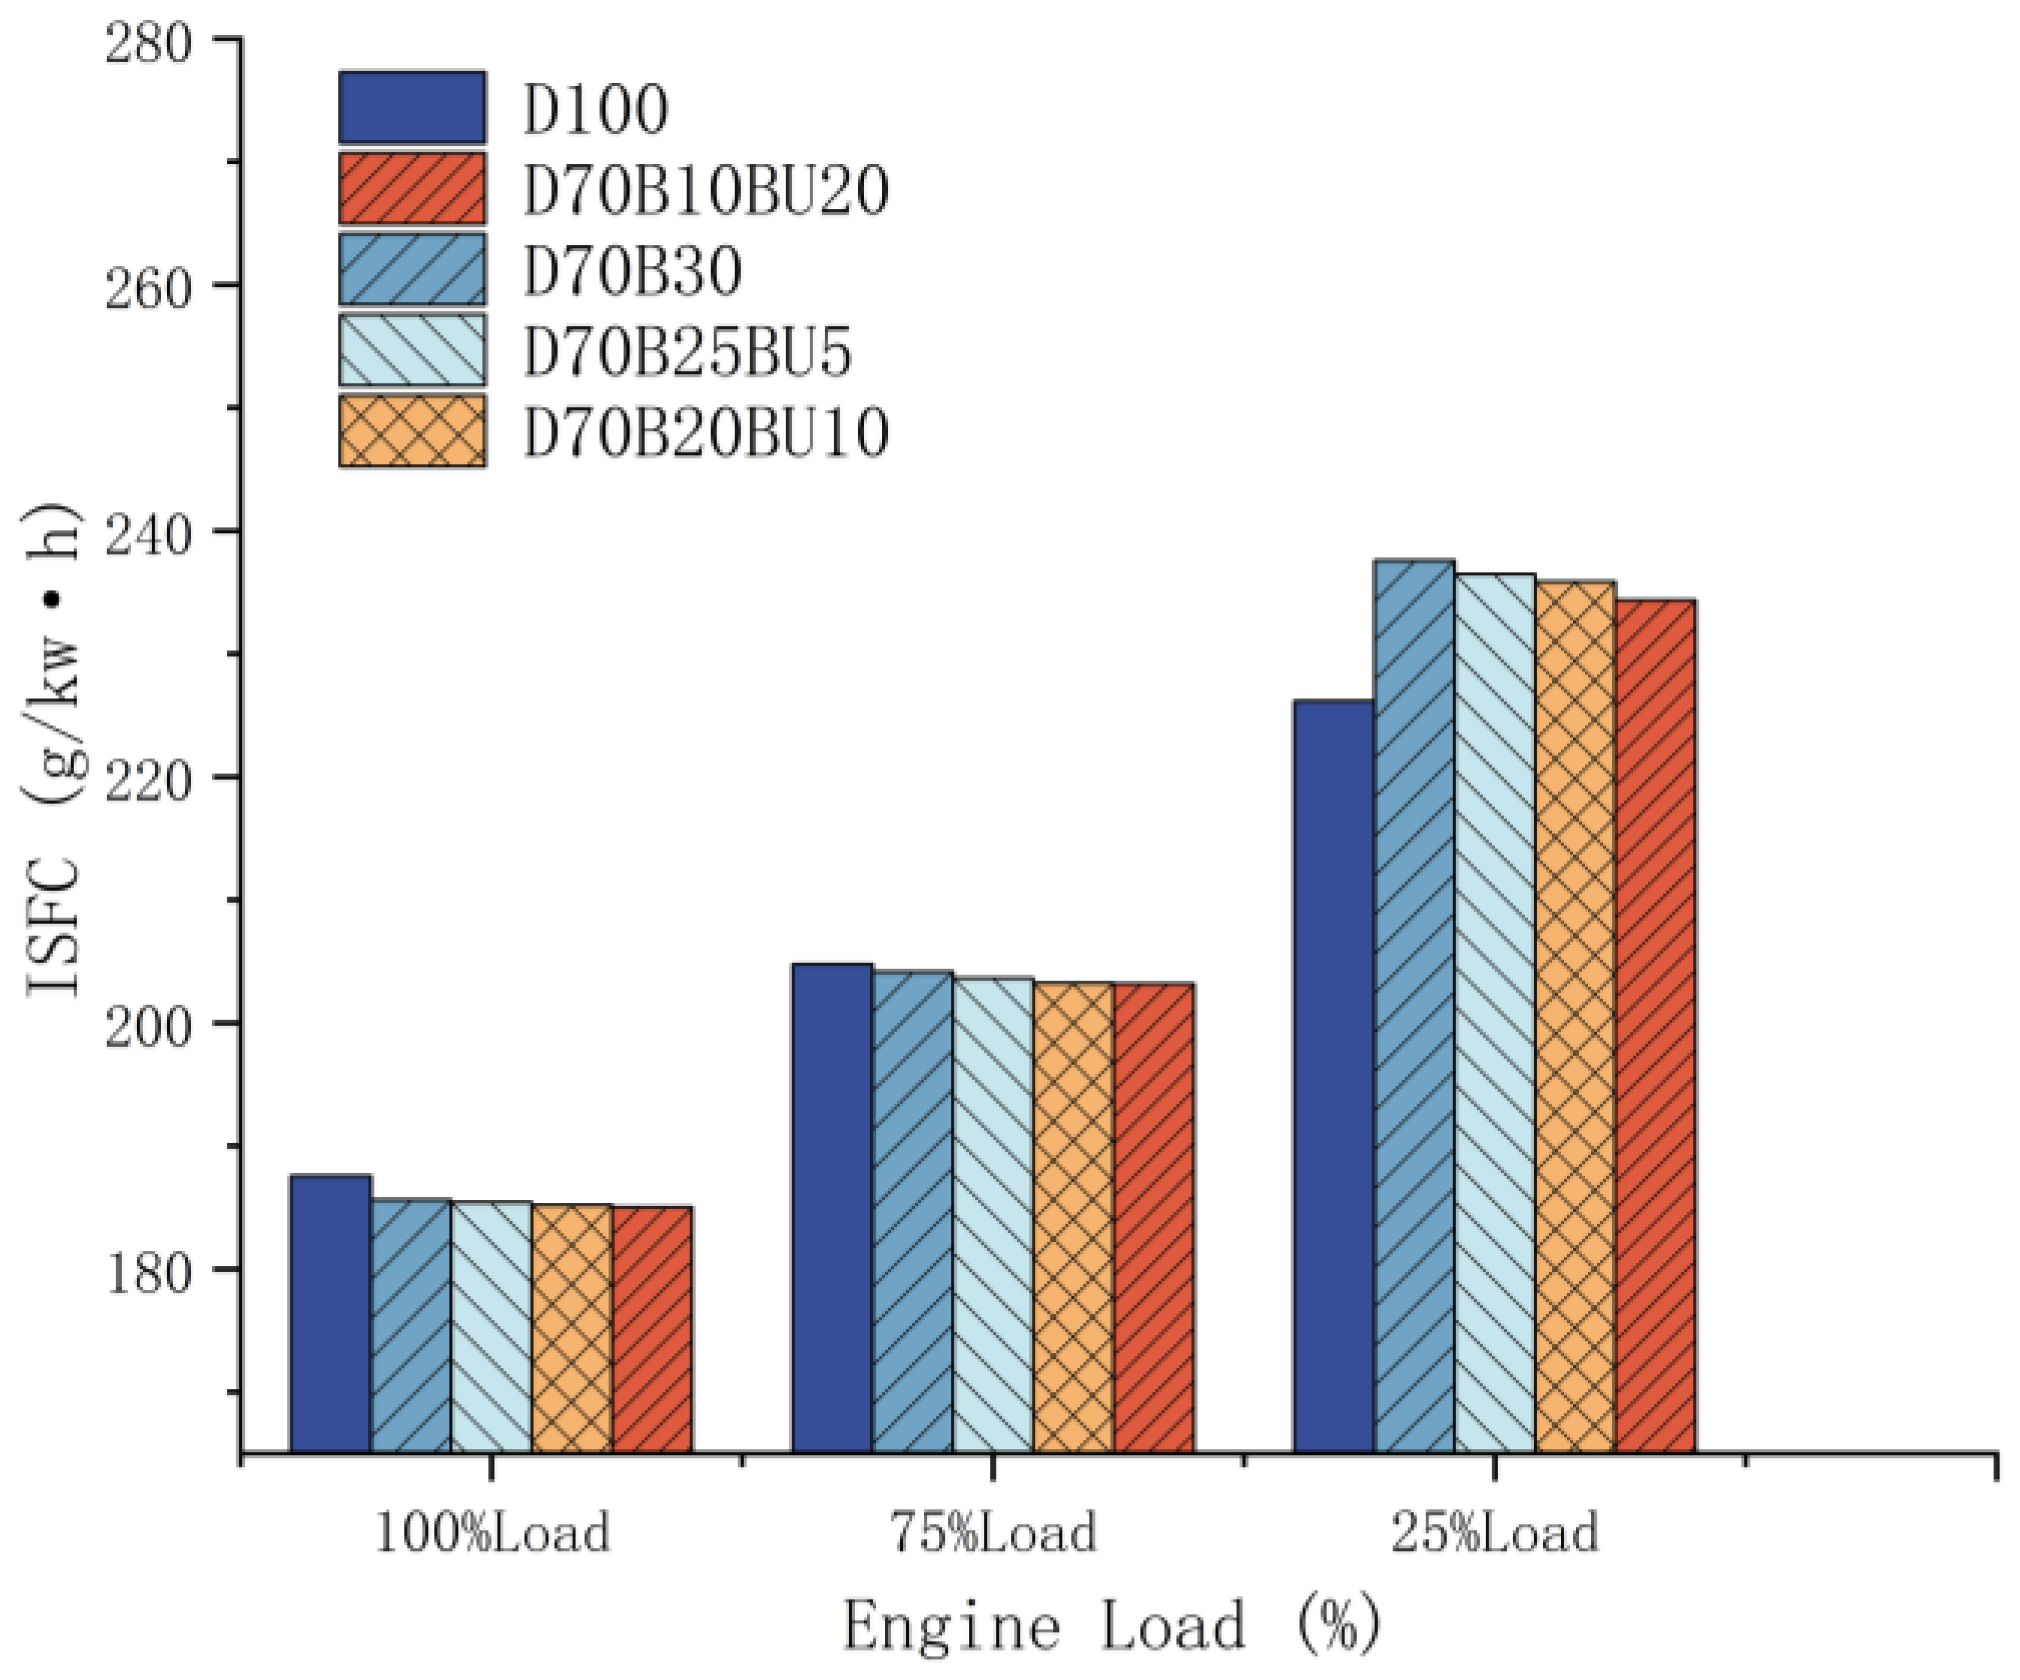
3.1.1. Indicated Specific Fuel Consumption
3.1.2. ITE
3.2. Combustion Characteristics
3.2.1. Cylinder Pressure
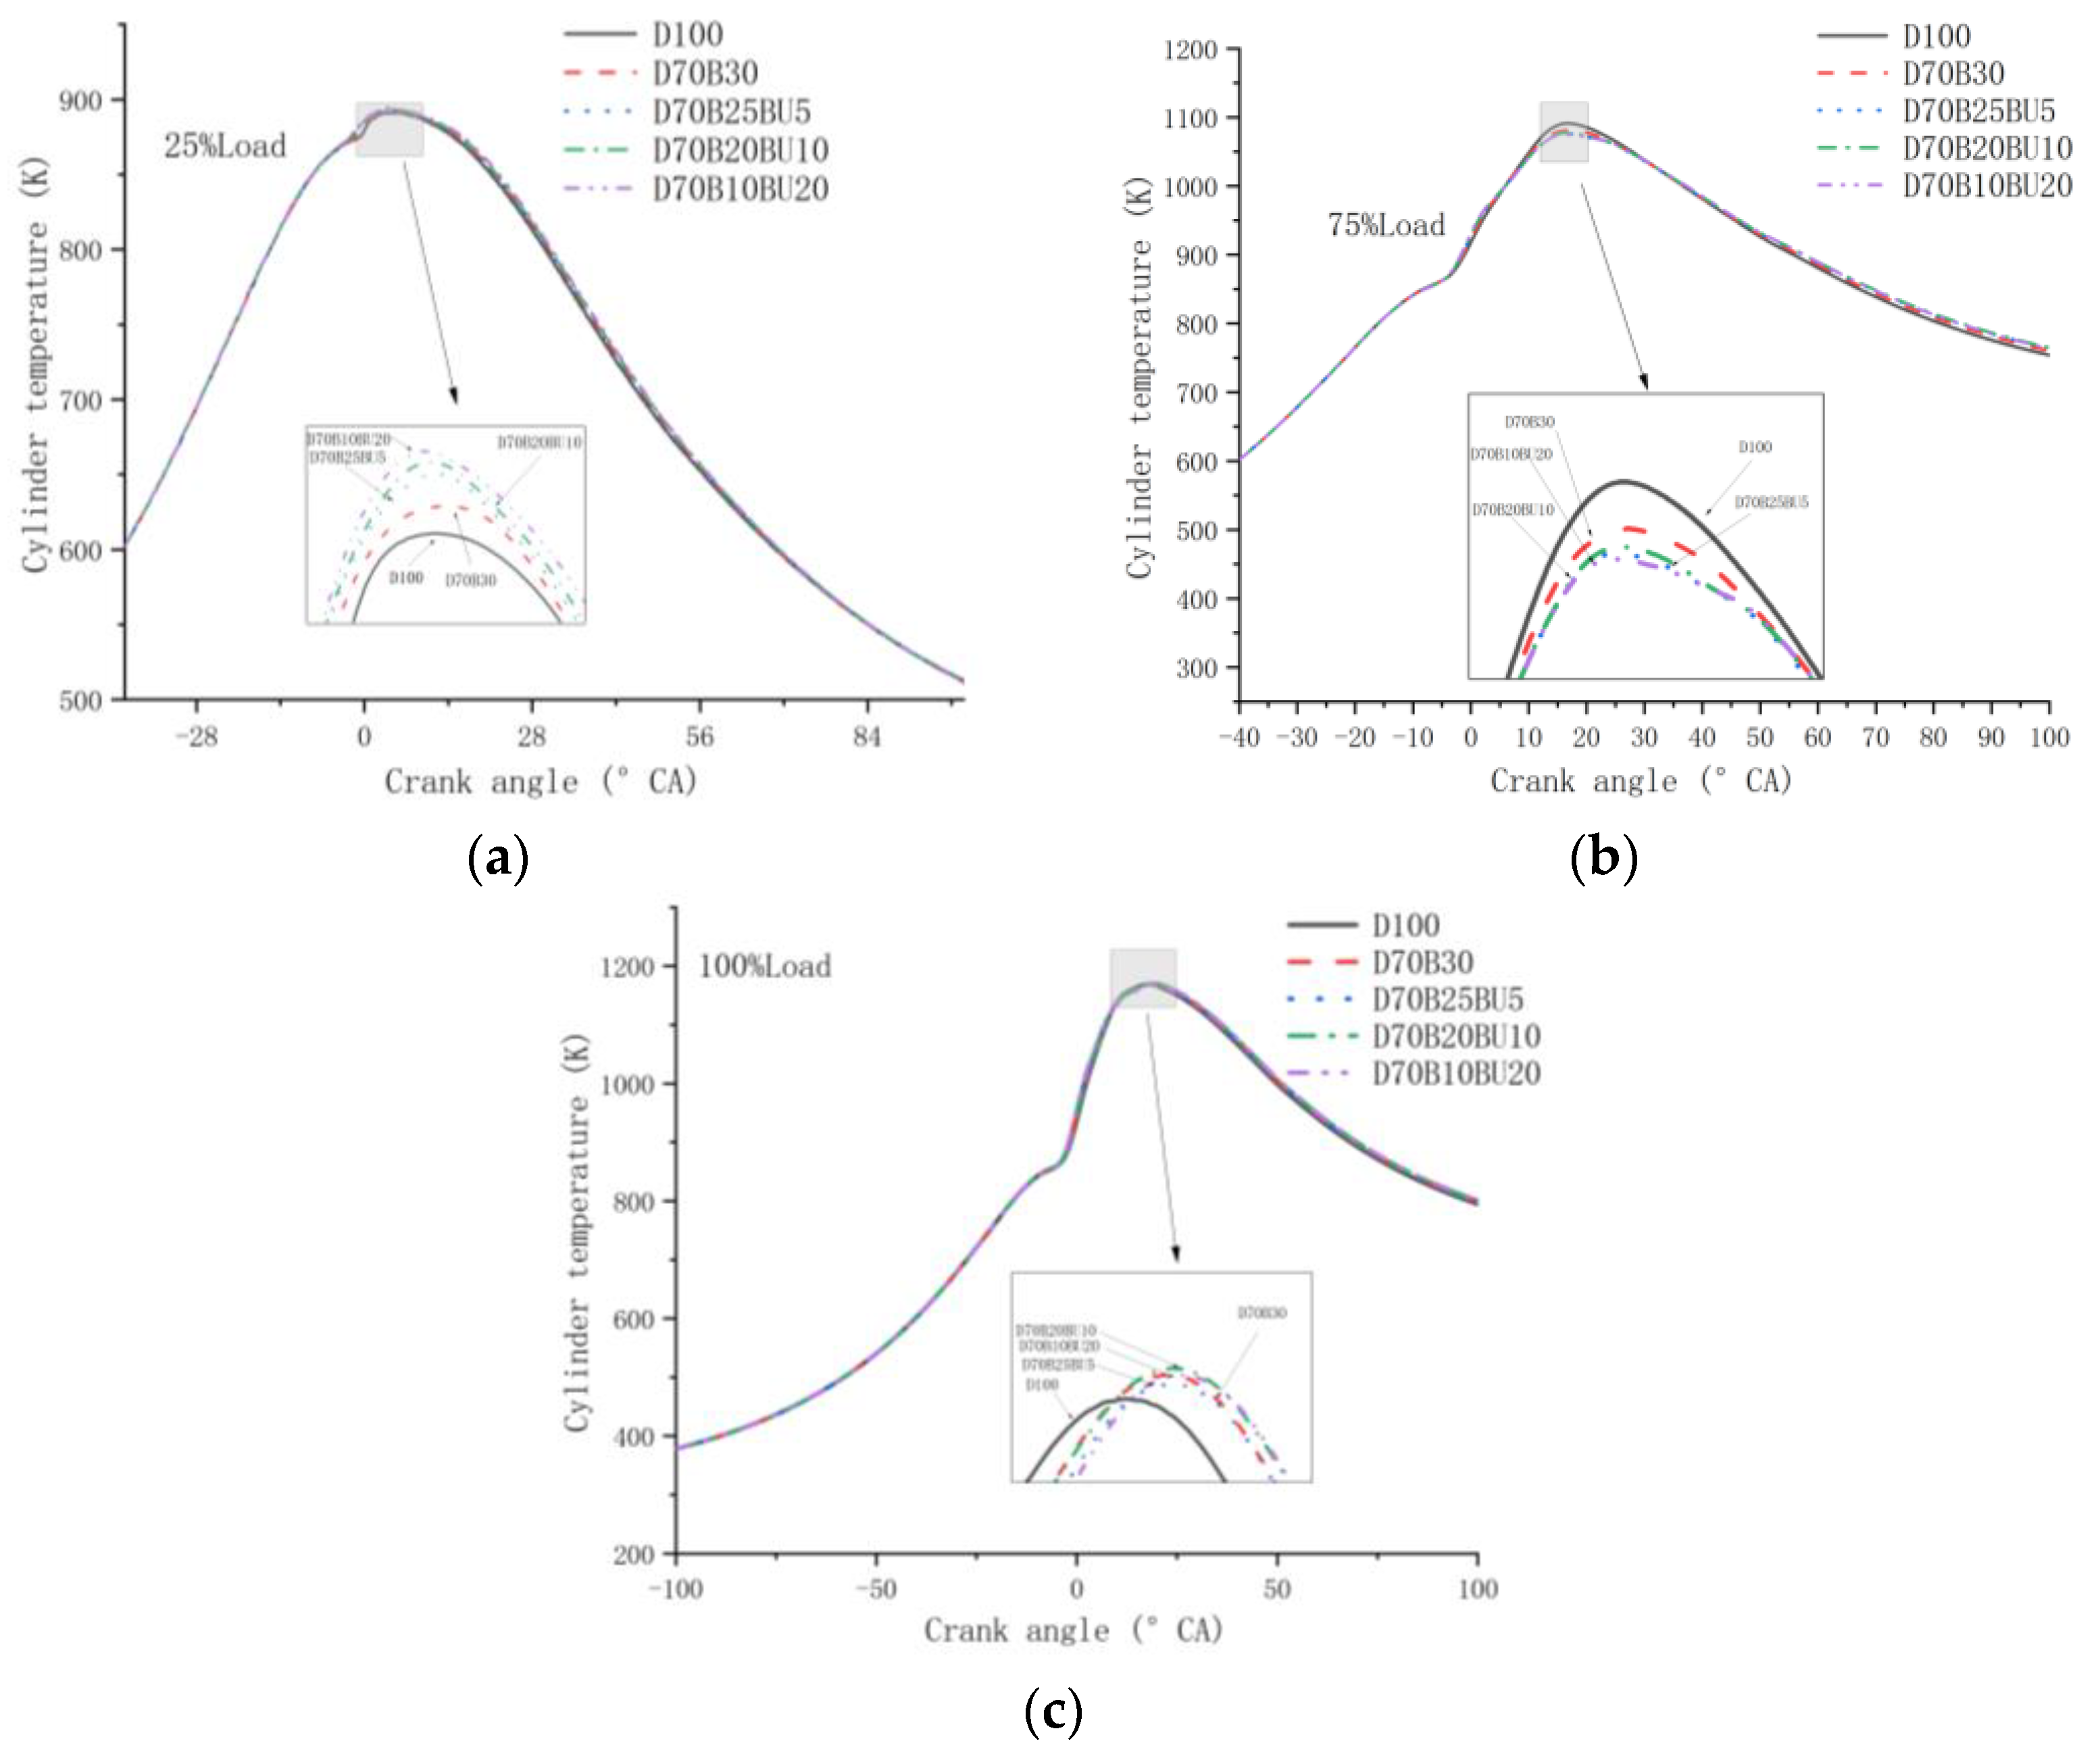
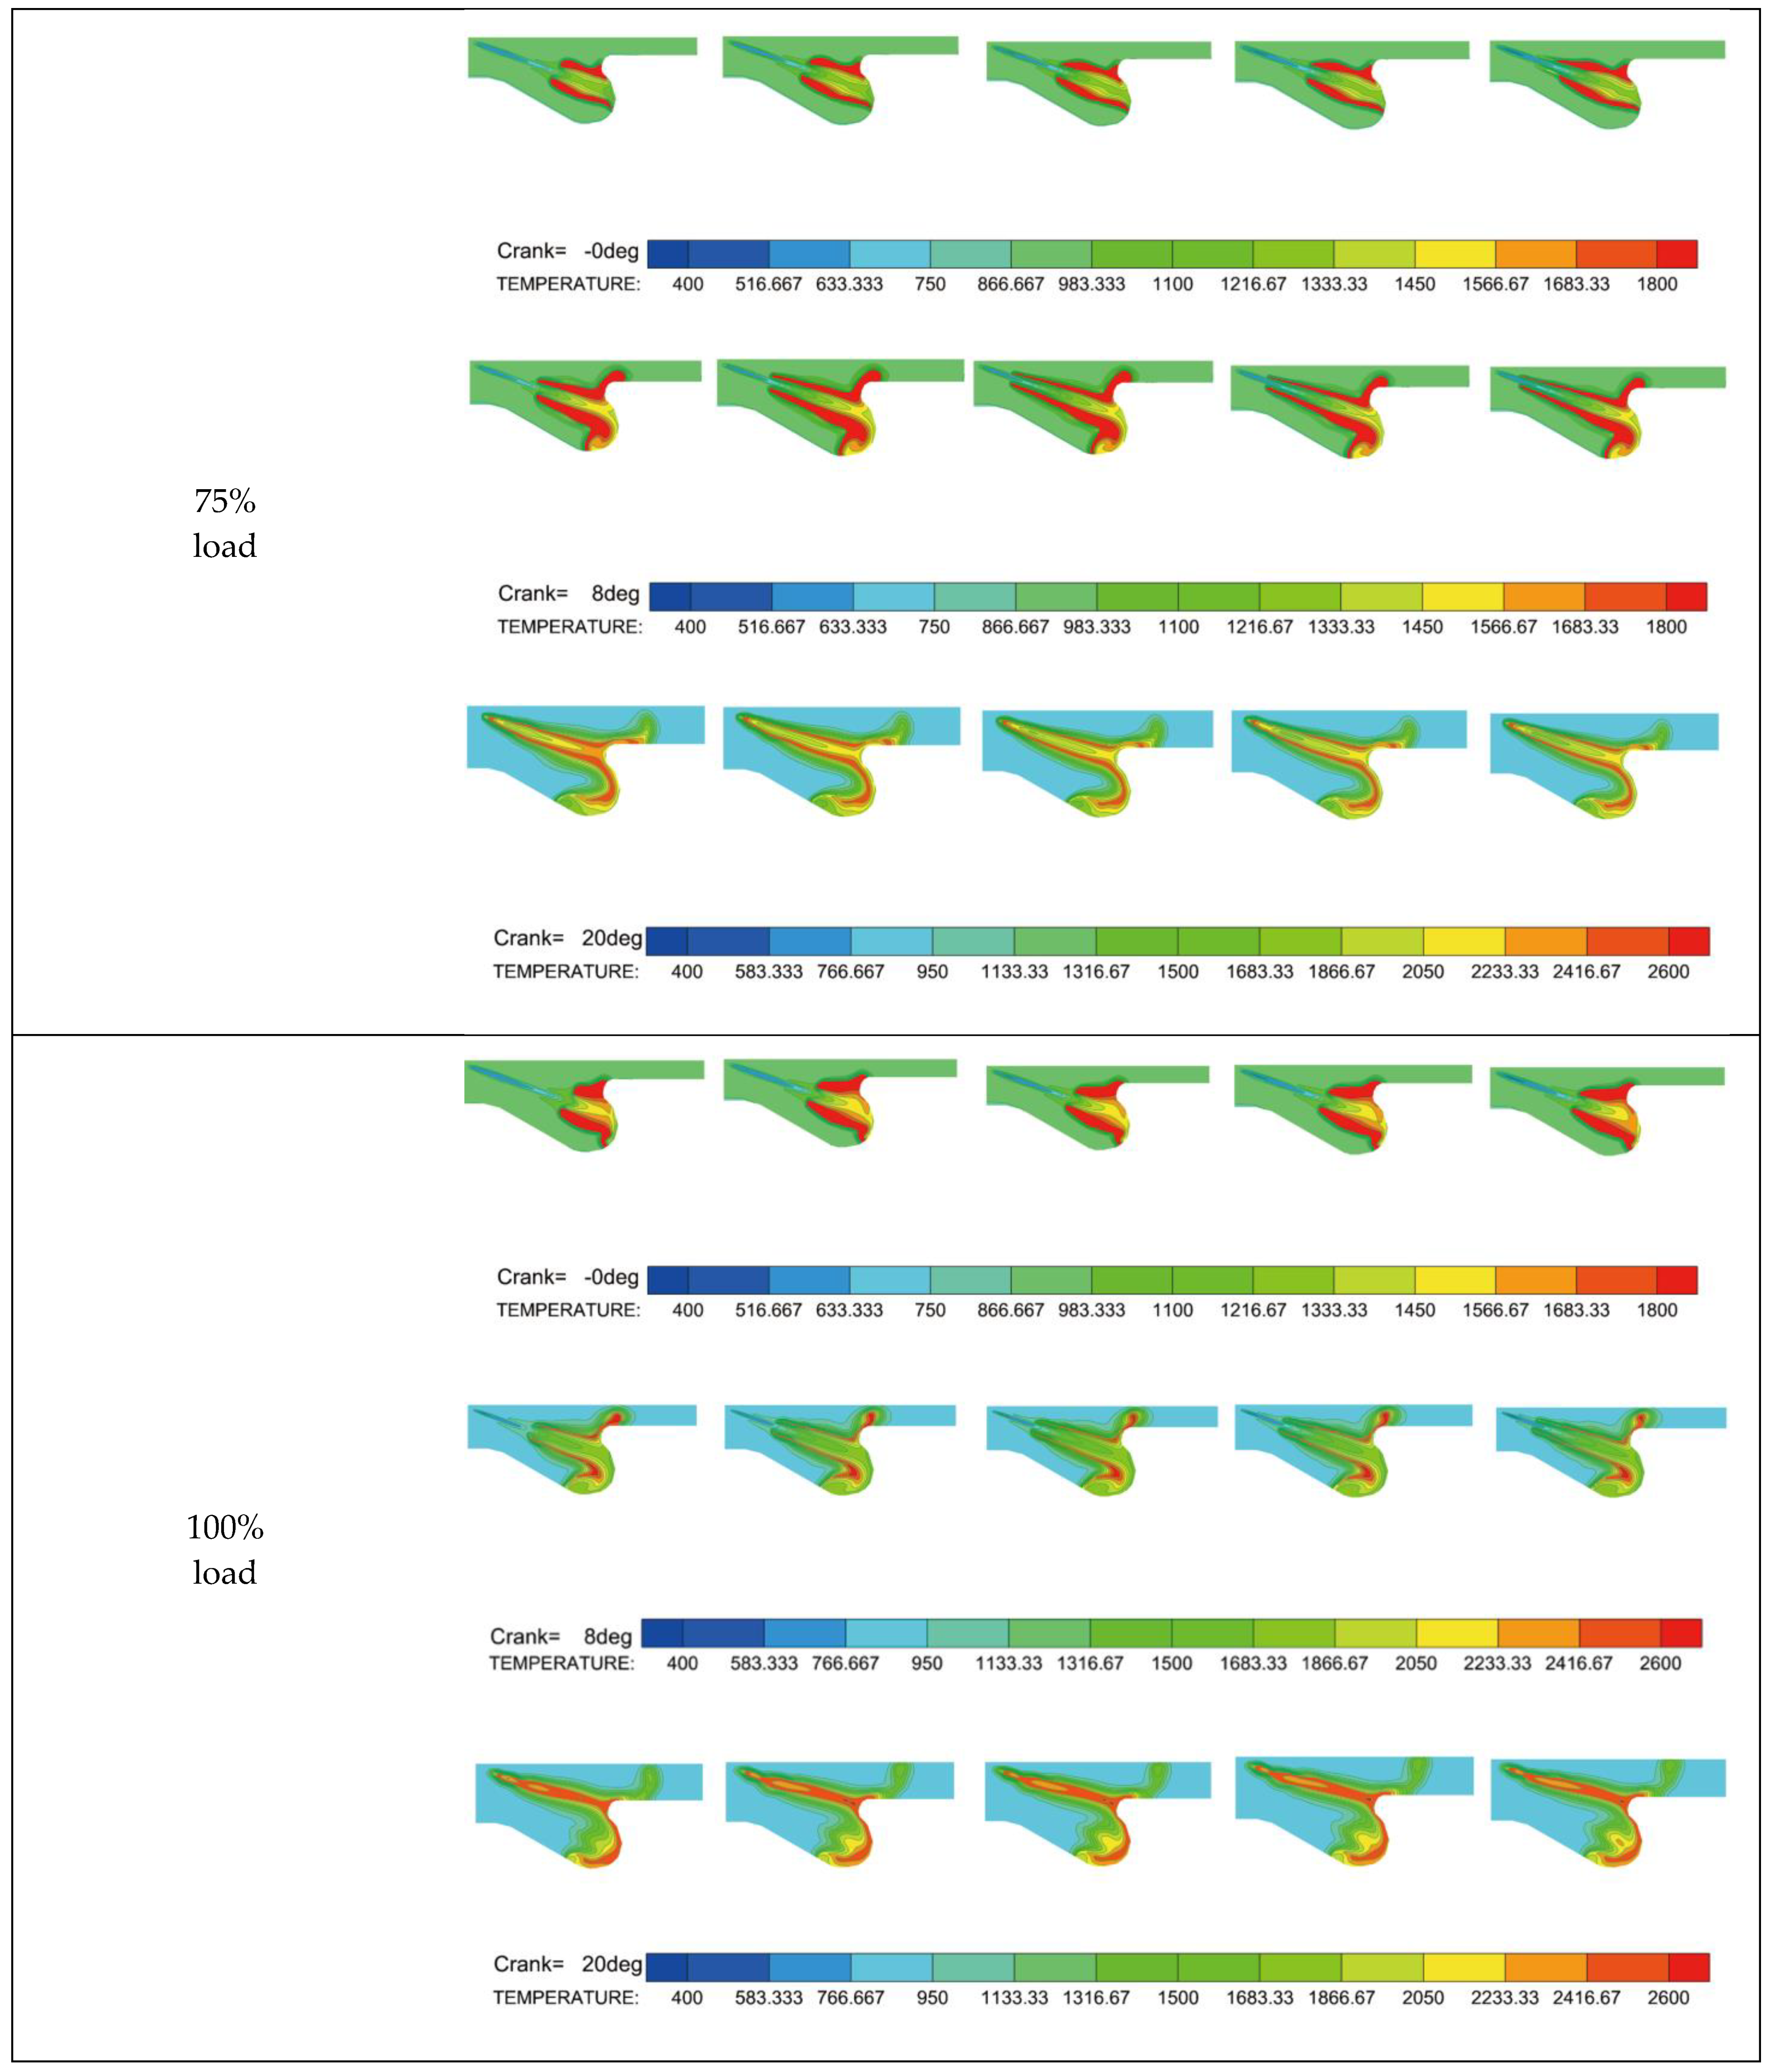
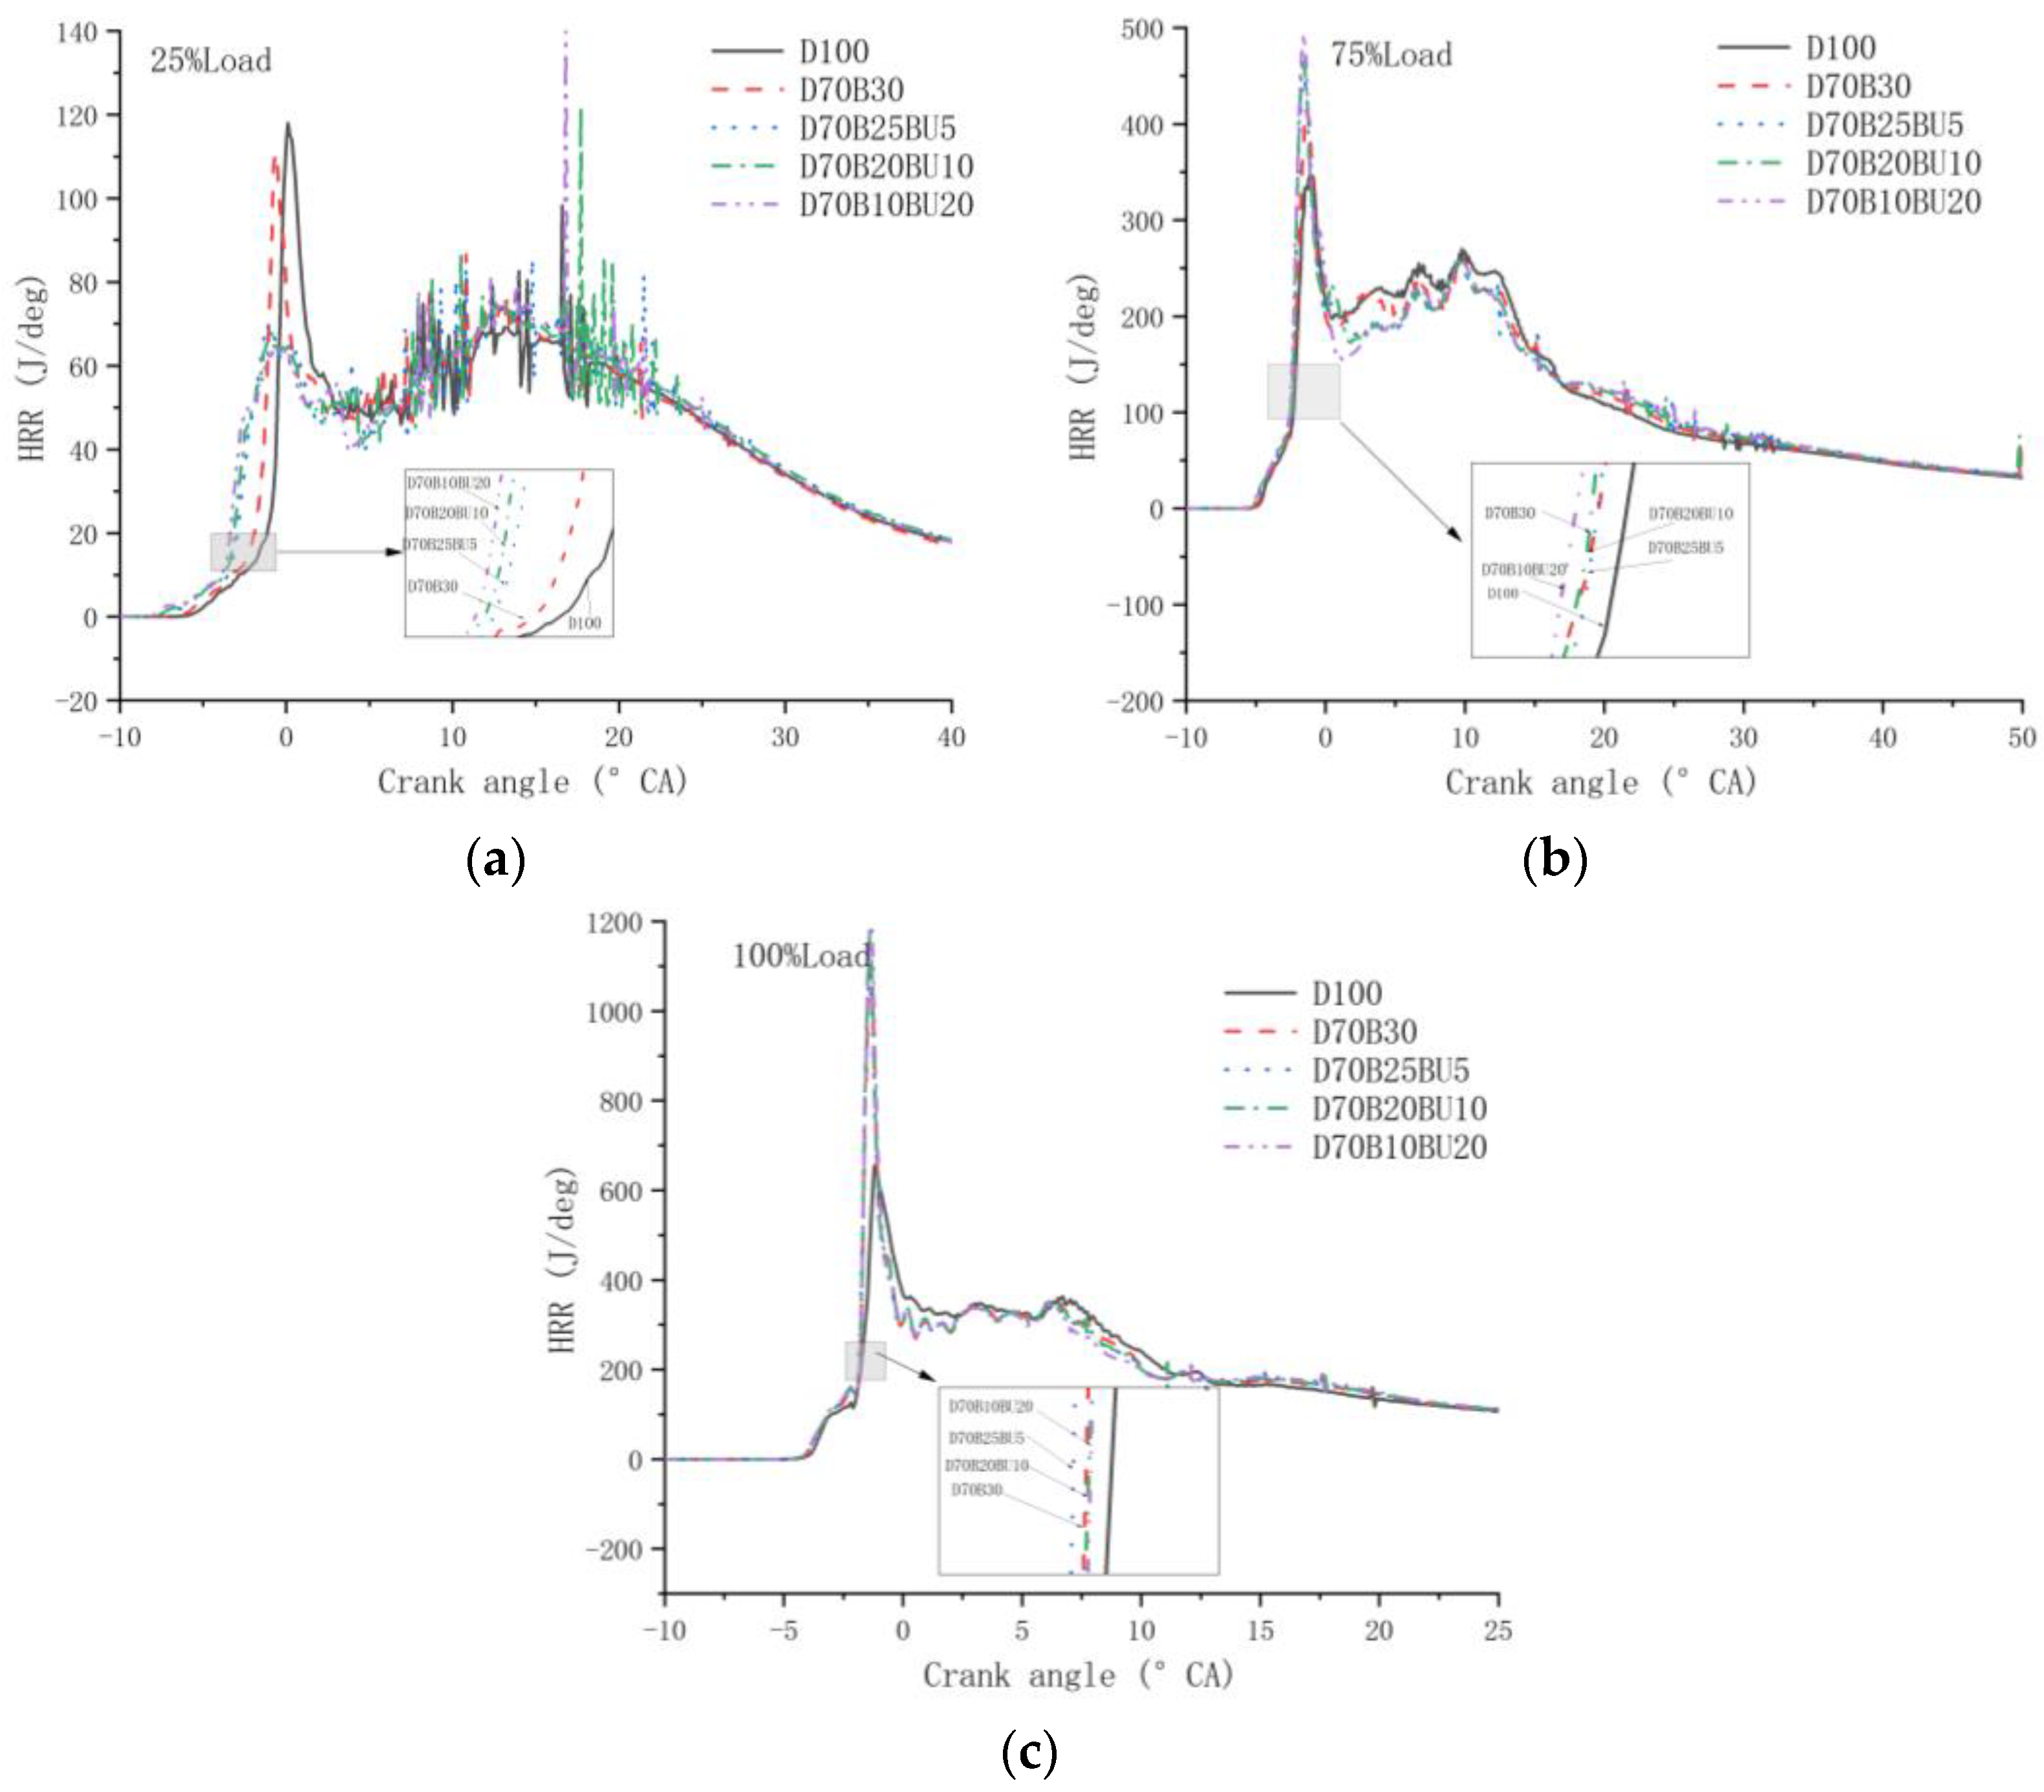
3.2.2. Cylinder Temperature and HRR
3.3. Emission Properties
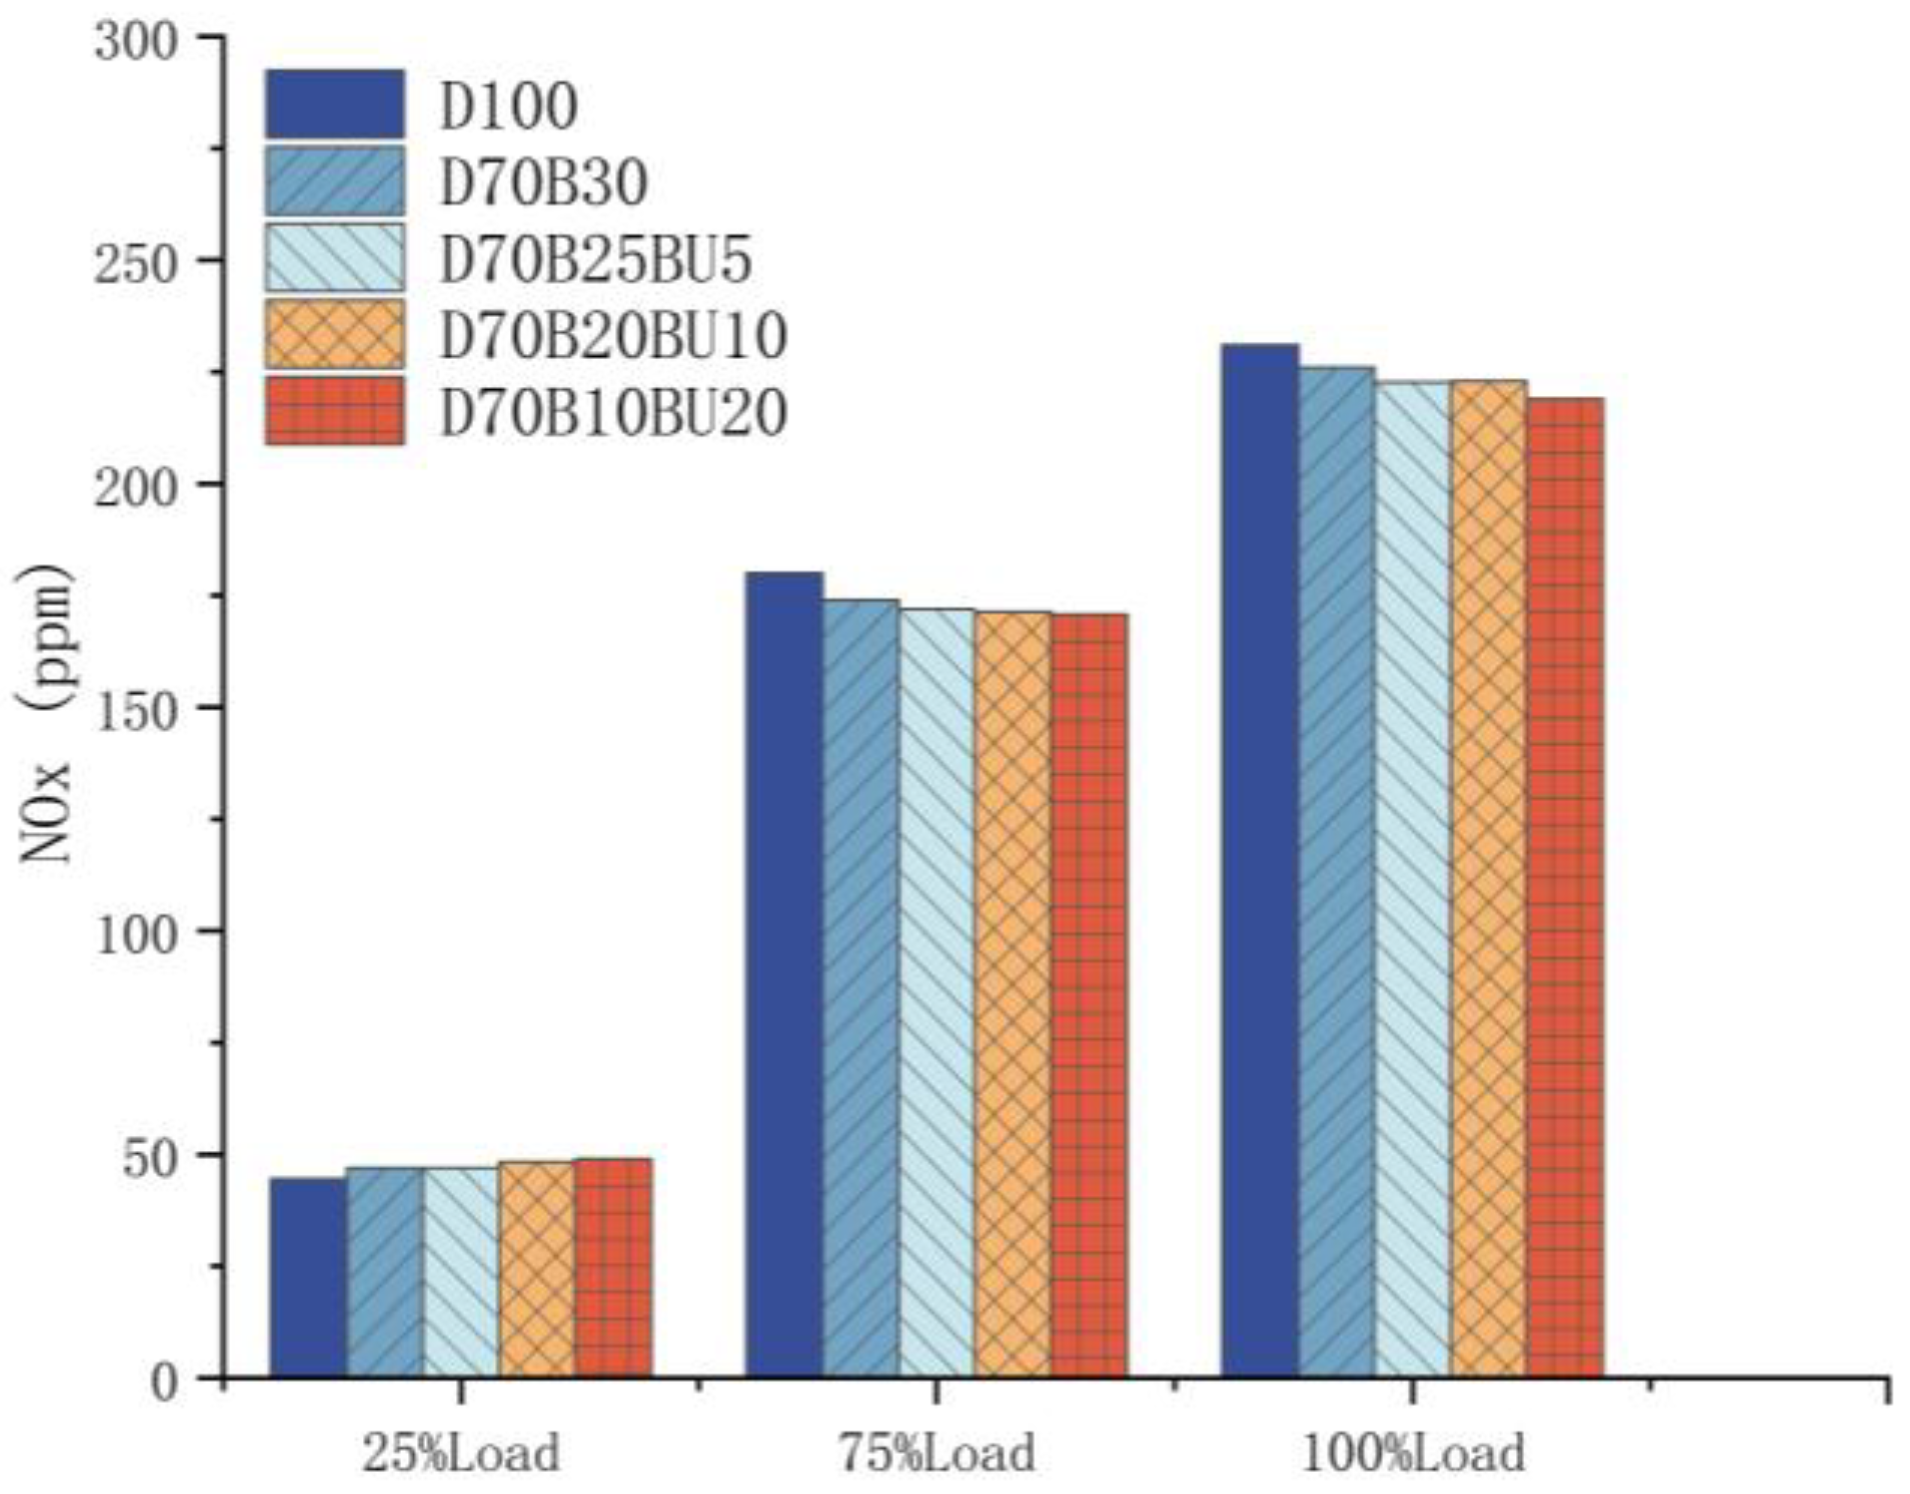
3.3.1. NOx Pollution
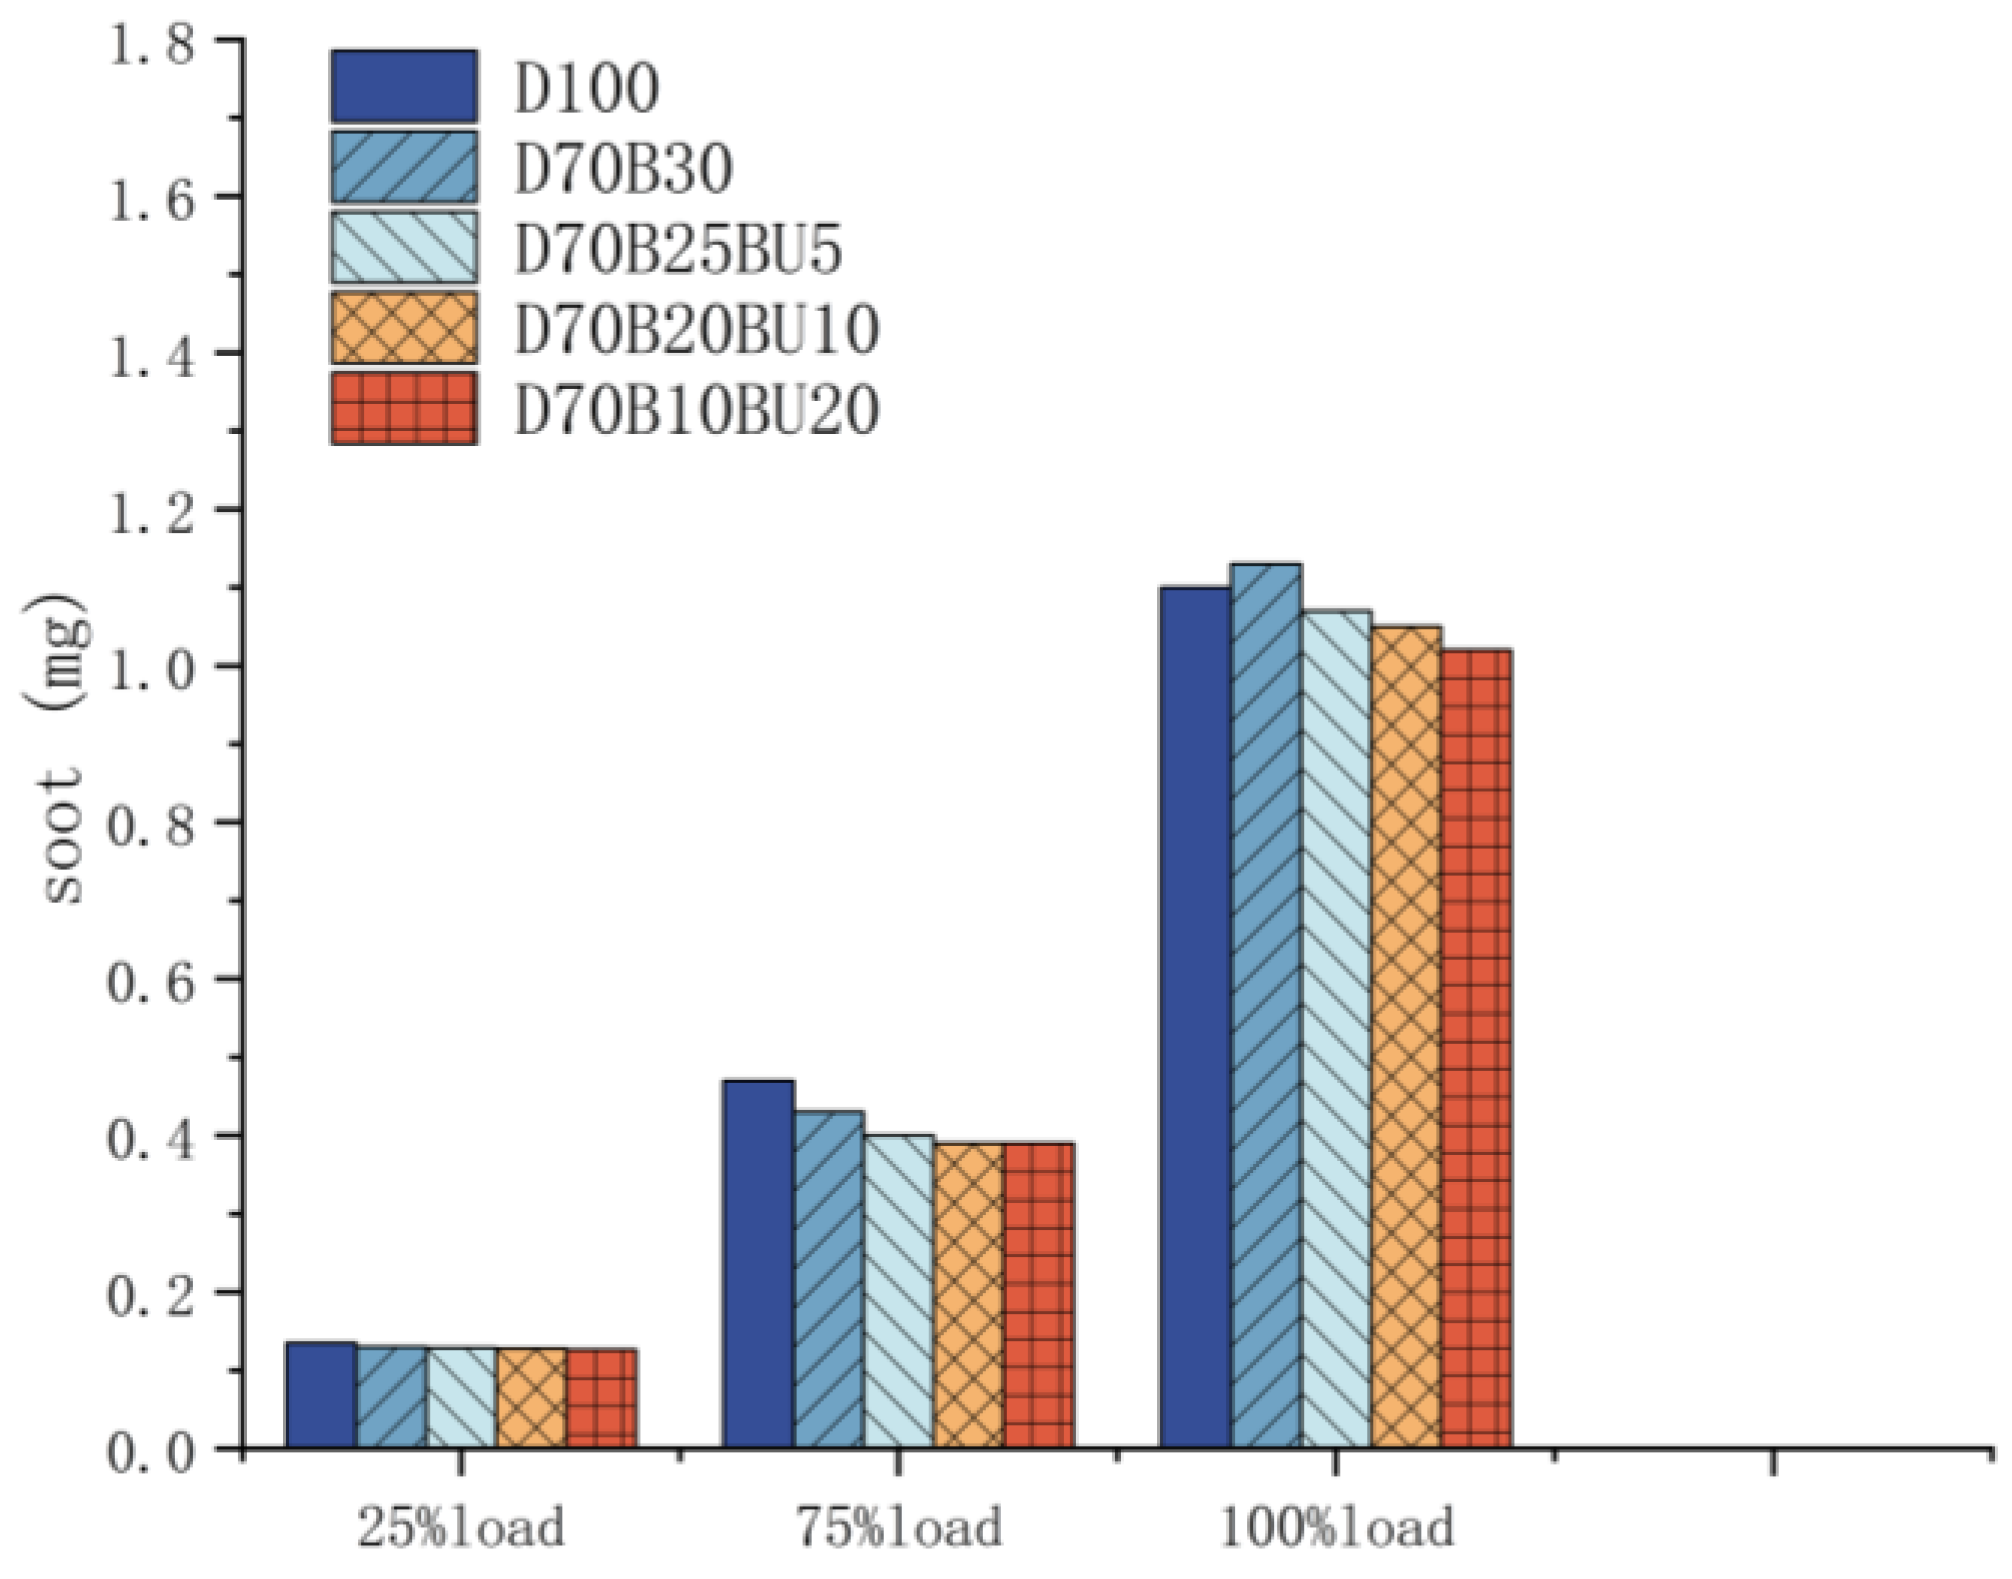
3.3.2. Soot Emission
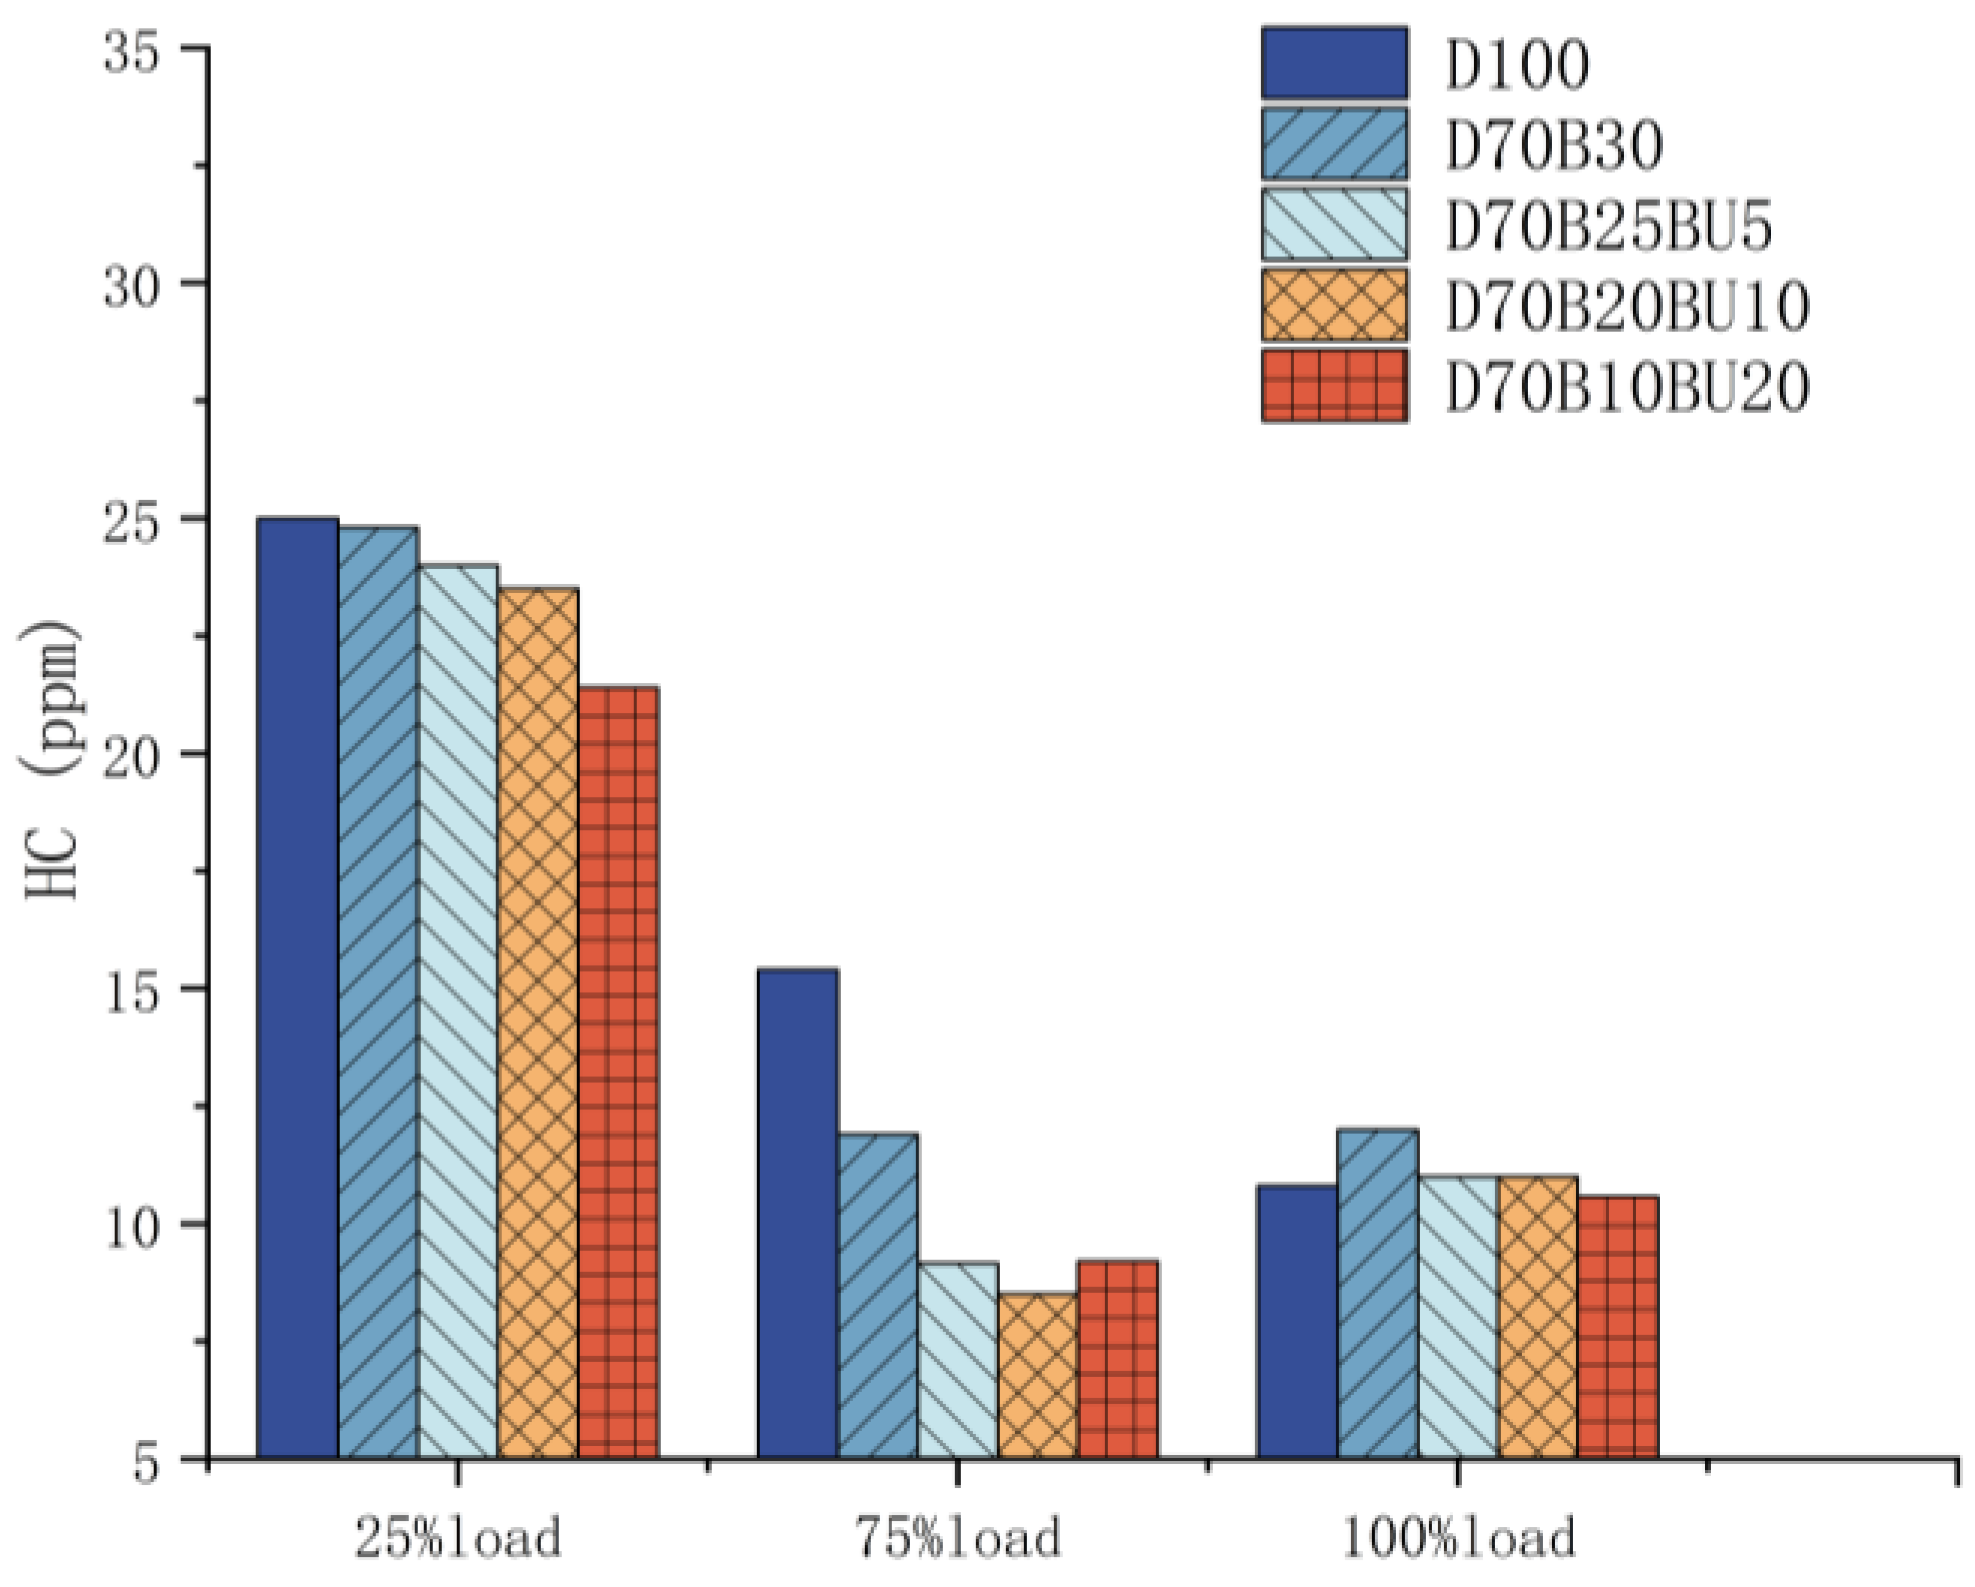
3.3.3. HC Emission
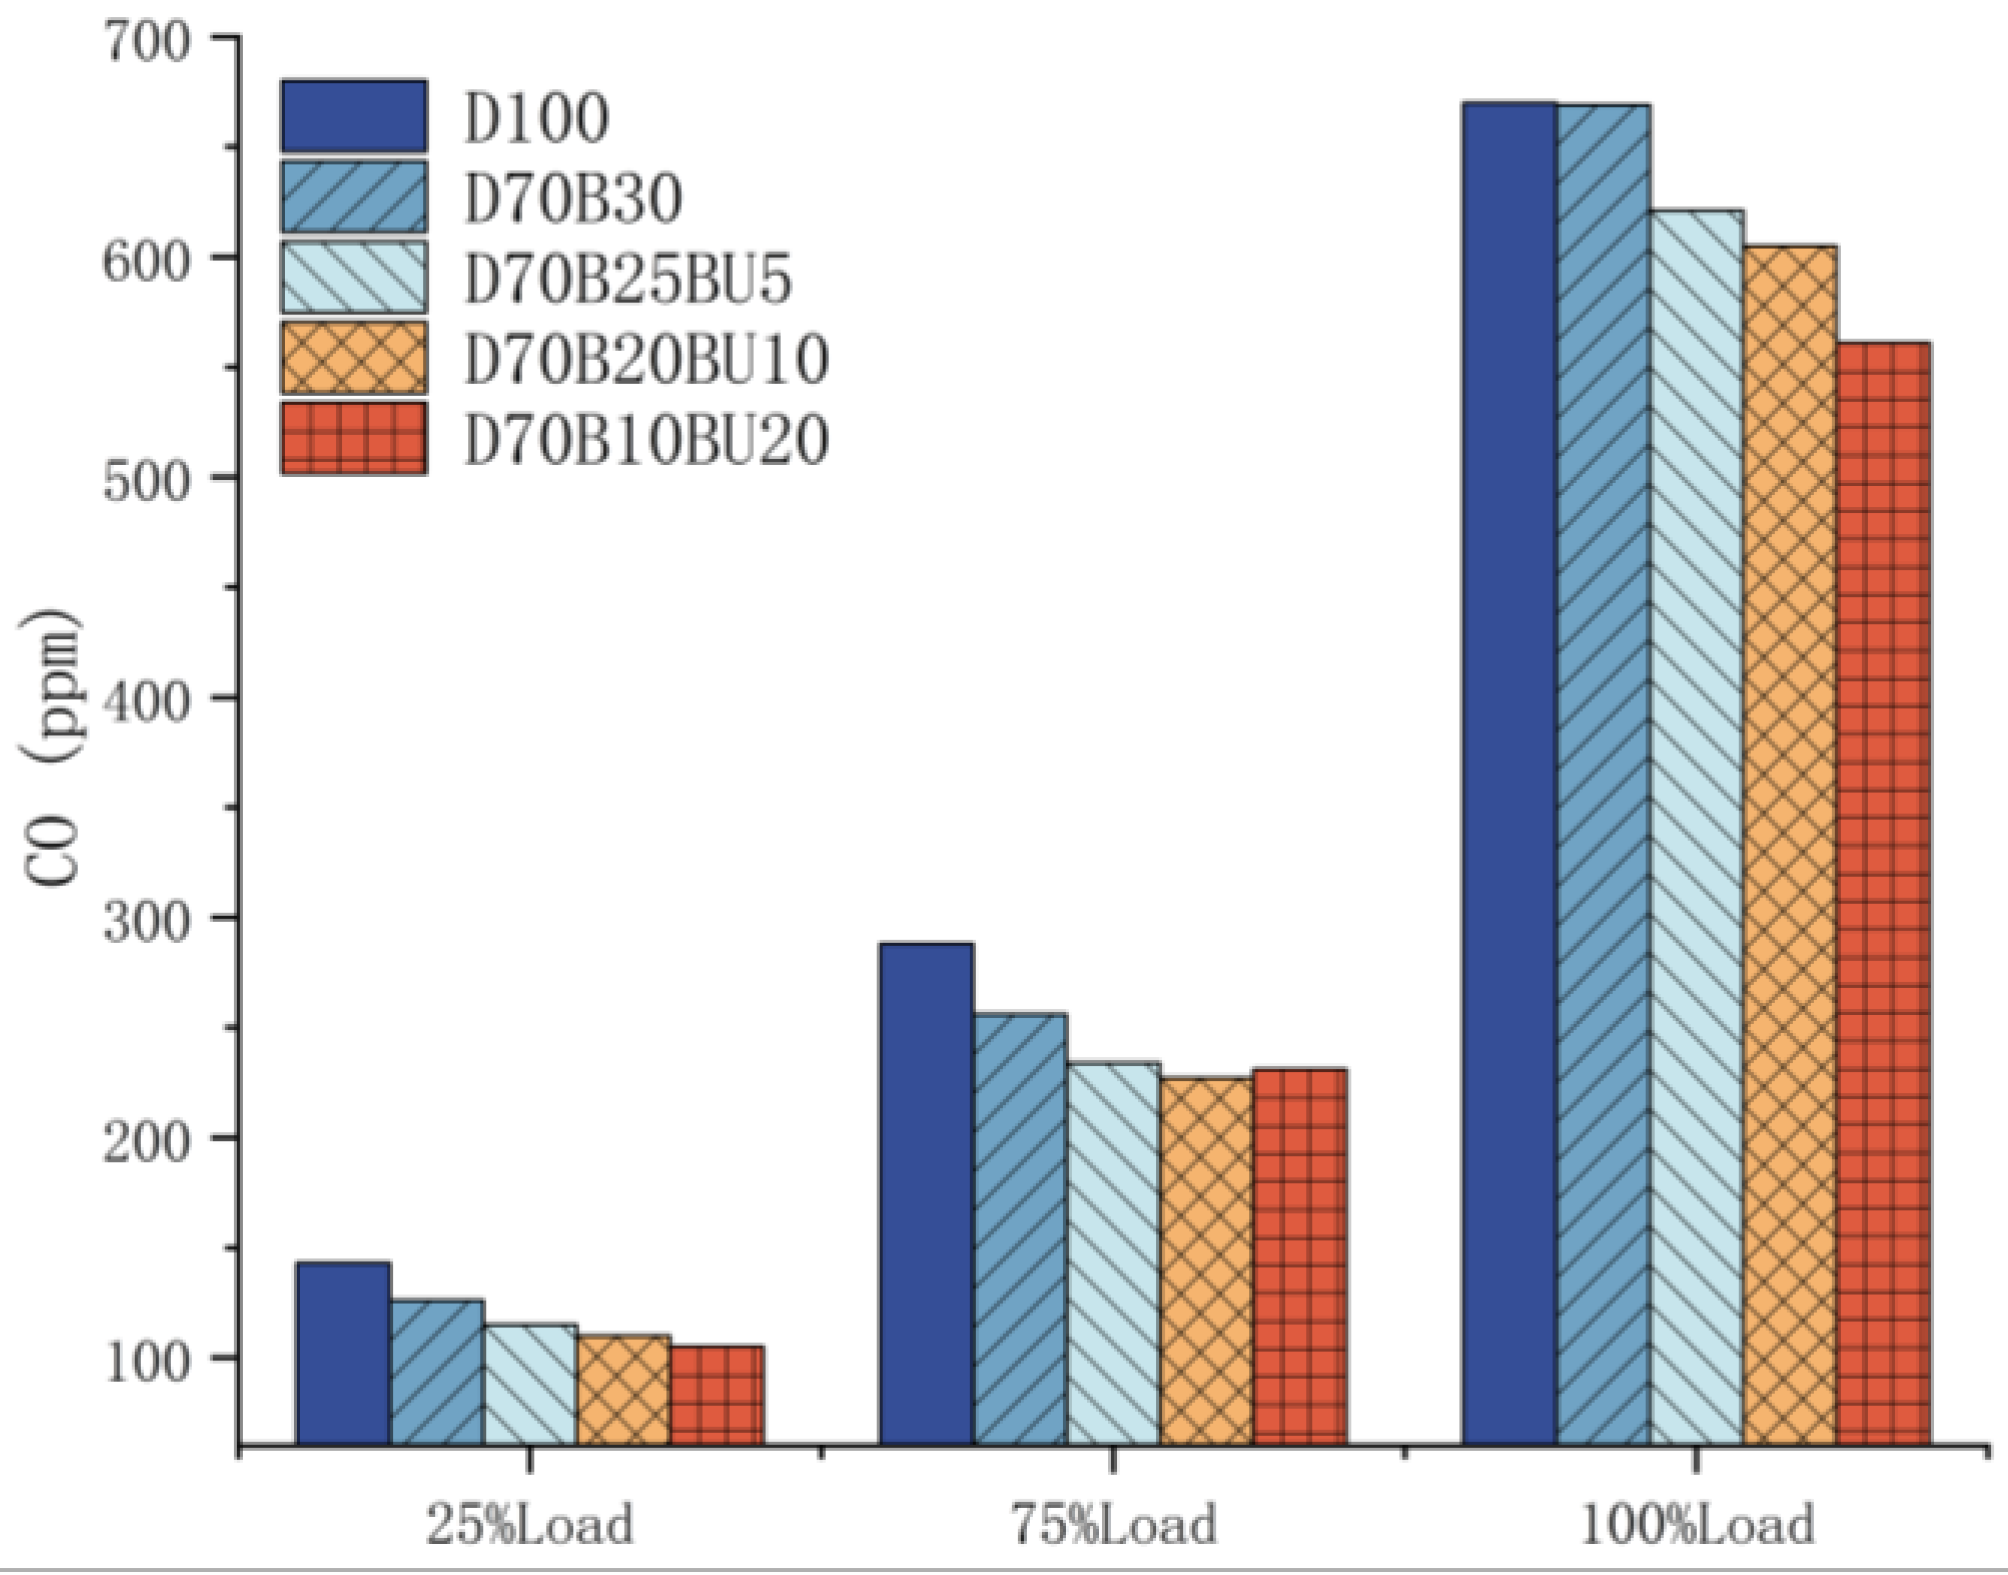
3.3.4. CO Emissions
4. Conclusions
- (1)
- At low loads, the fuel consumption rate of the blended fuel was marginally higher than that of pure diesel. The decrease in n-butanol content augmented the fuel consumption rate. However, the ITE of mixed fuels exceeded that of diesel. The incorporation of n-butanol had a positive effect on the ITE. At 100% load, the ITEs of D70B30, D70B25BU5, D70B20BU10, and D70B10BU20 were 4.76%, 5.75%, 6.79%, and 8.71% higher than that of diesel, respectively.
- (2)
- The mixed fuels reduced NOx and soot emissions during high-load operating situations compared with diesel. During high-load situations, the addition of n-butanol can decrease marginally NOx and soot emissions.
- (3)
- The mixed fuels reduced HC and CO emissions. At 25% load, D70B30, D70B25BU5, D70B20BU10, and D70B10BU20 had 1%, 4%, 6%, and 15% lower HC emissions than diesel, respectively.
Author Contributions
Funding
Data Availability Statement
Acknowledgments
Conflicts of Interest
References
- Temizer, İ.; Cihan, Ö.; Eskici, B. Numerical and experimental investigation of the effect of biodiesel/diesel fuel on combustion characteristics in CI engine. Fuel 2020, 270, 117523. [Google Scholar] [CrossRef]
- Elkelawy, M.; Kabeel, A.E.; El Shenawy, E.A.; Panchal, H.; Elbanna, A.; Bastawissi, H.A.-E.; Sadasivuni, K.K. Experimental investigation on the influences of acetone organic compound additives into the diesel/biodiesel mixture in CI engine. Sustain. Energy Technol. Assess. 2020, 37, 100614. [Google Scholar] [CrossRef]
- Malmodin, J.; Bergmark, P. Exploring the effect of ICT solutions on GHG emissions in 2030. In Proceedings of the EnviroInfo and ICT for Sustainability 2015, Copenhagen, Denmark, 7–9 September 2015; pp. 37–46. [Google Scholar]
- Hasan, M.M.; Rahman, M.M. Performance and emission characteristics of biodiesel–diesel blend and environmental and economic impacts of biodiesel production: A review. Renew. Sustain. Energy Rev. 2017, 74, 938–948. [Google Scholar] [CrossRef]
- Achakulwisut, P.; Erickson, P. Trends in Fossil Fuel Extraction; SEI: Stockholm, Sweden, 2021. [Google Scholar]
- Ramesh, T.; Sathiyagnanam, A.P.; De Poures, M.V.; Murugan, P. Combined Effect of Compression Ratio and Fuel Injection Pressure on CI Engine Equipped with CRDi System Using Prosopis juliflora Methyl Ester/Diesel Blends. Int. J. Chem. Eng. 2022, 2022, 4617664. [Google Scholar] [CrossRef]
- Ramesh, T.; Sathiyagnanam, A.P.; Poures, M.V.D.; Murugan, P. A Comprehensive Study on the Effect of Dimethyl Carbonate Oxygenate and EGR on Emission Reduction, Combustion Analysis, and Performance Enhancement of a CRDI Diesel Engine Using a Blend of Diesel and Prosopis juliflora Biodiesel. Int. J. Chem. Eng. 2022, 2022, 5717362. [Google Scholar] [CrossRef]
- Singh, R.; Kumar, R. Insights into the influence of n-butanol with neat biodiesel and biodiesel-diesel blends on diesel engine characteristics: Review. Int. J. Energy Res. 2022, 46, 5441–5466. [Google Scholar] [CrossRef]
- Tat, M.E.; Van Gerpen, J.H. The kinematic viscosity of biodiesel and its blends with diesel fuel. J. Am. Oil Chem. Soc. 1999, 76, 1511–1513. [Google Scholar] [CrossRef]
- Wander, P.R.; Altafini, C.R.; Colombo, A.L.; Perera, S.C. Durability studies of mono-cylinder compression ignition engines operating with diesel, soy and castor oil methyl esters. Energy 2011, 36, 3917–3923. [Google Scholar] [CrossRef]
- Agarwal, A.K.; Das, L.M. Biodiesel development and characterization for use as a fuel in compression ignition engines. J. Eng. Gas Turbines Power 2001, 123, 440–447. [Google Scholar] [CrossRef]
- Sirman, M.B.; Owens, E.C.; Whitney, K.A. Emissions comparison of alternative fuels in an advanced automotive diesel engine. SAE Tech. Pap. 2000, 109, 2166–2176. [Google Scholar] [CrossRef]
- Khan, I.A.; Singh, S.K.; Yadav, A.K.; Ghosh, U.; Sharma, D. Enhancement in the performance of a diesel engine fuelled with Pongamia methyl ester and n-butanol as oxygenated additive. Int. J. Ambient Energy 2019, 40, 842–846. [Google Scholar] [CrossRef]
- Elumalai, P.V.; Annamalai, K.; Dhinesh, B. Effects of thermal barrier coating on the performance, combustion and emission of DI diesel engine powered by biofuel oil–water emulsion. J. Therm. Anal. Calorim. 2019, 137, 593–605. [Google Scholar] [CrossRef]
- Palani, Y.; Devarajan, C.; Manickam, D.; Thanikodi, S. Performance and emission characteristics of biodiesel-blend in diesel engine: A review. Environ. Eng. Res. 2022, 27, 200338. [Google Scholar] [CrossRef]
- Jiaqiang, E.; Pham, M.; Zhao, D.; Deng, Y.; Le, D.; Zuo, W.; Zhu, H.; Liu, T.; Peng, Q.; Zhang, Z. Effect of different technologies on combustion and emissions of the diesel engine fueled with biodiesel: A review. Renew. Sustain. Energy Rev. 2017, 80, 620–647. [Google Scholar] [CrossRef]
- Yao, M.; Wang, H.; Zheng, Z.; Yue, Y. Experimental study of n-butanol additive and multi-injection on HD diesel engine performance and emissions. Fuel 2010, 89, 2191–2201. [Google Scholar] [CrossRef]
- Rakopoulos, C.D.; Dimaratos, A.M.; Giakoumis, E.G.; Rakopoulos, D.C. Study of turbocharged diesel engine operation, pollutant emissions and combustion noise radiation during starting with bio-diesel or n-butanol diesel fuel blends. Appl. Energy 2011, 88, 3905–3916. [Google Scholar] [CrossRef]
- Zhang, Z.; Tian, J.; Xie, G.; Li, J.; Xu, W.; Jiang, F.; Huang, Y.; Tan, D. Investigation on the combustion and emission characteristics of diesel engine fueled with diesel/methanol/n-butanol blends. Fuel 2022, 314, 123088. [Google Scholar] [CrossRef]
- Zhang, Z.; Tian, J.; Li, J.; Lv, J.; Wang, S.; Zhong, Y.; Dong, R.; Gao, S.; Cao, C.; Tan, D. Investigation on combustion, performance and emission characteristics of a diesel engine fueled with diesel/alcohol/n-butanol blended fuels. Fuel 2022, 320, 123975. [Google Scholar] [CrossRef]
- Huang, Z.H.; Lu, H.B.; Jiang, D.M.; Zeng, K.; Liu, B.; Zhang, J.Q.; Wang, X.B. Performance and emissions of a DI diesel engine operating on diesel/methanol blends. Neiranji Xuebao/Trans. CSICE (Chin. Soc. Intern. Combust. Engines) 2004, 22, 7–16. [Google Scholar]
- Yu, S.; Cao, C.; Lv, W. Combustion and emission characteristics investigation of a marine diesel engine powered by diesel/biodiesel/n-butanol blends. Energy Sci. Eng. 2022, 10, 3317–3330. [Google Scholar] [CrossRef]
- Nalla, B.T.; Devarajan, Y.; Subbiah, G.; Sharma, D.K.; Krishnamurthy, V.; Mishra, R. Investigations of combustion, performance, and emission characteristics in a diesel engine fueled with Prunus domestica methyl ester and n-butanol blends. Environ. Prog. Sustain. Energy 2022, 41, e13811. [Google Scholar] [CrossRef]
- Asokan, M.A.; Prabu, S.S. Effect of n-butanol on cotton seed oil biodiesel: An approach for improving the emission behavior of DI diesel engine. Pet. Sci. Technol. 2022, 41, 1162–1180. [Google Scholar] [CrossRef]
- Zhang, Z.; Jiaqiang, E.; Chen, J.; Zhu, H.; Zhao, X.; Han, D.; Zuo, W.; Peng, Q.; Gong, J.; Yin, Z. Effects of low-level water addition on spray, combustion and emission characteristics of a medium speed diesel engine fueled with biodiesel fuel. Fuel 2019, 239, 245–262. [Google Scholar] [CrossRef]
- Madihi, R.; Pourfallah, M.; Gholinia, M.; Armin, M.; Ghadi, A.Z. Thermofluids analysis of combustion, emissions, and energy in a biodiesel (C11H22O2)/natural gas heavy-duty engine with RCCI mode (Part I: Single/two-stage injection). Int. J. Thermofluids 2022, 16, 100227. [Google Scholar] [CrossRef]
- Kim, J.S.; Lee, W.J.; Pham, V.C.; Choi, J.H. A Numerical Study on Fuel Injection Optimization for a ME-GI Dual-Fuel Marine Engine Based on CFD Analysis. Appl. Sci. 2022, 12, 3614. [Google Scholar] [CrossRef]
- Madihi, R.; Pourfallah, M.; Gholinia, M.; Armin, M.; Ghadi, A.Z. Thermofluids analysis of combustion, emissions, and energy in a biodiesel (C11H22O2)/natural gas heavy-duty engine with RCCI mode (Part II: Fuel injection time/Fuel injection rate). Int. J. Thermofluids 2022, 16, 100200. [Google Scholar] [CrossRef]
- Ji, H.; Wang, Y.; Wang, T.; Yang, K.; Xing, Z. The Influence of a Key Indicator kv on the Diffusion Range of Underwater Oil Spill. Processes 2023, 11, 2332. [Google Scholar] [CrossRef]
- Tan, P.Q.; Zhang, S.C.; Wang, S.Y.; Hu, Z.Y.; Lou, D.M. Simulation on catalytic performance of fresh and aged SCR catalysts for diesel engines. J. Energy Inst. 2020, 93, 2280–2292. [Google Scholar] [CrossRef]
- Han, Z.; Reitz, R.D. Turbulence Modeling of Internal Combustion Engines Using RNG k-ɛ Models. Combust. Sci. Technol. 1995, 106, 267–295. [Google Scholar] [CrossRef]
- Reitz, R.D.; Diwakar, R. Structure of high-pressure fuel sprays. SAE Tech. Pap. 1987, 96, 492–509. [Google Scholar] [CrossRef]
- Heywood, J.B. Internal Combustion Engine Fundamentals; McGraw-Hill Education: New York, NY, USA, 2018. [Google Scholar]
- Hiroyasu, H.; Kadota, T. Models for combustion and formation of nitric oxide and soot in direct injection diesel engines. SAE Trans. 1976, 85, 513–526. [Google Scholar]
- Nagle, J.; Strickland-Constable, R. Oxidation of Carbon between 1000–2000° C. Proe. In Proceedings of the Fifth Conference on Carbon, University Park, PA, USA, 19–23 June 1961; p. 154. [Google Scholar]
- Lapuerta, M.; García-Contreras, R.; Campos-Fernández, J.; Dorado, M.P. Stability, lubricity, viscosity, and cold-flow properties of alcohol-diesel blends. Energy Fuels 2010, 24, 4497–4502. [Google Scholar] [CrossRef]
- Wang, Y.; Liu, Y. Calculation of critical property parameters of biodiesel system by group contribution method. Guangzhou Chem. Ind. 2014, 42, 40–42. [Google Scholar]
- Zhu, S.; Dai, X.; Wang, Q. Analysis of physical characteristics of biodiesel based on multi-parameters. China Water Transp. 2014, 14, 327–330. [Google Scholar]
- Mohammed Sapardi, M.A. Comparative Study on Combustion and Emission Characteristics on Jatropha Oil Biodiesel with Diesel; University of Malaya: Kuala Lumpur, Malaysia, 2021; p. 30597247. [Google Scholar]
- Yuan, W.; Hansen, A.C.; Zhang, Q. Predicting the temperature dependent viscosity of biodiesel fuels. Fuel 2009, 88, 1120–1126. [Google Scholar] [CrossRef]
- Liu, W.; Sivaramakrishnan, R.; Davis, M.J.; Som, S.; Longman, D.E.; Lu, T.F. Development of a reduced biodiesel surrogate model for compression ignition engine modeling. Proc. Combust. Inst. 2013, 34, 401–409. [Google Scholar] [CrossRef]
- Nabi, M.N.; Akhter, M.S.; Shahadat, M.M.Z. Improvement of engine emissions with conventional diesel fuel and diesel-biodiesel blends. Bioresour. Technol. 2006, 97, 372–378. [Google Scholar] [CrossRef]
- Huang, Y.; Li, Y.; Luo, K.; Wang, J. Biodiesel/butanol blends as a pure biofuel excluding fossil fuels: Effects on diesel engine combustion, performance, and emission characteristics. Proc. Inst. Mech. Eng. Part D J. Automob. Eng. 2020, 234, 2988–3000. [Google Scholar] [CrossRef]
- Wei, L.; Cheung, C.S.; Ning, Z. Effects of biodiesel-ethanol and biodiesel-butanol blends on the combustion, performance and emissions of a diesel engine. Energy 2018, 155, 957–970. [Google Scholar] [CrossRef]
- Nanthagopal, K.; Ashok, B.; Saravanan, B.; Patel, D.; Sudarshan, B.; Aaditya Ramasamy, R. An assessment on the effects of 1-pentanol and 1-butanol as additives with Calophyllum Inophyllum biodiesel. Energy Convers. Manag. 2018, 158, 70–80. [Google Scholar] [CrossRef]
- Rajak, U.; Nashine, P.; Verma, T.N. Characteristics of microalgae spirulina biodiesel with the impact of n-butanol addition on a CI engine. Energy 2019, 189, 116311. [Google Scholar] [CrossRef]
- Zhu, L.; Cheung, C.S.; Zhang, W.G.; Huang, Z. Combustion, performance and emission characteristics of a DI diesel engine fueled with ethanol–biodiesel blends. Fuel 2011, 90, 1743–1750. [Google Scholar] [CrossRef]
- Atmanli, A.; Yilmaz, N. An experimental assessment on semi-low temperature combustion using waste oil biodiesel/C3-C5 alcohol blends in a diesel engine. Fuel 2020, 260, 116357. [Google Scholar] [CrossRef]
- Singh, R.; Singh, S.; Kumar, M. Impact of n-butanol as an additive with eucalyptus biodiesel-diesel blends on the performance and emission parameters of the diesel engine. Fuel 2020, 277, 118178. [Google Scholar] [CrossRef]
- Rakopoulos, D.C.; Rakopoulos, C.D.; Hountalas, D.T.; Kakaras, E.C.; Giakoumis, E.G.; Papagiannakis, R.G. Investigation of the performance and emissions of bus engine operating on butanol/diesel fuel blends. Fuel 2010, 89, 2781–2790. [Google Scholar] [CrossRef]
- Singh, D.; Sarma, A.K.; Sandhu, S.S. An experimental investigation of injection timings and injection pressures on a compression ignition engine fueled with hybrid fuel-1 derived from waste cooking oil. Environ. Prog. Sustain. Energy 2021, 40, e13606. [Google Scholar] [CrossRef]
- Tsolakis, A. Effects on particle size distribution from the diesel engine operating on RME-biodiesel with EGR. Energy Fuels 2006, 20, 1418–1424. [Google Scholar] [CrossRef]
- Lyon, R.K.; Cole, J.A.; Kramlich, J.C.; Chen, S.L. The selective reduction of SO3 to SO2 and the oxidation of NO to NO2 by methanol. Combust. Flame 1990, 81, 30–39. [Google Scholar] [CrossRef]
- Rakopoulos, C.D.; Antonopoulos, K.A.; Rakopoulos, D.C. Experimental heat release analysis and emissions of a HSDI diesel engine fueled with ethanol–diesel fuel blends. Energy 2007, 32, 1791–1808. [Google Scholar] [CrossRef]
- Yilmaz, N.; Atmanli, A.; Vigil, F.M. Quaternary blends of diesel, biodiesel, higher alcohols and vegetable oil in a compression ignition engine. Fuel 2018, 212, 462–469. [Google Scholar] [CrossRef]
- Qi, D.H.; Bae, C.; Feng, Y.M.; Jia, C.C.; Bian, Y.Z. Combustion and emission characteristics of a direct injection compression ignition engine using rapeseed oil based micro-emulsions. Fuel 2013, 107, 570–577. [Google Scholar] [CrossRef]
- Rakopoulos, C.D.; Antonopoulos, K.A.; Rakopoulos, D.C.; Hountalas, D.T.; Giakoumis, E.G. Comparative performance and emissions study of a direct injection Diesel engine using blends of Diesel fuel with vegetable oils or bio-diesels of various origins. Energy Convers. Manag. 2006, 47, 3272–3287. [Google Scholar] [CrossRef]
- Atmanli, A. Comparative analyses of diesel–waste oil biodiesel and propanol, n-butanol or 1-pentanol blends in a diesel engine. Fuel 2016, 176, 209–215. [Google Scholar] [CrossRef]
- Yilmaz, N.; Vigil, F.M.; Benalil, K.; Davis, S.M.; Calva, A. Effect of biodiesel–butanol fuel blends on emissions and performance characteristics of a diesel engine. Fuel 2014, 135, 46–50. [Google Scholar] [CrossRef]
- Rakopoulos, C.D.; Rakopoulos, D.C.; Giakoumis, E.G.; Kyritsis, D.C. The combustion of n-butanol/diesel fuel blends and its cyclic variability in a direct injection diesel engine. Proc. Inst. Mech. Eng. Part A J. Power Energy 2011, 225, 289–308. [Google Scholar] [CrossRef]
- Balamurugan, T.; Nalini, R. Experimental investigation on performance, combustion and emission characteristics of four stroke diesel engine using diesel blended with alcohol as fuel. Energy 2014, 78, 356–363. [Google Scholar] [CrossRef]
- Alptekin, E.; Canakci, M. Determination of the density and the viscosities of biodiesel-diesel fuel blends. Renew. Energy 2008, 33, 2623–2630. [Google Scholar] [CrossRef]
- Canakci, M. Combustion characteristics of a turbocharged DI compression ignition engine fueled with petroleum diesel fuels and biodiesel. Bioresour. Technol. 2007, 98, 1167–1175. [Google Scholar] [CrossRef]
- Murillo, S.; Míguez, J.L.; Porteiro, J.; Granada, E.; Morán, J.C. Performance and exhaust emissions in the use of biodiesel in outboard diesel engines. Fuel 2007, 86, 1765–1771. [Google Scholar] [CrossRef]
- Zhong, Y.; Zhang, Y.; Mao, C.; Ukaew, A. Performance, Combustion, and Emission Comparisons of a High-Speed Diesel Engine Fueled with Biodiesel with Different Ethanol Addition Ratios Based on a Combined Kinetic Mechanism. Processes 2022, 10, 1689. [Google Scholar] [CrossRef]


| Performance Parameter | Unit | Measurement |
|---|---|---|
| Engine category | - | Four-cylinder, turbocharged, water cooling |
| Power rating | kW | 220 |
| Cylinder count | - | 4 |
| Diameter and length of the piston stroke | mm | 190 × 210 |
| Revolutions speed | rpm | 2000 |
| Injection orifices | - | 8 |
| Nozzle opening size | mm | 0.26 |
| Conrod | mm | 410 |
| Code Name | Measurement | Content/Measuring Range | Accuracy | Unit | Uncertainty (%) |
|---|---|---|---|---|---|
| PS | Pressure sensor | 0–25 | ±0.01 | MPa | ±0.5 |
| E | Engine speed | 1–2000 | ±0.2% | rpm | ±0.24 |
| EG | Exhaust gas temperature | 0–10,000 | ±1% | °C | ±0.25 |
| BP | Brake power | - | 0.03 | kw | ±0.03 |
| CO | CO emission | 0–10 | ±0.03 | % vol | ±0.32 |
| S | Soot emission | 0–9 | ±0.1 | FSN | ±2.8 |
| N | NOx emission | 0–5000 | ±10 | ppm | ±0.53 |
| HC | HC emission | 0–20,000 | ±10 | ±0.11 | |
| A | Air flow mass | 0–33,300 | ±1% | g/min | ±0.5 |
| F | Fuel flow measurement | 0.5–100 | ±0.04 | L/h | ±0.5 |
| No. | Fuel | Composition |
|---|---|---|
| 1. | D100 | 100% diesel |
| 2. | D70B25BU5 | 70% diesel + 25% biodiesel + 5%N-butanol |
| 3. | D70B20BU10 | 70% diesel + 20% biodiesel + 10% N-butanol |
| 4. | D70B10BU20 | 70% diesel + 10% biodiesel + 20% N-butanol |
| 5. | D70B30 | 70% diesel + 30% biodiesel |
| Combustible | Diesel | Biodiesel [42] | n-Butanol |
|---|---|---|---|
| Boiling temperature (°C) | 210–235 | 240–340 | 118 |
| Density (g/mL, 293.15 K) | 0.835–0.837 | 0.871 | 0.81 |
| Cetane number (CN) | 45–51 | 53 | 25 |
| Viscousness (mm2/s, 293.15 K) | 2.72 | 5.28 | 2.22 |
| LHV (J/g) | 42,500 | 37,500 | 30,630 |
| Air–fuel ratio | 14.3 | 12.5 | 11.21 |
| Heat of evaporation (kJ/kg) | 260 | 300 | 585.6 |
| Oxygen volume fraction (%) | 0.0 | 10.8 | 21.6 |
| Blend Fuel | Density (g/mL, 293.15 K) | Stoichiometric Air Fuel Ratio | Viscosity (mm2/s, at 20 °C) | Oxygen Volume Fraction (%) | Cetane Number (CN) | LHV (J/g) | Heat of Evaporation (kJ/kg) |
|---|---|---|---|---|---|---|---|
| D100 | 0.836 | 14.3 | 2.72 | 0 | 48 | 42,500 | 260 |
| D70B30 | 0.8465 | 13.76 | 3.488 | 3.24 | 49.5 | 41,000 | 272 |
| D70B25Bu5 | 0.84345 | 13.6955 | 3.335 | 3.78 | 48.1 | 40,656.5 | 286 |
| D70B20Bu10 | 0.8404 | 13.631 | 3.182 | 4.32 | 46.7 | 40,313 | 300 |
| D70B10Bu20 | 0.8343 | 13.502 | 2.876 | 5.4 | 43.9 | 39,626 | 329 |
Disclaimer/Publisher’s Note: The statements, opinions and data contained in all publications are solely those of the individual author(s) and contributor(s) and not of MDPI and/or the editor(s). MDPI and/or the editor(s) disclaim responsibility for any injury to people or property resulting from any ideas, methods, instructions or products referred to in the content. |
© 2024 by the authors. Licensee MDPI, Basel, Switzerland. This article is an open access article distributed under the terms and conditions of the Creative Commons Attribution (CC BY) license (https://creativecommons.org/licenses/by/4.0/).
Share and Cite
Mao, C.; Wei, J.; Wu, X.; Ukaew, A. Performance and Exhaust Emissions from Diesel Engines with Different Blending Ratios of Biofuels. Processes 2024, 12, 501. https://doi.org/10.3390/pr12030501
Mao C, Wei J, Wu X, Ukaew A. Performance and Exhaust Emissions from Diesel Engines with Different Blending Ratios of Biofuels. Processes. 2024; 12(3):501. https://doi.org/10.3390/pr12030501
Chicago/Turabian StyleMao, Chengfang, Jiewen Wei, Xuan Wu, and Ananchai Ukaew. 2024. "Performance and Exhaust Emissions from Diesel Engines with Different Blending Ratios of Biofuels" Processes 12, no. 3: 501. https://doi.org/10.3390/pr12030501
APA StyleMao, C., Wei, J., Wu, X., & Ukaew, A. (2024). Performance and Exhaust Emissions from Diesel Engines with Different Blending Ratios of Biofuels. Processes, 12(3), 501. https://doi.org/10.3390/pr12030501